fleet performance metrics - pavement video
TRANSCRIPT

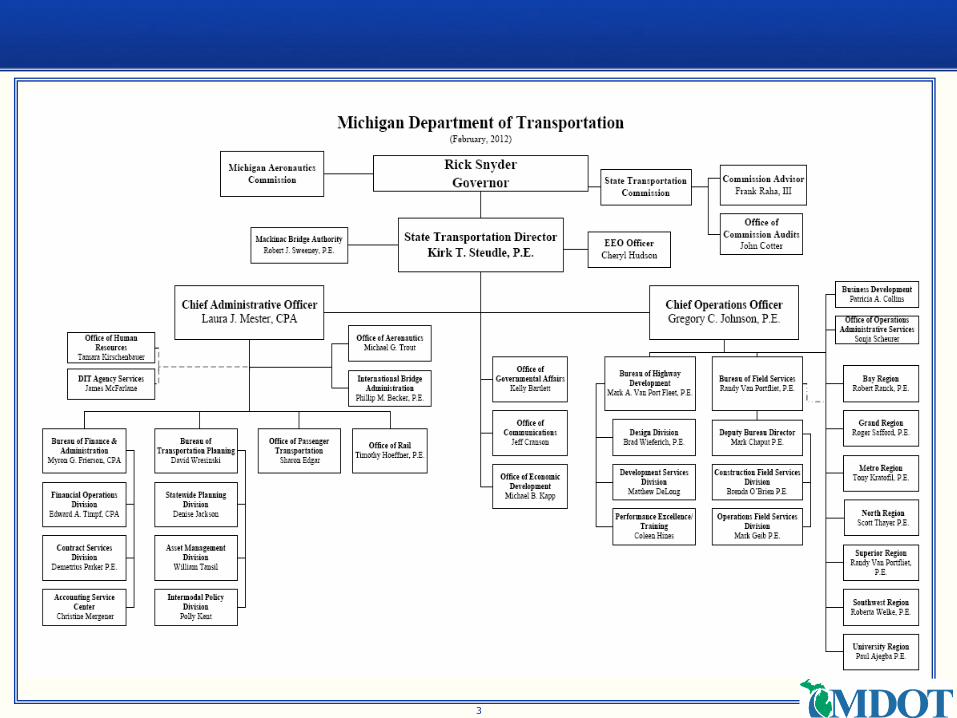
Fleet Performance Metrics
Sonja J. Scheurer, Administrator
D. Scott Ratterree, Manager
Daniel E. Smith, Fleet Specialist
2012 National Equipment Fleet Management Conference

2
Performance Metrics
3

4
FOCUS: National Performance Metrics
Northeast/Midwest Conference – October 2010 o Pittsburgh, Pennsylvania
o Discussed age-old “issues”:
o Not enough funding for fleet/equipment
o Fleet/Equipment not recognized as a priority
o Discussed products/deliverables/accomplishments
MAASTO – July 2011 o Several concurrent sessions on “performance measures”
Northeast/Midwest Conference – August 2011 o Kansas City, Kansas
o Presentation on Fleet Performance Metrics
o Decided on top/first four metrics based on Survey
Northeast – Preventive Maintenance and Retention
Midwest – Utilization and Downtime/Availability
Federal, State, Local Levels
o Performance Metrics/Performance Management

5
Key Messages
□ Every state is using performance metrics, but there are considerable differences among the states
□ Tie performance metrics to department strategic plan and tie to operations
□ Be careful about setting targets/be careful what you measure/tendency is to measure what is easiest
□ Don’t have to be perfect…incremental progress is ok.
□ AASHTO focus on performance management
Created a standing committee on performance management
Advocating a state driven approach based on national goals
□ Yes, national performance metrics mean benchmarking/comparison, but…focus should be on collaboration among the states to improve and share best practices--UNITED WE STAND, DIVIDED WE FALL

6
Lessons Learned, So Far…
□ FACT: Have to be able to document what you are doing, how you are doing it, and why.
□ Don’t necessarily need a fleet management system, but need an effective way to gather, collect, and report on the metrics.
□ Statewide, coordinated, organized approach important
□ Planning and evaluation/re-evaluation cradle to grave
□ Be careful what you measure (it will drive behavior!)
□ Careful evaluation of metric “suggestions”
□ Statewide continual training is imperative
□ Performance Metric reporting and incremental progress has resulted in renewed support/recognition

7
Performance Metrics
8
Performance Metrics
Why Measure Performance? What makes a good metric?
Reporting Metrics Survey Midwest/Northeast Issue Statements Michigan DOT Metrics Questions
Discussion Potential Next Steps

9
Performance Metrics
“Measurement is the first step that leads to control and eventually to improvement. If you can’t measure something, you can’t understand it. If you can’t understand it, you can’t control it. If you can’t
control it, you can’t improve it.”
H. James Harrington
(Former Chairman and President
of the International Academy for
Quality and of the American
Society of Quality Control.)

10
Why Measure Performance?
An opportunity to better manage and operate your fleet
Creates benchmarks to track performance
Brings focus to improvement efforts
Part of strategic approach to fleet management
Enables one to know where they are in relation to where they want to be
Accountability/transparency
An opportunity to tell your story

11
What Makes a Good Metric?
Fits organizational/operational need and aligns with strategic plan Specific in nature with a clear definition Identify measurement need/result
o Leading indicator o Lagging indicator
Source of Data/Customer Input
o Need to balance wants vs. needs o Need to balance b/n “high level” and
“getting into the weeds”

12
Reporting Metrics
Transaction reporting
Ad-hoc reporting
Replacement modeling Trend analysis
Dashboards
Key performance/result indicators
13
Trend Analysis
Ratios of key maintenance data Measure maintenance factors over a set time frame
Graphs with ability to drill down to detail

14
Trend Analysis
DEC JAN FEB MAR APR MAY

15
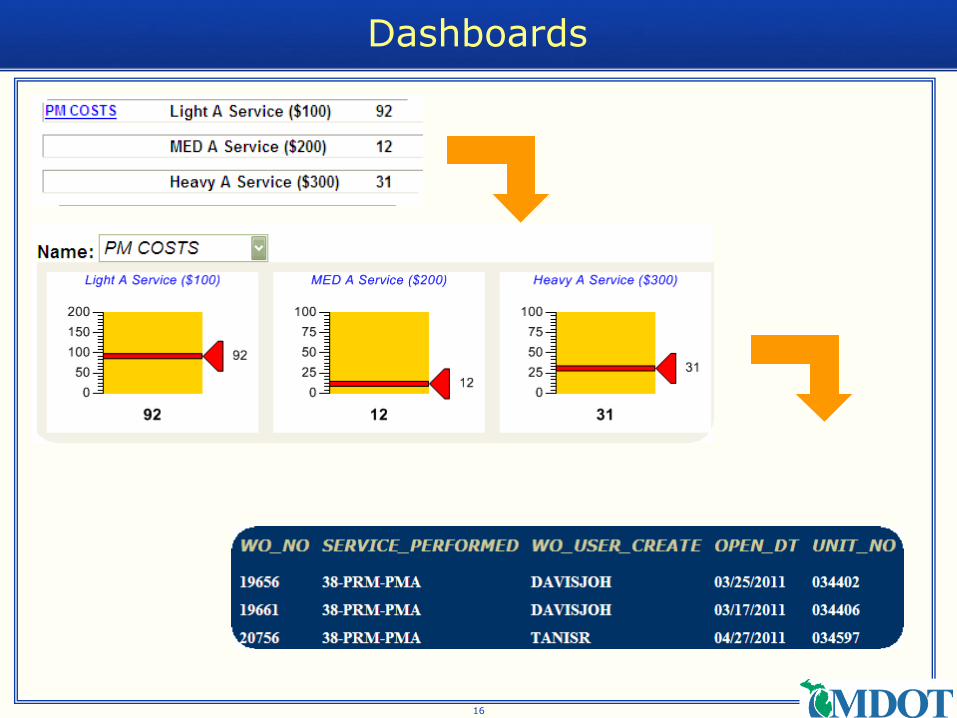
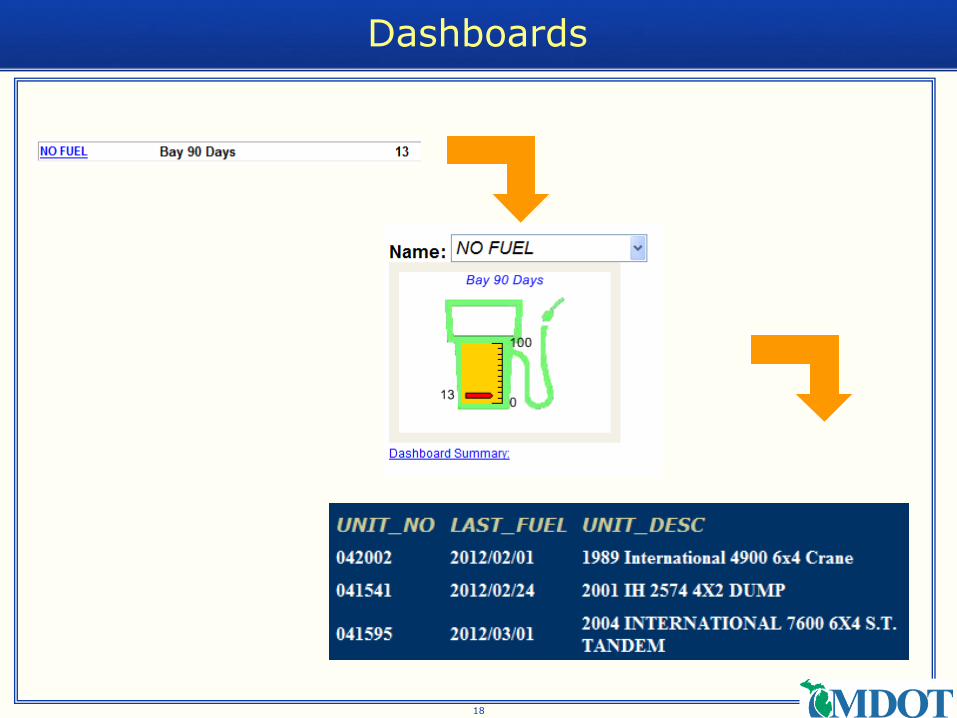
Dashboards
Near real time data Allows for management by exception
Can act when “pre-defined trigger” occurs
Do not replace the need for reports, but can reduce reports
16
Dashboards
17
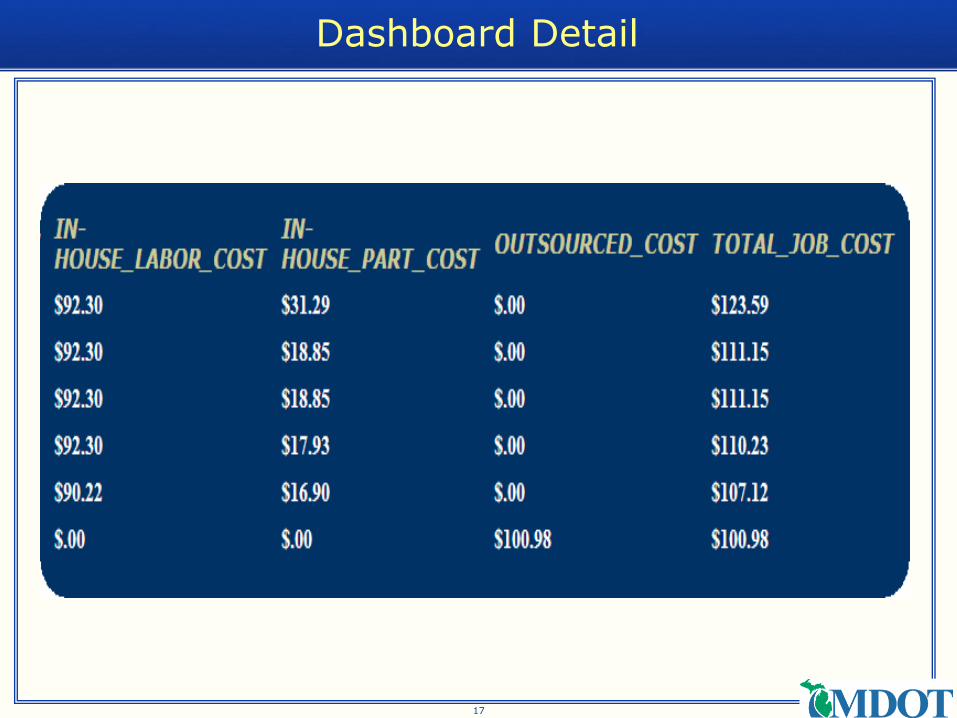
Dashboard Detail
18
Dashboards

19
Dashboards

20
Dashboards

21
Key Performance/Result Indicators
Retention
Utilization
Preventive Maintenance (PM) Compliance
Fleet Availability/Downtime
Work orders open greater than 60 days
No Fuel Usage/Rejected fuel meters
Scheduled vs. Non-scheduled repairs
M5 work order hours vs. DCDS labor hours

22
SURVEY
□ Does your state use performance metrics for vehicles and equipment? 83% of States use metrics
□ If Yes, what would you consider the top 3 fleet metrics? Downtime – 19%
Utilization – 19%
Retention – 15%
PM Compliance – 14%
□ What are the top three fleet metrics for comparison at the national level? Same as above
□ What fleet management system does your state use to capture data for fleet metrics?

23
MIDWEST/NORTHEAST
Midwest/Northeast States developed Briefings/Issue Statements in support of four recommended metrics
Midwest – Utilization and Availability/Downtime o Michigan o Kansas o Minnesota o Indiana
Northeast – Preventive Maintenance and Retention o Pennsylvania o Maine o Delaware

24
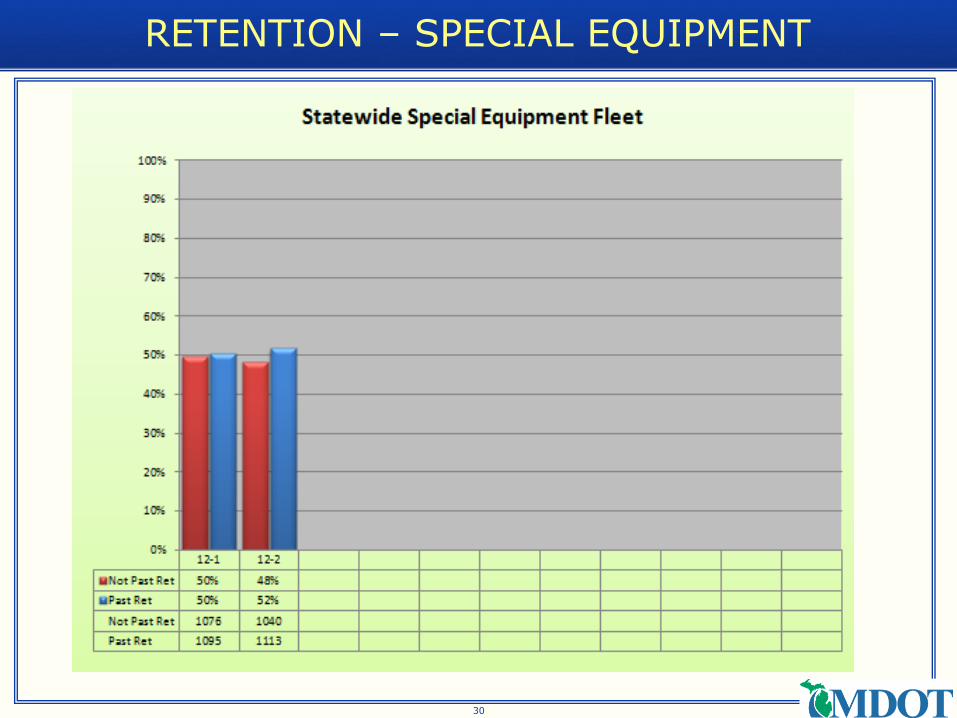
RETENTION
□ Based upon existing department criteria (months)
□ Six Categories
o Light Fleet Vehicles
o Medium Fleet Vehicles
o Heavy Fleet Vehicles
o Winter Maintenance Truck Vehicles (WMTs)
o Special Equipment
o Overall
□ Reported every quarter
□ Pass/Fail Criteria
□ Includes only permanent units

25
RETENTION - STATEWIDE

26
RETENTION – LIGHT

27
RETENTION - MEDIUM

28
RETENTION - HEAVY

29
RETENTION - WMT
30
RETENTION – SPECIAL EQUIPMENT
31
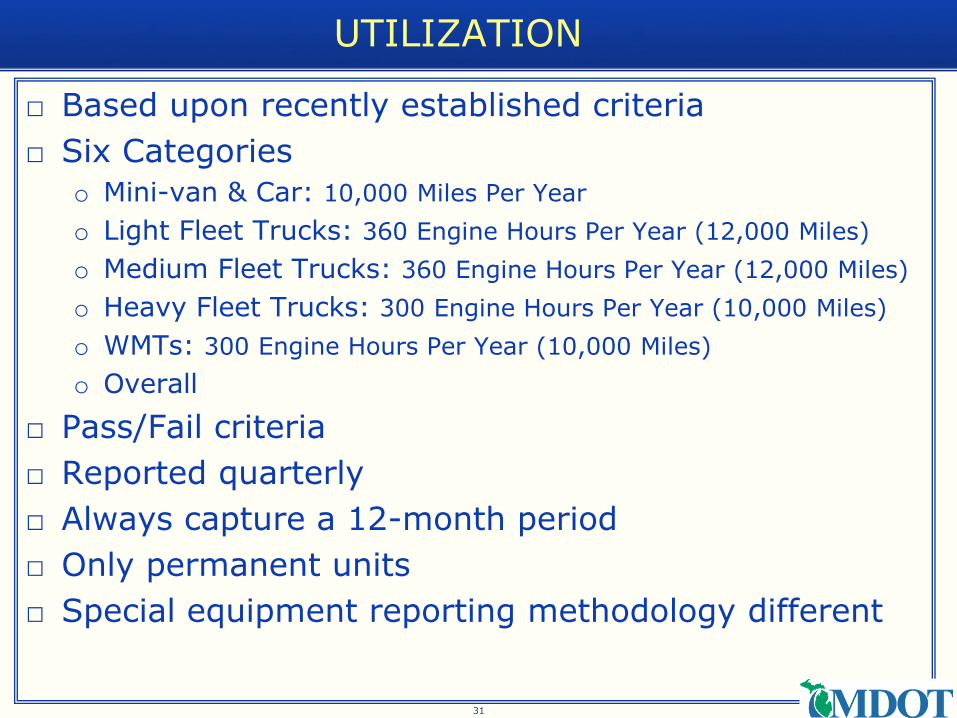
UTILIZATION
□ Based upon recently established criteria
□ Six Categories
o Mini-van & Car: 10,000 Miles Per Year
o Light Fleet Trucks: 360 Engine Hours Per Year (12,000 Miles)
o Medium Fleet Trucks: 360 Engine Hours Per Year (12,000 Miles)
o Heavy Fleet Trucks: 300 Engine Hours Per Year (10,000 Miles)
o WMTs: 300 Engine Hours Per Year (10,000 Miles)
o Overall
□ Pass/Fail criteria
□ Reported quarterly
□ Always capture a 12-month period
□ Only permanent units
□ Special equipment reporting methodology different

32
UTILIZATION - STATEWIDE

33
UTILIZATION – MINI-VAN & CAR

34
UTILIZATION - LIGHT

35
UTILIZATION - MEDIUM

36
UTILIZATION - HEAVY

37
UTILIZATION - WMT

38
UTILIZATION DETAIL

39
UTILIZATION DETAIL

40
Preventive Maintenance (PM) Compliance
Indicates PM compliance for vehicles and equipment by job
o Due = between 90 and 104 percent
o Overdue = past 105 percent • Exceptions: mandated inspections by law
such as a commercial motor vehicle inspection, which are due at 100 percent

41
Preventive Maintenance (PM) Compliance

42
PM COMPLIANCE

43
PM Compliance Detail

44
Fleet Availability/Downtime
Periods of time when a unit is available and able to perform its primary function. In order to compute availability, one must be able to measure downtime. Downtime is measured by the difference between a work order open and close date.
Reported monthly
Six categories o Light Fleet Vehicles o Medium Fleet Vehicles o Heavy Fleet Vehicles o WMTs o Special Equipment o Overall
All units reported
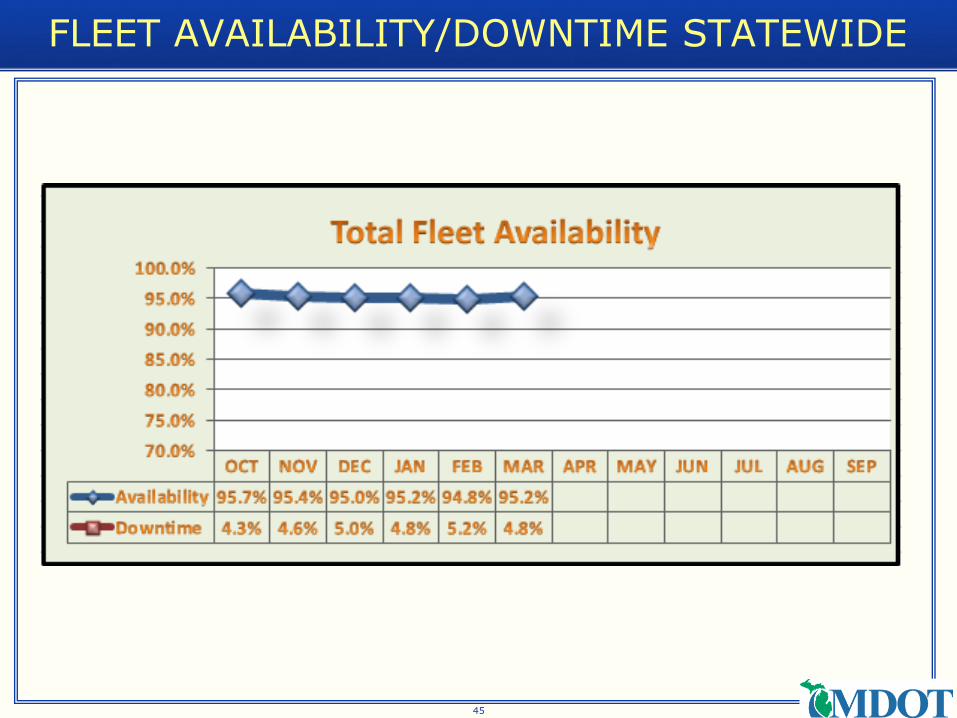
45
FLEET AVAILABILITY/DOWNTIME STATEWIDE

46
FLEET AVAILABILITY/DOWNTIME LIGHT

47
FLEET AVAILABILITY/DOWNTIME MEDIUM

48
FLEET AVAILABILITY/DOWNTIME HEAVY

49
FLEET AVAILABILITY/DOWNTIME WMT
50
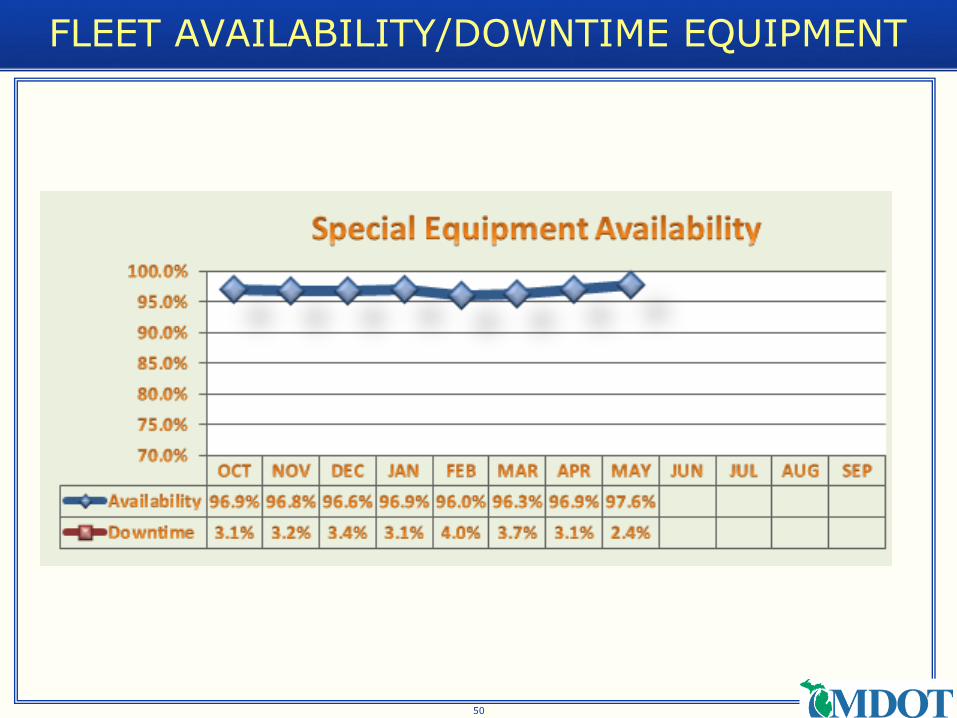
FLEET AVAILABILITY/DOWNTIME EQUIPMENT

51
Performance Metrics
“All successful organizations keep score. Without the ability to do so, it is impossible for organizations to prove the value of their services to their customers – the residents of the communities they serve.”
American Public Works Association
Handbook, September 2002

52
Questions