fleet optimization ……. through process controls &...
TRANSCRIPT

© Copyr i gh t 2014 O SIs o f t , LLC .
Presented by
DTE Energy
Fleet Optimization ……. through Process Controls & Technology
Sumanth K. Makunur

© Copyr i gh t 2014 O SIs o f t , LLC .
Today’s Agenda
• Control & Technology Framework
• Application Examples
• Work in Progress
• Successes
• Questions & Discussion
Distributed Control Systems (DCS) Distributed OSIsoft PI Historians
Large Population of Data
Business IntelligenceReliability
Outage & De-rate
Maintenance & Market
KPI’s
Dashboards
Fleet Optimization
WEB VisualizingPlant Alarm, DCS Real-time WEB Graphics
Easy Access to Information
System Dashboards
Fleet Status Assessment
Engineering ApplicationsPMAX, Digital Fuel Tracking, Fuel Cost Framework
Process Discrete to Data
Expert SystemsPredictive Monitoring, Optimization
PI Asset FrameworkIntegrated applications environment:
Consistent framework for data,
analysis, reporting and consistent
user graphical interface.
Process Controls & Technology

© Copyr i gh t 2014 O SIs o f t , LLC .
Profile of DTE Utility BusinessDTE Electric
DTE Gas
• Ninth largest electric utility in
the U.S. with 2.1 million customers
• Over 11,080 MW of power generation,
primarily coal fired
• 54,000 GWh in electric sales
• ~$8.79 billion in revenue
• Fifth largest natural gas utility in
the U.S. with1.2 million customers
• 170 Bcf of gas sales
• 12% of national gas storage
capacity with 124 Bcf of regulated gas
storage
DTE Gas
Distribution Services
DTE Electric
Distribution Services
Overlapping
Distribution Services Detroit
© Copyr i gh t 2014 O SIs o f t , LLC .
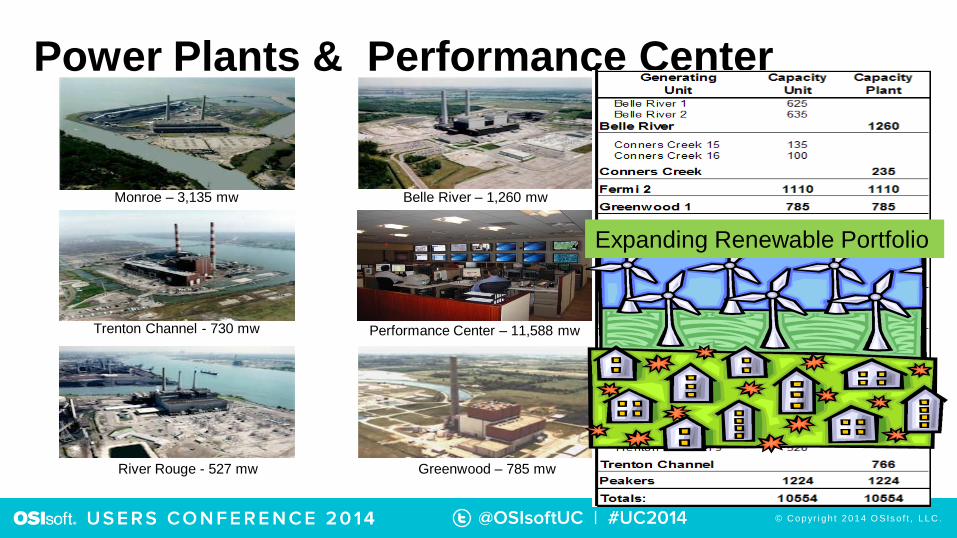
Power Plants & Performance Center
Greenwood – 785 mwRiver Rouge - 527 mw Fermi – 1,100 mw
Monroe – 3,135 mw
Trenton Channel - 730 mw
Belle River – 1,260 mw
St Clair – 1,417 mw
Harbor Beach – 103 mw
Performance Center – 11,588 mw
Expanding Renewable Portfolio

© Copyr i gh t 2014 O SIs o f t , LLC .
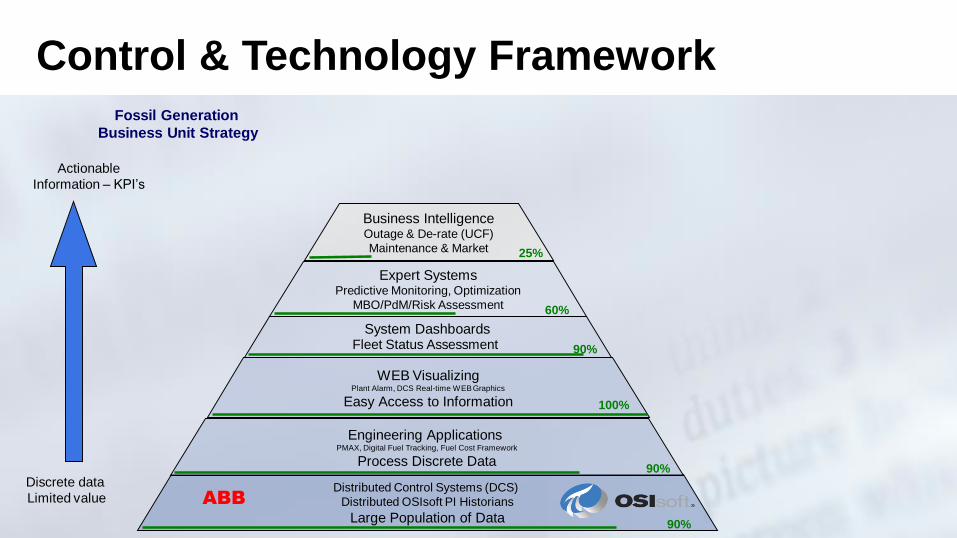
Discrete data
Limited value
Actionable
Information – KPI’s
Distributed Control Systems (DCS)
Distributed OSIsoft PI Historians
Large Population of Data
Post Event Analysis
DCS, PLC & PI
90%
System DashboardsFleet Status Assessment
Fleet Drill downSubject Matter Experts90%
WEB VisualizingPlant Alarm, DCS Real-time WEB Graphics
Easy Access to Information
Standard User InterfaceWEB Visualization
100%
Engineering ApplicationsPMAX, Digital Fuel Tracking, Fuel Cost Framework
Process Discrete Data
Process Discrete Data
Engineering ApplicationsPMAX, DFTS, eNote,
Fuel Cost Framework,
Alarm Management 90%
Expert SystemsPredictive Monitoring, Optimization
MBO/PdM/Risk Assessment
Advanced Analysis & Process OptimizationReliability Academy
Equipment, Process, Performance, Reliability ModelsClosed Loop Process Optimization60%
Business IntelligenceOutage & De-rate (UCF)
Maintenance & Market
Relate all Data Sources
ProcessNet Framework(PI, ProcessGuard, Maximo, SAP, UCF, P3M,
Predictive Monitoring, NeuCo, LIMS, Plant View ..)25%
Fleet
OptimizationProcess Costs
Asset Health,
Market Value
Drives Performance ExcellenceFleet Optimization
Process Costs, Asset Health,
Reliability
Operational Performance, Market Value
20%
% Complete
ABB
Fossil Generation
Business Unit Strategy
PeopleMaking right decisions when it matters!
Control & Technology Framework

© Copyr i gh t 2014 O SIs o f t , LLC .
Performance Center – Mission
Equipment Performance Optimization of the Fossil Generation Portfolio through continuous “real time and predictive asset
condition monitoring” to maximize the asset market value.
Performance Center – Vision
Fossil Generation’s Fleet-wide “Mission Control Center” for
continuous monitoring and optimization of plant equipment
performance
Operating View of Fleet
• Drives consistent practices (UCF)
• Market interface w/MOC
• Proficient users of technology
• SME rotation mutually beneficial
• Reliability tools (SmartSignal & Plant View)
• Input in the budget process
The Performance Center
The Door into the Fleet
Virtual Control Room - 23 Units

© Copyr i gh t 2014 O SIs o f t , LLC .
Control & Technology Framework
Discrete data
Limited value
Actionable
Information – KPI’s
Distributed Control Systems (DCS)
Distributed OSIsoft PI Historians
Large Population of DataABB
Fossil Generation
Business Unit Strategy

© Copyr i gh t 2014 O SIs o f t , LLC .
Control & Technology Infrastructure – Plants
ABB
DCS
DCS Operator Consoles
PI Interfaces
PLC
PLC
PI
PMAX
CEMS
PMAX ProcessNet ProcessGuard
Controllers
Multiple Data Sources
NeuCo
SmartSignal
EPRI Plant View

© Copyr i gh t 2014 O SIs o f t , LLC .
Denotes cloud networking
Control & Technology Infrastructure – Wind Parks
Wind Park
Substation
PIWFMS
Customer
Master
Remote
Data Flow
O&M BuildingMaintenance OEM
Remote
Maintenance
3rd Party Operator
Remote
Maintenance
DTE
Smart Signal
PI
UCFRegulatory
Monitoring
Data Flow
Gratiot
Sigel
Minden
Mckinley
Echo
Pheasant Run II

© Copyr i gh t 2014 O SIs o f t , LLC .
Raw PI Data Analysis
PI Yields Benefits
• Post trip analysis
• Process monitoring
• Optimization
• Early warning
• Alarming
© Copyr i gh t 2014 O SIs o f t , LLC .
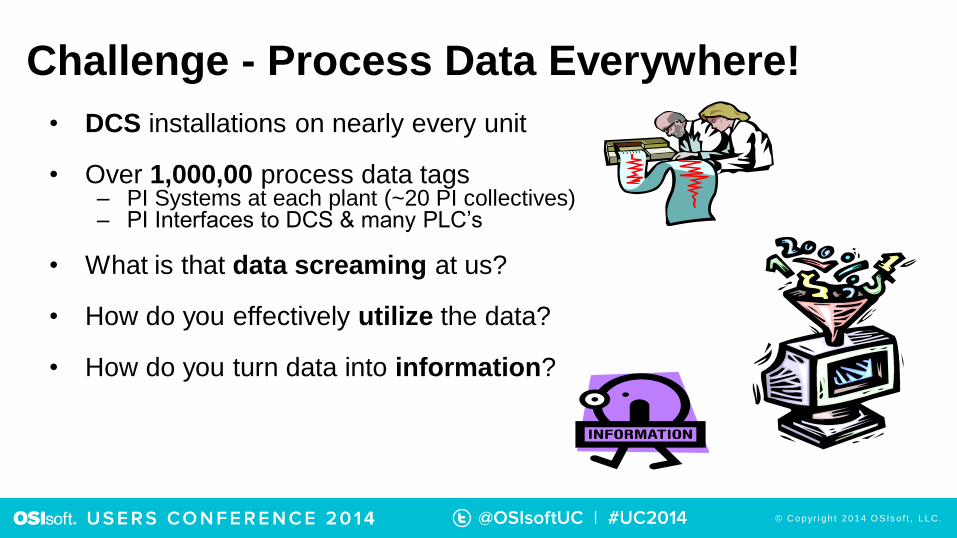
• DCS installations on nearly every unit
• Over 1,000,00 process data tags – PI Systems at each plant (~20 PI collectives)– PI Interfaces to DCS & many PLC’s
• What is that data screaming at us?
• How do you effectively utilize the data?
• How do you turn data into information?
Challenge - Process Data Everywhere!

© Copyr i gh t 2014 O SIs o f t , LLC .
Control & Technology Framework
Discrete data
Limited value
Actionable
Information – KPI’s
Distributed Control Systems (DCS)
Distributed OSIsoft PI Historians
Large Population of Data
Engineering ApplicationsPMAX, Digital Fuel Tracking, Fuel Cost Framework
Process Discrete to Data
90%
90%
ABB
Fossil Generation
Business Unit Strategy

© Copyr i gh t 2014 O SIs o f t , LLC .
Fleet Performance Analysis (PMAX)
Thermal Performance Calculation Engine

© Copyr i gh t 2014 O SIs o f t , LLC .
Digital Fuel Tracking System
On-line
Fuel Analyzer

© Copyr i gh t 2014 O SIs o f t , LLC .
NOx Emissions Strategy
NOx Reduction with Improved
Heatrate
Before
Implementation
After
Implementation
Primary focus is
NOx reduction
only
Focus on
operating near
NOx budget
curve

© Copyr i gh t 2014 O SIs o f t , LLC .
Electronic Operator Rounds
RFID Technology / PI Manual Logger
RFID Tags
Industrial PDA (Symbol MC9060S)
PI Manual Logger
Tablets

© Copyr i gh t 2014 O SIs o f t , LLC .
PI to PI Process Data Conduit
Wind ParksESO – Detroit &
Wind PI
PIPI
Belle River
PI
St Clair
PIGreenwood
PI
Harbor Beach
PI
River Rouge
PI
Trenton Channel
PI
Monroe
PI
PI
EMS
Ann Arbor

© Copyr i gh t 2014 O SIs o f t , LLC .
PI Advanced Metering Infrastructure (AMI)
• Implemented an extensive PI Infrastructure for
AMI data
• MSP Interface to capture
• 8 Server PI Farm
• 1.5 Million Plus meters data
• 27 Million PI tags and growing

© Copyr i gh t 2014 O SIs o f t , LLC .
Before Fuel Cost Framework
EMS
Ranger
PI
PI to PI
Market
Trades
Gas
__________
Oil
__________
Coal
__________
Emissions
Fuel Supply
Fuel
Cost
Gas
Oil
Coal
Emissions
Fax’s
Phone
Manual
Process
To
19
Units
Ops
Plant
PIType, Type, Oops
Manual
Process
Manual
Process
No sys error checking
Calculates
Fuel
Blend
Scenarios
&
Business
Logic
Gen. Ops.
Fuel
Cost
Gas
Oil
Coal
Emissions
Manual
Process
Manual
Process

© Copyr i gh t 2014 O SIs o f t , LLC .
Fuel Cost Framework
Ranger
PIAnn Arbor
5
ps-mon-pi
ps-tch-pi
ps-rrg-pi
ps-blr-pi
ps_hbh_pi
ps-grw-pi
ps-stc-pi
4
Blend Calculations
Blend Calculations
Blend Calculations
Blend Calculations
Blend Calculations
Blend Calculations
Blend Calculations
Default Mode
Auto calculate & update Ranger
Hourly & Daily
Auto update
Market
Data
Gas -- Dawn &
Michcon City Gate
Gas & Oil Price at
Hubs
Oil
ESO PIps-eso-pi
1
Current
&
Historic
Data 2
Fuel Supply
Analysis
and
Acquisition
Current
Fuel
Cost
3
Improvements…• 30 to 3 people• Timely data entry• Zero errors

© Copyr i gh t 2014 O SIs o f t , LLC .
PI to PI (AGC)
AGC – Automatic Generation Control7 largest Fossil units & Peaking Units are ramped through PI Set Point control

© Copyr i gh t 2014 O SIs o f t , LLC .
Control & Technology Framework
Discrete data
Limited value
Actionable
Information – KPI’s
Distributed Control Systems (DCS)
Distributed OSIsoft PI Historians
Large Population of Data
Engineering ApplicationsPMAX, Digital Fuel Tracking, Fuel Cost Framework
Process Discrete to Data
90%
90%
Drive Performance Excellence
Fleet Optimization
Drive
Performance
Excellence
WEB VisualizingPlant Alarm, DCS Real-time WEB Graphics
Easy Access to Information 100%
ABB
Fleet Perspective• Methods
• Applications
Involves• Operation
• Performance
• MISO Market
• Reliability
• Maintenance
• Reporting
• Budget
Fossil Generation
Business Unit Strategy
© Copyr i gh t 2014 O SIs o f t , LLC .
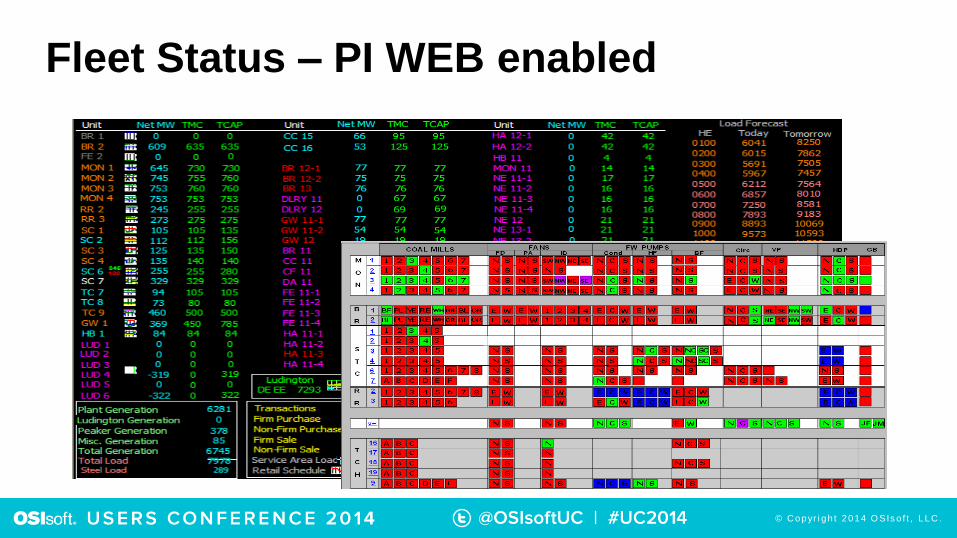
Fleet Status – PI WEB enabled

© Copyr i gh t 2014 O SIs o f t , LLC .
Real-Time DCS Operator Displays
6000 real time dynamic actively linked WEB DCS graphics
Click & Trend

© Copyr i gh t 2014 O SIs o f t , LLC .
PI enabled - Event Re-play
Re-play events using historical PI data

© Copyr i gh t 2014 O SIs o f t , LLC .
PI Coresight Displays

© Copyr i gh t 2014 O SIs o f t , LLC .
Real-Time Wind Turbine Display
© Copyr i gh t 2014 O SIs o f t , LLC .
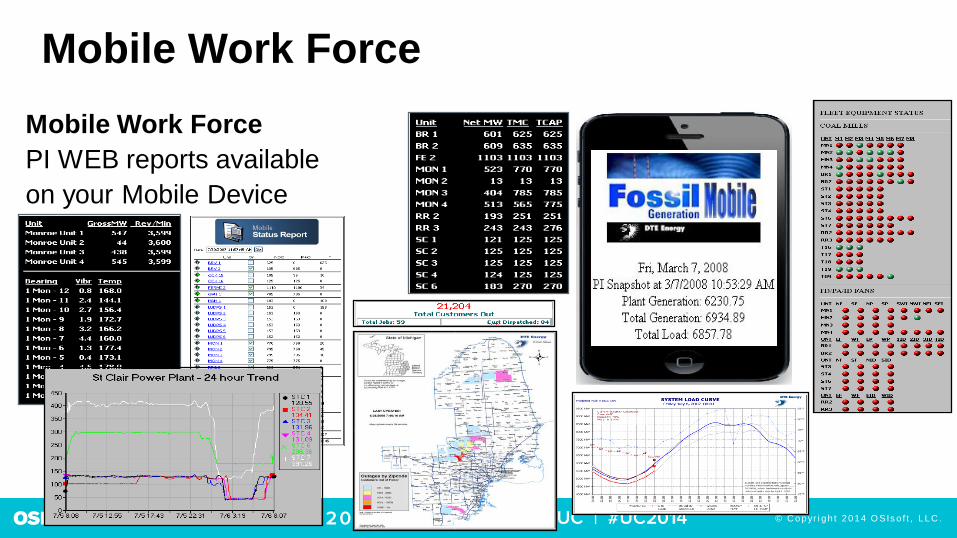
Mobile Work Force
Mobile Work Force
PI WEB reports available
on your Mobile Device

© Copyr i gh t 2014 O SIs o f t , LLC .
Control & Technology Framework
Discrete data
Limited value
Actionable
Information – KPI’s
Distributed Control Systems (DCS)
Distributed OSIsoft PI Historians
Large Population of Data 90%
System DashboardsFleet Status Assessment 90%
WEB VisualizingPlant Alarm, DCS Real-time WEB Graphics
Easy Access to Information 100%
Engineering ApplicationsPMAX, Digital Fuel Tracking, Fuel Cost Framework
Process Discrete Data90%
ABB
Fossil Generation
Business Unit Strategy

© Copyr i gh t 2014 O SIs o f t , LLC .
System Dashboards – PI Enabled
2000 real time dynamic actively linked WEB System graphics
Click & Drill

© Copyr i gh t 2014 O SIs o f t , LLC .
Control & Technology Framework
Discrete data
Limited value
Actionable
Information – KPI’s
Distributed Control Systems (DCS)
Distributed OSIsoft PI Historians
Large Population of Data 90%
System DashboardsFleet Status Assessment 90%
WEB VisualizingPlant Alarm, DCS Real-time WEB Graphics
Easy Access to Information 100%
Engineering ApplicationsPMAX, Digital Fuel Tracking, Fuel Cost Framework
Process Discrete Data90%
Expert SystemsPredictive Monitoring, Optimization
MBO/PdM/Risk Assessment 60%
ABB
Fossil Generation
Business Unit Strategy

© Copyr i gh t 2014 O SIs o f t , LLC .
Similarity Based Modeling
Equipment Condition Monitoring
SmartSignal
Objective – Coal pile to stack Optimization
– Closed loop Neural Net Optimization
– In Service St Clair Unit 7 (Neural Mode November 2007)
– Installation in progress on Belle River 2 (2008)
– Planned for Monroe Units 1-4 (High PRB Utilization
Project)
PI Dependent Expert Systems
Combustion Optimization – NeuCo
Advanced Pattern Recognition
© Copyr i gh t 2014 O SIs o f t , LLC .
Control & Technology Framework
Discrete data
Limited value
Actionable
Information – KPI’s
Distributed Control Systems (DCS)
Distributed OSIsoft PI Historians
Large Population of Data90%
System DashboardsFleet Status Assessment 90%
WEB VisualizingPlant Alarm, DCS Real-time WEB Graphics
Easy Access to Information 100%
Engineering ApplicationsPMAX, Digital Fuel Tracking, Fuel Cost Framework
Process Discrete Data90%
Expert SystemsPredictive Monitoring, Optimization
MBO/PdM/Risk Assessment 60%
Business IntelligenceOutage & De-rate (UCF)
Maintenance & Market 25%
ABB
Fossil Generation
Business Unit Strategy

© Copyr i gh t 2014 O SIs o f t , LLC .
RealTime
MarketStrategy
Day Ahead
Unit Capacity Framework (UCF)
Power Plants Market
Process Flow
Market Feedback
MerchantCenter
PerformanceCenter

© Copyr i gh t 2014 O SIs o f t , LLC .
Unit Capacity Framework (UCF)• Manages all Unit Capacity and De-rates - Interfaces to MISO, P3M & EMS• Automatically Generated Status Report• Dynamically linked with Outage and de-rate process

© Copyr i gh t 2014 O SIs o f t , LLC .
Enterprise Business Systems (EBS)
Maximo & SAP
• SAP
– Financial Information
– Human Resources
– Supply Chain
• Maximo
– Work Management System

© Copyr i gh t 2014 O SIs o f t , LLC .
Control & Technology Framework
Discrete data
Limited value
Actionable
Information – KPI’s
Distributed Control Systems (DCS)
Distributed OSIsoft PI Historians
Large Population of Data 90%
System DashboardsFleet Status Assessment 90%
WEB VisualizingPlant Alarm, DCS Real-time WEB Graphics
Easy Access to Information 100%
Engineering ApplicationsPMAX, Digital Fuel Tracking, Fuel Cost Framework
Process Discrete Data90%
Expert SystemsPredictive Monitoring, Optimization
MBO/PdM/Risk Assessment 60%
Business IntelligenceOutage & De-rate (UCF)
Maintenance & Market 25%
Fleet
OptimizationProcess Costs
Asset Health,
Market Value 15%
ABB
Fossil Generation
Business Unit StrategyPeople
Making right decisions when it matters!

© Copyr i gh t 2014 O SIs o f t , LLC .
No Shortage of Information!
Work Management
SAP
De-rate
Management
PI Data Historian
Fuel Cost
Ancillary Services
MISO
Real Time
MISO
Day Ahead
Emissions
Monitoring
Combustion
Optimization
Emissions
Monitoring
Laboratory
Information
Performance
Analysis
Alarms
Outage
Planning
Unit Capacity
Project
Management
Document
Management
EPRI
Plant View
Operator
Logs
PI Asset Framework

© Copyr i gh t 2014 O SIs o f t , LLC .
Common Methodology
PI Asset Framework:
Integrated applications environment:
Consistent framework for data,
analysis, reporting and consistent
user graphical interface.
Standard GUI
Single Method
PI Data Historian
Emissions
MonitoringCombustion
Optimization
ECG
AccuTrack
Laboratory
InformationPerformance
Analysis
Alarms Operator
Logs
EPRI
Plant View
Process Information
Work Management
SAP
Project
ManagementDocument
Management
Business Systems
De-rate
Management
Fuel Cost
Ancillary
Services
MISO
Real Time
MISO
Day Ahead
Outage
Planning
Unit Capacity
Market Data

© Copyr i gh t 2014 O SIs o f t , LLC .
Common Structure
Process Information Market DataBusiness Systems

© Copyr i gh t 2014 O SIs o f t , LLC .
Fleet Performance
Analysis and OptimizationPulverizer Dashboard
Process Information
More information
is need for Analysis

© Copyr i gh t 2014 O SIs o f t , LLC .
Pulverizer Assessment
What information is needed?
Pulverizer– Milling Costs
– Process Costs
– Production Costs
– EAF
– SmartSignal Watch List
– Work Performed & Work Pending
– Alarms

© Copyr i gh t 2014 O SIs o f t , LLC .
Pulverizer - Multiple Data Sources
Consistent Reporting• Common Methodology• Common Structure
PI
Alarms
P3MSAP
SmartSignal
Maximo
Documentum
EPRI PlantView
Unit
Capacity

© Copyr i gh t 2014 O SIs o f t , LLC .
Common Thread
Equipment Hierarchy
Equipment Hierarchy
• Hierarchical System Index (HSI)
• Work Breakdown Structure (WBS)Primary System
Secondary System
Sub SystemEquipment
Sub Equipment

© Copyr i gh t 2014 O SIs o f t , LLC .
Pulverizer - Multiple Data SourcesConsistent Reporting
• Common Methodology
• Common Structure
PI
Alarms
P3MSAP
SmartSignal
Maximo
Documentum
EPRI PlantView
Unit
Capacity

© Copyr i gh t 2014 O SIs o f t , LLC .
Asset Framework
Expanded System Dashboard
PI
DCS
SmartSignal Watch List Alarms
Trends
KPI’s
Health
Health Assessment

© Copyr i gh t 2014 O SIs o f t , LLC .
PI Asset Framework (AF)

© Copyr i gh t 2014 O SIs o f t , LLC .
Plant Summary
Heat Rate
Production Costs
Dispatch Costs
EAF
Process Cost Drill Down
Milling Costs

© Copyr i gh t 2014 O SIs o f t , LLC .
Application Framework
Expanded System Dashboard
PI
DCS
SmartSignal Watch List Alarms
Trends
KPI’s
Health
Health Assessment

© Copyr i gh t 2014 O SIs o f t , LLC .
Logical Display Flow
© Copyr i gh t 2014 O SIs o f t , LLC .
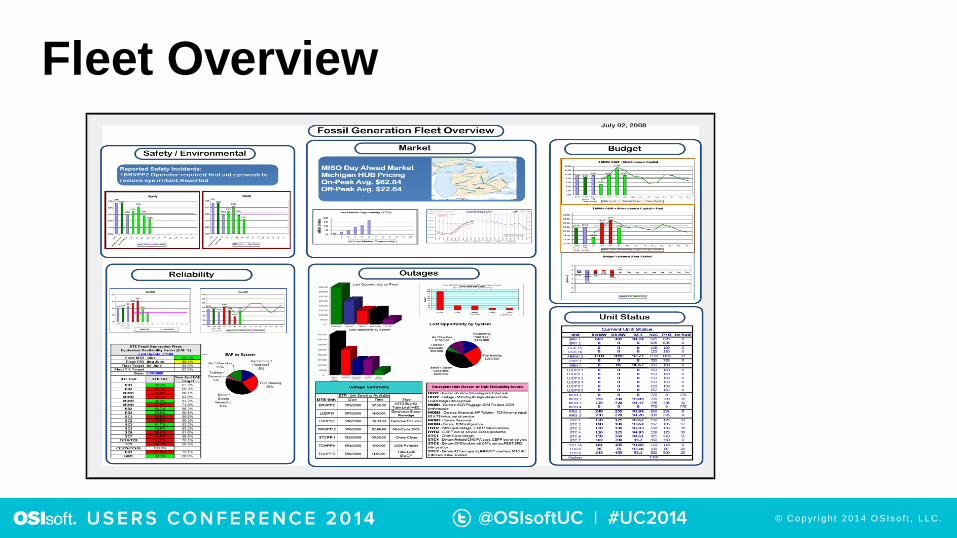
Fleet Overview

© Copyr i gh t 2014 O SIs o f t , LLC .
Plant Overview

© Copyr i gh t 2014 O SIs o f t , LLC .
Unit Overview

© Copyr i gh t 2014 O SIs o f t , LLC .
Coal Mill

© Copyr i gh t 2014 O SIs o f t , LLC .
Total Fleet Management
Real-time
Process Applications
Distributed Control Systems (DCS)
Distributed PI Historians
WEB Portal
SME Status Displays
Applications
Expert Systems
Financials
Work Management
SAP
Maximo
Market
MISO,
Fuel Coat Framework
Unit Capacity Framework
Drives Performance ExcellenceProcess Costs
Asset Health
Operational Performance
Market Value
Fleet Optimization

© Copyr i gh t 2014 O SIs o f t , LLC .
QUESTIONS?
© Copyr i gh t 2014 O SIs o f t , LLC .
Sumanth K. Makunur
• Supervisor
• DTE Energy

© Copyr i gh t 2014 O SIs o f t , LLC .
Brought to you by