flash boiling spray characterization of a gasoline multi
TRANSCRIPT

*Corresponding author
Flash Boiling Spray Characterization of a Gasoline Multi-hole Injector In a Heated Pressure Vessel
Rajat Arora*, Christopher J. Morgan, Jeffrey D. Naber, Seong-Young Lee
Department of Mechanical Engineering – Engineering Mechanics Michigan Technological University
Houghton, MI 49930 USA
Abstract
Spray characterization under normal and flash boiling injection conditions was investigated utilizing a multi-hole injector applicable to the gasoline direct injection (GDI) engines. Tests were performed in an optically accessible heated pressure vessel with visualization of the vaporizing spray development acquired by application of schlieren and laser-based Mie scattering techniques. Four fuels including n-heptane, neat ethanol, neat ethanol blended with 15% iso-octane by volume, and test grade E85 were considered in the study. Experimental conditions included various ambient pressures, fuel temperatures, and fuel injection pressures to achieve conditions with and without flash boiling spray. Time evolved spray tip penetration, spray angle, and the ratio of the vapor to liquid region were analyzed by utilizing digital image processing techniques. At flash boiling conditions it was observed that individual plumes merged together, leading to significant contraction in spray angle as compared to non-flash boiling conditions. The results indicated that at flash boiling conditions, spray formation and expansion of vapor region is controlled by the momentum exchange offered by the ambient gas. Furthermore, a correlation between momentum exchange and liquid spray angle formed was developed.

1
Introduction Direct injection spark ignition (DISI) technology
has shown numerous benefits including reduced fuel consumption, improved transient response, and reduced cold start hydrocarbon emissions but as the conventional fuel resources are depleting, focus is shifting towards alternative fuels such ethanol [1]. Although current engines are not designed for optimized performance of pure ethanol, blends of ethanol are being implemented to take advantage of this technology. Neat ethanol is being considered a prospective fuel which poses favorable characteristics such as high octane number and high heat of vaporization as compared to other fuels [1]. One major concern in operation of gasoline direct injection (GDI) engines is the shortened time available for mixture preparation after injection. This implies that atomization of fuel spray should allow fuel evaporation in time available between injection and ignition. Incomplete vaporization leads to diffusion combustion and can result in increased levels of unburned hydrocarbon emissions [1]. One of the most important requirements for operation of GDI engines is the well atomized spray over all of the operating conditions and a defined spray geometry. A key feature for better atomization is the fuel injection pressure. A higher injection pressure facilitates a higher degree of fuel atomization and fuel vaporization [1]. Atomization is inversely related to the square root of the pressure differential between injection pressure, Pinj and cylinder pressure, Pcyl at time of injection (Pinj-Pcyl). High fuel injection pressure above 200 bar will result in better atomization but, at the same time create an over-penetrating spray so optimization is required [1].
In GDI engines, a metered amount of fuel is injected either in the induction stroke or compression stroke to maximize air-fuel mixing or to promote charge stratification in the vicinity of the spark plug at time of ignition [2]. The fuel injection system should be capable of both late injection for stratified charge combustion at part load and early injection for homogenous charge preparation for operation at high load. For injections taking place in the compression stroke, a compact spray with a reduced penetration rate is desirable in order to achieve a stratified mixture distribution. The spray should also be well atomized since the fuel must vaporize quickly. Both strategies rely on spray development and break-up to ensure appropriate mixing and charge targeting. Hence, knowledge of factors affecting spray characteristics including penetration, spray angle, convergence of plumes, vapor, and liquid portions are essential for advancements of GDI technology [3].
The work presents imaging of spray development and quantification of spray characteristics under flash boiling and non-flash boiling conditions using a multi-
hole injector. Spray development includes spray tip penetration, spray angles, formation of vapor with time, and ratio of vapor to liquid occupied region. Four fuels have been selected in this study including two single component fuels: n-heptane, and ethanol (E100), one binary fuel: E85(iso) (a blend of 85% ethanol and 15% iso-octane by volumetric basis), and multi-component fuel E85(test) (blend of 85% E100 and 15% gasoline). Tests were carried out in a constant volume heated pressure vessel. Schlieren and scattering imaging was performed to quantify the vapor and liquid region in a vaporizing spray.
This work contributes towards a comprehensive database of spray development, expanding our knowledge of flash boiling sprays, the underlying mechanism responsible for spray formation, and the transient phenomenon of formation of vapor from liquid. Modeling of flashing spray is a challenge faced by modelers, so this study also provides experimental data to validate models.
Experimental Setup Tests were performed in Michigan Tech’s optically
accessible constant volume combustion vessel (CV) shown in Figure 1. In these test the vessel was heated and pressurized with nitrogen and there was no combustion. On each of the six faces of the cube are face ports. For this setup three windows are installed with complete orthogonal optical access to the combustion chamber. On each vertices of the chamber there are eight instrument and actuator access ports that contain valves, pressure transducers and other instrumentation. A Kistler 6001 dynamic pressure transducer with a Kistler 5044a charge amplifier is used to measure gas pressure. A high pressure fuel system based on gasoline engine requirements was built in-house and is capable of pressurizing fuel up to 200 bar. The fuel system is a high pressure bladder type accumulator, which on one side is pressurized with nitrogen and with fuel on the other side. In order to control the fuel temperature, an injector window with a cooling jacket was designed and built in-house. The chiller (Iso-Temp 3016D) has a capability to control the
Figure 1. Pressure vessel (left) and cross-sectional view (right).

ILASS Americas, 23rd Annual Conference on Liquid Atomization and Spray Systems, Ventura, CA, May 2011
2
temperature within a range of -22ºC to 35ºC beyond which it works as a heater. In order to determine the fuel temperature, injector temperature mapping was conducted. It is assumed that the fuel temperature is the same as the injector tip temperature during the injection event.
The injector utilized in this study is a commercial Bosch 6-hole GDI injector. Figure 2 shows top and side view of the injector, where symmetry between the spray plumes can be observed. In the side view the fuel injection is seen as it is mounted in the vessel. Because of symmetry among holes, only three plumes can be observed and visualized in imaging presented in this work, as the remaining three plumes are overlapped. All the tests in this study were conducted with the injector mounted horizontally. Technical specifications of the multi-hole GDI injector utilized in the study are as follows: designed bend angle of injector = 10°, diameter of all orifices = 205 µm, and length of all orifices = 300 µm.
Imaging Diagnostics Two imaging techniques, schlieren and Mie
scattering, were utilized to visualize the vaporizing spray. An Argon-Ion laser at 514.5 nm with an output power of 1.5 W was used to generate a volumetric laser cone to illuminate the spray envelop such that an expanding laser cone was facing against a propagating spray shown in Figure 3. The Mie scattering signal was collected with a Cooke DiCam Pro ICCD camera, directed at an angle towards the vessel. The camera was used in double shutter mode to provide two images per test, at 3.75 ms and 4.75 ms after start of injection (ASOI) at an exposure of 600 ns. A 60 mm Nikon micro-Nikkor lens was utilized with an f-stop of 11. Furthermore, a flashlamp light source (Cooke SensiFlash, 8 ms discharge duration) was simultaneously activated in order to increase the signal-to-noise (S/N) ratio of the Mie scattering images as shown in Figure 3. In addition, a plane mirror was placed facing towards the test area, in order to reflect light from flash lamp and illuminate the test area uniformly.
An extended parallel beam schlieren setup, utilizing two schlieren mirrors and a reflector was used to visualize the vapor and liquid portion of the spray development. A 65 W halogen lamp was used as a light source along with a 2 mm x 5 mm slit equivalent to the size of lamp filament which was placed in front of the lamp in order to create an extended light source and to effectively define the source with sharp boundaries [4]. Using two schlieren mirrors (152 mm diameter with f-stop 5) for collimating the light, the collimated beam was then focused onto the second concave mirror in order to converge it onto the focusing lens just before the camera. The knife edge was placed in a horizontal position similar to the source at the point of sharp source image. The final percentage cut off was adjusted based on the optimization between the schlieren sensitivity and intensity level obtained on the camera CCD at an exposure timing of 50 µs. The LaVision ultra Speed Star (USS16) is a 16 bit high speed camera with exposure time limit up to 0.5 µs, time between frames up to 1 µs and resolution of 1280 x 1024 pixels. The camera was used with a manual focus Nikon Nikkor lens of focal length 50 mm and maximum aperture of f#/1.4. The camera captures 16 high speed images. Image analysis was performed on images taken from LaVision camera but in order to confirm liquid region, simultaneous Mie scattering images taken at two instances with respect to LaVision camera timing were also utilized.
Figure 2. Top view of spray plumes (left) and side view of spray with overlapped plumes (right).
Figure 3. Laser diagnostic and optics setup (equipments not to scale).
Injector
LaVision(Schlieren)
DiCam(laser scattering, Mie
Scattering)
Sheet optics
Mirror lens
Reflector
Mirror lens
Light
Shield
Vessel
Coherent Innova 90 Argon Ion Laser
Flash lamp
Knife edge
Reflector

ILASS Americas, 23rd Annual Conference on Liquid Atomization and Spray Systems, Ventura, CA, May 2011
3
Test conditions Based on the p-h curves for the single component
fuels, various test conditions were selected to elicit flash boiling and non-flash boiling conditions. Flash boiling occurs as the subcooled liquid undergoes a constant enthalpy pressure reduction through the nozzle and as the pressure is reduced the liquid enters the vapor dome and undergoes boiling [5]. As shown in Figure 4, two fuel temperature conditions denoted by blue and red lines were included in the test condition. The p-h curve of the E85 (test) and E85 (iso) (85% E100 + 15% iso-Octane) are not shown in Figure 4. Non-flash boiling conditions are those with enthalpy (initial fuel temperature of 80ºC), as shown in Figure 4 with blue lines. Flash boiling conditions are those with high enthalpy (initial fuel temperature of 140ºC), as shown in Figure 4 with red lines. An injection pulse width of 2 ms was used for all test conditions. The complete test conditions are list in Table 1.
Image Post-Processing Imaging post-processing was performed using
MATLAB. Raw schlieren images from the LaVision camera were converted into MATLAB format. In order to attenuate unwanted noise from the images, spray images were subtracted from the background (no spray) obtained from their respective CCDs. To reduce pixel noise without deteriorating edge detection, a 2D median
filter with a spatial mask of 5 x 5, was used. Imax, a new matrix comprised of maximum values from corresponding element of FrameBG and FrameSpray , was created. Imin comprised of minimum values among the images. Next, to obtain an image with minimum noise operation mentioned in Eq. (1) was performed as compared to usual background subtraction method mentioned in Eq. (2) [6].
I = Imax - Imin Eq. (1)
I = FrameBG- FrameSpray Eq. (2) An example is shown in Figure 5. After performing
the operation mentioned in Eq. 1, the image was converted to gray scale with intensity level distributed from 0 to 1 in order to apply thresholding. The MATLAB function ‘Bwlabel’ was utilized to find the largest cluster of 1’s from the binary image formed after thresholding. This operation is also known as blob separation. ‘Sobel’ edge operator was applied to identify the boundary of the spray.
Two-stage thresholding was applied to distinguish the liquid and vapor portion as shown in Figure 6. The dark region in Figure 6 represents the region where liquid drops are present and surrounding region constitutes of vapor. The first thresholding (high intensity) defined the entire spray boundary including the vapor region and the second thresholding defined the liquid region. The second thresholding values for liquid region were determined based on matching the liquid contour obtained from the Mie scattering image. In order to correctly overlap the scattering image on the schlieren image, the scattering image was scaled and translated to the same size as schlieren image so that it
Figure 4. Pressure-Enthalpy (p-h) curve of heptane and ethanol depicting test conditions.
Table 1. Test conditions.
Figure 6. Sample image using two-stage thresholding with vapor and liquid region.
Figure 5. Raw image (far left), image after subtraction of Imax and Imin (left), thresholded image composed of 1’s and 0’s (right) and spray boundary composed of 1’s (far right).
10
100
1000
10000
0 200 400 600 800 1000 1200 1400
Pres
sure
(kPa
)
Enthalpy (kJ/kg)
Heptane
E100
Heptane(Low)
Heptane(High)
E100(High)
E100(Low)
Ambi
entP
ress
ure
Swee
p
Ambi
entP
ress
ure
Swee
pQuality E100
Quality Heptane
Ambient PressureSweep
Injection Pressure Sweep
Fuel Temperature (°C)
ChillerAmbient
Pressure (Bar)Ambient
Temperature (°C)Fuel Injection Pressure (Bar)
80 On 3.4-13.8 180 138140 Off 1-13.8 180 138140 Off 2.7-4.1 180 34.4140 Off 2-4.1 180 138
80 On 1 180 34.4-20780 On 2.75 180 34.4-207
140 Off 2.75 180 68.9-207
Ambient pressure sweep
Injection Pressure Sweep
ILASS Americas, 23rd Annual Conference on Liquid Atomization and Spray Systems, Ventura, CA, May 2011
4
lies exactly on top of the schlieren image. The calculation of vapor to liquid areas is the ratio of vapor occupied pixels to liquid occupied pixels in images and thus the ratio indicates the quality of vaporization process.
Spray angle was calculated by locating four points around spray periphery at 5 mm and 15 mm distance from injector tip as recommended in SAEJ2715 [7]. Results and Discussion
Having analyzed the schlieren images to quantify the spray formation processes, the time-dependent spray penetration, spray angle, and the ratio of vapor area to liquid area occupied in a developing spray are
examined here to characterize the effect of flash boiling. Control parameters included a range of injection pressures, ambient pressures, and fuel temperatures. The spray was inclined slightly upwards because of a 10º offset angle or designed bend angle of the injector nozzle (provided by Bosch).
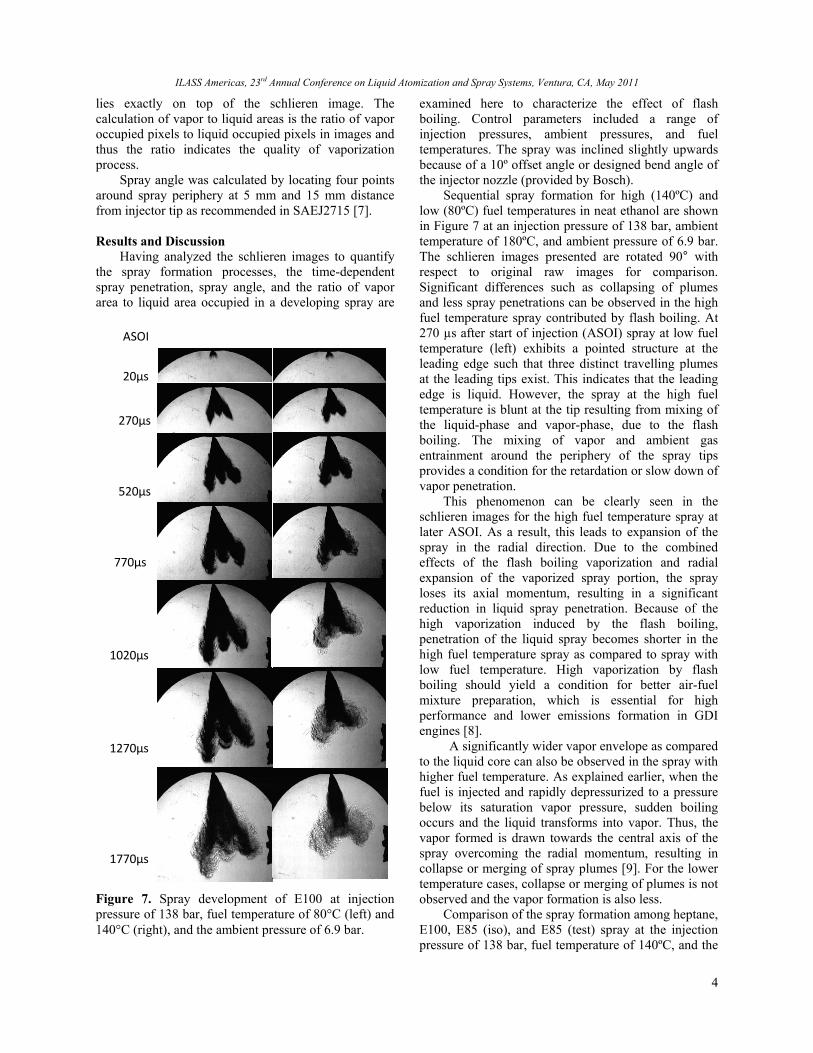
Sequential spray formation for high (140ºC) and low (80ºC) fuel temperatures in neat ethanol are shown in Figure 7 at an injection pressure of 138 bar, ambient temperature of 180ºC, and ambient pressure of 6.9 bar. The schlieren images presented are rotated 90° with respect to original raw images for comparison. Significant differences such as collapsing of plumes and less spray penetrations can be observed in the high fuel temperature spray contributed by flash boiling. At 270 µs after start of injection (ASOI) spray at low fuel temperature (left) exhibits a pointed structure at the leading edge such that three distinct travelling plumes at the leading tips exist. This indicates that the leading edge is liquid. However, the spray at the high fuel temperature is blunt at the tip resulting from mixing of the liquid-phase and vapor-phase, due to the flash boiling. The mixing of vapor and ambient gas entrainment around the periphery of the spray tips provides a condition for the retardation or slow down of vapor penetration.
This phenomenon can be clearly seen in the schlieren images for the high fuel temperature spray at later ASOI. As a result, this leads to expansion of the spray in the radial direction. Due to the combined effects of the flash boiling vaporization and radial expansion of the vaporized spray portion, the spray loses its axial momentum, resulting in a significant reduction in liquid spray penetration. Because of the high vaporization induced by the flash boiling, penetration of the liquid spray becomes shorter in the high fuel temperature spray as compared to spray with low fuel temperature. High vaporization by flash boiling should yield a condition for better air-fuel mixture preparation, which is essential for high performance and lower emissions formation in GDI engines [8].
A significantly wider vapor envelope as compared to the liquid core can also be observed in the spray with higher fuel temperature. As explained earlier, when the fuel is injected and rapidly depressurized to a pressure below its saturation vapor pressure, sudden boiling occurs and the liquid transforms into vapor. Thus, the vapor formed is drawn towards the central axis of the spray overcoming the radial momentum, resulting in collapse or merging of spray plumes [9]. For the lower temperature cases, collapse or merging of plumes is not observed and the vapor formation is also less.
Comparison of the spray formation among heptane, E100, E85 (iso), and E85 (test) spray at the injection pressure of 138 bar, fuel temperature of 140ºC, and the
Figure 7. Spray development of E100 at injection pressure of 138 bar, fuel temperature of 80°C (left) and 140°C (right), and the ambient pressure of 6.9 bar.
20µs
270µs
520µs
770µs
1020µs
1270µs
1770µs
ASOI

ILASS Americas, 23rd Annual Conference on Liquid Atomization and Spray Systems, Ventura, CA, May 2011
5
ambient temperature of 180ºC, is shown in Figure 8 at an ambient pressure of 3.4 bar. No variation in spray formation is seen at 20 µs ASOI when sprays are just emanating from the nozzle. At 270 µs ASOI variation in spray formation can be observed for all the fuels tested. A spray with no collapse among the plumes can be observed in the case of heptanes at 270 µs. This could be attributed to the fact that heptane has the highest boiling point as compared to all other fuels at the ambient pressure of 3.4 bar.
In contrast, collapsed plumes can be observed in E100, E85 (iso) and E85 (test) sprays, and a mushroom shaped spray formation seems to have developed at this time (270 µs). Later at 520 µs ASOI heptane still maintains its three plume structure visibly, whereas substantial evaporation takes place in the case of E100 spray around its periphery. A dense liquid core depicted by a dark black region is seen for both E85 sprays. Evaporation around the head of the mushroom shaped spray for E85 (test) is also visible. Later at 770 µs ASOI outskirt region for E100 which was in the liquid-phase seems to have transformed into vapor. A liquid core formed by merged plumes is also present. Heptane still maintains its shape with no collapsed plumes, but the outskirt region evaporates gradually. Although for the E85’s a dense liquid core with higher momentum as compared to vapor tends to take the lead around 1020
µs ASOI, leaving behind its vapor portion which formed around the periphery of the mushroom-shaped spray. A narrow vapor region seems to form for E85 blended fuel, as the momentum exchange between the ambient gas and spray is not sufficient to expand the vapor in radial direction.
At 1270 and 1770 µs ASOI for heptane case, the liquid penetration length reaches steady state and the vapor region continues to move downstream. For all the ethanol blends, the vapor region seems stationary around the liquid region instead of spreading in the radial direction, which can be attributed to the lower radial momentum exchange. Hence, the vapor travels along with the liquid core as it penetrates.
Figure 9 shows sequential images of spray with the same condition of Figure 8 but at an ambient pressure of 6.9 bar. Significant difference in the spray formation for the ethanol blends is observed at an ambient pressure of 6.9 bar as compared to an ambient pressure of 3.4 bar. Early evaporation in the case of E85 (test) at 270 µs ASOI is observed at the periphery of spray, this could be attributed to the presence of lower boiling point components present in gasoline. Drag forces act on the periphery of the spray due to the high ambient density (ambient pressure 6.9 bar) tend to create a curved structure at the leading edge of plumes. All fuels tend to maintain a defined three plume spray structure initially in comparison to Figure 9, as flash boiling
Figure 9. Spray developments for fuels with the injection pressure of 138 bar, fuel temperature of 140ºC, and the ambient pressure of 6.9 bar.
Figure 8. Spray developments for fuels with the injection pressure of 138 bar, fuel temperature of 140ºC, and the ambient pressure of 3.4 bar.
20µs
270µs
520µs
770µs
1020µs
1270µs
1770µs
ASOI Heptane E100 E85 (iso) E85 (test)
20µs
270µs
520µs
770µs
1020µs
1270µs
1770µs
ASOI Heptane E100 E85 (iso) E85 (test)

ILASS Americas, 23rd Annual Conference on Liquid Atomization and Spray Systems, Ventura, CA, May 2011
6
decreases with the high ambient pressures as shown in the pressure enthalpy curve in Figure 4. It is known that the boiling point for heptane is around 40ºC higher than the fuel temperature maintained at 140ºC. Hence, low flash boiling is expected from the heptane spray.
Spray formation of heptane remain similar to what was observed at an ambient pressure of 3.4 bar with no collapsed spray plumes. Vapor around the periphery of E85 (test) spray was originated earliest as compared to other fuels spray formation. A very similar spray structure is formed by E85 (iso) and E85 (test) until 1020 µs ASOI. For E100, E85 (iso) and E85 (test) collapsed plumes can be observed at 1020 µs ASOI. All the fuels show significant amount of vaporization. This radial expansion of the vapor region of the spray increases as fuels are injected at lower pressure down to the range of 2.7 to 3.4 bar, until the radial momentum exchange is higher. Below approximately 2.7 bar ambient pressure a dense liquid core was found to be formed with a narrow vapor region with the ethanol blends as discussed in the previous paragraphs.
Ambient Pressure Effect Ambient pressure was varied to obtain the effect of
ambient pressure on spray development. Spray penetration by varying the ambient pressure from 3.4 to 13.8 bar, at the injection pressure of 138 bar and fuel temperature of 80°C are shown in Figure 10 for heptane and E85 (test). Spray penetration results for the fuel temperature of 140ºC at an injection pressure of 138 bar, and an ambient temperature of 180ºC are shown in Figure 11.
The penetration measurement indicates that the greater the slope of the penetration curve, the higher the spray velocity, which could be attributed to a greater liquid content in the core of the spray. This also signifies a higher degree of collapse between plumes.
For the heptane spray, until 145 µs ASOI, spray at all the ambient pressure conditions have almost similar slopes to have a penetration difference of approximately 3 mm. However after 145 µs ASOI a
Figure 10. Spray penetration by varying ambient pressure from 3.4 to 13.7 bar at the fuel temperature of 80°C and the injection pressure of 138 bar.
Figure 11. Spray penetration by varying ambient pressure at the fuel temperature of 140°C and injection pressure of 138 bar.
0
10
20
30
40
50
60
70
80
90
0 200 400 600 800 1000 1200 1400 1600
Pene
trat
ion(
mm
)
Time (µs)
3.4 Bar6.9 Bar10.3 Bar13.8 Bar
0
10
20
30
40
50
60
70
80
90
0 200 400 600 800 1000 1200 1400 1600
Pene
trat
ion(
mm
)
Time (µs)
3.4 Bar6.9 Bar10.3 Bar13.8 Bar
E85 (test)
Heptane 0
10
20
30
40
50
60
70
80
90
0 200 400 600 800 1000 1200 1400 1600
Pene
trat
ion(
mm
)
Time (µs)
0.96 Bar3.4 Bar6.9 Bar10.3 Bar13.8 Bar
Heptane
0
10
20
30
40
50
60
70
80
90
0 200 400 600 800 1000 1200 1400 1600
Pene
trat
ion(
mm
)
Time (µs)
3.4 Bar6.9 Bar10.3 Bar13.8 Bar
E100

ILASS Americas, 23rd Annual Conference on Liquid Atomization and Spray Systems, Ventura, CA, May 2011
7
reduction in penetration length can be observed for all of the cases by increasing the ambient pressure while the slope of spray penetration is relatively constant at a fixed ambient pressure as shown in Figure 11. By closely examining spray development images (not shown here) it was observed that before 145 µs ASOI three plumes are in the liquid phase, but, between 145 to 520 µs ASOI vapor forms, which reduces the penetration. At 520 µs ASOI the vapor region starts to significantly expand in the radial direction, because of both the drag experienced from the ambient gas and the momentum exchange between gases. Particularly, such observation is noticeable for ambient pressure conditions of 10.3 bar and 13.8 bar at which penetration curve changes its slope.
For low ambient pressure (around 1 bar) case the spray is supposed to boil and transform into vapor early at the high fuel temperature. But because of the high spray momentum, collapse of plumes, and no radial momentum exchange, the time available for the spray to form vapor phase is less. Hence, the subsequent spray appears to remain in the liquid phase. Significant radial expansion of the vapor region observed at higher ambient pressure is primarily through the momentum exchange by the ambient gas in the radial direction, responsible for retarded penetration of the spray.
Another observation made from the E100 penetration shown in Figure 11 is that the spray penetration retards at 770 µs ASOI and suddenly ramps up with a higher penetration for the 3.4 and 6.9 bar cases. Between 770 µs and 895 µs ASOI all the spray plumes collapsed forming a single plume. This liquid core of collapsed plumes leads its way and leaves behind the vapor portion which originated at the periphery of the outskirt plumes. For higher pressure cases with sprays containing ethanol a similar penetration trend is observed.
More detail tests for low ambient pressure condition were conducted for heptane and E85 (test) fuels. Heptane penetration is shown to be insensitive to the ambient pressure variation from 2.7 to 4.1 bar while penetrations are very distinct in the low ambient pressure range for E85 (test). Although the thermo-physical characteristics are quite different in pure single component and multi-component fuels in terms of spray formation process, while vapor quality of heptane is less sensitive than that of ethanol blend fuel as shown in Figure 4. However, for higher ambient pressure as shown in Figures 11 and 12, ambient pressure impact on penetration is minimal because of the less sensitivity in vapor quality, indicating flash boiling effect.
As noted earlier multi-hole injector tends to quickly lose the original spray shape at high fuel temperatures and low ambient pressures which yield a condition for promoting high flash boiling [9].
At high fuel temperature condition the spray angle increases with an increase in ambient pressure as seen in Figure 13, where spray angle was calculated at 1.5 ms ASOI according to SAEJ2715. For low ambient pressure (around 2-3.4 bar) cases where large penetrations are observed, liquid spray angles for those sprays are in the range of 15-25º. For the cases in which the less penetration is observed, spray angles greater than the “critical angle” of approximately 25° are noticed. Such observation clearly implies that a spray angle greater than the “critical angle” of 25º is essentially hydrodynamic allowance for the momentum exchange in the radial direction, leading to successful expansion of vapor in that direction. Whereas if the angle is less than the critical angle, the developing vapor region becomes narrower and remains stationary along the liquid core of the spray.
A schematic of possible momentum exchange offered by ambient gas, dependent on the critical liquid spray angle is shown in Figure 14. For example, when heptane spray formed a spray angle of 20º, collapsed
Figure 12. Spray penetration by varying ambient pressure at the fuel temperature of 140°C and the injection pressure 138 bar.
0
10
20
30
40
50
60
70
80
90
0 200 400 600 800 1000 1200 1400 1600
Pene
trat
ion(
mm
)
Time (µs)
2 Bar2.7 Bar3.4 Bar4.1 Bar
Heptane
0
10
20
30
40
50
60
70
80
90
100
0 200 400 600 800 1000 1200 1400 1600
Pene
trat
ion(
mm
)
Time (µs)
2 Bar2.7 Bar3.4 Bar4.1 Bar
E85 (test)

ILASS Americas, 23rd Annual Conference on Liquid Atomization and Spray Systems, Ventura, CA, May 2011
8
spray propagates without significant expansion of vapor region in the radial direction, forming a narrow vapor region as shown in Figure 15 (left). Eventually, the liquid spray hits the front window of the vessel as shown in Figure 15 (left). In contrast, when the spray formed a spray angle around 25-30º, the expansion of the vapor region in radial direction is observed with a significant reduction in spray penetration.
A clear dependence of spray penetration to spray angle is observed and shown in Figures 12 and 13 illustrating that an increase in angle tends to decrease the penetration. Spray angle formed at high fuel temperatures is certainly related to the degree of flash boiling. Hence, it can be concluded that penetration rate is inversely proportional to spray angle formed at flash boiling conditions.
Ratio of vapor to liquid occupied regions is shown in Figure 16 for all fuels. The vapor to liquid area ratio tends to decrease with an increase in ambient pressure as expected. Area ratio calculation of developing vapor and liquid spray is another indicator for the flash boiling effect quantitatively. As seen in Figure 4 for a pressure-enthalpy curve, with increase in ambient pressure quality or flash boiling decreases. For the ambient pressure range of 6.9-13.8 bar, maximum vapor formation is observed for fuels with high fuel temperature when injected into an ambient pressure of 6.9 bar. Even at low fuel temperature conditions, test conditions with low ambient pressure show higher vaporization rates as compared to the ones with high ambient pressure.
E85 (test) shows the highest rate of vaporization as compared to heptane and ethanol because of the presence of lower boiling point components in the mixture. These lower boiling point components promote or enhance the rate of vaporization in a spray [10]. Comparing fuels like E85 (iso) and E85 (test) similar vaporization curves are obtained. At 2500 µs ASOI both fuels have approximately 2.5 times the vapor region as compared to liquid region present in spray. All fuels show significant amount of vapor portions at high fuel temperature conditions compared to cold fuel conditions.
Injection Pressure Effect Effect of injection pressure on the spray
penetration is shown in Figure 17 with conditions at fuel injection pressures varying from 34.4 to 207 bar, an ambient temperature of 180ºC, an ambient pressure of 2.8 bar, and a fuel temperature of 140ºC. All fuel penetration images showed collapsed spray plume with dense liquid core and narrow vapor region by examining spray images. E85 (iso) showed a similar trend with E85 (test) such that both fuels have similar penetration slopes and have a linear penetration profile. However, heptane penetration tends to slow down after 145µs ASOI and thus a shorter penetration can be seen
Figure 14. A schematic of possible momentum exchange offered by ambient gas, spray angle in range of 15-25° (left) and spray angle in range of 25° above (right). Solid body indicates the liquid portion and the arrow indicates the surrounding gas.
Figure 13. Spray angle by varying ambient pressure. Test conditions are the fuel temperature of 140°C, and the injection pressure of 138 bar.
Figure 15. Heptane spray images at the ambient pressure of 2 bar (left) and 2.7 bar (right). Test conditions were the fuel temperature of 140°C and injection pressure of 138 bar.
0
5
10
15
20
25
30
35
40
45
3.4 6.8 10.3 13.7
Spra
y An
gle
(Deg
)
Ambient Pressure (Bar)
Heptane E100 E85 (iso) E85(test)
0
5
10
15
20
25
30
35
2 2.7 3.4 4.1
Spra
y Ang
le(D
eg)
Ambient Pressure(Bar)
Heptane E100 E85 (iso) E85(test)

ILASS Americas, 23rd Annual Conference on Liquid Atomization and Spray Systems, Ventura, CA, May 2011
9
for each pressure condition. This slower penetration profile for heptane fuel is attributed to the fact that heptane spray expands in the radial direction forming a
wider vapor zone. Hence, it lost its axial momentum, and resulted in reduced penetration.
Another interesting observation is heptane, E85
Figure 16. Time-dependent ratios of vapor area to liquid area by varying ambient pressure along with the fuel temperature of 80°C (low) and 140°C (high) at the injection pressure of 138 bar.
Figure 17. Spray penetration by varying injection pressure with the fuel temperature of 140°C and the ambient pressure of 2.8 bar.
0.0
0.5
1.0
1.5
2.0
2.5
0 500 1000 1500 2000 2500
Vapr
/liq
uid
area
ratio
Time (µs)
100 psi(hot)
150 psi (hot)
200 psi (hot)
150 psi (cold)
200 psi (cold)
0.0
0.5
1.0
1.5
2.0
2.5
0 500 1000 1500 2000 2500
Vapr
/liq
uid
area
ratio
Time (µs)
100 psi(hot)
150 psi (hot)
200 psi (hot)
150 psi (cold)
200 psi (cold)
0.0
0.5
1.0
1.5
2.0
2.5
0 500 1000 1500 2000 2500
Vapr
/liq
uid
area
ratio
Time (µs)
100 psi(hot)
150 psi (hot)
200 psi (hot)
150 psi (cold)
200 psi (cold)
0.0
0.5
1.0
1.5
2.0
2.5
0 500 1000 1500 2000 2500
Vapr
/liq
uid
area
ratio
Time (µs)
100 psi(hot)
150 psi (hot)
200 psi (hot)
150 psi (cold)
200 psi (cold)
Heptane
E85 (test)E85 (iso)
E1006.8 Bar (high)10.3 Bar (high)13.7 Bar (high)
10.3 Bar (low)13.7 Bar (low)
6.8 Bar (high)10.3 Bar (high)
13.7 Bar (high)10.3 Bar (low)13.7 Bar (low)
6.8 Bar (high)10.3 Bar (high)
13.7 Bar (high)10.3 Bar (low)13.7 Bar (low)
6.8 Bar (high)10.3 Bar (high)13.7 Bar (high)
10.3 Bar (low)13.7 Bar (low)
0
10
20
30
40
50
60
70
80
90
0 200 400 600 800 1000 1200 1400 1600
Pene
trat
ion(
mm
)
Time (µs)
206.8 Bar172.3 Bar137.8 Bar103.4 Bar68.9 Bar34.4 Bar
0
10
20
30
40
50
60
70
80
0 200 400 600 800 1000 1200 1400 1600
Pene
trat
ion(
mm
)
Time (µs)
206.8 Bar172.3 Bar137.8 Bar103.4 Bar68.9 Bar
0
10
20
30
40
50
60
70
80
90
0 200 400 600 800 1000 1200 1400 1600
Pene
trat
ion(
mm
)
Time (µs)
206.8 Bar172.3 Bar137.8 Bar103.4 Bar68.9 Bar
0
10
20
30
40
50
60
70
80
90
0 200 400 600 800 1000 1200 1400 1600
Pene
trat
ion(
mm
)
Time (µs)
206.8 Bar172.3 Bar137.8 Bar103.4 Bar68.9 Bar
Heptane E85 (iso)
E100 E85 (test)

ILASS Americas, 23rd Annual Conference on Liquid Atomization and Spray Systems, Ventura, CA, May 2011
10
(iso), and E85 (test) fuels have not shown any variation in penetration by increasing the injection pressure from 172 to 207 bar. This could be attributed to the formation of cavitation in the nozzle above the certain injection pressure, thereby limiting the flow rate of fuel. Additionally, E100 fuel shows insignificant variation in penetration above the ambient pressure of 138 Bar.
Ratios of vapor to liquid region of a spray at 520 µs ASOI are presented in Figure 18. It is observed that heptane and neat ethanol contain the maximum amount of vapor content as compared to E85’s for all injection pressures tested. Neat ethanol which has the highest latent heat shows significant amount of vapor as compared to other fuels. Heptane and neat ethanol show the same amount of vapor content at high injection pressure as seen in Figure 18. On the other hand E85 (iso) and E85 (test), show significantly lower levels of vaporization as observed at low injection pressures of 69 - 138 bar. This is an unexpected observation since multi component fuels have shown a better flash boiling spray [11]. It is not unexpected to observe vapor portion in a neat ethanol spray, as enthalpy at final state of injection lies inside the two-phase region with a high quality. This argument is applicable for E85 blends too, whereas they show a significantly lower vapor content in spray. Further analysis of the vaporization of multi component fuels such as E85 blends is necessary at later time ASOI.
These results of higher vapor content in E100 and heptane spray seems to be valid, if we look at the spray formation images at 520 µs ASOI in Figure 19. Significant differences in the spray profile of heptane and ethanol as compared to E85 blends can also be observed in these images, which can justify this spray behavior.
Figure 19 explains the reason for higher vapor portion in E100 and heptane spray as compared to other fuels. It has been discussed in the effect of ambient
pressure section how ambient pressure affects spray formation due to radial momentum exchange. Similarly, for this case it is observed that even though plumes of ethanol are completely collapsed, the vapor portion expands in the radial direction whereas this radial expansion of vapor is not observed for blends of E85. As a comparison, similar radial spread of vapor is observed at higher ambient pressures for E85 blends.
One would expect that with a decrease in injection pressure, vapor would decrease as it results in a lower atomization level, similar to the trend as shown by E85 blends in Figure 18. Even at low injection pressures, ethanol spray illustrates higher vapor content. This is not due to some error in calculation or test parameters. As when the total area occupied by the sprays was calculated (adding the vapor and liquid portion of the spray), approximately the same amount of total area was found for all of the fuel at that injection pressure condition corresponding to Figure 18.
At an injection pressure of 172 and 207 bar, all fuels showed a similar occupied area. This again confirms the presence of cavitation in the nozzle, thereby limiting the fuel flow. This result is consistent with the overlapping penetration curves obtained for all fuels at these injection pressures as shown in Figure 17.
Summary
Tests in a constant volume heated pressure vessel were conducted with a symmetric six-hole GDI injector to characterize the effects of flash boiling on spray formation under various conditions including ambient pressures, fuel temperatures, and fuel injection pressures for four different fuels. The studied fuels were n-heptane, neat ethanol (E100), neat ethanol blended with 15% iso-octane by volume (E85 (iso)),
Figure 18. Ratio of vapor to liquid area of the spray with varying injection pressures from 69 to 207 bar at 520 μs ASOI. Conditions of test: fuel temperature of 140°C, ambient pressure of 2.75 bar.
Figure 19. The regions of vapor and liquid occupied in the images. Contour lines indicate regions for vapor and liquid based on the thredshold method. at injection pressure of 207 bar, the fuel temperature of 140°C, and the ambient pressure of 2.75 bar at 520 μs ASOI.
0
0.2
0.4
0.6
0.8
1
1.2
1.4
1.6
1.8
206.8 172.3 137.8 103.4 68.9
Vapo
r/Li
quid
Are
a
Injection Pressure(Bar)
Heptane E100 E85(iso) E85(Test)

ILASS Americas, 23rd Annual Conference on Liquid Atomization and Spray Systems, Ventura, CA, May 2011
11
and test grade E85 (E85 (test)). Simultaneous imaging with schlieren and laser-based Mie scattering were performed to visualize the vaporizing spray. Time-dependent spray tip penetration, spray angle, and the ratio of the vapor to liquid region were analyzed and results are summarized as follows:
Ambient pressure effect
• Significant reduction in spray tip penetration was observed with an increase in ambient gas pressure from 3.4 to 6.9 bar for all fuels at the low fuel temperature (80°C) condition. Atomization, entrainment and momentum exchange increase with increasing ambient density resulting in the lower penetration.
• Increased penetration was observed in the ambient gas pressure range of 2.0 to 3.4 bar at the high fuel temperature condition (140°C). A collapsed spray was formed at these high flash boiling conditions for three of the fuels. However, the spray did not collapse for n-heptane, which is attributed to the high boiling temperature of n-heptane as compared to the other fuels.
• Radial expansion of vapor region was observed due to momentum exchange with the ambient gas with the spray, resulting in reduction of spray penetration. This radial expansion occurred when the spray angle was greater than 25°.
• E85 (test) fuel showed highest vapor to liquid area ratio as a result of low boiling components.
Injection pressure effect
• Spray tip penetration at injection pressures of 172 and above leveled off.
• High vapor to liquid area ratio was observed at 520 µs ASOI for E100 and n-heptane with variation in injection pressure as compared to E85 blends. E100 and heptane formed a wider spray structure with spread of vapor region in radial direction whereas the E85 blends formed a narrow spray structure.
• With increasing injection pressure, vapor to liquid area ratio increases as a result of increased atomization, mixing and vaporization.
Acknowledgements The authors acknowledge the financial support
from the Michigan Tech.–Research Excellence Fund and Michigan Energy Efficiency Grant (MIEEG) programs. Further acknowledgement is given to the National Science Foundation for the funding of MRI grant number 0619585 for the development of this optically accessible combustion vessel laboratory.
Acknowledgement is also given to A&D Technology for their assistance in providing the data acquisition system for the laboratory.
References
1. Zhao, F., Lai, M.-C., and Harrington, D. L. Progress in Energy and Combustion Science 25: 437-562 (1999).
2. Drake, M.C., and Haworth, D.C., Proceeding of the Combustion Institute 31: 99-124 (2007).
3. van Romunde, Z., and Aleiferis, P.G., SAE 2007-01-4032 (2007).
4. Settles, G.S., Schlieren and Shadowgraph Technique: Visualizing Phenomena in Transparent Media, Springer-Verlag, 2001, p. 35.
5. Cengel, Y. A., and Boles, M. A., Thermodynamics - An engineering Approach, McGraw-Hill Science, 7th ed. 2010, p. 668.
6. Qi, Y.L., Xu, B.Y., and Cai, S. L., Measurement Science and Technology 17:3229-3236 (2006).
7. SAEJ2715, Gasoline Fuel Injector Spray Measurement and Characterization, in Surface Vehicle Recommended Practices, (2007).
8. Kawano, D., Senda, J., Wada, Y., and Fujimoto, H., SAE 2003-01-1-38 (2003).
9. Aleiferis, P.G., Serras-Pereira, J., van Romunde, Z., Caine, J., and Wirth, M., Combustion and Flame, 157:735-756 (2010).
10. Wada,Y.N., Yamagushi, A., Magara, N., Senda, J., and Fujimoto, H., SAE 2007-01-0624 (2007).
11. Senda, J., Wada, Y., Kawano, D., and Fujimoto, H., International Journal of Engine Research 9:15-28 (2008).