flame interactions in turbulent premixed twin v-flames
TRANSCRIPT

Flame Interactions in Turbulent Premixed TwinV-flames.
T.D. Dunstan1, N. Swaminathan∗1, K.N.C. Bray1, N.G. Kingsbury1
1 Department of Engineering, Cambridge University, Cambridge, CB2 1PZ, UK.
∗Corresponding author:
Department of Engineering, Cambridge University,
Trumpington Street, Cambridge, CB2 1PZ, UK.
E-mail: [email protected].
Fax:+44(0)1223 765311.
Submitted for publication in Combustion Science and Technology
(Date: original: April 3, 2012, revised: July 12, 2012)
Running Title:Flame Interactions.
1

Abstract
Multiple flame-flame interactions in premixed combustion are investigated using
Direct Numerical Simulations of twin turbulent V-flames fora range of turbulence in-
tensities and length scales. Interactions are identified using a novel Automatic Feature
Extraction (AFE) technique, based on data registration using the Dual-Tree Complex
Wavelet Transform.Information on the time, position and type of interactions,and
their influence on the flame area is extracted using AFE. Characteristic length and
time scales for the interactions are identified.The effect of interactions on the flame
brush is quantified through a global stretch rate, defined as the sum of flamelet stretch
and interaction stretch contributions. The effects of each interaction type are discussed.
It is found that the magnitude of the fluctuations in flamelet and interaction stretch are
comparable, and a qualitative sensitivity to turbulence length scale is found for one
interaction type. Implications for modelling are discussed.
Keywords:Flame Stretch, Wavelets, Dual-Tree Complex Wavelet Transform, Data Registration
2

1 Introduction
Lean premixed combustion offers much potential as a method of reducing emissions
and increasing efficiency in combustion systems, but accurate modelling of turbulent
combustion in this mode remains challenging. The sensitivity of these flames to small
fluctuations in temperature or composition, and their susceptibility to thermo-acoustic
instabilities present difficulties to the modelling and design of lean combustion sys-
tems. The role of flame interactions in turbulent premixed flames, although recognised
as important (Borghi, 1990; Burluka et al., 1997; Kerstein,2002), is not well under-
stood at present.
The loss of flame due to flame interaction is an important design consideration for
lean combustion systems.A number of studies have identified flame-flame interactions
as one of the leading causes of combustion induced noise in laminar (Schuller et al.,
2002; Candel et al., 2004; Talei et al., 2012) and turbulent (Balachandran et al., 2005)
flames. The flame’s sensitivity to the local thermo-chemicalstate can also lead to
thermo-acoustic instabilities due to coupling between thepressure perturbations and
rate of heat release (Balachandran et al., 2005).
In addition, novel low-emission modes of combustion such asMILD (Moderate
or Intense Low-Oxygen Dilution), in which partially premixed reactants and pockets
of exhaust gases are injected into the combustion chamber above the ignition temper-
ature, show indications of flamelet type structures which undergo large numbers of
flame interactions (Minamoto et al., 2011). In all of these situations, flame interaction
phenomena need to be better understood to help model development.
Flame-flame interactions can be broadly categorised as either normal or counter-
normal, where the flame normal is defined as positive in the direction of the fresh
3

gases. Normal interactions occur when flames approach one another in the direction of
propagation of the flame surface, and counter-normal interactions occur where turbu-
lent straining acts to bring flame surfaces together againsttheir propagation direction.
In previous studies (Sohrab et al., 1984) these are commonlyreferred to as upstream
and downstream interactions respectively, however, this terminology is avoided here
to prevent possible confusion with the mean flow field.
For most configurations, normal interactions are more prevalent than counter-normal
interactions due to the kinematics of the flame, but the outcome of both is similar - a
rapid change in flame surface area and therefore the local rate of heat release.Normal
flame interactions in simple one-dimensional geometries have been studied numeri-
cally using detailed chemistry (Echekki et al., 1996; Sun and Law, 1998).Chen et al.
(1999) provide a detailed description of a single turbulence-generated normal flame
interaction and pocket burn-out (where a pocket of fresh gasis consumed) using two-
dimensional DNS with complex methane-air chemistry. Givena suitably defined iso-
surface within the reaction zone, three phases of the normalinteraction process were
identified: firstly, merging of the thermo-diffusive layers leading to the formation of a
critical point where the isosurfaces meet and scalar gradients momentarily go to zero,
resulting in the formation of two cusps and a pocket of fresh gas. Following this critical
point, the highly curved cusps then retract into the fresh gases and the flame elements
return to a flamelet type structure. The last phase, pocket burn-out, follows a similar
pattern to that of the initial merger but with gradually increasing curvature adding to
the final acceleration.According to the study of Chen et al. (1999),the shortest time
scales for the initial interaction process - correspondingto the final stages of merger
and the initial cusp recovery - are of the order of 1% of the characteristic laminar flame
time, and so present a considerable challenge to numerical and experimental investi-
gations.
4

Counter-normal interactions have been investigated experimentally and numeri-
cally for stationary flames in an opposed jet configuration (Sohrab et al., 1984; Lee and
Chung, 1994; Kostiuk et al., 1999), and single events have been observed in unsteady
DNS calculations (Hawkes and Chen, 2004). In general, unsteady counter-normal in-
teractions result from incomplete combustion of the partially burnt gases in the region
between two flame elements brought together by the surrounding turbulent strain field.
This gradual extinction means that counter-normal interactions occur over longer time
scales than normal interactions since they lack the flame acceleration and enhanced
burning associated with the latter.
Central to the problem of studying multiple flame interactions is the ability to reli-
ably extract information on individual interaction eventsfrom an unsteady flame sim-
ulation or experiment. In this paper a methodology is identified, described and applied
to data produced using three-dimensional direct numericalsimulation (DNS). The spe-
cific objectives of this study are:
1. To conduct DNS in a novel twin V-flame configuration, which provides a degree
of control over the frequency of interactions in the centralregion of the flame
brush.
2. To apply a novel post-processing technique based on the Dual-Tree Complex
Wavelet Transform (DT-CWT).
3. To gather improved understanding on the type of flame interactions, their statis-
tics and their contributions to either loss or gain of flame surface area.
The modelling of these effects is not attempted here and will be addressed in future.
5

The single V-flame configuration has been extensively studied, both experimen-
tally (Shepherd, 1996; Anselmo-Filho et al., 2009) and numerically (Bell et al., 2005;
Domingo et al., 2005), and so provides a well understood baseconfiguration that can
be readily extended to study interacting flames, and againstwhich the interacting flame
data may be compared.
In contrast to previous DNS studies on flame interactions, the focus here is on un-
derstanding the combined effect of multiple, transient interactions in three-dimensions,
and on quantifying their role in the production or destruction of flame surface area. It
should be noted that although the flame configuration clearlyplays an important role
in determining the probability of different types of interaction occurring, we presume
that the individual interaction structure and progress is independent of the flame ge-
ometry, and therefore applicable to all flow configurations.
This paper is organised as follows: In Section 2, details of the simulation param-
eters and numerical methods are introduced. In Section 3, the Automatic Feature Ex-
traction (AFE) technique, used to identify and extract information on individual flame
interactions is described. Results are presented in Section 4, beginning with the phys-
ical and temporal distribution of the interactions in relation to the mean flame brush.
In Section 4.5, the relations between flame interactions andchanges in flame surface
area are discussed. The conclusions are summarised in Section 5.
2 DNS Database
A schematic diagram of the twin V-flame configuration is shownin figure 1. All flames
in this study were simulated using the DNS code SENGA2, an enhanced version of
6
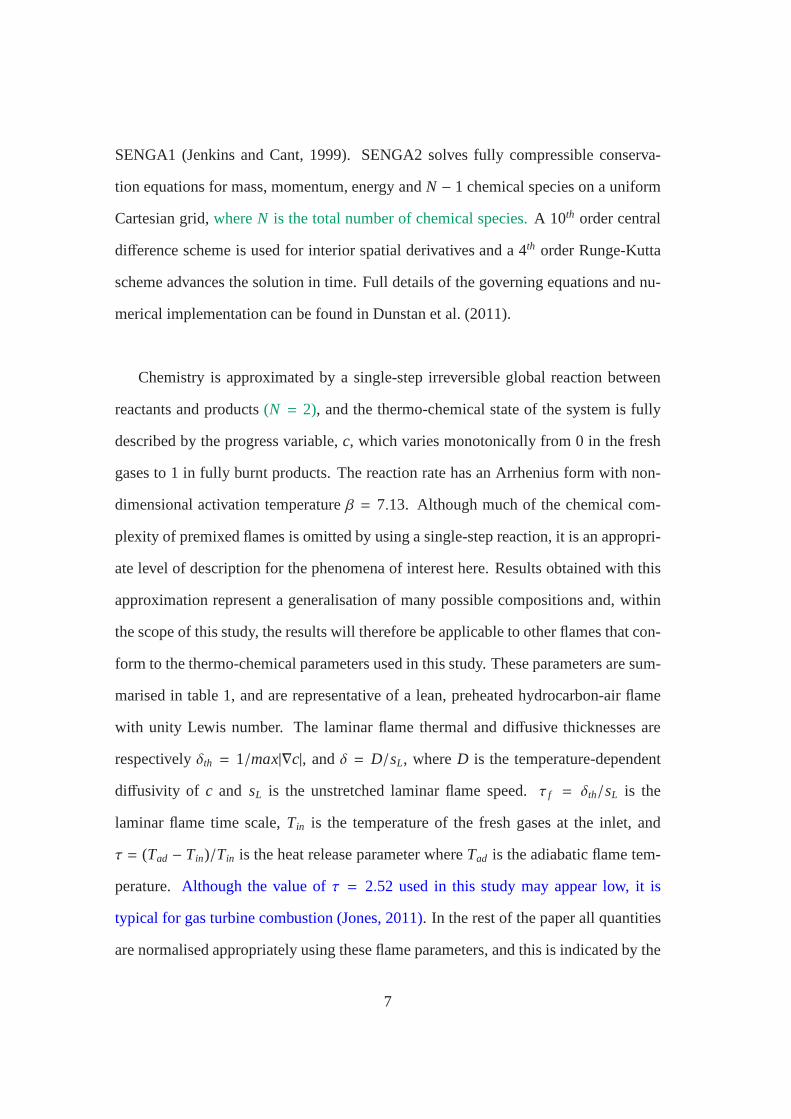
SENGA1 (Jenkins and Cant, 1999). SENGA2 solves fully compressible conserva-
tion equations for mass, momentum, energy andN − 1 chemical species on a uniform
Cartesian grid,whereN is the total number of chemical species.A 10th order central
difference scheme is used for interior spatial derivatives and a4th order Runge-Kutta
scheme advances the solution in time. Full details of the governing equations and nu-
merical implementation can be found in Dunstan et al. (2011).
Chemistry is approximated by a single-step irreversible global reaction between
reactants and products(N = 2), and the thermo-chemical state of the system is fully
described by the progress variable,c, which varies monotonically from 0 in the fresh
gases to 1 in fully burnt products. The reaction rate has an Arrhenius form with non-
dimensional activation temperatureβ = 7.13. Although much of the chemical com-
plexity of premixed flames is omitted by using a single-step reaction, it is an appropri-
ate level of description for the phenomena of interest here.Results obtained with this
approximation represent a generalisation of many possiblecompositions and, within
the scope of this study, the results will therefore be applicable to other flames that con-
form to the thermo-chemical parameters used in this study. These parameters are sum-
marised in table 1, and are representative of a lean, preheated hydrocarbon-air flame
with unity Lewis number. The laminar flame thermal and diffusive thicknesses are
respectivelyδth = 1/max|∇c|, andδ = D/sL, whereD is the temperature-dependent
diffusivity of c and sL is the unstretched laminar flame speed.τ f = δth/sL is the
laminar flame time scale,Tin is the temperature of the fresh gases at the inlet, and
τ = (Tad − Tin)/Tin is the heat release parameter whereTad is the adiabatic flame tem-
perature. Although the value ofτ = 2.52 used in this study may appear low, it is
typical for gas turbine combustion (Jones, 2011). In the rest of the paper all quantities
are normalised appropriately using these flame parameters,and this is indicated by the
7

superscript+.
At the flame holders, shown in Figure 1, the mass fractions areset to equilibrium
product values(c = 1) and the velocity components are restricted to their mean inlet
values through a Gaussian weighting function with an approximate radius ofRf h ≈
1.16δth, as discussed in Dunstan et al. (2011). The flame holders are positioned at
x+ ≈ 3.5 in all cases. The flame holder centre-to-centre separationis d+f h ≈ 5.8.
Following preliminary studies in two-dimensions, it was found that within the central
region of the domain the two flame branches remain minimally correlated as long as
df h > l0, wherel0 is the integral length scale of the turbulence in the region close to
the flame holders.
The influence of the flame holders on the statistical properties of the flames di-
minishes rapidly with downstream position. Previous investigations of single V-flames
in three-dimensions (Dunstan et al., 2011) have shown that biases in the distributions
of surface-conditioned tangential strain rate and curvature become negligible after a
mean-flow convective time of 0.4τ f . In the current simulations this corresponds to
streamwise positionsx+ > 10.1. The relative influence of the flame holders will also
diminish with increasing turbulence intensity, and so it isunlikely that any significant
influence remains within the regions of interest for the flames presented here.
It should also be noted that no energy is added to the flow in thecurrent implemen-
tation, and super-adiabatic flame temperatures cannot occur since equi-diffusive trans-
port is assumed. Furthermore, no boundary layer is formed around the flame holder,
and hence, no significant shear-generated turbulence whichwould otherwise produce
strongly non-isotropic and inhomogeneous turbulence conditions downstream. While
it is recognised that including these effects would more accurately reflect real V-flame
behaviour, the intention here is not to recreate specific experimental conditions but to
8

investigate the interaction process in a more general sense.
The boundary conditions on all non-periodic faces are basedon Navier-Stokes
Characteristic Boundary Conditions (NSCBC) (Poinsot and Lele, 1992). On the down-
stream and transverse faces the standard outflow NSCBC implementation has been
modified to accommodate the strong transverse gradients andsource terms generated
by the flame (Sutherland and Kennedy, 2003; Yoo and Im, 2007; Dunstan et al., 2011),
which ensures that stability and accuracy are preserved while allowing unsteady flame
elements to cross the boundary.At the inlet, velocity components are interpolated
from precomputed fields of fully-developed homogeneous isotropic turbulence at the
desired turbulence intensity.
The domains have sidesL+x = 29.7 in the streamwise direction,L+y = 14.9 in the
transverse direction, andL+z = 26.0 in the periodic direction.The grid resolution for
cases TV06 and TV10 isNx = 672, Ny = 336 andNz = 588, and for case TVFS is
Nx = 684,Ny = 342 andNz = 589, giving a maximum (diagonal) grid point separation
which is less thanδth/13. The time step was fixed at 2× 10⁻⁸ s.
Three cases are considered; two with fixed integral length scale and different tur-
bulence intensity, and one with fine scale turbulence, as summarised in Table 2, where
u′in is the inlet rms velocity fluctuation, andl0 is the integral length scale in the frozen
turbulence. The Karlovitz number is estimated fromKa ≈ (u′in/sL)32 (l0/δ)−
12 . The
turbulent Reynolds and Damkohler numbers areRel0 = u′inl0/ν andDa = τl0/τ f re-
spectively, whereν is the kinematic viscosity of the fresh gases andτl0 = l0/u′in. The
turbulence parameters chosen in this study are intended to explore the sensitivity of
flame interactions to changes in both turbulence intensity and turbulent length scale.
9

The regimes of turbulent combustion typically encounteredin IC engines and gas tur-
bines are successfully mimicked in the current simulations, however, it should be noted
that the turbulent Reynolds and Damkohler numbers found inreal systems are typically
larger than those achieved here.
All simulations are run for two complete flow-through times,2τ+FT ≈ 3.6, and only
data from the second flow through time are used for analysis. To further ensure that
all initial transients have decayed and a statistically stationary state has been reached,
global properties such as the total product mass fraction and total turbulent kinetic en-
ergy within the domain are tracked to confirm that they no longer vary significantly
with time. In order to accurately reconstruct the interaction history, snapshots of the
progress variable field were dumped at intervals of∆t+ = 0.023. As noted in the
introduction, the shortest relevant time scales for normalflame interactions based on
changes to the displacement speed of an isosurface are of theorder 0.01τ f , which re-
lates to both the final stages of isosurface merger, and the initial stages of cusp recovery
immediately following the merger (Chen et al., 1999). Changes to the heat release rate
occur over slightly longer time scales however - of the orderof 0.03τ f . The present
sampling time interval of 0.023τ f is therefore sufficient to capture all such events, and
the sensitivity of the results to this sample interval is discussed in more detail in Sec-
tion 3.1.
3 Data Analysis
Mean flow variables are obtained by time and ensemble averaging, using 32 evenly
spaced snapshots in time and all points in the periodic direction. For any variable
10

Q(x, y, z, t):
Q(x, y) =1
S Nz
S∑
m=1
Nz∑
k=1
Q(x, y, k, tm) (1)
whereS andNz are the total number of snapshots in time, and nodes in the periodic
direction respectively. In reacting flow simulations it is often more convenient to con-
sider the density-weighted or Favre average ofQ defined byQ = ρQ/ρ.
For even the simplest fuels, the interaction between two premixed flame elements
is a multi-stage process involving widely differing time scales, as described in detail
by Chen et al. (1999). In attempting to quantify the cumulative effect of a large number
of these interactions, a degree of simplification is necessary and this is achieved here
by reducing each interaction process to a discrete event. This simplification makes it
possible to allocate a precise time and position to each interaction, and the frequency
and distribution of these interactions can then be investigated.
To this end, we consider the topology of a single isosurface of the reaction progress
variable atc = 0.8, which is close to the point of maximum heat release in the reaction
layer, and is therefore most closely associated with changes in the rate of heat release
and the preservation of a flamelet type structure. During run-time of the simulations
the progress variable field is binarised around this value and saved for subsequent anal-
ysis using Automatic Feature Extraction (AFE) which is described next.
3.1 Automatic Feature Extraction
When considering only a single isosurface ofc, the extraction of flame interactions is
equivalent to identifying topological changes in the isosurface between snapshots at
11

time ti andti+1, whereti+1 = ti +∆t. One way this can be done is by calculating certain
topological invariants at successive time steps. For a simple surface embedded in a
three dimensional field, these invariants, known as the Betti numbers,βn, (Carlsson,
2009) have an intuitive interpretation:β0 is the number of connected components,β1 is
the number of tubes or tunnels, andβ3 is the number of isolated pockets. The number
and type of interactions taking place within the interval can then be described entirely
by the changes to these numbers, provided care is taken to exclude boundary effects.
However, such an analysis does not provide any information on the location of indi-
vidual interactions within the domain, or on the magnitude of the interactions, where
the magnitude in this context refers to some measure of the change in surface area, or
volume enclosed by the isosurface.
To provide this additional information an alternative technique known as data regis-
tration is used. The specific method used in this study, developed by Chen and Kings-
bury (2012), does not operate on the raw data directly, but first transforms the data
into the wavelet domain using the Dual-Tree Complex WaveletTransform (DT-CWT)
(Kingsbury, 2001). The data registration procedure, and the relevant features of the
DT-CWT are outlined in the remainder of this section. Details can be found in Chen
and Kingsbury (2012) and Kingsbury (2001).
The topic of wavelet methods in fluid mechanics is a large and expanding field, and
a complete description is beyond the scope of this paper. A good introduction can be
found in Schneider and Vasilyev (2010), and for combustion problems in particular in
Prosser and Cant (2011).
In general, wavelet decomposition involves a repeated convolution operation be-
tween an input function and an analysing wave form, and in this respect shares many
12
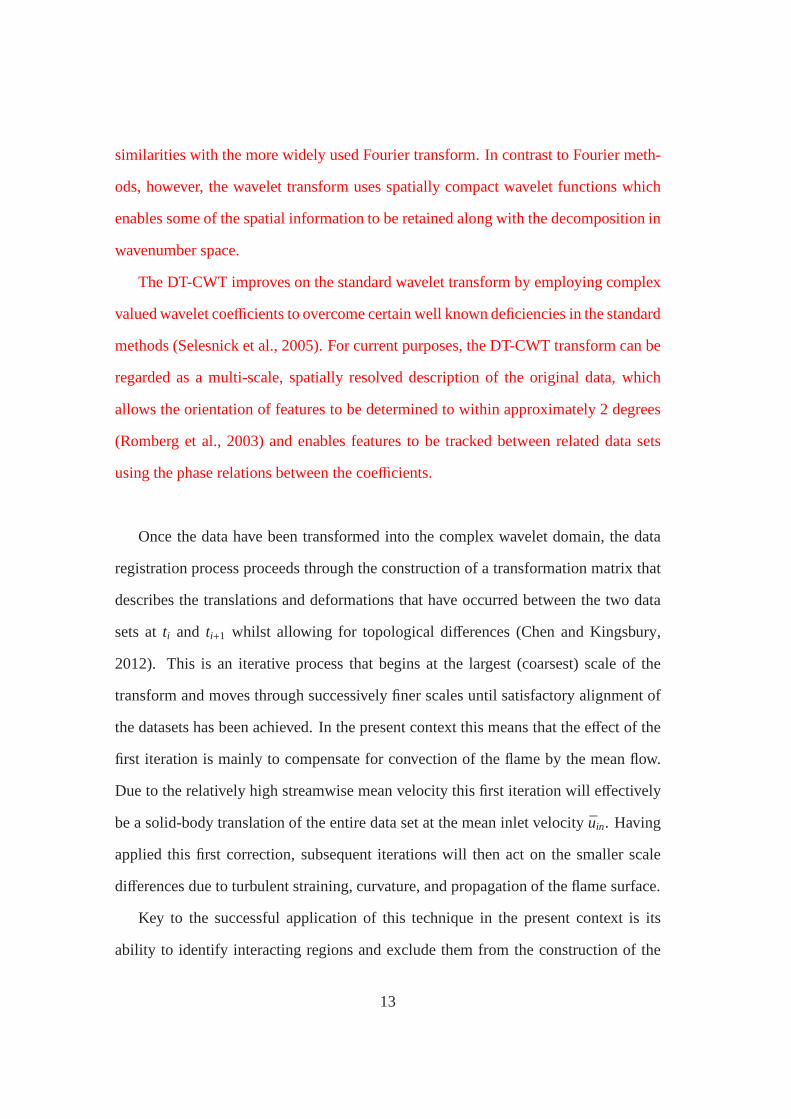
similarities with the more widely used Fourier transform. In contrast to Fourier meth-
ods, however, the wavelet transform uses spatially compactwavelet functions which
enables some of the spatial information to be retained alongwith the decomposition in
wavenumber space.
The DT-CWT improves on the standard wavelet transform by employing complex
valued wavelet coefficients to overcome certain well known deficiencies in the standard
methods (Selesnick et al., 2005). For current purposes, theDT-CWT transform can be
regarded as a multi-scale, spatially resolved descriptionof the original data, which
allows the orientation of features to be determined to within approximately 2 degrees
(Romberg et al., 2003) and enables features to be tracked between related data sets
using the phase relations between the coefficients.
Once the data have been transformed into the complex waveletdomain, the data
registration process proceeds through the construction ofa transformation matrix that
describes the translations and deformations that have occurred between the two data
sets atti and ti+1 whilst allowing for topological differences (Chen and Kingsbury,
2012). This is an iterative process that begins at the largest (coarsest) scale of the
transform and moves through successively finer scales untilsatisfactory alignment of
the datasets has been achieved. In the present context this means that the effect of the
first iteration is mainly to compensate for convection of theflame by the mean flow.
Due to the relatively high streamwise mean velocity this first iteration will effectively
be a solid-body translation of the entire data set at the meaninlet velocity uin. Having
applied this first correction, subsequent iterations will then act on the smaller scale
differences due to turbulent straining, curvature, and propagation of the flame surface.
Key to the successful application of this technique in the present context is its
ability to identify interacting regions and exclude them from the construction of the
13
transformation matrix. This is achieved by applying a weighting system to the trans-
formation parameters based on the correlation between pairs of wavelet coefficients at
each time step. In this way a low weighting will be given to pairs of coefficients where
a feature (such as a flame surface element) exists only in one of the data sets, as would
occur due to annihilation of flame elements following interaction. The specifics of this
procedure for the current application are discussed in the remainder of this section. A
flow-chart summary is given in Fig. 2, and an example of the procedure applied to
two-dimensional test data is shown in Fig. 3.
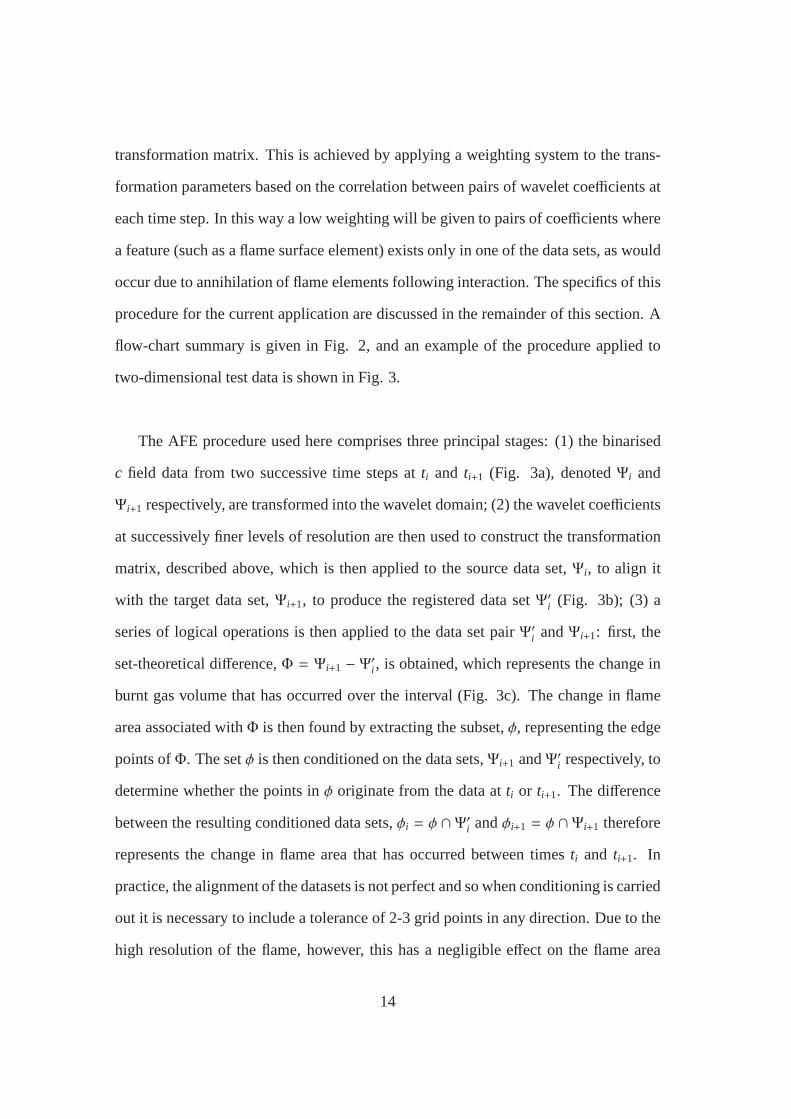
The AFE procedure used here comprises three principal stages: (1) the binarised
c field data from two successive time steps atti and ti+1 (Fig. 3a), denotedΨi and
Ψi+1 respectively, are transformed into the wavelet domain; (2)the wavelet coefficients
at successively finer levels of resolution are then used to construct the transformation
matrix, described above, which is then applied to the sourcedata set,Ψi, to align it
with the target data set,Ψi+1, to produce the registered data setΨ′i (Fig. 3b); (3) a
series of logical operations is then applied to the data set pair Ψ′i andΨi+1: first, the
set-theoretical difference,Φ = Ψi+1 − Ψ′i , is obtained, which represents the change in
burnt gas volume that has occurred over the interval (Fig. 3c). The change in flame
area associated withΦ is then found by extracting the subset,φ, representing the edge
points ofΦ. The setφ is then conditioned on the data sets,Ψi+1 andΨ′i respectively, to
determine whether the points inφ originate from the data atti or ti+1. The difference
between the resulting conditioned data sets,φi = φ ∩Ψ′i andφi+1 = φ ∩Ψi+1 therefore
represents the change in flame area that has occurred betweentimes ti and ti+1. In
practice, the alignment of the datasets is not perfect and sowhen conditioning is carried
out it is necessary to include a tolerance of 2-3 grid points in any direction. Due to the
high resolution of the flame, however, this has a negligible effect on the flame area
14

estimate.
Since the contributions to the area change from convection or turbulent straining
are removed by the alignment and differencing operations described above, the setsφi
andφi+1 represent the changes in area purely due to the topological changes caused by
flame interactions.
Information on the time, position and type of interactions can also be derived from
the AFE data:
• The precise time of occurrence of each interaction within aninterval∆t cannot
be known exactly. However, it can reasonably be assumed that, overall, the inter-
actions will be evenly distributed throughout the intervals, and so the midpoint
t = ti + ∆t/2 is taken as the time of interaction in all cases studied here.
• The spatial location of the interactions can be approximated by taking the av-
erage position of all points in the setφ associated with an individual interac-
tion; which is equivalent to calculating the centroids of the extracted burnt gas
regions inΦ. Assuming that the flame surface retracts approximately symmet-
rically about the interaction point, this provides a good estimate for the actual
positions of the interactions.
• While the exact type of interaction could in principal be determined automat-
ically from φ, for example by calculating the topology of the flame elements
before and after merger, or by tracking the changes in flame normals, in practice
it was found that simple inspection of the extracted data provided a straight-
forward and unambiguous method for the flames studied here. Details of the
interaction types and their identification are given in Section 4.1.
15

There are some inherent uncertainties in the above method that should be kept
in mind, and these come from two main sources: the first is due to inaccuracies in
the data registration scheme, and to the approximations andtolerances introduced in
estimating the change in flame area,∆A, from the data setsΨ′i andΨi+1. The second
arises from sensitivity to the sample interval∆t. The first source is relatively minor
since the registration scheme is iterative and thus it can achieve any desired level of
accuracy.
The more fundamental source of uncertainty is the sensitivity of the extracted data
sets to changes in the sample interval∆t. Clearly, when trying to characterise a tran-
sient process using discrete samples of the data there is no well-defined ’correct’ value
for this interval. However, much of this sensitivity can be avoided by considering the
global stretch rate,K = (dA/dt)/A, whereA is the total flame area within the sample
region at a given time, rather than the absolute area change,since the time increment
is then automatically taken into account in the denominator. Details of its use in the
current context are given in Section 4.5.
In spite of this, some sensitivity to∆t is still expected inK, since the area changes
associated with interactions are non-linear. An appropriate value of∆t must therefore
be chosen, and since the aim of this study is to examine the non-flamelet contribution
of flame interactions, this remaining sensitivity can be minimised by considering the
time scale analysis conducted by Chen et al. (1999). In this study it was found that
the time scale over which 95% of the increase in the heat release rate occurs during
interaction is of the order 0.03τ f . Using this as an indicator for the time scale over
which non-flamelet like behaviour occurs, a reasonable choice for∆t for the purposes
of extracting non-flamelet contributions would therefore be∆t < 0.03τ f . Larger values
than this will include changes in flame area that are caused bynormal turbulent pro-
cesses such as straining and curvature. Smaller values would be acceptable but rapidly
16

become computationally prohibitive, and would require that results are summed over
a number of intervals to estimate the total contribution. The present values of 0.02τ f
therefore represents a compromise between these two limits.
4 Results
A snapshot of thec = 0.8 isosurfaces overlaid with contours of ˜c is shown in Fig.
4a for the flame TV06, which illustrates the typical scales ofwrinkling and the rela-
tion between the instantaneous and mean progress variable fields. Based on the inflow
turbulence characteristics, all the flames in the current database fall within the Thin
Reaction-Zones (TRZ) regime according to the modified regime diagram of Peters
(2000). In this regime, Kolmogorov scale eddies are able to penetrate and distort the
preheat zone of the flame causing significant wrinkling of theflame front, but are un-
able to significantly disrupt the inner reaction layer. As noted above, these estimates
are based on the turbulence properties at the inlet, and so represent the upper limit
of the expected regime. Figure 4b shows the decay ofu′/sL along the centre-lines
(y+ = 7.44) for all the flames, and it can be seen that the actual turbulence experienced
by the flames is considerably lower than the nominal inlet values, particularly for the
rapidly dissipating fine-scale turbulence in TVFS. However, visual inspection of the
progress variable fields has shown that the TRZ regime is a good description of the
flame. Even in the highest intensity case where the flame is strongly stretched by the
flow, breaches in the reaction layer are caused only by interactions and not turbulent
stretching. Exceptions to this are counter-normal type interactions to be discussed be-
low.
17

4.1 Interaction Types
From the current database four distinct interaction types can be identified according to
the local topological changes. These are shown schematically in Fig. 5. As noted in
the introduction, a first distinction can be made between normal and counter-normal
interaction types: The flame normal,~N, defined as positive towards the fresh gas,
~N = −∇c/ |∇c|, indicates the direction in which an unstrained planar laminar flame
will propagate relative to the surrounding fluid. Normal interaction therefore refers
to cases where flame elements approach one another in the direction of propagation,
whereas counter-normal interaction describes cases whereflame elements are brought
together against their direction of propagation by the surrounding strain field. Normal
type interactions can be further divided into three sub-types: convex-normal (CX), tun-
nel closure (TC), and pocket burn-out (PB). In Fig. 6, examples of the extracted data
setsφi andφi+1 obtained using AFE for each interaction type are shown.
For the current database this categorisation is complete inthe sense that all inter-
actions that occur can be unambiguously assigned to one of these categories. It should
be noted that while it is theoretically possible that TC and PB type events also occur
in the counter-normal direction no such events were observed in the simulations pre-
sented here.
The reason for using this method of classification comes fromconsidering the dif-
ferences in the local stretch rate experienced by the flame elements before and after
merger occurs. The local stretch rate of an isosurface,κ, can be written asκ = aT+sdC,
whereaT is the tangential strain rate,sd is the propagation speed of the isosurface in
the flame normal direction, andC = ∇ · ~N is the total curvature, defined as positive
when the flame is convex towards the fresh gas. The stretch rate is a leading order pa-
18

rameter in determining the displacement speedsd of a flame element. For small stretch
rates the displacement speedsd varies approximately linearly withκ (Williams, 1994),
whereas for high stretch rates, such as those induced by strong curvature, the response
of the displacement speed can be highly non-linear, particularly for fuels with non-
unity Lewis numbers. For the purpose of understanding the effects of interactions, it is
therefore important that the method of classification reflects the underlying differences
in the strain and curvature experienced by the isosurfaces.
It can be seen from Figs. 5 and 6 that each interaction type canbe associated with
distinct curvature characteristics of the flame elements prior to merger. These curva-
ture characteristics can be described most succinctly by considering the two principal
curvatures of each flame element (Pope et al., 1989), where+ve (-ve) values indicates
convex (concave) curvature towards the fresh gases. For each of the interaction types,
the following points can be made:
• CN (counter-normal): Quasi-1D interaction. Principal curvatures -ve, -ve. Weak
or weakly negative principal curvatures due to the kinematic restoration of the
flame. Effects of tangential straining are dominant.
• CX (convex-normal): Quasi-1D interaction. Principal curvatures+ve, +ve.
Both curvature and tangential straining can be significant.
• TC (tunnel-closure): Quasi-2D interaction. Principal curvatures -ve,+ve (or
≈ 0). Increasing negative first principal curvature dominates the stretch rate
prior to merger.
• PB (pocket burn-out): Fully 3D interaction. Principal curvatures -ve, -ve. In-
creasing negative curvatures in both principal componentsdominates the stretch
rate prior to merger.
19

In all types except PB interactions, large curvature magnitudes follow cusp forma-
tion (either positive curvatures for CN interactions or negative curvatures for CX and
TC interactions) and so will also determine the flame behaviour after isosurface merger
has occurred. Curvature is therefore the key factor determining the rate of change of
flame area at all stages of the interaction process. The method of classification pro-
posed here therefore provides a simple and unambiguous method of capturing these
differences without the need to directly evaluate local curvatures.
4.2 Position of Interactions
Figure 7 shows the positions of all interactions occurring within the simulation period
collapsed on to thex− y plane, together with contours of the Favre-averaged progress
variable,c, for all cases.The differences in turbulence intensity and length scale be-
tween the cases are reflected in the ˜c fields. Studies of single turbulent V-flames under
comparable conditions to flames TV06 and TV10 have shown thatthe growth of the
flame brush downstream of the flame holder is well described bysimple Taylor type
turbulent diffusion (Dunstan et al., 2011). The flame TVFS, however, does not follow
this trend: the local turbulent time scales along the centreline are similar to the flame
TV10 (see Section 4.3 below) and so the flame should display a similar rate of growth
of the flame brush thickness if the Taylor hypothesis holds. In this case, it appears
that since the turbulence length scale for the flame TVFS is small (< δth), the energy
containing eddies are unable to strain and curve the flame front as effectively as in the
flames TV06 and TV10, and in addition will be more rapidly dissipated due to viscous
effects. This results in a more weakly perturbed, and thereforeslower, turbulent flame
than the turbulence parameters might suggest.
20

It can be seen that for all flames the majority of normal interactions occur in the
central region of the domain where the two flame branches interact, as anticipated. In
contrast, all CN events are located in the wakes of individual flame holders. Counter-
normal interactions can only occur when strong compressivenormal strain rates persist
over a sufficiently large space and time to include two individual flame fronts, and have
sufficient magnitude to overcome the effects of normal flame propagation and dilitation
due to heat release. It is probable that these conditions arecreated by pairs of counter-
rotating vortices on either side of the flame, and are therefore somewhat dependent
on the geometry of the flame holder; in this case on the flame holder diameter which
determines the proximity of the flame fronts immediately downstream, and hence the
likelihood of CN interactions.
Two features of the distributions of the normal interactions in Fig. 7 are worth
noting.First is that despite the differences between the distributions of the interactions
in physical space for each of the flames, the distributions inc space are very similar,
with the most likely position for CX type interactions occurring close to the middle of
the flame brush for all the flames.This is illustrated in Fig. 8 which shows the number
of interactions of each type that occur within equally-spaced bins ofc. The reason for
this clustering of CX interactions around ˜c = 0.5 can be understood by considering the
definition of the Flame Surface Density (FSD),Σc∗=0.8, which represents the expected
amount of flame area per unit volume at a given location:Σc∗=0.8 = (|∇c|c∗=0.8)P(c∗),
whereP(c∗) is the probability of findingc∗ = 0.8 at a given spatial location (Pope,
1988). The mean conditional gradient,|∇c|c∗=0.8, does not change significantly through
the flame brush, and soΣc∗=0.8 is determined principally by the probabilityP(c∗). For
all the flames presented here the value ofΣc∗=0.8 and thereforeP(c∗) peaks around
c = 0.5 (not shown), in agreement with many previous results for flames in the thin-
21

reaction-zones and corrugated-flamelets regimes (Driscoll, 2008). The probability of
flame interaction can be viewed as the joint probability of two statistically-independent
flame elements occupying the same region at the same time, andso it may be expected
that interaction activity followsΣc∗=0.8 provided the flame branches are statistically un-
correlated. For the present flames, the statistical independence of the flame branches
is maximised by ensuringl0/df h < 1, wheredf h is the flame holder separation shown
in Fig. 1. It is important to note, however, that as the flames approach one another
they begin to experience the same flow field regardless of their initial separation, and
so complete statistical independence cannot occur in practice.
The second important feature of the distributions in Figs. 7and 8 is the separa-
tion between the clusters of different interaction types, occurring in the sequence CX
→ TC→ PB with downstream position. This suggests that interaction types occur in
a cascade with the spatial separation resulting from a delaybetween interaction types
combined with the mean convection velocity in the streamwise direction. This cascade
behaviour arises because of the loose causal connections between the interaction types,
and while a one-to-one mapping between events is not possible, some general points
can be made bearing in mind the current flame geometry: the creation of a tunnel of
fresh gas must be preceded by a CX type interaction in this configuration (assuming
the isosurfaces are always connected at some point further downstream), and therefore
TC events cannot occur unless preceded by at least one CX event. Once a tunnel is
created at least one TC event must occur (unless there is local extinction), although
multiple TC events are possible. In addition, isolated fresh gas pockets, although the-
oretically can be formed from a single CX event, are almost always formed following
simultaneous TC events along a single tunnel in the simulations investigated here. This
provides a second causal link between TC and PB type events.
22

4.3 Delay Time
It is possible to identify approximate characteristic delay times between the interaction
types by constructing correlation coefficients between the interaction histories subject
to a time offset of∆+. To do this, we first define the functionχi(t+) as the number of
interactions occurring over a fixed interval1 for each interaction type, wherei = CX,
TC or PB. The statistical correlation can then be calculatedbetween pairs ofχis of
different type after introducing a time shift of∆+ to one of the functions:corr(χi(t+ +
∆+), χ j(t+)). If the two functions are unrelated the correlation will be close to zero
for all ∆+, however, for related functions a peak in the correlation indicates the∆+
value corresponding to the characteristic delay time between the two interaction types.
Choosingi = j produces the auto-correlation ofχ(t+) which will have a peak value
of 1 at∆+ = 0 and decrease to zero with increasing∆+, however, our present interest
is in i , j. The results are shown in Fig. 9 for the correlations betweenCX and TC
events, where the standard Pearson product-moment method has been used to evaluate
the correlation coefficients. Correlations involving PB interactions are not included
since many of the flame pockets are convected out of the domainbefore interactions
can occur.
It can be seen in Fig. 9 that in general the delay times for eachflame are dependent
on the turbulence intensity and length scale, with characteristic times of approximately
0.1, 0.06, and 0.04 for flames TV06, TV10, and TVFS respectively. Considering the
turbulence intensity near the ˜c isoline where the majority of CX interactions occur,
the normalised large eddy turn over times (the local Damkohler numbers) in this re-
1The interval used to evaluateχi is approximately 2 to 3 times the AFE interval∆t. This is doneto compensate for the relatively small number of interactions occurring within each∆t, and within thisrange the results are insensitive to the exact value used.
23

gion, τ+l0 = (l0sL)/(u′δth), are approximately 1.24, 0.55, and 0.53 for TV06, TV10,
and TVFS respectively. Thus, there is an almost linear relationship betweenτ+l0 and
the characteristic delay times for these flames. This resultsuggests that it is turbulent
convection of the flame elements, and not the scales of wrinkling that determines the
delay time, since there is no observable effect on the delay time from differences in the
turbulent length scales alone. It should also be noted that thermo-diffusive properties
of the flame are also likely to be an important factor affecting the interaction delay
time, however, since these properties are the same in all theflames studied here this
cannot contribute to the observed variation.
4.4 Interaction Length Scales
It is possible to identify characteristic length scales forthe interactions from the ex-
tracted volume,Φ, and surface,φ, data obtained using AFE. These are the volume
based length scale,LV+int = Φ
1/3, and the surface-area based length scale,LS+int = φ
1/2,
where the superscript+ indicates normalisation byδth. In general these are not the
same, and indeed a third possible length scale, the volume tosurface-area ratio,LR+int =
(LV+int )3/(LS+
int )2, also provides information on the sphericity of an object since it is a
function of both the size and shape of the extracted region, and which for a given
volume reaches its maximal value only for a perfect sphere.
Table 3 gives the mean values ofLV+int andLS+
int for all flames by interaction type.
Typical probability density functions forLV+int andLS+
int for CX and TC type interactions
are shown in Fig. 10. Comparing first the different flame cases, it can be seen that
the only significant change in mean length scales occurs for CX type interactions,
as in Fig. 10a for the TVFS flame, which is smaller than in the other two cases by
approximately 15% - 20% due to the finer scale wrinkling in theTVFS flame. No
24

such difference exists for the other interaction types, for example see Fig. 10b for
TC type interactions, suggesting that length scales for TC and PB interactions do not
strongly depend on either the turbulence intensity or the integral length scale. CN
type interactions produce the smallest length scales, as one might expect, whereas
the length scales of all normal type interactions are comparable, as one can see in
Table 3. The ratio ofLV+int to LS+
int is similar for CN, CX and TC interactions for all
the flames. However, the ratio for PB type interactions compared to other interaction
types is considerably different (about 0.42 for PB compared to 0.35 for other types).
The value of about 0.42 (cf. 0.455 for a perfect sphere) reflects the tendency for pockets
of thermo-diffusively stable flames to approach a spherical shape prior to burn-out.
4.5 Flame Area Change
A key question from the point of view of incorporating flame interactions into a com-
bustion model is their effect on the rate of heat release in the flame. Under the flamelet
assumption this is equivalent to assessing the change in flame area since, to leading
order, this determines the overall rate of combustion. As outlined in Section 3.1, it is
more appropriate to consider the rate of change of area as quantified by the stretch rate,
rather than the absolute change in flame area. For the presentanalysis a global stretch
rate,K, is used, which, in contrast to the locally defined stretch rate,κ, includes all area
changes that occur within the sample regions indicated in Fig. 7. In this way, flame
interactions, which are not precisely localised events, can be included in the analysis.
The global stretch rate,K = (dA/dt)/A, can then be written as a sum of flamelet,KF ,
and interaction,KINT , contributions. Over the discrete time interval,∆t, these are given
by:
K =2(Ai+1 − Ai)(Ai+1 + Ai)∆t
(2)
25

and
KINT =2(φi+1 − φi)
(Ai+1 + Ai)∆t(3)
whereKF = K−KINT , Ai andAi+1 are the total isosurface areas within the sample region
at ti andti+1 respectively, and (φi+1−φi) is the total change in area due to all interactions
occurring in the interval, obtained using the AFE process outlined in Section 3.1. In the
above definitions, the average value ofA over the interval is used in the denominator,
however, the results do not change significantly ifAi or Ai+1 are used instead. The inter-
action stretch may also be decomposed by type, where:KINT = KCN+KCX+KTC+KPB.
Figures 11a-c show the stretch rates defined above as a function of time for all
cases. In general it can be seen that the largest contribution to the total stretch rates
comes from the flamelet component,KF , in all cases, and can take positive or negative
values. In contrast, the total interaction contribution,KINT , is smaller in magnitude
and almost always negative except for flame TVFS where small positive contributions
also occur.
Considering the interaction contributions by type, it can be seen that the largest
negative stretch rates, and hence the largest contributor to flame area destruction,
comes from TC type events for all the flame considered here. CNtype events pro-
duce the smallest overall contribution, both because they are relatively rare in this
configuration, and also individually smaller in magnitude.
CX type interactions can result in both positive or negativestretch rates. This is
particularly notable in flame TVFS where theKCX fluctuations are predominantly pos-
itive, in contrast to both the other cases. The reason for this dual effect of CX type
interactions can be understood by considering changes to the local stretch rate,κ, as
defined in Section 4.1, and in particular, the acceleration of the flame elements prior to
26

merger combined with their curvature properties. Since thedisplacement speed of the
flame,sd, increases rapidly as the flames merge, if the flame elements are positively
curved during this phase the result is a rapid increase in thecurvature-induced stretch.
Acceleration of the flame elements also occurs in TC and PB interactions, however,
in these cases the curvature is predominantly negative, which leads to negative local
stretch rates and a loss of area. During CX interactions, flame area is lost only after the
merger of thec = 0.8 isosurface, due to cusp retraction. This loss is generallygreater
than the initial gain for all the flames studied here except TVFS. It can also be seen
from Fig. 11 that this difference between the cases appears only in the magnitude of
the net-negative CX interactions, which suggests that onlythe cusp retraction phase is
sensitive to the turbulence length scale.
PB type interactions, similar to TC type interactions, are universally negative due
to the negative curvature of the flame elements prior to merger, as outlined above.
Although similar in magnitude to TC interactions, PB interactions are less frequent
principally due to the lower frequency of pocket formation compared to tunnels, but
also due to some loss of pockets though the downstream boundary. For the TV06 and
TV10 flames these lost pockets account for less than 25% of thetotal formed, however,
for TVFS this rises to over 50% and so the data on these events should be treated with
caution.
To quantify the overall effects of interactions on changes in flame area, two quanti-
ties are of interest: the time-average and root-mean-squared (rms) values of the global
stretch rates. These are summarised in Table 4. For statistically stationary flames such
as these, the average global stretch rate,K, is expected to be zero, which implies that
KF andK INT must balance one another. In spite of the wide differences in the mag-
27

nitudes of their respective fluctuations, this is approximately true for all the flames
considered in this study. The residuals seen inK reflects a lack of statistical conver-
gence in the data, however, this does not significantly affect any of the observations
made here. TC events produce the largest average negative stretch rates, followed by
approximately equal contributions from CX and PB type interactions. The exception
to this isKCX for flame TVFS which is positive, as discussed above.
While time-averaged values provide information on the expected biases for the
stretch rates, the instantaneous effects of interactions are also of interest, and to as-
sess this it is useful to consider the rms values ofKF andKINT . These are given in
Table 4, where it can be seen that, although instantaneous fluctuations inKF are the
largest contributor, the fluctuations in interaction stretch are also significant, and reach
approximately 28%, 26%, and 17% of theKrmsF values for flames TV06, TV10, and
TVFS respectively. The modelling of these effects will be addressed in future work,
however, from a phenomenological perspective the main points can be summarised as
follows:
• CN type interactions do not contribute significantly to changes of flame area in
the current configuration, since they are both less frequentand smaller in mag-
nitude than other types. These two factors are related: vortices having sufficient
power to overcome the normal flame propagation and expansionof the burnt
gases are relatively rare, and since the interaction occursover longer time scales
due to the lower approach velocity of the flame elements compared to normal
interactions, a smaller area change will be recorded over any particular sample
interval.
• CX type interactions can lead to a net negative or positive change in the flame
area, both in instantaneous and averaged values. The current results suggest
28

that the cause of this qualitative change is related to the turbulence length scale,
l0/δth, where smaller length scales are associated with increasesin flame area
for this type of interaction. The local Damkohler number does not appear to be
important since these are very similar for flames TV10 and TVFS.
• TC type interactions are responsible for the majority of flame area loss in all
cases. They are both more frequent and have a larger average magnitude than
the other interaction types.
• PB type interactions are similar in average magnitude to negative CX interac-
tions, and make a similar overall contribution to the loss offlame area. Taking
into account the convection of some pockets through the downstream boundary,
their actual effect on the flame brush may be slightly larger.
• The frequency of CX and TC interactions both vary proportionally with turbu-
lence intensity in the interacting region for the TV06 and TV10 flames (NCX ≈
10u′/sL and NTC ≈ 12u′/sL, whereN is the number of interactions perτ f ).
However, interactions in the TVFS flame do not follow the sametrend (NCX ≈
12u′/sL andNTC ≈ 8u′/sL), which marks a qualitative change compared to the
flames with larger turbulence length scales. As noted in Section 4.2, the occur-
rence of CX interactions can be associated with the joint probability of finding
two flame elements at the same location, and so does not dependon the structure
of the turbulence directly but only on the statistical distributions of the flame
front. In contrast, TC type interactions depend more directly on the time and
length scales of the turbulence, as evidenced by the delay-time dependence on
the Damkohler number described in Section 4.2.
29

5 Summary and Conclusions
Direct numerical simulations of twin turbulent V-flames were carried out to investi-
gate the phenomenology of multiple flame interactions in premixed turbulent flames.
Flame interactions were defined by the topological changes to a single isosurface of
the progress variable near the point of maximum heat release. A novel post-processing
technique involving data registration in the complex wavelet domain was applied in
order to extract information on the time, position and change in flame area associated
with individual interactions. Three flames at different values of turbulence intensity
and length scale were analysed to assess the sensitivity of the interactions to turbu-
lence parameters.
Four distinct types of interaction were identified, based ontopological changes to
the flame surface: one counter-normal (CN), and three normal: convex normal (CX),
tunnel closure (TC), and pocket burn-out (PB). The peak of CXtype activity was found
to coincide with the position of maximum flame surface density in the flame brush for
all flames, in accordance with the expected behaviour for uncorrelated flame branches.
Normal interactions were observed to occur in the cascade CX→ TC→ PB, due to the
causal links between the interaction types. Characteristic delay times between the CX
and TC types were found to be proportional to the large eddy time scale (or Damkohler
number) in each case, suggesting that the turbulent convection of flame elements plays
an important role both before and after the initial CX interactions.Characteristic length
scales for the interactions were identified using the extracted volume and surface area
data. The only significant difference in mean length scale magnitude was found for CX
type interactions in flame TVFS, which were between 15% and 20% lower than those
for flames TV06 and TV10. Other interaction types showed no significant sensitivity
30

to turbulence intensity or turbulence length scale for the conditions considered here.
The effects of interactions on the turbulent flame brush were investigated by consid-
ering the global stretch rate of the flame, expressed in termsof a flamelet component,
KF , which includes the effects of turbulent straining and curvature-propagation, and
an interaction component,KINT , representing the area changes associated with flame
interactions. It was found that TC type interactions are responsible for the majority
of the overall flame area loss due to interactions. CN interactions are relatively rare
and occur over longer time scales compared to normal interactions, and so do not con-
tribute significantly to the total flame area change in the simulations studied here. CX
type interactions can lead to either a net increase or net decrease in the flame area.
The data suggest that the overall sign of CX contributions depends on the turbulence
length scale, where smaller length scales are associated with a net increase in area,
but no Damkohler number dependence was observed for these flames. Time-averaged
values of stretch show thatKF andK INT approximately balance, yieldingK close to
zero, as expected for the stationary flames studied here. Therms values of the stretch
rates also indicate that interactions play a significant role in the instantaneous flame
brush dynamics, with values forKrmsINT of 28%, 26%, and 17% of the rms values of the
flamelet stretch component for flames TV06, TV10, and TVFS respectively. The total
and individual mean contributions to negative flame stretchcorrelate well with the in-
let turbulence Reynolds numbers for the flames considered inthis study.
For the purposes of model development, the following observations can be made
regarding the present results:
• In the thin-reaction-zones regime, the overall contribution to flame area reduc-
tion from the non-flamelet processes is comparable to the better understood
31

flamelet mechanisms involving strain and curvature. Many FSD based flamelet
models employ a single destruction term to account for both the flamelet and
non-flamelet contributions. However, given the fundamentally different physi-
cal processes underlying the two mechanisms, and their comparable importance
in the flames studied here, it is likely that treating these effects separately would
provide a firmer basis for modelling.
• The majority of the loss of flame area due to interactions (from TC types) does
not tend to occur at the same position within the flame brush atwhich the initial
interactions (CX) take place. Furthermore, the different interactions do not share
the same phenomenology; with CX type interactions appearing to depend only
on the statistical distribution of flame elements, but TC events also showing sen-
sitivity to the turbulence time scales through a Damkohlernumber dependence.
This implies that in order to adequately predict and capturethe effects of flame
interactions, factors which account for the observed delaytimes between inter-
action types and their different causal dependencies may need to be incorporated
into the model.
Finally, the limitations of the single-step unity Lewis number assumption used in
this study should be noted. While all the phenomena presented here are essentially
fluid-mechanical in origin and adequately described by a global reaction mechanism,
some important additional effects cannot be addressed. For sub-unity Lewis number
flames the preferential diffusion of light fuel species or radicals ahead of the flame in
positively stretched flame elements is expected to occur. This reduced thermo-diffusive
stability is likely to increase the occurrence of net-positive area changes associated
with CX type events. For the same reason, the cusp retractionphase following all
types of interaction, where the flame cusps exhibit extreme positive curvature, is likely
32

to be attenuated compared to unity Lewis number flames. Conversely, for super-unity
Lewis number flames the opposite trends are expected.The influence of non-unity
Lewis numbers on the propagation speed may also alter the interaction time scales,
however, it is unclear how differences in steady-state characteristics of these flames
will translate to the highly transient phenomena of interest here. A full investigation
of these effects will be addressed in a future publication.
Another important topic to be considered is the role of flame interactions in the
production of pollutants such as CO and NOx. In this regard, it is likely that CN type
interactions will have much greater importance than their effect on flame area would
suggest, due to the importance of the burnt-gas side of the flame front for CO oxidation
(Hawkes and Chen, 2004).
The twin V-flame configuration together with the methodologyfor extracting in-
formation on flame interactions outlined in this paper, provide a good framework to
study these phenomena. The degree of control available overthe type and intensity of
interactions, and the realisability of the configuration inboth computational and ex-
perimental settings make it well suited to investigating the role of interactions.
Acknowledgments
The authors would like to thank Professor R. S. Cant for the use of SENGA2. EP-
SRC funding through grant number EP/F028741/1, and funding from Rolls-Royce is
acknowledged.
33

References
P. Anselmo-Filho, S. Honchreb, R.S. Barlow, and R.S. Cant. Experimental measure-
ments of geometric properties of turbulent stratified flames. Proc. Combust. Inst.,
32:1763–1770, 2009.
R. Balachandran, B. O. Ayoola, C. F. Kaminski, A. P. Dowling,and E. Mastorakos.
Experimental investigation of the nonlinear response of turbulent premixed flames
to imposed inlet velocity oscillations.Combust. Flame, 143:37–55, 2005.
J. B. Bell, M. S. Day, I. G. Shepherd, M. R. Johnson, R. K. Cheng, J. F. Grcar, V. E.
Beckner, and M. J. Lijewski. Numerical simulation of a laboratory-scale turbulent
V-flame. P. Natl. Acad. Sci. USA, 102:29:10006–10011, 2005.
R. Borghi. Turbulent premixed combustion: Further discussions on the scales of fluc-
tuations.Combust. Flame, 80:304–312, 1990.
A. A. Burluka, A. Gorokhovski, and R. Borghi. Statistical model of turbulent premixed
combustion with interacting flamelets.Combust. Flame, 109:173–187, 1997.
S. Candel, D. Durox, and T. Schuller. Flame interactions as asource of noise and
combustion instabilities.AIAA J., 2004-2928, 2004.
G. Carlsson. Topology and data.Bull. Amer. Math. Soc., 46:255–308, 2009.
H. Chen and N. G. Kingsbury. Efficient registration of non-rigid 3-D bodies.IEEE T.
Image Process., 21:262 – 272, 2012.
J. H. Chen, T. Echekki, and W. Kollmann. The mechanism of two-dimensional pocket
formation in lean premixed methane-air flames with implications to turbulent com-
bustion.Combust. Flame, 116:15–48, 1999.
34

P. Domingo, L. Vervisch, S. Payet, and R. Hauguel. DNS of a premixed turbulent
V flame and LES of a ducted flame using a FSD-PDF subgrid scale closure with
FPI-tabulated chemistry.Combust. Flame, 143:566–586, 2005.
J. F. Driscoll. Turbulent premixed combustion: Flamelet structure and its effect on
turbulent burning velocities.Prog. Energ. Combust. Sci., 34:91–134, 2008.
T. D. Dunstan, N. Swaminathan, and K. N. C. Bray. Geometricalproperties and tur-
bulent flame speed measurements in stationary premixed V-flames using direct nu-
merical simulations.Flow Turbul. Combust., 87:237–259, 2011.
T. Echekki, J. H. Chen, and I. Gran. The mechanism of mutual annihilation of stoi-
chiometric premixed methane-air flames.Twenty-Sixth Symposium (International)
on Combustion, 26:855–863, 1996.
E. R. Hawkes and J. H. Chen. Direct numerical simulation of hydrogen-enriched lean
premixed methaneair flames.Combust. Flame, 138:242–258, 2004.
K. W. Jenkins and R. S. Cant. DNS of turbulent flame kernels. InProceedings of the
Second AFOSR Conference on DNS and LES, pages 192–202, 1999.
B. Jones. Application of lean flames in stationary gas turbuines. In N. Swamianthan
and K.N.C. Bray, editors,Turbulent Premixed Combustion. Cambridge University
Press, 2011.
A. R. Kerstein. Turbulence in combustion processes: Modeling challenges.Proc.
Combust. Inst., 29:1763–1773, 2002.
N. G. Kingsbury. Complex wavelets for shift invariant analysis and filtering of signals.
J. Appl. Comput. Harmon. Anal., 10:3:234–253, 2001.
35
L. W. Kostiuk, I. G. Shepherd, and K. N. C. Bray. Experimentalstudy of premixed tur-
bulent combustion in opposed streams. part III: spatial structure of flames.Combust.
Flame, 118:129–139, 1999.
S. D. Lee and S. H. Chung. Experimental investigation of the nonlinear response of
turbulent premixed flames to imposed inlet velocity oscillations. Combust. Flame,
98:80–92, 1994.
Y. Minamoto, T. D. Dunstan, and N. Swaminathan. DNS of EGR-type combustion
in MILD condition. 7th Mediterranean Combustion Symposium, Sardinia, 1:TC39,
2011.
N. Peters.Turbulent Combustion. Cambridge University Press, 2000.
T. Poinsot and S. Lele. Boundary conditions for direct simulations of compressible
viscous flows.J. Comput. Phys., 101:104–129, 1992.
S. B. Pope. The evolution of surfaces in turbulence.Int. J. Engng. Sci., 26:445–469,
1988.
S. B. Pope, P. K. Yeung, and S. S. Girimaji. The curvature of material surfaces in
isotropic turbulence.Phys. Fluids A, 1(12):2010–2018, 1989.
R. Prosser and R. S. Cant. Wavelet methods in computational combustion. In
T. Echekki and E. Mastorakos, editors,Turbulent Combustion Modeling. Springer,
2011.
J. Romberg, M. Wakin, H. Choi, and R.G. Baraniuk. A geometrichidden Markov tree
wavelet model. InProc. Wavelet Applications Signal Image Processing X (SPIE
5207), San Diego, pages 80–86, 2003.
36

K. Schneider and O.V. Vasilyev. Wavelet methods in computational fluid dynamics.
Annu. Rev. Fluid Mech., 42(1):473–503, 2010.
T. Schuller, D. Durox, and S. Candel. Dynamics of and noise radiated by a perturbed
impinging premixed jet flame.Combust. Flame, 128:88–110, 2002.
I. W. Selesnick, R. G. Baraniuk, and N. G. Kingsbury. The dual-tree complex wavelet
transform.IEEE Signal Proc. Mag., 22:6:123–151, 2005.
I.G. Shepherd. Flame surface density and burning rate in premixed turbulent flames.
Proc. Combust. Inst., 26:373–379, 1996.
S. H. Sohrab, Z. Y. Lee, and C. K. Law. An experimental investigation on flame
interaction and the existence of negative flame speeds.Proc. Combust. Inst., 20:
1957–1965, 1984.
C. J. Sun and C. K. Law. On the consumption of fuel pockets via inwardly propagating
flames. Twenty-Seventh Symposium (International) on Combustion, 27:963–970,
1998.
J. C. Sutherland and C. A. Kennedy. Improved boundary conditions for viscous, react-
ing flows. J. Comput. Phys., 191:502–524, 2003.
M. Talei, M. J. Brear, and E. R. Hawkes. A parametric study of sound generation by
premixed laminar flame annihilation.Combust. Flame, 159:757–769, 2012.
F. A. Williams. Combustion theory: the fundamental theory of chemically reacting
flow systems. Number 1 in Combustion science and engineering series. Perseus
Books, 1994.
37
C. S. Yoo and H. G. Im. Characteristic boundary conditions for simulations of com-
pressible reacting flows with multi-dimensional, viscous reacting effects.Combust.
Theor. Model., 11:2:259 – 286, 2007.
38
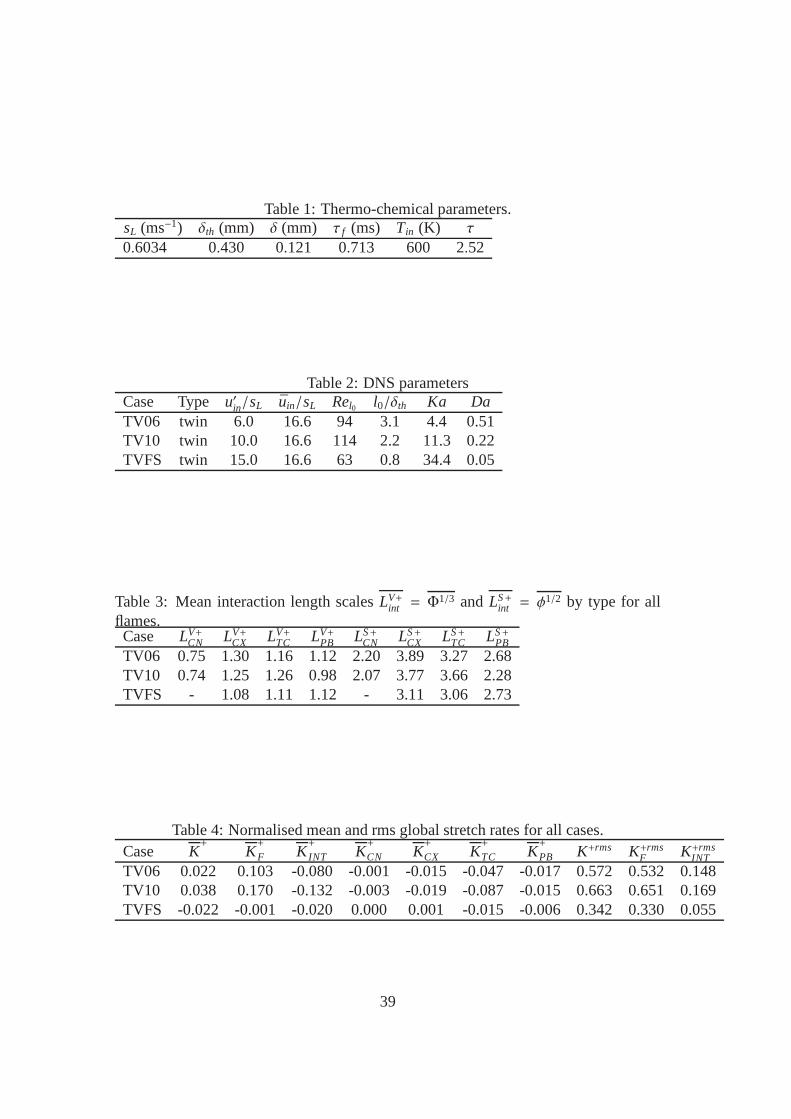
Table 1: Thermo-chemical parameters.sL (ms−1) δth (mm) δ (mm) τ f (ms) Tin (K) τ
0.6034 0.430 0.121 0.713 600 2.52
Table 2: DNS parametersCase Type u′in/sL uin/sL Rel0 l0/δth Ka DaTV06 twin 6.0 16.6 94 3.1 4.4 0.51TV10 twin 10.0 16.6 114 2.2 11.3 0.22TVFS twin 15.0 16.6 63 0.8 34.4 0.05
Table 3: Mean interaction length scalesLV+int = Φ
1/3 andLS+int = φ
1/2 by type for allflames.Case LV+
CN LV+CX LV+
TC LV+PB LS+
CN LS+CX LS+
TC LS+PB
TV06 0.75 1.30 1.16 1.12 2.20 3.89 3.27 2.68TV10 0.74 1.25 1.26 0.98 2.07 3.77 3.66 2.28TVFS - 1.08 1.11 1.12 - 3.11 3.06 2.73
Table 4: Normalised mean and rms global stretch rates for allcases.Case K
+K+
F K+
INT K+
CN K+
CX K+
TC K+
PB K+rms K+rmsF K+rms
INT
TV06 0.022 0.103 -0.080 -0.001 -0.015 -0.047 -0.017 0.572 0.532 0.148TV10 0.038 0.170 -0.132 -0.003 -0.019 -0.087 -0.015 0.663 0.651 0.169TVFS -0.022 -0.001 -0.020 0.000 0.001 -0.015 -0.006 0.342 0.330 0.055
39

List of Figures
1 Schematic layout of computational domain. . . . . . . . . . . . . .. 42
2 Flowchart summary of the automatic feature extraction procedure. . . 42
3 Automatic feature extraction applied to a 2-dimensional flame data at
times ti and ti+1. The mean flow is from left to right. Reactants and
products are denoted R and P respectively. (a) Original dataΨi and
Ψi+1 representing product regions. (b) Data atti is registered to data
at ti+1 to produceΨ′i . (c) Two CX type interactions are extracted and
surface pointsφi andφi+1 identified (see section 4.1). . . . . . . . . . 43
4 (a) Snapshot of the 3Dc = 0.8 isosurface overlaid with contours of ˜c
at c = 0.1, 0.2, ..., 0.9 for flame TV06; (b) Turbulence intensityu′/sL
along centre line of domains (y+ = 7.44) for all flames. Vertical line
indicates position of flame-holder. . . . . . . . . . . . . . . . . . . . 43
5 Schematic illustrations of (a) counter-normal (CN), (b) convex-normal
(CX), (c) tunnel closure (TC), and (d) pocket burn-out (PB) type inter-
actions. R and P denote reactants and products respectively. . . . . . . 44
6 Examples of data extracted using AFE for each interaction type from
the TV06 flame. Data points inφi andφi+1 are represented by black and
yellow spheres respectively. Scale indicated by laminar flame thick-
nessδth for each image. . . . . . . . . . . . . . . . . . . . . . . . . . 44
7 Contours of ˜c, for c = 0.1, 0.2, ..., 0.9, for case TV06 (a), TV10 (b),
and TVFS (c). Interaction types are CN (black squares), CX (red di-
amonds), TC (blue circles) and PB (brown stars). Rectangle shows
region over which AFE was applied. . . . . . . . . . . . . . . . . . . 45
40

8 Number of interactions occurring by type in 10 evenly spaced bins of
c for flames TV06 (a), TV10 (b) and TVFS (c). . . . . . . . . . . . . 46
9 Interaction frequency correlations as a function of normalised delay
time ∆+ for CX-TC events. Correlations are evaluated at discrete
points marked by symbols. Shape-preserving splines have been added
for readability. . . . . . . . . . . . . . . . . . . . . . . . . . . . . . . 46
10 Probability densities of interaction length scales for all cases: a)LV+int
for CX interactions, b)LS+int for TC interactions. . . . . . . . . . . . . 46
11 Normalised stretch rates,K+ = Kτ f , on thec = 0.8 isosurface for
cases TV06 (a), TV10 (b), and TVFS (c). Top: total stretch rate, K+,
flamelet component,K+F , and interactions component,K+INT . Bottom:
interaction stretch rates by type. . . . . . . . . . . . . . . . . . . . . 47
41

Figure 1: Schematic layout of computational domain.
Figure 2: Flowchart summary of the automatic feature extraction procedure.
42
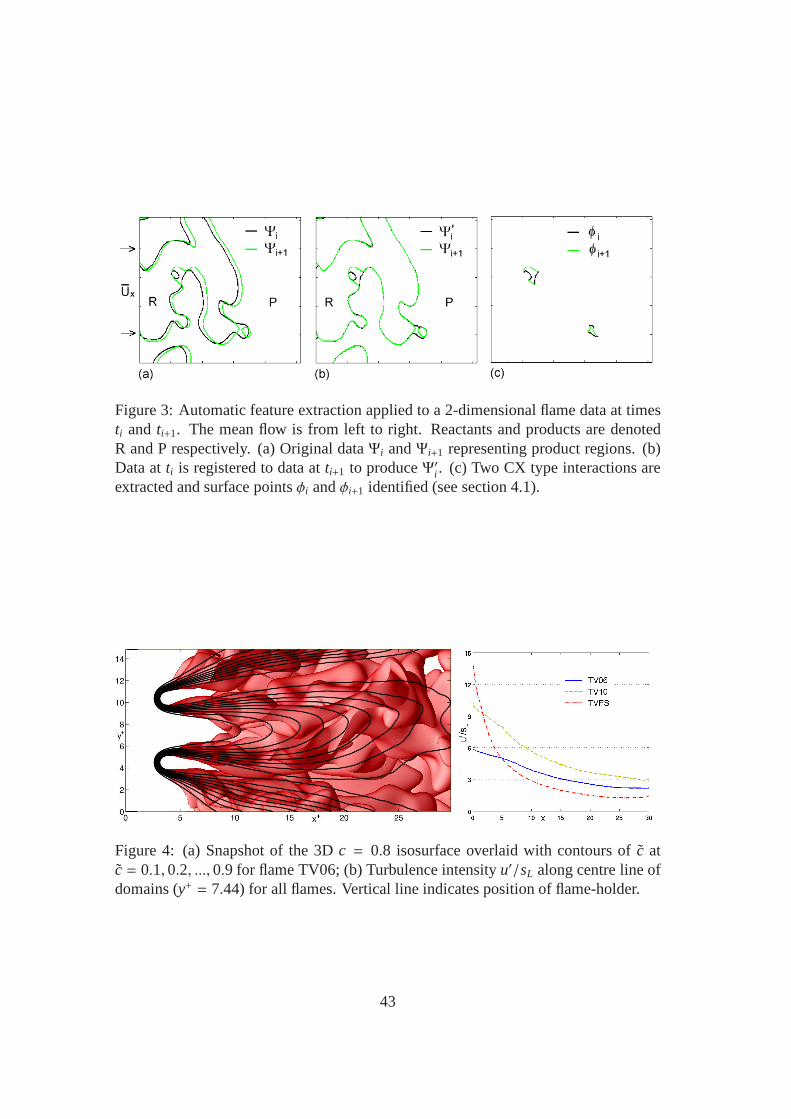
Figure 3: Automatic feature extraction applied to a 2-dimensional flame data at timesti and ti+1. The mean flow is from left to right. Reactants and products are denotedR and P respectively. (a) Original dataΨi andΨi+1 representing product regions. (b)Data atti is registered to data atti+1 to produceΨ′i . (c) Two CX type interactions areextracted and surface pointsφi andφi+1 identified (see section 4.1).
Figure 4: (a) Snapshot of the 3Dc = 0.8 isosurface overlaid with contours of ˜c atc = 0.1, 0.2, ..., 0.9 for flame TV06; (b) Turbulence intensityu′/sL along centre line ofdomains (y+ = 7.44) for all flames. Vertical line indicates position of flame-holder.
43
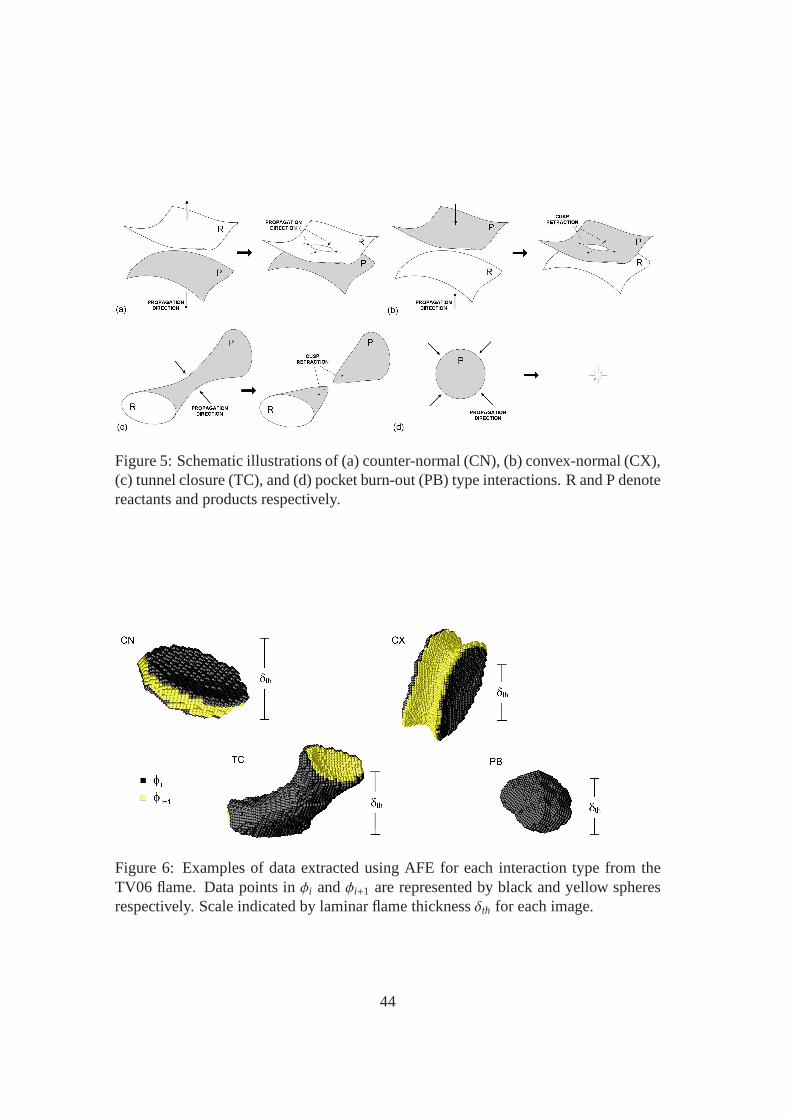
Figure 5: Schematic illustrations of (a) counter-normal (CN), (b) convex-normal (CX),(c) tunnel closure (TC), and (d) pocket burn-out (PB) type interactions. R and P denotereactants and products respectively.
Figure 6: Examples of data extracted using AFE for each interaction type from theTV06 flame. Data points inφi andφi+1 are represented by black and yellow spheresrespectively. Scale indicated by laminar flame thicknessδth for each image.
44

Figure 7: Contours of ˜c, for c = 0.1, 0.2, ..., 0.9, for case TV06 (a), TV10 (b), andTVFS (c). Interaction types are CN (black squares), CX (red diamonds), TC (bluecircles) and PB (brown stars). Rectangle shows region over which AFE was applied.
45
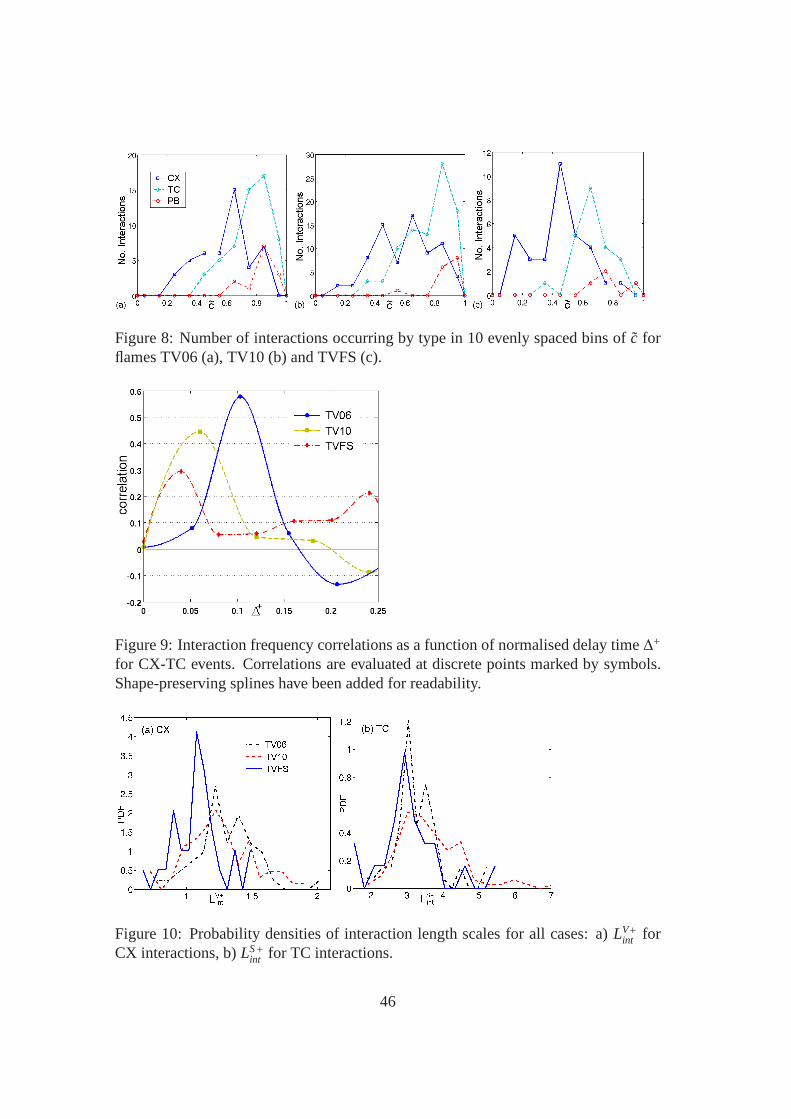
Figure 8: Number of interactions occurring by type in 10 evenly spaced bins of ˜c forflames TV06 (a), TV10 (b) and TVFS (c).
Figure 9: Interaction frequency correlations as a functionof normalised delay time∆+
for CX-TC events. Correlations are evaluated at discrete points marked by symbols.Shape-preserving splines have been added for readability.
Figure 10: Probability densities of interaction length scales for all cases: a)LV+int for
CX interactions, b)LS+int for TC interactions.
46

Figure 11: Normalised stretch rates,K+ = Kτ f , on thec = 0.8 isosurface for casesTV06 (a), TV10 (b), and TVFS (c). Top: total stretch rate,K+, flamelet component,K+F , and interactions component,K+INT . Bottom: interaction stretch rates by type.
47