flame and temperature measurement using vibrational … · army research laboratory aberdeen...
TRANSCRIPT

Army Research Laboratory Aberdeen Proving Ground, MD 21005-5066
ARL-TR-2378 January 2001
Flame and Temperature Measurement Using Vibrational Spectroscopy
Kevin McNesby Weapons and Materials Research Directorate, ARL
Appsoved for public release; distribution is unlimited.
Abstract
An overview of the application of vibrational spectroscopy to the study of flames is provided. The mathematics of interpretation of flame spectra for determination of species concentration and temperature are introduced. The history of the application of vibrational spectroscopy to the study of flames is briefly summarized. Applications of methods using dispersive absorption and emission spectroscopy and of methods using tunable diode lasers (TDLs) to the study of flame systems are discussed.
.
ii

Acknowledgments
The author wishes to thank Dr. John Vanderhoff and Dr. Robert Daniel for kindly supplying
figures &scribing their work and Prof. Ian Kennedy for several helpful suggestions toward
improving the manuscript.
. . . m

~NTIONALLY LEFT BLANK.
iv
Table of Contents
Acknowledgments . ..~~~.~..~*~.~*....~..~...~~.......~..~...~*.*.......*..............~...**.................~..**.** .~- 111
List of Figures . . . . ..*............*.*.*..*~.........**.........* . . ..*.........~..*...**................**.........**..*.. vii
1. Introduction **...***~................*.....~.~.~ ..*.**.*..~....~~...~..~~....~....**..~***......~...~.~~...........*.**.* 1
2. Background .,*.I**.....~..~.~.~..~....~.........,..*...................... .~~..L...,.~..*..*............~~~.~~.~~.....*~* 4
2.1 Populatih Distribution Among Available Energy Levels ..f.....~.....~~***.*....*.**~*..* 6 2.2 Absorption of Radiation . . . . . . . ..-.... e . . . . . . . . ..*.................... .~.~.**...***....*...........~~...~.~ 8
3. Experimental Methods - Narrative . . . . . . . . . . . . ..*.**.*.*............. . . . ..~.*..*...~...*..*****.*.~...~.~~ 11
4. Experimental Methods - Dispersive and Fourier-Transform Spectroscopy . . . . . 14
4.1 Emission Measurements ...................................................................................... 14 4.2 Absorption Measurements ................................................................................... 15
5. Experimental Methods - Applications of Tunable Diode Laser Absorption Spectroscopy (TDLAS) .a* .*..*................. . ..~...*~.f..................................~~..~*....*...*...**~ 18
6. Conclusion .*~.*...*.*****..................... . . . . . . ..~..**..*.**.*...*........*...... *...,....*.~..*.*.,*...*...........* 24
7. References ..*...***..**fl.........~.. . . . . . ..~..*..........***.............* . ..*...*..........*.*..*..................*.*.* 25
Distribution List . ..~........*.~............**...*........~...,..~....ff......~......*..*.....~..~...............~~..~. 29
Report Documentation Page .f~~............,,.........**~*......~.......~. . . ..~*....*....***.*.*.............~ 31
v

~NTIONALLY LEFT BLANK.
vi

List of Figures
Figure
1.
2.
3.
4.
5.
6.
7.
8.
9.
10.
11.
Potential Energy Diagram for a Diatomic Anharmonic Oscillator . . . . . . . . . . . . . . . . . . . . m . . . . . . .
Radiation From an Ideal Blackbody at Several Temperatures l...~~.***..*.t...l.~~~.~.*.**....
The IR Emission Spectrum Measured Using an FI’IR Spectrometer From and l&Torr cH4/02 Flame and the Blackbody Radiation (1,173 K) Emitted Over the Same Region .........f....I. . ..f.ff.~f~f*.~......~~~~.~..*..~ . ..~f~~~.f***....*.....~ff.**..~~..*~.....l..*.**.***~~1.
Calculated Transmittance of Light Through a Fixed Pressure of CO Gas at Different Temperatures ~.~~ff..l.***~.~~~..~~~.***.~ . . . . ..f.~f~~**.....~..~~~.~.**.~*.....~~*~.*.f***...**...f..~~
The IR Emission Spectrum Measured From a Premixed, Stoichiometric CH.&z Flame (Total Pressure 17 Torr) to Which 3% CF3Br Has Been Added ffff......*.........
The Transmittance Specmnn of the First Overtone (v = 0 - 2) of CO . . . . . ..*.............
Experimental Apparatus for Measurement of FI’IR Absorption Spectra Through Flames . ..*.*..**** *.*.*... . . ..tt~~tt.t**..*....~~......*....** ..f~.fl.~.~f....***..*..~~~.~~~~..*...**.*......~~~..****...
Mid-IR TDL Spectra of CO, Measured Through a Premixed CI&/& Flame, at a Total Pressure of 20 Torr, as a Function of Height Above the Burner Surface . . . . . . . .
A Transmission Spectrum Measured Through a Iow-Pressure, Premixed CE&/Oz Flame at 20 Torr *.***..........*.**......* . . ..~~..~....**.....ff~.~.f..~....**** . ..~~...~.~..................~...~.1
Simulated Signal vs. Wavelength of Laser Radiation After Passing Through a Gas With an Absorption Feature Near 7665.5 cm-’ Graphs for (a) Unmodulated ILaser Radiation; (b) Laser Radiation With a Small-Amplitude, High-Frequency Modulation; and (c) Demodulation at Twice the High-Frequency Modulation in (b) *.** . . ..ff..f.... f . . . . . *. . . ..~~f~~*..*.~...~~~~~~~~.~..~.~. ..ff...~.~..~..******.............***.*.........~~..*..*...
2
4
5
11
14
16
16
18
20
21
22
vii

blllWTIONALLY LEFT BLANK.
. . . VIII

1. Introduction
The application of modern spectroscopic analysis to the study of flames began in the 1920s
and 1930s with breakthroughs in the understanding of atomic and molecular spectroscopy
(Gaydon 1948). The earliest spectroscopic investigations focused on understanding the line and
band structure observed in the visible and ultraviolet (UV) regions of the spectrum when the
light from the flame was dispersed by a grating or prism. One of the great breakthroughs of
physics during this period was the understanding that the band structure observed in the emission
spectra of flames originated from gas phase molecular species (Hertzberg 1950a).
For molecular species, understanding the appearance of flame spectra is simplified by
assuming that the total internal energy, Er, of a gas phase molecule may be given to first order
(Born-Oppenheimer approximation) as
Here, Em, Em, and ERR are, respectively, the quantized electronic, vibrational, and rotational
energy of the molecular species. In the scientific literature, these energies are usually expressed
in terms of wave numbers (the reciprocal wavelength, expressed in centimeters, which is directly
proportional to energy, and given the symbol cm-‘). Ah observed spectral features, in emission
and absorption, are caused by changes in total energy, m-r, of the individual species present
within the flame. Spectral features arise from the emission or absorption of a photon with energy
corresponding to the difference between initial and final states of the transition. Figure 1
illustrates the absorption of a photon corresponding to an electronic transition (Figure 1 [a]) and
to a vibrational transition (Figure lb]) for a diatomic molecule whose interatomic potential
energy may be approximated by an an harmonic oscillator (Hertzberg 195Oa).
In general, changes in electronic, vibrational, and rotational energy correspond to emission or
absorption of radiation in the visible (and UV), infrared (IR), and microwave region of the
electromagnetic spectrum, respectively. Typically, &L > kEm > SRoT. Molecular changes
1

I B?D Electronic
Transition
AET = =EL +he + &o-r
Vibrational Transition
w Interatomic Distance (1 O-lo m) (b)
Figure 1. Potential Energy Diagram for a Diatomic Anharmonic Oscillator. Electronic (a) and Vibrational (b) Absorption Transitions Are Illustrated. Values for Interatomic Distance, Energy (E), and Term Symbols Are for the Radical Flame Species CN.
in EEL are generally accompanied by changes in E VIB and E~o-r, and changes in Em may be (and
almost always are) accompanied by changes in E~or. These general trends are illustrated in
Figure 1. The band structure observed in the visible and UV spectra of molecular species in
flames, emission, and absorption is therefore understood to be the result of combined changes in
electronic, vibrational, and rotational energies (Hertzberg 195Ob).
The visible and W radiation from most flames usually accounts for less than 1% of the total
emitted energy (Gaydon and Wolfhard 1953), with most of the energy emitted by a flame
occurring in the JR region of the spectrum. To see why this is not unexpected, it is useful to
compare the radiation emitted by a flame with the radiation emitted by a blackbody. In a system
at thermodynamic equilibrium (which, on a macroscopic scale, a flame is not), the distribution of
radiation is given by Planck’s blackbody radiation law (Penner 1959):
2

1~ = [2E&-5/(emT - l>J AdL (2)
Here, 1~ is the wavelength-dependent radiant intensity normal to the surface of the radiator, EL is
the emissivity at wavelength h, cl and c2 are the first and second radiation constants and have the
values 0.588 x lo-* W/m2 and 1.438 x low2 m/K, respectively, T is temperature in Kelvin (K),
and A is the area of the surface in square meters (m2).
Figure 2 is a plot of equation (2) at several temperatures. Figure 2 shows that, for a
blackbody radiator at temperatures up to 2,300 K, the peak spectral radiancy always occurs in the
IR region of the spectrum. As the temperature increases ahove 2,300 K, the peak of spectral
radiancy moves to shorter wavelengths (toward the visible region of the spectrum). It is
important to note that, for a blackbody, the value of EL is equal to 1 at all wavelengths. In
‘flames, the value of EL varies (and may approach 1) with wavelength, but is near 0 for most
wavelengths, indicating that a flame is not a blackbody and that flame gases may not be in
thermodynamic equilibrium. Nevertheless, in some cases where the emissivity of a flame
species is known, measurements of spectral radiancy of flames may lx used to calculate flame
temperatures to within an accuracy of several Kelvin (Gaydon 1974).
When the regions of nonzero emissivity (EL > 0) in the flame emission spectrum are
expanded along the wavelength scale, these regions exhibit detailed fine structure. In the visible
and W regions of the flame emission spectrum (in general, radiation with a wavelength between
1 pm and 200 nm), this fine structure represents changes in rotational and vibrational energy,
which accompany changes in electronic energy. In the more intense IR region of the flame
emission spectrum (in general, radiation with a wavelength between 1 and 30 pm), the observed
fine structure is caused by transitions between rotational energy levels that occur with a change
in vibrational energy but with no change in electronic energy. The amount by which the
vibrational and rotational energies may change during a transition is governed by selection rules,
which are largely dependent upon the symmetry of the species involved in the transition (Wilson
et aL 1955).
3

. - .
0 1 2 3 4 5 6 7 8 Wavelength (micrometers)
Figure 2. Radiation From an Ideal Blackbody at Several Temperatures.
Figure 3 shows the raw emission spectrum from a premixed, reduced pressure (18 torr)
stoichiometric Wa flame measured using a Fourier-transform infrared (FUR) spectrometer
(McNesby et al. 1996) and the calculated emission from a blackbody at 1,173 K over the same
spectral region. The peak temperature in this flame was measured (using a fine wire
Pt-Pt/lO%Rh thermocouple) to be near 2,150 IL Comparison of flame emission spectra to
calculated blackbody radiance must take into account the emissivity of the different species
within the flame, reabsorption of emitted radiation by cold gases outside of the flame region,
emission from species at different temperatures along the line of sight of the measurement,
chemiluminescence, and the variation in sensitivity of the instrument detector with wavelength.
Figure 3 illustrates that care must be taken when estimating flame temperatures from measured
spectra, since results from simple fits of a blackbody radiation curve to a measured spectrum
may be inaccurate.
2. Background
Emission and absorption spectra of flames may lx continuous or banded. Continuous
emission spectra may lx modeled using the Planck blackbody equation (equation [2]). Modeling
4

2100 2600 3100
Wavenumber (cm-l)
7
3600 4100 4600
Figure 3. The IR Emission Spectrum Measured Using an FTIR Spectrometer From an l&Tom CWOz Flame and the Blackbody Radiation (1,173 K) Emitted Over
-._ the Same Region, The IR Emission Spectrum Has Not Been Correct for the Responsivity of the Detector,
of banded spectra requires an understanding of the statistics that govern the way the population
of a species is distributed among available energy levels. It is the dependence of population of
molecular energy levels upon temperature, and the influence of this population upon band shape
and spectral emissivity and absorption, that makes vibrational spectroscopy a useful tool for
flame diagnostics.
The necessary mathematics for species and temperature measurements from IR spectra of
flames are outlined next. The example given is for a diatomic molecule, such as do. It is
assumed that the spectra are measured in absorption at low pressure, where the amount of light
absorbed is less than approximately 5% of the incident intensity (often referred to as absorption
in an optically thin medium). For extension to more complicated molecules (including more
complicated diatomic molecules, such as NO) and to higher pressures, the reader should consult
the texts referenced in the following sections.
5

2.1 Population Distribution Among Available Energy Levels. The classical
Maxwell-Boltzmann distribution law may be used to approximate the distribution of population
among the quantized energy levels of a gas phase diatomic molecule (Hertzberg 1950a). For
most diatomic molecules (such as CO but not NO), each separate lineshape observed in the
infrared spectrum corresponds to a simultaneous change in vibrational and rotational energy. For
this reason, the spectral lines that make up the band structure observed in most IR spectra are
often called rovibrational transitions. For purposes here, it is convenient to describe the initial
and final energy levels of the transition as rovibrational energy levels.
When describing two energy levels of a given species, the superscript ’ denotes the state of
higher energy and the superscript ” denotes the state of lower energy. At thermodynamic
equilibrium, the ratio of the number of molecules in the rovibrational energy level with
vibrational quantum number Y’ and rotational quantum number J’ to the number of molecules in
the rovibrational energy level with vibrational quantum number v” and rotational quantum
number J” is given by
N&NJ7V,VV7 = [(2J’ + 1)/(2J” + %)]exp(-(A& + hEJ) )hc/kT), (31
where NrVp is the population of the higher rovibrational energy level; NJ’~,~” is the population of
the lower rovibrational energy level; && is the change in vibrational energy (units of cm-‘); MJ
is the change in rotational energy (units of cm-‘), which occurs during the transition; h is
Planck’s constant; k is Boltzmann’s constant; and c is the speed of light. The quantity
[(25’+1)/(2J”+l)] accounts for the degeneracy of rotational levels for a given value of J,
providing a statistical weight to the levels with a given rotational energy.
For interpretation of measured spectra, it is useful to know the fraction of the total population
(NT) in the energy level from which the transition originates. For absorption (where the
transition originates from the level of lower energy), this may be given by
6
7
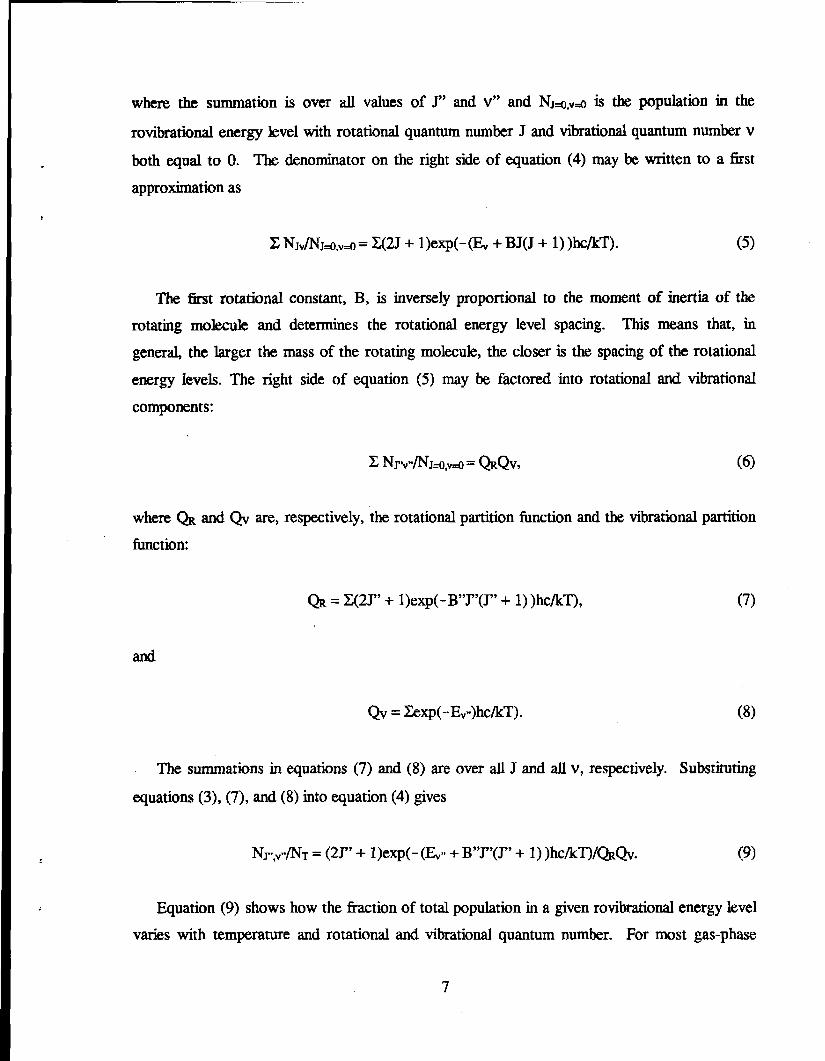
where the summation is over all values of J” and v” and NJS,~~ is the population in the
rovibrational energy level with rotational quantum number J and vibrational quantum numbef v
both equal to 0. The denominator on the right side of equation (4) may be written to a fist
approximation as
Z NJJNJ+~~= Z(2J + l)exp(-(Ev + BJ(J + l))hc/kT). (5)
The Ikst rotational constant, B, is inversely proportional to the moment of inertia of the
rotating molecule and determines the rotational energy level spacing. This means that, in
general, the larger the mass of the rotating molecule, the closer is the spacing of the rotational
energy levels. The right side of equation (5) may be factored into rotational and vibrational
components:
where Qr and Qv are, respectively, the rotational partition function and the vibrational partition
function:
QR = X(23 + l)exp(-B”J”(J” + l))hc/kT), (7)
and
Qv = Xexp( -E,“)hc/kT) . (8)
The summations in equations (7) and (8) are over all J and all v, respectively. Substituting
equations (3), (7), and (8) into equation (4) gives
NryjN~ = (2r’ + l)exp(- (I$ + B”J”(r’ + 1) )hcKWQ&v. (9)
Equation (9) shows how the fraction of total population in a given rovibrational energy level
varies with temperature and rotational and vibrational quantum number. For most gas-phase

diatomic molecules, if the population in a known rovibrational level is measurec& equation (9)
allows the total population (and hence total pressure) of the gas to be calculated.
2.2 Absorption of Radiation. The Einstein transition probability of absorption, B,, (not to
k confused with the first rotational constant, B) predicts the energy removed (IR) from an
incident beam of radiation by an optically thin layer of absorbers for a transition from a lower
state, m, to an upper state, n, as (Steinfeld 1974):
IR = bN,,-,B-Axhv,, (10)
where N, is the number of molecules per unit volume in the energy level from which absorption
occurs, Jo is the energy crossing unit area of absorbers per second, Ax is the absorber thickness,
and V~ is the energy (in cm-‘) of the monochromatic radiation exciting the transition. In
equation (lo), IoN,,,B, is proportional to the number of transitions per second per unit volume
produced by the radiation and hv nm is proportional to the energy removed from the incident beam
per transition QIertzberg 1950a).
In an absorption experiment, the intensity of radiation exiting the absorbing medium, I, is
described according to the Bougner-Hubert Law (later restated by Beer for solutions [Moore
19721):
I= Ioexp(- @vWmx), (11)
where x is the path length traveled by the light through the absorbing medium and a(h) is called
the cross section for absorption. This cross section represents the “effective area” that a
molecule presents to the incident photons (Bernath 1995). When a(h)N,,,x is small (optically
thin medium), equation (11) may be rewritten:
IO - I = b(o(h)N,x). (12)

Integrating equation (12) over the wavelength range for which the absorption may occur
gives
J(~o(h) - I&))&= J b(h)(@)Nmx) a. (13)
The way in which the cross section for absorption (o(h)) varies with wavelength depends
mainly upon the total pressure of the gas (Townes and Schawlow 1955). For gas pressures
above approximately 100 torr, the absorption is observed to occur with a Lxentzian lineshape
(Anderson and Griffiths 1975) given by
o(h)Nr,,x = 2.303Ao$/((cb - c/A,)~ -t $), (14)
where & is the peak spectral Absorbance (-log(I(h)/I&))) at the wavelength of maximum light
attenuation by the gas and y is the half width at half height (HWHH) of the spectral line.
Substituting equation (14) into equation (13), assuming that b is invariant with wavelength
over the absorption linewidth and integrating over the full hnewidth, gives
J (b(h) - I(h)) dh = 2.30310(h) JA&C/X - c/&)~ + $)dA = 2.303Io(;h)nAoy. (1%
Substituting equation (15) into equation (10) and solving for the peak absorbance, Ao, gives
AI = NmAx &,,,hv,,&.303xy. (16)
The number of molecules in the initial state, Nm, is related to the total number of molecules,
NT, through the vibrational (QV) and rotational (Q) partition functions:
N,,, = NT(~J” + l)exp(- (l$ + B”J”(J” + l))hcKWQxX. (17)
Substituting equation (17) into equation (16) gives

Ao = [Ax B-h&,&-r&J” + 1)/2.303y Q&J exp(- (I&~~ + B”J”(F + l))hc/kT). (18)
Equation (18) is useful for extracting temperature and concentration information f?om
measured values of peak absorbance (Ao) for individual transitions in a rovibrational band By
simultaneously fitting T and NT to & measured over a rovibrational band, temperature and gas
pressure may be obtained. Equation (18) shows that it is necessary to lcnow the HWHH of each
line in the spectrum used in the calculation, and the value of B,. This is not always trivial,
since this value may be temperature and J-value dependent. Additionally, it is important to
recognize that peak absorbances must be corrected when measured with an instrument of
moderate spectral resolution. The method for extracting true peak absorbance from peak
absorbance measured at moderate resolution has ken treated in detail by Anderson and Griffiths
(1977).
Substituting equation (18) into equation (16) and expressing the result in the form of the
Bouguer-Lamkt Law (equation [ 111) gives
I(WO(U = expK-Ax &&,,&)N~(~QX(@/l- c/kd2 + $1)
x (2J” + l)exp(- &P + B”J”(J” + l))hc/kT)J. (1%
Equation (19) allows direct comparison between high-resolution measurements of
transmittance (I(h)/Io(h)) and transmittance calculated from spectral parameters, pressure of the
absorbing gas, and the temperature. It should be noted that knowledge of the spectral line
HWHH ($ is required, as well as an instrument capable of measuring the transmittance at high
resolution. In practice, values of B, (usually converted to linestrengths) for different
rovibrational transitions are taken from the literature or estimated from measurements of total
band strength (Varghese and Hanson 1980). Also, the Voight lineshape pro&, which &scribes
the convolution of a Gaussian lineshape function (applicable to gases at low pressure) and a Lorentzian lineshape function, is usuaIly used to model spectral lines in flames at reduced
pressure (Daniel et al 1996). As with fits to data based upon equation (18), when spectra are
measured on an instrument of moderate resolution (in general, an instrument resolution > O.ly),
10

the instrument lineshape function is convoluted with the true lineshape (equation [19]). When
this is the case, this convolution must be included in the model (Vanderhoff et al. 1997).
Equation (19) describes the fully resolved band structure observed in high-resolution IR
spectra of many gas phase diatomic molecules, such as CO. Figure 4 shows the transmittance
(T(h)/I&)) spectrum of CO, calculated using equation (19), for a constant number of molecules
at the temperatures shown in Figure 2. Figure 4 shows that, as the temperature increases and
more rotational energy levels become populated, the overall shape of the absorption band
broadens to cover a wider spectral range. Additionally, because the total number of molecules is
divided between a greater number of initial energy levels as temperature is increased, the
intensity of individual rovibrational transitions changes with increasing temperature.
1 i I I 1 1 1 , I I 1
1900 1950 2ooo 2050 2100 2150 my3 z50 2300 2350 2400 Wavenumber (cm-l)
Figure 4. Calculated Transmittance of Light Through A Fixed Pressure of CO Gas at Different Temperatures. Spectra Are Offset for Clarity (Each Baseline Corresponds to 100 % Transmission).
3. Experimental Methods - Narrative
By the 195Os, the mathematical and instumental methods for determination of temperatures
and species concentrations from measurements of IR spectra had been established (Barnes 1977),
11

in large part spurred by electronics developed during the second world war, by perfection of the
method of commercial replication of diffraction gratings, and by publication in 1945 of
Hertzbergs book Infrared and Raman Spectra of Polyatomic Molecules (Hertzberg 195Ob).
During the 195Os, comparison of IR emission spectra from high-temperature sources in different
laboratories was complicated by temperature gradients along the measurement line of sight and
by incomplete spectral parameters for gas absorption at high temperatures. To obtain spectral
parameters for gases under study, several efforts were made to study gases in closed ‘cells at
controlled temperatures (Oppenheim 1963). Most of these efforts on studying gases at high
temperature under static conditions employed absorption spectroscopy, in part to minimize self
absorption along the line of sight and also to enable using modulation of the source radiation
(allowing discrimin ation of the high-intensity, unmodulated background IR emission). The
success in fundamental studies of band structure and in predicting emissivities and changes in
absorption at high temperatures and pressures led to an increase, by the early 196Os, in studies of
radiation transfer for systems ranging from jet and rocket motors to high-efficiency oil burners.
A particular success that resulted from the study of gas phase emissivitics was the determination
of thermal stress on NASA rocket motors from exhaust gas radiation (Limbaugh 1985).
With the development in the early 1970s of the Fourier-transform spectrometer and the
computer-based fast Fourier transform (FFI), it became possible to achieve high resolution
coupled with high-energy throughput and phase-sensitive detection (Griffiths and & Haseth
1986). However, the development of laser-based techniques (particularly laser-induced
fluorescence LIFI) for measurement of flame radical species (such as OH, HCO, H, 0, CH, and
C2) enabling direct measurement of species participating in flame propagation reactions (Daily
1997) caused a shift in focus of fundamental spectroscopic investigations of flame systems. This
shift led to a decrease in the late 1960s and early 1970s in the number of publications describing
basic research that applied the techniques of dispersive IR absorption and emission spectroscopy
to flames.* This decrease was offset by a considerable body of work on emission studies of hot
gas sources, particularly smokestack and waste gas plumes from industrial sources (Wormhoudt
and Conant 1985).
l This conclusion is baaed upon an informal survey of the Proceedings of the International Symposia (International) on Combustion published by Academic Press, from 194X to 1996.
12

By the late 197Os, laser based techniques employing tunable infrarti lasers began to be used
for species measurements in flames (Hanson et al. 1980). The majority of this work used tunable
diode lasers (TDLs), semiconductor devices in which the output laser radiation wavelength is
tuned by varying the temperature and diode injection current. Initial experiments used TDL’s
emitting narrow linewidth (typically c 10s4 cm-‘) radiation in the mid-i&ared spectral region.
The narrow linewidth usually enables species specscity, even in congested spectral regions.
Since the laser linewidth is typically several orders of magnitude less than the absorption
linewidth, measurements of the fully resolved absorption transition may be made, enabling the
determination of lineshape dependence upon pressure and temperature. An additional advantage
to using tunable diode lasers, besides very narrow linewidths, is the ability to tune the lasers
rapidly (kHz to MEIz) over their output wavelength range. This enables phase sensitive detection
that minimizes the effect of the laser output noise, and also enables time resolved measurements
of dynamic systems.
Recently, tunable diode lasers operating in the near-infrared spectral region have begun to
see application to the spectroscopy of flames and to flame gases (Bomse et al. 1992; Silver
1992). At this time, commercial availability of TDLs in the mid-IR spectral range is greater than
for the near-IR spectral range. TDLs operating in the mid-IR spectral range must be cooled to
cryogenic temperatures. TDLs operating in the near-IR spectral range operate near room
temperature, and, unlike mid-IR radiation, the near-IR radiation may be transmitted over long
distances through optical fibers. However, since absorption in the near-IR spectral region
corresponds to a change in vibrational quantum number greater than unity (referred to as an
over&one transition), the sensitivity to a given molecule is much less than for mid-IR
spectroscopy, which is usually used to measure rovibrational transitions in the fundamental
vibrational band. Typically, mid-IR TDLs a& used when extreme sensitivity is required (ppb
range). For many field-based techniques that require transportability in rugged environments,
near-IR TDLs are more appropriate (ppm range).
13

4. Experimental Methods - Dispersive and Fourier-Transform Spectroscopy
4.1 Emission Measurements. Since the mid-197Os, most measurements of emission
spectra of steady flames have ,used Fourier-transform techniques. Figure’ 5 shows the emission
spectrum measured from a premixed, stoichiomettic C&/O2 flame (total pressure equal to 18
torr) to which 3% CF3Br has ken added as a flame suppressant. When appropriate, reduced
pressure flames are often studied kcause, at reduced pressure, the flame region is expanded,
allowing more &tailed study. The emission spectrum shown in Figure 5 was measured using an
FTIR spectrometer at a resolution of 1 cm-‘.
co2
1 1000
I I I 2000 3000 4000
Wavenumber (cm-l)
Figure 5. The IR Emission Spectrum Measured From a Premixed, Stoichiometric C&/O2 Flame (Total Pressure 17 TOIT) to Which 3% CF3Br Has Been Added.
In Figure 5, spectral features from several flame species are identikd, but the spectrum is
dominated by emission from Coz and gaseous H20. This is because higher temperatures allow
emission over a wide range of rovibrational transitions (see Figure 4) from combinations of
14

different vibrational states and the geometry of the emitting species (specifically, in this case,
HzO) causes the spectrum to be complicated (relative to that for a diatomic molecule). The
measured spectrum in Figure 5 reports emission from species over a wide range of temperatures
because the line of sight from the flame center to the detector includes gases at many different
temperatures. Also, because many flame species are products of an ongoing chemical reaction
(combustion), these species may be produced w$h vibrational and rotational population
distributions that are not in equilibrium with translational temperatures (Gaydon 1948). Because
of this, temperatures calculated from emission spectra using expressions similar to equations (18)
or (19) may give misleading results. When these factors are taken into account, temperature and
partial pressures of gas species may be extracted from high-resolution measurements of
IR-emission spectra (Wormhoudt and Conant 1985).
4.2 Absorption Measurements. Figure 6 shows an absorption spectrum measured through
an opposed-flow CH&.ir fkime (total pressure 50 torr) using a FTIR spectrometer at 1 cm-’
resolution. It should be noted that this spectrum is less congested and has a slightly more regular
appearance than that shown in Figure 5. Absorption features corn several species are evident in
the spectrum. For flame diagnostics using IR-absorption spectroscopy, CO is probably the most
widely studied molecule. The fundamental rovibrational absorption band of CO (v = 0 - 1,
centered at 2,170 cm-‘) is well approximated by ‘equation (19) and has a spacing ‘between
rotational lines (2B) of approximately 3.6 cm-‘. Modeling of measured spectra is relatively
straightforward, and fully resolved rovibrational lines may be measured at moderate instrument
resolution (although the reported lineshape may be just the instrument lineshape function
[Anderson and Grifliths 19751). In addition, since CO is a major product of hydrocarbon
combustion, it is present in most flame systems. Figure 7 shows the spectrum of the fist
overtone (v = 0 - 2) of CO, measured using a dispersive system, and the fit to the measured
spectrum using an equation similar to equation (19). Since the resolution of the spectrometer
used to measure the spectrum in Figure 7 was insufficient to fully resolve the lineshapes of the
individual rovibrational transitions, it was necessary to convolute the instrument function with
the true lineshape function (equation [19]) to obtain an accurate fit of the measured to calculated
spectrum (Van&rhoff et al. 1997).
15

Luminous Flame Zone t
ODDOSSd
; ..__..._...._._...__ ~ ..,__. ~ . . .._ _._.* _...._ * .___.. * . . . . *.._ ..___... _* . . . . . . . . It...~--*.-**t.* *..* *.**-.. loo0 2& &lo
Wavenumber (cm-l)
Figure 6. The IR Absorption Spectrum Measured Through a 50-Torr Opposed-Flow CHdAir Flame. The Inset Shows the Burner Configuration Used to Produce the Flame.
1.00 4-
~ 0.96 -
4 =
I 0.92 -
G
0.88 -
2250 2300 2350 2400 2450
Wavelength (nm)
Figure 7. The Transmittance Spectrum of the First Overtone (v = 0 - 2) of CO. The Gas Was Contained in a Static Cell at 1 Atmosphere Total Pressure and a Temperature of 423 K. The Dotted Line Is the Measured Spectrum, and the Solid Line Represents the Least Squares Fit to the Data.
16

A major difSculty in obtaining quantitative absorption measurements of flame species is that
absorption of radiation by cold gases in the probe beam line of sight may lead to errors.
Currently, several methods of excluding contributions to absorption by cold gases in the line of
sight are used (Dasch 1992), with most methods employing some type of computer averaged
tomography (CAT). Using these methods (often referred to as inversion methods), multiple line
of sight measurements at different relative orientations are made within a plane, or slice, through
the flame. Using these multiple line of sight measurements, numerical methods are used to
calculate species concentration at a given point within the plane. Applying this technique to
multiple pianes, or slices, through the flame can yield a three-dimensional reconstruction of
species concentration within the flame. This technique has been used to measure Co in reduced
and atmospheric pressure flames (Best et aL 1991; McNesby et al. 1995). A summation of inversion methods used to measure temperatures and species in flames has ken given by
Limbaugh (1985).
It should be noted that, when measuring flame-absorption spectra using a FI’IR spectrometer,
care must be exercised so that flame emission is not reflected through the interferometer and
reported as an absorption signal. To minimize the emitted radiation that reaches the
interferometer, the collimated probe IR beam is brought to a focus at an iris prior to entering the
flame region. After passing through the iris, the probe radiation is recollimated prior to entering
the flame. While useful for identification of species within the flame, FI’IR spectroscopy wilI
not yield high spatial resolution unless the IR probe beam is reduced in cross section (usually by
being passed through a set of apertures) prior to entering the flame region. This reduction in
power of the IR probe beam energy reduces the signal-to-noise ratio in the measured spectrum.
A typical experimental setup for measuring IR-absorption spectra through a flame using an FI’IR
spectrometer is shown in Figure 8.
Most commercial spectrometer systems employing broadband sources (typically FI’IR
systems) are not capable of resolving the true lineshape of an absorbing gas phase species
because of limitations to instrument resolution. The instrument yields the convolution of the true
absorbing gas lineshape and the instrument response function. Computer-based programs used
to retrieve species concentration and temperature must either take into account this convolution
17

r I Moving Mirror
F Aperture
Fixed Mirror \\ \ ;0 IR Source
Beam Splitter
Mirror Mirror
Infrared Probe Beam 11
Burner on Translating Stage
Infrared Detector
Figure 8. Experimental Apparatus for Measurement of FI’IR Absorption Spectra Through Flames. The System Is Designed to Minimize the Amount of Flame Emission That Reaches the Interferometer. The Burner Is Mounted on a Translating Stage (X and 2 Ax-) to Allow for Tomographic Analysis.
or use for calculations the instrument response-corrected peak intensity of the rovibrational
transition (A&-son and Griffiths 1975).
5. Experimental Methods .- Applications of Tunable Diode Laser Absorption Spectroscopy (TDLAS)
TDLs are semiconductor devices (typically GaAs), which are essentkilly light-emitting
diodes constructed within an optical resonator (Bomse et al. 1992). Lasing is achieved by
delivering a small current to the photodiode. Tuning is achieved by changing the temperature
18
.

and, hence, the Fermi level of the device. The tuning range varies by type, but is usually
Mween 2 cm-’ and 30 cm-‘. The useful tuning range (ie., the range over which the device may
be rapidly tuned without encountering changes in laser modes, which can mask absorption
features) is usually less than 1 cm-‘. This restricted tuning range means that the devices are not
used in a survey mode. In general, a TDL laser spectrometer system is designed to detect a
single gas using a single, specially fabricated, dedicated, laser diode. Occasionally, absorption
transitions from different gases of interest may occur within the useful tuning range of a single
laser, but such occurrences are usually fortuitous. Additionally, because of the limited tuning
range, calculation of temperature and species concentration may be dif&ult when only one line
is measured
There are, however, several advantages to using TDLs for measurement of gas phase flame
species. These include high resolution (typically better than 1 x 10S4 cm-‘), good spatial
resolution (200 ~1 to 1 mm), reasonable output power (- 1 mw), and the ability to scan over their
spectral range on a miJhsecond or better timescale. Probably, the most widely studied molecular
flame species by TDL spectroscopy is CO. In addition to the reasons for study previously
outlined in the discussion of broadband source methods, CO possesses several fundamental
(v = 0 - 1) and hot-band transitions (v = 1 - 2, v = 2 - 3), which occur within several linewidths
(approximately 0.05 cm-‘) of each other (Varghese and Hanson 1980). At room temperature,
populations of states from which hotband transitions occur are very low. However, at flame
temperatures, populations of vibrational states other than the v = 0 state may become
appreciable. When temperatures (and also species concentrations) are calculated from
simultaneous measurement of a fundamental and hotband transition, the technique is referred to
as two-line thermometry (Hanson et aL 1980).
Figure 9 shows several spectra of CO measured in a low-pressure (20 torr), stoichiometric
Cf&/& flame using mid-IR TDL spectroscopy (Daniel et al. 1996). Because the wavelength of
the diode laser radiation corresponds to single quantum numlxr changes in CO (in this case, a
v=o- landav = 1 - 2 transition) simple absorption spectroscopy may be employed. Each
spectrum is measured at a different height above the burner surface. For these experiments, the

P(H) v= l-2
P( 12) v - 2-3
s
Height above burner surface (mm)
Wavenumber (cna-I) X IO-6
Figure 9. Mid-IR TDL Spectra of CQ, Measured Through a Premixed C%/Oz Flame, at a Total Pressure of 20 Torr, as a Function of Height Above the Burner Surface. The Maximum Temperature Calculated Using Two-Line Thermometry Was 2,150 K.
probe laser beam location was fixed and the burner location was translated vertically. The IR
laser beam diameter through the flame region was 0.5 mm. As the diode laser radiation passes
through different portions of the flame, the relative areas under the two peaks corresponding to
absorption from different rovibrational levels changes. Figure 10 shows the results of fitting an
equation similar to equation (19) to an absorption spectrum from Figure 9. Using this method,
the CO vibrational temperature was calculated as a function of height above the burner surface
(‘I& = 2,150 K +/- 50 K). Additionally, tomographic analysis of the data showed that the error
from cold gas absorption for these experiments was always less than 10% of calculated
temperatures and partial pressures (McNesby et al- 1995).
TDE spectroscopy is also used for detection of many trace gas species in flames and in flame
environments. The method used for measurements of small amounts of gases (often to the ppb
range) relies on modulation spectroscopy using phase-sensitive detection. The principal
advantage to using modulation spectroscopy results from minimization of laser output noise by
20

0.80
0.95
v P12 (3,2) P18 (2,l)
I
2043.0
I 1 I
2042.8 2042.9
Frequency (cm-l)
FigurelO. A Transmission Spectrum Measured Through a Low-Pressure, Premixed CHs/O2 Flame at 20 TOIT. The Main Absorption Features Are the Two CO Lines Used to Calculate the Temperature Using the Method of Two-Line Therrnometry. Calculated Temperature Was 2,150 K.
shifting detection to high frequencies (Bomse et al 1992). When phase-sensitive detection is
employed using TDLs, the second derivative of the diode laser probe beam intensity with respect
to wavelength is usually measured, since the wavelength at which the second derivative is a
maximum coincides with the wavelength of maximum light absorption. The second derivative
signal peak height may be shown (Reid and Labrie 198 I) to be proportional to absorbance, A:
X’lV=kA. (20)
Here, X” is the peak height of the second derivative signal (volts), V is the direct-current
(DC) voltage measured by the detector in the absence of any molecular absorbance, and k is a
constant that includes the measuring instrument and optics function. Letting S, denoted as 2f
signal peak height (peak to trough height, the distance between the maximum and minimum
points on the 2f signal, see Figure 11 [cl), equal X”/V, yields
S = (ka) LP. (21)
21

2F DETECTION FOR TRACE GAS MEASUREMENT
a
7665.5 7665.51 7005.52 7665.53 7665.54 7665.55 7665.56
Wavenumber (cm-l)
Figure 11. Simulated Signal vs. Wavelength of Laser Radiation After Passing Through a Gas With an Absorption Feature Near 7665.5 cm-’ Graphs for (a) Unmodulated Laser Radiation; (b) Laser Radiation With a Small-Amplitude, High-Frequency Modulation; and (c) Demodulation at Twice the High-Frequency Modulation in (b).
The slope of a plot of LP vs. S provides the value of kcl. A calibration of the system using
known concentrations of the absorbing gas must be performed to determine the value of kcr.
Once this value is known, gas pressure (P) may be obtained directly from equation (21). Care
must be exercised so that changes in optical surfaces during measurement (as when measuring
corrosive gases such as HF) do not affect the value of ka, since this value is instrument function
dependent. For this reason, calibration should be petiorrned at the beginning and end of each
measurement set. Additionally, for gas concentrations that attenuate more than 5% of the
incident light, the linear relationship between gas pressure and 2f Signal peak height may no
longer hold (Miller et al. 1993).
Modulation spectroscopy using TDLs (often referred to as 2f spectroscopy) has been
extensively discussed in the literature (Fried et al. 1998). Figure 11 gives a generic description
22

of the signal processing employed in these experiments. Briefly, the laser output wavelength is
scanned (10 Hz to10 kHz) through a spectral region where the gas being measured absorbs. The
output at the detector during the laser scan (with the high-frequency modulation turned off) may
be seen in the upper trace of Figure 11. A high-frequency (10 kHz to MHz) wavelength
modulation with an amplitude approximately equal to the linewidth under investigation is
superimposed on the laser drive current (middle trace in Figure 11). Demodulation at twice the
frequency of the high-freq uency laser drive modulation yields the second derivative signal
shown in the lower trace in Figure 11. It should be noted that the upper trace in Figure 11 shows
that the laser diode output power has a nonlinear dependence on laser drive current. While this is
nonideal behavior, this is a common trait of commercially available laser diodes. The nonlinear
power output dependence on laser drive current (exaggerated here for illustration) causes the
sloping baseline for the second derivative signal in Figure 11. For measurements at extremely
low concentrations or for gases with small absorption cross sections, the nonlinearity of laser
diode output power with laser drive current may affect limits of detection.
Modulation spectroscopy enables discrimin ation against contributions to light attenuation by
scattering from particulate matter using a single laser beam. Attenuation of laser radiation by a
rovibrational transition of a small gas molecule is detected because the wavelength range of the
scan is several times the width of the spectral absorption feature (typically on the order of
0.1 cm-’ at atmospheric pressure). Because light scattering by particulate matter is nearly
constant over the very small wavelength range of the laser scan, the change in detector signal
intensity with the change in wavelength is effectively zero in the absence of any absorbing gas.
However, because the 2f signal is also proportional to the background signal intensity, the
second derivative signal is divided by the DC signal to account for light scattering by particles.
While modulation techniques enable trace gas detection, special care must be exercised when
making measurements in flames, especially when using near-m laser radiation. Significant
errors in measured concentrations may arise because of beam steering as the laser radiation
passes through the flame. In some cases, the beam steering may be severe enough to cause loss
of signal at the detector. Secondly, great care must be exercised when measuring 2f spectra
23

through regions of tiering temperature and pressure, since the 2f signal is extremely sensitive
to changes in linewidth of the absorbing species (Reid and Labrie 1981).
6. Conclusion
IR spectroscopy continues to be a valuable tool for measuring species concentrations and
temperatures in flames and combustion gases, especially in field-based studies. The advent of
compact, fiber-coupled TDLs operating at room temperature is expanding the use of vibrational
spectroscopy kyond the laboratory and providing a useful complement to broadband methods
currently in place.
24

7. References
Anderson, R. J., and P. R. Gtiths. “Errors in Absorbance Measurements in Infrared Fourier Transform Spectrometry Because of Limited Instrument Resolution.” Analytical Chemistry, vol. 47, pp. 2339-2347,1975.
Anderson, R. J., and P. R. Griffiths. “Determination of Rotational Temperatures of Diatomic Molecules From Absorption Spectra Measured at M&rate Resolution.” Journal of Quantitative Spectroscopy and Radiative Tran$er, vol. 17, pp. 393-401, 1977.
Bames, A. J., and W. J. -e-Thomas (editors). Vibrational Spectroscopy - Modern Trends. Amsterdam: Elsevier Scientific Publishing Company, 1977.
~ Bernath, P. F. Spectra of Atoms and Molecules. New York: Oxford University Press, 1995.
Best, P. E., P. L. Chien, R. M. Carangelo, P. R. Solomon, M. Dan&k, and I. Ilovici ‘Tomographic Reconstruction of FI-IR Emission and Transmission Spectra in a Sooting Iamirar Diffusion Flame: Species Concentrations and Temperatures, Combustion and Flame.” Vol. 85, pp. 309-318, 1991.
Bomse, D. S., D. C. Hovde, D. B. Oh, J. A. Silver, and A. C. Stanton. ‘Diode Laser Spectroscopy for On-Line Chemical Analysis.” Optically Based Methods for Process AnaZysis. D. S. Bomse, H. Brittain, S. Farquharson, J. M. Lerner, A. J. Rein, C. Sohl, T. R. Todd, and L. Weyer (editors), Proceedings of SPIE, vol. 1681, pp. 138-148,1992.
Daily, J. W. “Iaser Induced Fluorescence Spectroscopy in Flames.” Progress in Energy and Combustion Science, VOL 23, pp. 133-199,1997.
Daniel, R. G., K L. McNesby, and A. W. Miziolek. ‘The Application of Tunable Diode Laser Diagnostics for Temperature and Species Concentration Profiles of Inhibited Low Pressure Flames.” Applied Optics, vol. 35, 1996.
Dasch, C. H. “One-Dimensional Tomography: A Comparison of Abel, Onion-Peeling, and Filtered Backprojection Methods.” Applied Optics, voL 31, pp. 11461152,1992.
Fried, A., B. Henry, B. Wert, S. Sewell, and J. R. Drummond. ‘Laboratory, Ground-Based, and Airborne Tunable Diode Laser Systems: Performance Characteristics and Applications in Atmospheric Studies.” Applied Physics B, voL 67, pp. 317-330,1998.
Gaydon, A. G. Spectroscopy and Combustion Theory. London: Chapman and Hall, Ltd, p. 129, 1948.
r Gaydon, A. G., and H. G. Wolfhard. Flames: Their Structure, Radiation, and Temperature.
London: Chapman and Hall, Ltd., 1953.
25

Gaydon, A. G. The Spectroscopy of FZames. London: Chapman and Hall, Ltd., 2nd Edition, 1974.
Grifliths, P. R., and J. A. de Haseth, “Fourier Transform Infrared Spectroscopy.” New York, NY: Wiley, 1986.
Hanson, R. K., P. L. Varghese, S. M. Schoenung, and P. K Falcone. “Absorption Spectroscopy of Combustion Gases Using a Tunable IR Diode Laser.” Laser Probes for Combustion Chemistry, D. R. Crosley (editor), ACS Symposium Series 134, American Chemical Society, Washington, DC, 1980.
Hertzberg, G. “Spectra of Diatomic Molecules.” New York, NY: Van Nostrand & Co., 1950a
Hertzberg, G. ‘Electronic Spectra of Polyatomic Molecules.” New York, NY: Van Nostrand & Co., 1950b.
Limbaugh, C. C. ‘The Infrared Emission-Absorption Method for Temperature and Species Partial Pressure Determination in Flames and Plumes.” ’ Infrared Methods for Gaseous Measurements, J, Wormhoudt (editor), New York, NY: Marcel Dekker, Inc., 1985.
McNesby, K. L., R. G. Daniel, and A. W. Miziolek. “Tomographic Analysis of CO Absorption in a Low-Pressure Flame.” Applied Optics, vol. 34, pp. 3318-24, 1995.
McNesby, K. &, R. G. Daniel, J. M. Widder, and A. W. Miziolek. “Spectroscopic Investigation of Atmospheric Diffusion Flames Inhibited by Halons and Their Alternatives.” Applied Spectroscopy, vol. 50, p. 126,1996.
Miller, J. H., S. Elreedy, B. Ahvazi, F. Woldu, and P. Hassanzadeh. ‘Tunable Diode-Laser Measurement of Carbon Monoxide Concentration and Temperature in a Laminar Methane-Air Diffusion Flame.” Applied Optics, vol. 32, pp. 6082-6089, 1993.
Moore, W. J. Physical Chemistry. New Jersey: Prentice-Hall, Inc., Fourth Edition, 1972.
Oppenheim, U. P. “Spectral Emissivity of the 4.3~ Coz Band at 1,200 IL” Ninth Symposium (International) on Combustion, pp* 96101, New York, NY: Academic Press, 1963.
Penner, S. S. Quantitative Molecular Spectroscopy and Gas Emissivities. Reading, MA: Addison-Wesley Publisher Co., 1959.
Reid, J., and D. Labrie. “Second Harmonic Detection With Tunable Diode Lasers - Comparison of Experiment and Theory.” Applied Physics B, vol. 26, pp* 20>210, 1981.
Silver, J. A. “Frequency Modulation Spectroscopy for Trace Species Detection: Theory and Comparison Among Experimental Methods.” AppZied Optics, vol. 31, pp. 707-717, 1992.
Steinfeld, J. I. Molecules and Radiation. New York, NY: Harper and Row, 1974.
26

Townes, C. H., and A. L. Schawlow. Microwave Spectroscopy. New York, NY: McGraw-Hill, 1955.
Vanderhoff, J. A., S. H. Modiano, B. E. Homau, and M. W. Teague. ‘Overtone Absorption Spectroscopy of Solid Propellant Flames: CO and N20 Concentrations.” Challenges in Propellants and Combustion 100 Years Afier Nobel, pp. 876-884, K K Kuo (editor), New York, NY: Begell House, Inc., 1997.
Varghese, P. L., and R. K Hanson. ‘“Tunable Ir&red Diode Laser Measurements of Line S~ngths and Collision Widths of 12C160 at Room Temperahue.” JhrnaZ of Quantitative Spectroscopy &Radiative Transfer, vol. 24, p. 279,198O.
Wilson, E. B., J. C. De&s, and P. C. Cross. Molecular Vibrations. New York, NY: McGraw- Hill co., 1955.
Wormhoudt, J. A., and J. A. Conant. “High Resolution Infrared Emission Studies From Gaseous Sources.” Infrared Methods for Gaseous Measurements, pp. l-45, J. Wormhoudt (editor), New York, NY: Marcel Dekker, Ix., 1985.
27

~NTIONALLY LEFTBLANK.
28

NO. OF ORGANIZATION COPIES
2 DEFENSE TECHNICAL INFORMATION CENTER DTIC DDA 8725 JOHN J KINGMAN RD STE 0944 FT BELVOIR VA 22060-6218
1 HQDA DAM0 FDT 400 ARMY PENTAGON WASHINGTON DC 203 1 O-0460
1 OSD OUSD(A&T)/ODDDR&E(R) RJTREW THE PENTAGON WASHINGTON DC 20361-7100
1 DPTY CG FOR RDA US ARMY MATERIEL CMD AMCRDA 5001 EISENHOWER AVE ALEXANDRIA VA 22333-0001
1 INST FOR ADVNCD TCHNLGY THE UN’IV OF TEXAS AT AUSTIN PO BOX 202797 AUSTIN TX 78720-2797
1 DARPA B KASPAR 3701 N FAIRFAX DR ARLINGTON VA 22203-1714
1 US MILITARY ACADEMY MATH SC1 CTR OF EXCELLENCE MADNMATH MAJ HUBER THAYERHALL WEST POINT NY 10996-17X6
NO. OF ORGANIZATION COPIES
1 DIRECTOR US ARMY RESEARCH LAB AMSRL DD 2800 POWDER MILL RD ADELPHI MD 20783-l 197
1 DIRECTOR US ARMY RESEARCH LAB AMSRL CI AI R (RECORDS MGMT) 2800 POWDER MILL RD ADELPHI MD 20783-l 145
3 DIRECTOR US ARMY RESEARCH LAB AMSRL CI LL 2800 POWDER MILL RD ADELPHI MD 20783-l 145
1 DIRECTOR US ARMY RESEARCH LAB AMSRL CI AP 2800 POWDER MILL RD ADELPHI MD 20783-l 197
ABERDEEN PROVING GROUND
4 DIR USARL AMSRL CI LP (BLDG 305)
1 DIRECTOR US ARMY RESEARCH LAB AMSRL D D R SMITH 2800 POWDER MILL RD ADELPHI MD 20783- 1197
29

NO. OF ORGANIZATION COPES
ABERDEEN PROVING GROUND
20 DIR USARL AMSRL WM BD
B E FORCH W R ANDERSON SWBUNTE C F CHABALGWSKI A COHEN R DANIEL D DEVYNCK RAFIF%R BEHOMAN AJKOTLAR K L MCNESBY M MCQUAID MSMILLER A W MXZIOLEK J B MORRIS R A PESCE-RODRIGUEZ BMRICE R C SAUSA M A SCHROEDER J A VANDERHOFF
30

ure Measurement Using Vibrational Spectroscopy
Kevin McNesby
Akrdeen Roving Ground, MD 210055066
Qproved for public release; diseibution is unlimited. 12b. DlSTRIBUllON COE
3. AliEnAm- aDo-1 An overview of the application of vibrational spectroscopy to the study of flames is provided. ‘Ihe mathematics oi
n-on of flame spectra for determination of species concentration and temperahue are hoduced, The history If the application of vibrational spectroscopy to the study of flames is briefly summarkd. Applications of methods ting dispersive ahorption and emission spectroscopy and of methods using tunable diode lasers (TDL.s) to the study d flame systems are discussed.
l4.&mJEcrlERys
ribxational spectfoscopy,flames. infrared, temmture measurement 15. NUMBER OF PAGES
3s 16. PREE eo#
7. SIEWRITV cLMLGIFIcAnot4 16. same CusslFlcAnofd 16. sa.mm -wmotd 39, IJMlTAlWN Of ABSTRACT 0FREmR-r OFTHIS PAOE OFABSTR*m
UNCLASSIFIED UNCLASSIFIED UNCLASSIFIED UL c-d*d La- P.-ha m-. n -\
31 *mIvalY rv,,,, LJO ,-. r-oa, Prescdbd byANSlSW.23818 298-102

INTENTIONALLY LEFT BLANK.
32

USER EVALUATION SHEET/CHANGE OF ADDRESS
This Laboratory undertakes a continuing effort to improve the quality of the reports it publishes+ Your comments/answers to the items/questions below will aid us in our efforts.
1 _ ARL Report Number/Author ARL-TR-2378 (McNesby) Date of Report January 2001
2. Date Report Received
3. Does this report satisfy a need? (Comment on purpose, related project, or other area of interest fur which the report will be
4. Specifically, how is the report being used? (Information source, design data, procedure, source of ideas, etc.)
5. Has the information in this report led to any quantitative savings as far as man-hours or dollars saved, operating costs avoided, or efficiencies achieved, etc? If so, please elaborate.
6. General Comments. What do you think should be changed to improve future reports? (Indicate changes to organization,
technical content, format, etc.)
CURRENT ADDRESS
Organization
Name E-mail Name
Street or P.O. Box No.
City, State, Zip Code
7. If indicating a Change of Address or Address Correction, please provide the Current or Correct address above and the Old or
Incorrect address below.
Organization
OLD ADDEXSS
Name
Street or P.O. Box No.
City, State, Zip Code
(Remove this sheet, fold as indicated, tape closed, and mail.) (DO NOT STAPLE)

DEPARTMENTOFTfiE ARMY
OFFICIAL BUSINESS
UNITED STATES
FIRST CLASS PERMIT NO 0001 ,APG,MD
POSTAGE WILL BE PAID BY ADDRESSEE
DIRECTOR US ARMY RESEARCH LABORATORY -
Al-TN AMSRL WM BD ABERDEEN PROVING GROUND MD 21005-5066