fixed index annuity – hedging and risk management arsen ... · equity-based insurance guarantees...
TRANSCRIPT

Equity-Based Insurance Guarantees Conference
Nov. 6-7, 2017
Baltimore, MD
Fixed Index Annuity – Hedging and Risk Management
Arsen Arutyunov, Pawel Konieczny
Sponsored by

Fixed Index Annuity –Hedging and Risk ManagementARSEN ARUTYUNOV, ASA
Session 2A: 1300 – 1530 hours
6 November 2017
PAWEL KONIECZNY, PHD, CFA, FRM

Agenda
• Introduction
• Industry survey• Background
• Common hedging practices
• Instrument exposure overview
• Closing remarks
2

INDUSTRY SURVEY

SURVEY BACKGROUND
• 12 companies contributed to the industry survey through an interview format, representing 65% of market share on FIA new sales
• Here are some key characteristics of the 12 participants:
• Most participants are ranked in LIMRAS top-20 list of highest annual FIA premium
• Most participants considered fixed index annuities (FIA) as their core product
• All individuals interviewed occupy a managerial role and oversee the hedging operation
• A total of 11 questions were asked around companies’ core hedging practice and strategies
4

5
CORE HEDGING STRATEGY
0%
5%
10%
15%
20%
25%
30%
0
1
2
3
4
5
6
7
StaticStaticStaticStatic Static w/Dynamic OverlayStatic w/Dynamic OverlayStatic w/Dynamic OverlayStatic w/Dynamic Overlay DynamicDynamicDynamicDynamic
% o
f M
ark
et
Sha
re%
of
Ma
rke
t Sh
are
% o
f M
ark
et
Sha
re%
of
Ma
rke
t Sh
are
Nu
mb
er
of
Pa
rtic
ipa
nts
Nu
mb
er
of
Pa
rtic
ipa
nts
Nu
mb
er
of
Pa
rtic
ipa
nts
Nu
mb
er
of
Pa
rtic
ipa
nts
Number of Companies % of Market Shares
RemarksRemarksRemarksRemarks
• The majority of participates deem static hedging with dynamic overlay as their core hedging strategies.
• Of the participants employing static with dynamic overlay strategy, a reported range of 50%-95% of issued account value (i.e. notional) are matched with a derivative of equivalent terms.
• On the contrary, some large FIA writers heavily utilize strictly static or pure dynamic hedging strategies for their FIA business.
DefinitionsDefinitionsDefinitionsDefinitions
StaticStaticStaticStatic: Under this strategy, the company will attempt to match the cash flows of issued liabilities (adjusted for expected decrements) with a derivative of equivalent terms.
Static with a Dynamic Overlay (DO)Static with a Dynamic Overlay (DO)Static with a Dynamic Overlay (DO)Static with a Dynamic Overlay (DO): Under this strategy, the company will match all issued liabilities (adjusted for expected decrements) up to a certain % of Account Value. The portfolio of liabilities and hedges is then rebalanced dynamically according to pre-defined Greeks.
DynamicDynamicDynamicDynamic: Under this strategy, the company will attempt to match the Greek profile of outstanding liabilities with offsetting hedge transactions.

FREQUENCY TO STRIKE AND HEDGE POLICIES
6
DefinitionsDefinitionsDefinitionsDefinitions
• Depending on the lag, the company will be exposed to basis risk due to the difference in the policy strike value and the hedge strike value.
• Of the participants who employ a dynamic component as part of their current strategy have admitted that they will rebalance their
exposure daily (or depending on predetermined limits). The lag component pertains to the static component of the core hedging strategy.
0
1
2
3
4
5
6
7
8
9
10
Daily Weekly Bi-Weekly
He
dge
Sch
ed
ule
He
dge
Sch
ed
ule
He
dge
Sch
ed
ule
He
dge
Sch
ed
ule
Strike FrequencyStrike FrequencyStrike FrequencyStrike Frequency
Same Day 1 Day Lag 1 Week Lag
Same day hedge scheduleSame day hedge scheduleSame day hedge scheduleSame day hedge schedule
• Majority of participants hedge on the same day as
they strike
• Clients with high daily volumes can employ a same
day hedge program to minimize basis risk
Lagged hedge scheduleLagged hedge scheduleLagged hedge scheduleLagged hedge schedule
• Participants who do not have a large trade volume
will tend to defer trading until enough exposure has
been accumulated to justify placing a hedge with a
counterparty
• Participants acknowledged that some basis risk
exists when employing a lag, but have deemed the
risk to be unbiased

COMPOSITES OF HEDGE PORTFOLIO
7
RemarksRemarksRemarksRemarks
• All participants leveraged OTC derivatives as part of their hedging programs
• Participants who have a large dynamic component as part of their strategy mentioned that they utilize
listed options to manage their near term exposure
• Equity futures are favored for dynamic hedgers to manage residual exposures
0
2
4
6
8
10
12
14
OTCOTCOTCOTC Equity FuturesEquity FuturesEquity FuturesEquity Futures Listed OptionsListed OptionsListed OptionsListed Options FLEX OptionsFLEX OptionsFLEX OptionsFLEX Options OtherOtherOtherOther
Nu
mb
er
of
Pa
rtic
ipa
nts
Nu
mb
er
of
Pa
rtic
ipa
nts
Nu
mb
er
of
Pa
rtic
ipa
nts
Nu
mb
er
of
Pa
rtic
ipa
nts
17%
42%
25%
8%
8%
Numbers of Derivative CategoriesNumbers of Derivative CategoriesNumbers of Derivative CategoriesNumbers of Derivative Categories
1
2
3
4
5

ADJUSTMENTS TO HEDGE TARGETS
FOR LIVING BENEFIT RIDERS
8
RemarksRemarksRemarksRemarks
Participants who are making an adjustment cited the following reasons:
• More accurate view of the forward liability.
Participants who are not making an adjustment, mentioned that they are currently not actively monitoring the
market risk / sensitivity of the living benefits offered on the base contract.
• Most participants agreed that taking a proactive approach to measuring this exposure is on their “to-do”
list
25%
75%
Are you incorporating the living benefit premium in the expected decrement value
used to derive the hedge value?
Yes
No

9
17%
83%
Yes No
UNHEDGED LIABILITIES
DefinitionsDefinitionsDefinitionsDefinitions
YesYesYesYes: Depending on the materiality of a given liability cohort, the company may leave this cohort or certain risks of the cohort unhedged
No: No: No: No: All liability cohorts are categorized into similar risk groups and hedged
RemarksRemarksRemarksRemarks
• Common rationale for leaving a particular cohort unhedged was due to cost and low liquidity associated with placing a hedge.
• In all cases when respondents who decided to leave a cohort unhedged mentioned that their companies’ macro-hedge program would eventually account for any residual risk left by the outstanding cohort.
• Mark-to-market valuations are done to determine the current exposure of any residual/unhedged risks.
• All participants commented that in instances when hedges cannot be grouped is similar risk, some form of cross-hedging was performed.

RISK METRICS
10
RemarksRemarksRemarksRemarks
• Most common risk metrics observed are: Greek sensitivity and mismatch & mark-to-market value of
liabilities and hedges.
• A common focus across all participants on their Greek exposure is inline with the overall trend observed
to employ a more dynamic strategy.
• Few participants mentioned that they utilize VaR to measure their tail exposure, and depending if limits
are breach will take action to rebalance their position.
0
2
4
6
8
10
12
MtM GreeksMtM GreeksMtM GreeksMtM Greeks MtM ValueMtM ValueMtM ValueMtM Value Stress TestsStress TestsStress TestsStress Tests PnLPnLPnLPnL VaRVaRVaRVaR
Nu
me
rix
of
Pa
rtic
ipan
tsN
um
eri
x o
f P
art
icip
ants
Nu
me
rix
of
Pa
rtic
ipan
tsN
um
eri
x o
f P
art
icip
ants
42%
8%
17%
25%
8%
Number of Risk MetricsNumber of Risk MetricsNumber of Risk MetricsNumber of Risk Metrics
2
1
5
3
4

OTHER KEY TOPICS SURVEYED
11
RemarksRemarksRemarksRemarks.
• Most respondents employ a reactive approach to set
rates based on current prevailing / most recently
known dealer quotes.
• Others utilize a proprietary model that will estimate
future option prices offered by dealers
0 1 2 3 4 5 6 7 8 9
PredictivePredictivePredictivePredictive
ReactiveReactiveReactiveReactive
Number of ParticipantsNumber of ParticipantsNumber of ParticipantsNumber of Participants
At a high level, which would best describe your
current approach for setting CAP and PAR rates
on newly issued policies?
RemarksRemarksRemarksRemarks
• Most participants are satisfied with their current
offering of hybrid indices.
• A few participants did respond that they would like
to offer more strategies that can add value to their
policyholders via a hybrid index.
• No participants seek to decrease offering to hybrid
indices.
IncreaseIncreaseIncreaseIncrease
33%33%33%33%
No ChangeNo ChangeNo ChangeNo Change
67%67%67%67%
DecreaseDecreaseDecreaseDecrease
0%0%0%0%
For the foreseeable future, are you looking to
increase or decrease your exposure to hybrid
indices?

HEDGING STRATEGY EVOLUTION TREND
12
RemarksRemarksRemarksRemarks
• Most participants expressed intentions or interests to move onto a more dynamic hedging approach
• to accommodate evolving product designs
• to improve hedging efficiency when prevailing dealer rates are deemed to be high
• One participant mentioned that they would like to focus more on managed strategies (e.g. smart beta) as a way of enhancing their portfolio
DefinitionsDefinitionsDefinitionsDefinitions
StaticStaticStaticStatic: Under this strategy, the company will attempt to match the cash flows of issued liabilities (adjusted for expected decrements) with a derivative of equivalent terms.
Static with a Dynamic OverlayStatic with a Dynamic OverlayStatic with a Dynamic OverlayStatic with a Dynamic Overlay: Under this strategy, the company will match all issued liabilities (adjusted for expected decrements) up to a certain % of Account Value. The portfolio of liabilities and hedges is then rebalanced dynamically according to pre-defined Greeks.
DynamicDynamicDynamicDynamic: Under this strategy, the company will attempt to match the Greek profile of outstanding liabilities with offsetting hedge transactions.
0 1 2 3 4 5 6 7
Static
Static w/ Dynamic Overlay
Dynamic
Number of ParticipantsNumber of ParticipantsNumber of ParticipantsNumber of Participants
More Dynamic No Change More Static

COMMON FIA HEDGE
INSTRUMENTS

14
ExampleExampleExampleExample
• Payoff definition:
• max (0, � − �)• Crediting methodologies hedged
• Annual Point-to-Point with a
participation rate
• Using a generic outer loop with daily
time-steps, simulate an ATM
European Call option with the
following terms:
• $1,000,000 in Notional
• 1yr term.
• Plot the Delta and Gamma values
across time for all scenarios.
ResultsResultsResultsResults
• Delta is strictly positive, and will grow
with the underlying.
• Gamma is strictly positive, can
become explosive when the option
approaches maturity and the spot
level is close the strike.
0
20000
40000
60000
80000
100000
120000
140000
6/3
0/2
01
7
7/1
2/2
01
7
7/2
1/2
01
7
8/1
/20
17
8/1
0/2
01
7
8/2
1/2
01
7
8/3
0/2
01
7
9/1
1/2
01
7
9/2
0/2
01
7
9/2
9/2
01
7
10
/10
/20
17
10
/19
/20
17
10
/30
/20
17
11
/8/2
01
7
11
/17
/20
17
11
/29
/20
17
12
/8/2
01
7
12
/19
/20
17
12
/29
/20
17
1/1
0/2
01
8
1/2
2/2
01
8
1/3
1/2
01
8
2/9
/20
18
2/2
1/2
01
8
3/2
/20
18
3/1
3/2
01
8
3/2
2/2
01
8
4/3
/20
18
4/1
2/2
01
8
4/2
3/2
01
8
5/2
/20
18
5/1
1/2
01
8
5/2
2/2
01
8
6/1
/20
18
6/1
2/2
01
8
Call – Delta Profile
0
10000
20000
30000
40000
50000
60000
70000
6/3
0/2
01
7
7/1
2/2
01
7
7/2
1/2
01
7
8/1
/20
17
8/1
0/2
01
7
8/2
1/2
01
7
8/3
0/2
01
7
9/1
1/2
01
7
9/2
0/2
01
7
9/2
9/2
01
7
10
/10
/20
17
10
/19
/20
17
10
/30
/20
17
11
/8/2
01
7
11
/17
/20
17
11
/29
/20
17
12
/8/2
01
7
12
/19
/20
17
12
/29
/20
17
1/1
0/2
01
8
1/2
2/2
01
8
1/3
1/2
01
8
2/9
/20
18
2/2
1/2
01
8
3/2
/20
18
3/1
3/2
01
8
3/2
2/2
01
8
4/3
/20
18
4/1
2/2
01
8
4/2
3/2
01
8
5/2
/20
18
5/1
1/2
01
8
5/2
2/2
01
8
6/1
/20
18
6/1
2/2
01
8
Call – Gamma Profile
EUROPEAN CALL
High positive gamma when spot
level approaches the strike at
maturity.

CALL SPREAD
15
ExampleExampleExampleExample
• Payoff definition
• max (0, min ���, ������
− 1 )• Crediting methodologies hedged
• Annual Point-to-Point with a
cap rate
• Using a generic outer loop with daily
time-steps, simulate a Call Spread
with the following terms:
• 7.25% CAP
• $1,000,000 in Notional
• 1yr term
• Plot the Delta and Gamma values
across time for all scenarios.
ResultsResultsResultsResults
• Call spread delta is again strictly
positive, and shows a more subdued
Delta profile.
• Call spread gamma can be explosive in
both positive and negative directions,
which can potentially make hedging
more difficult.
0
10000
20000
30000
40000
50000
60000
70000
80000
90000
6/3
0/2
01
7
7/1
2/2
01
7
7/2
1/2
01
7
8/1
/20
17
8/1
0/2
01
7
8/2
1/2
01
7
8/3
0/2
01
7
9/1
1/2
01
7
9/2
0/2
01
7
9/2
9/2
01
7
10
/10
/20
17
10
/19
/20
17
10
/30
/20
17
11
/8/2
01
7
11
/17
/20
17
11
/29
/20
17
12
/8/2
01
7
12
/19
/20
17
12
/29
/20
17
1/1
0/2
01
8
1/2
2/2
01
8
1/3
1/2
01
8
2/9
/20
18
2/2
1/2
01
8
3/2
/20
18
3/1
3/2
01
8
3/2
2/2
01
8
4/3
/20
18
4/1
2/2
01
8
4/2
3/2
01
8
5/2
/20
18
5/1
1/2
01
8
5/2
2/2
01
8
6/1
/20
18
6/1
2/2
01
8
Call Spread – Delta Profile
-80000
-60000
-40000
-20000
0
20000
40000
60000
80000
6/3
0/2
01
7
7/1
2/2
01
7
7/2
1/2
01
7
8/1
/20
17
8/1
0/2
01
7
8/2
1/2
01
7
8/3
0/2
01
7
9/1
1/2
01
7
9/2
0/2
01
7
9/2
9/2
01
7
10
/10
/20
17
10
/19
/20
17
10
/30
/20
17
11
/8/2
01
7
11
/17
/20
17
11
/29
/20
17
12
/8/2
01
7
12
/19
/20
17
12
/29
/20
17
1/1
0/2
01
8
1/2
2/2
01
8
1/3
1/2
01
8
2/9
/20
18
2/2
1/2
01
8
3/2
/20
18
3/1
3/2
01
8
3/2
2/2
01
8
4/3
/20
18
4/1
2/2
01
8
4/2
3/2
01
8
5/2
/20
18
5/1
1/2
01
8
5/2
2/2
01
8
6/1
/20
18
6/1
2/2
01
8
Call Spread – Gamma Profile
High negative gamma when spot
level approaches the CAP at
maturity.
Delta is bounded, reaches
maximum when spot level is
between long leg and short leg.
High positive gamma when spot
level approaches strike of the long
leg at maturity.
CALL SPREAD
with buffer
16
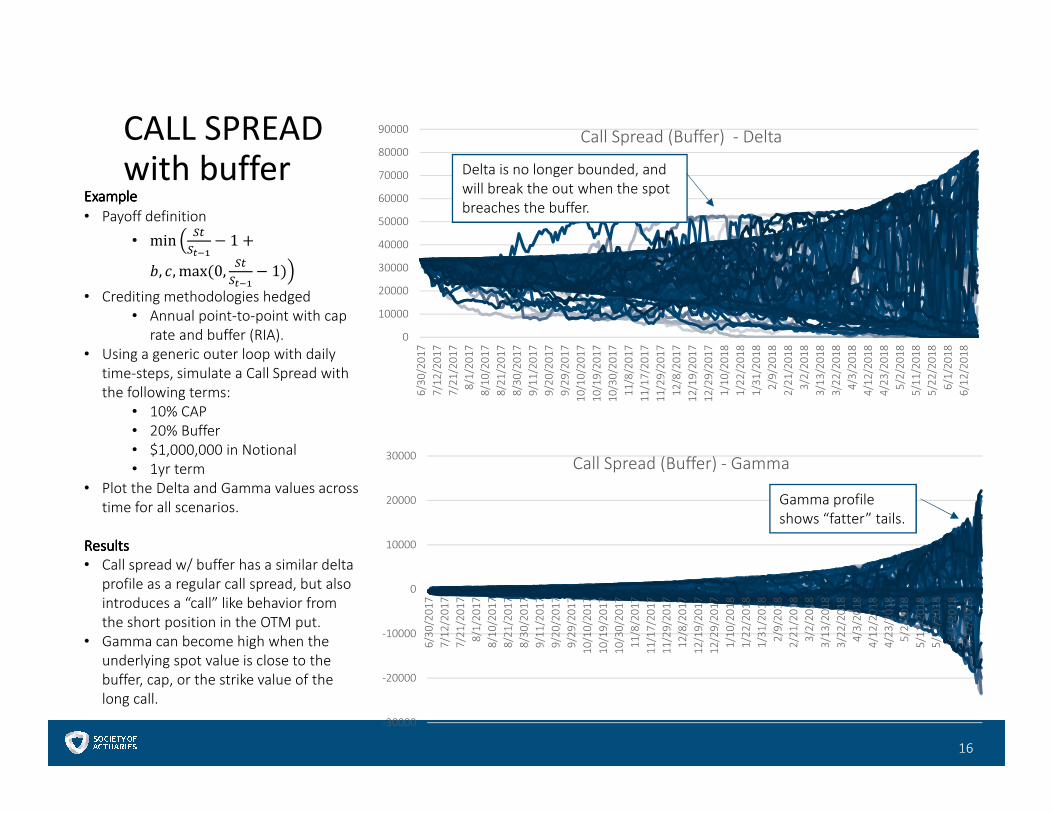
ExampleExampleExampleExample
• Payoff definition
• min � ������
− 1 +�, �, max (0, ��
����− 1)�
• Crediting methodologies hedged
• Annual point-to-point with cap
rate and buffer (RIA).
• Using a generic outer loop with daily
time-steps, simulate a Call Spread with
the following terms:
• 10% CAP
• 20% Buffer
• $1,000,000 in Notional
• 1yr term
• Plot the Delta and Gamma values across
time for all scenarios.
ResultsResultsResultsResults
• Call spread w/ buffer has a similar delta
profile as a regular call spread, but also
introduces a “call” like behavior from
the short position in the OTM put.
• Gamma can become high when the
underlying spot value is close to the
buffer, cap, or the strike value of the
long call.
0
10000
20000
30000
40000
50000
60000
70000
80000
90000
6/3
0/2
01
7
7/1
2/2
01
7
7/2
1/2
01
7
8/1
/20
17
8/1
0/2
01
7
8/2
1/2
01
7
8/3
0/2
01
7
9/1
1/2
01
7
9/2
0/2
01
7
9/2
9/2
01
7
10
/10
/20
17
10
/19
/20
17
10
/30
/20
17
11
/8/2
01
7
11
/17
/20
17
11
/29
/20
17
12
/8/2
01
7
12
/19
/20
17
12
/29
/20
17
1/1
0/2
01
8
1/2
2/2
01
8
1/3
1/2
01
8
2/9
/20
18
2/2
1/2
01
8
3/2
/20
18
3/1
3/2
01
8
3/2
2/2
01
8
4/3
/20
18
4/1
2/2
01
8
4/2
3/2
01
8
5/2
/20
18
5/1
1/2
01
8
5/2
2/2
01
8
6/1
/20
18
6/1
2/2
01
8
Call Spread (Buffer) - Delta
Delta is no longer bounded, and
will break the out when the spot
breaches the buffer.
-30000
-20000
-10000
0
10000
20000
30000
6/3
0/2
01
7
7/1
2/2
01
7
7/2
1/2
01
7
8/1
/20
17
8/1
0/2
01
7
8/2
1/2
01
7
8/3
0/2
01
7
9/1
1/2
01
7
9/2
0/2
01
7
9/2
9/2
01
7
10
/10
/20
17
10
/19
/20
17
10
/30
/20
17
11
/8/2
01
7
11
/17
/20
17
11
/29
/20
17
12
/8/2
01
7
12
/19
/20
17
12
/29
/20
17
1/1
0/2
01
8
1/2
2/2
01
8
1/3
1/2
01
8
2/9
/20
18
2/2
1/2
01
8
3/2
/20
18
3/1
3/2
01
8
3/2
2/2
01
8
4/3
/20
18
4/1
2/2
01
8
4/2
3/2
01
8
5/2
/20
18
5/1
1/2
01
8
5/2
2/2
01
8
6/1
/20
18
6/1
2/2
01
8
Call Spread (Buffer) - Gamma
Gamma profile
shows “fatter” tails.

ASIAN OPTION
17
ExampleExampleExampleExample
• Payoff definition:
• max (0, ∑ ���� − �)
• Crediting methodologies hedged
• Monthly averaging
• Using a generic outer loop with daily
time-steps, simulate a Asian option
using following terms:
• $1,000,000 in Notional
• 1yr term
• Fixed strike & arithmetic mean
• Plot the Delta and Gamma values
across time for all scenarios.
ResultsResultsResultsResults
• A natural property of an averaging
option is that it’s price becomes more
certain through passage of time.
• Delta and Gamma profiles both reflect
the price stability that this option
exhibits leading up to maturity.
0
2000
4000
6000
8000
10000
12000
14000
6/3
0/2
01
7
7/1
2/2
01
7
7/2
1/2
01
7
8/1
/20
17
8/1
0/2
01
7
8/2
1/2
01
7
8/3
0/2
01
7
9/1
1/2
01
7
9/2
0/2
01
7
9/2
9/2
01
7
10
/10
/20
17
10
/19
/20
17
10
/30
/20
17
11
/8/2
01
7
11
/17
/20
17
11
/29
/20
17
12
/8/2
01
7
12
/19
/20
17
12
/29
/20
17
1/1
0/2
01
8
1/2
2/2
01
8
1/3
1/2
01
8
2/9
/20
18
2/2
1/2
01
8
3/2
/20
18
3/1
3/2
01
8
3/2
2/2
01
8
4/3
/20
18
4/1
2/2
01
8
4/2
3/2
01
8
5/2
/20
18
5/1
1/2
01
8
5/2
2/2
01
8
6/1
/20
18
6/1
2/2
01
8
Asian - Delta
0
200
400
600
800
1000
1200
6/3
0/2
01
7
7/1
2/2
01
7
7/2
1/2
01
7
8/1
/20
17
8/1
0/2
01
7
8/2
1/2
01
7
8/3
0/2
01
7
9/1
1/2
01
7
9/2
0/2
01
7
9/2
9/2
01
7
10
/10
/20
17
10
/19
/20
17
10
/30
/20
17
11
/8/2
01
7
11
/17
/20
17
11
/29
/20
17
12
/8/2
01
7
12
/19
/20
17
12
/29
/20
17
1/1
0/2
01
8
1/2
2/2
01
8
1/3
1/2
01
8
2/9
/20
18
2/2
1/2
01
8
3/2
/20
18
3/1
3/2
01
8
3/2
2/2
01
8
4/3
/20
18
4/1
2/2
01
8
4/2
3/2
01
8
5/2
/20
18
5/1
1/2
01
8
5/2
2/2
01
8
6/1
/20
18
6/1
2/2
01
8
Asian - GammaDelta decays as the option
approaches maturity.

CLIQUET
18
ExampleExampleExampleExample
• Payoff definition
• max (0, ∑ min (���, ������
− 1)) !
• Crediting methodologies hedged
• Monthly sum cap
• Using a generic outer loop with daily
time-steps, simulate a Cliquet with
the following terms:
• 2% local CAP
• 0% global floor
• $1,000,000 in Notional
• 1yr term
• Monthly resets
• Plot the Delta and Gamma values
across time for all scenarios.
ResultsResultsResultsResults
• Cliquet delta profile shows a similar
diffusion as the call spread, with
maximum delta value peaking around
reset dates.
• Cliquet gamma can be explosive,
change signs, which can potentially
make hedging more difficult.
0
1000
2000
3000
4000
5000
6000
7000
8000
9000
10000
6/3
0/2
01
7
7/1
2/2
01
7
7/2
1/2
01
7
8/1
/20
17
8/1
0/2
01
7
8/2
1/2
01
7
8/3
0/2
01
7
9/1
1/2
01
7
9/2
0/2
01
7
9/2
9/2
01
7
10
/10
/20
17
10
/19
/20
17
10
/30
/20
17
11
/8/2
01
7
11
/17
/20
17
11
/29
/20
17
12
/8/2
01
7
12
/19
/20
17
12
/29
/20
17
1/1
0/2
01
8
1/2
2/2
01
8
1/3
1/2
01
8
2/9
/20
18
2/2
1/2
01
8
3/2
/20
18
3/1
3/2
01
8
3/2
2/2
01
8
4/3
/20
18
4/1
2/2
01
8
4/2
3/2
01
8
5/2
/20
18
5/1
1/2
01
8
5/2
2/2
01
8
6/1
/20
18
6/1
2/2
01
8
Cliquet - Delta
-4000
-3000
-2000
-1000
0
1000
2000
3000
6/3
0/2
01
7
7/1
2/2
01
7
7/2
1/2
01
7
8/1
/20
17
8/1
0/2
01
7
8/2
1/2
01
7
8/3
0/2
01
7
9/1
1/2
01
7
9/2
0/2
01
7
9/2
9/2
01
7
10
/10
/20
17
10
/19
/20
17
10
/30
/20
17
11
/8/2
01
7
11
/17
/20
17
11
/29
/20
17
12
/8/2
01
7
12
/19
/20
17
12
/29
/20
17
1/1
0/2
01
8
1/2
2/2
01
8
1/3
1/2
01
8
2/9
/20
18
2/2
1/2
01
8
3/2
/20
18
3/1
3/2
01
8
3/2
2/2
01
8
4/3
/20
18
4/1
2/2
01
8
4/2
3/2
01
8
5/2
/20
18
5/1
1/2
01
8
5/2
2/2
01
8
6/1
/20
18
6/1
2/2
01
8
Cliquet - Gamma
Delta can become explosive
before reset dates.
High negative gamma is also seen
around resets.

Q&A