fixed income investor review - synchrony...
TRANSCRIPT

Fixed Income Investor Review 1st Quarter 2015

2
Disclaimers
2
Cautionary Statement Regarding Forward-Looking Statements
The following slides are part of a presentation by Synchrony Financial and are intended to be viewed as part of that presentation. No representation is made that the information in these slides is complete.
This presentation contains certain forward-looking statements as defined in Section 27A of the Securities Act of 1933, as amended, and Section 21E of the Securities Exchange Act of 1934, as amended,
which are subject to the “safe harbor” created by those sections. Forward-looking statements may be identified by words such as “outlook,” “expects,” “intends,” “anticipates,” “plans,” “believes,” “seeks,”
“targets,” “estimates,” “will,” “should,” “may” or words of similar meaning, but these words are not the exclusive means of identifying forward-looking statements. Forward-looking statements are based on
management’s current expectations and assumptions, and are subject to inherent uncertainties, risks and changes in circumstances that are difficult to predict. As a result, actual results could differ
materially from those indicated in these forward-looking statements. Factors that could cause actual results to differ materially include global political, economic, business, competitive, market, regulatory
and other factors and risks, such as: the impact of macroeconomic conditions and whether industry trends we have identified develop as anticipated; retaining existing partners and attracting new partners,
concentration of our platform revenue in a small number of Retail Card partners, promotion and support of our products by our partners, and financial performance of our partners; our need for additional
financing, higher borrowing costs and adverse financial market conditions impacting our funding and liquidity, and any reduction in our credit ratings; our ability to securitize our loans, occurrence of an early
amortization of our securitization facilities, loss of the right to service or subservice our securitized loans, and lower payment rates on our securitized loans; our reliance on dividends, distributions and other
payments from Synchrony Bank; our ability to grow our deposits in the future; changes in market interest rates and the impact of any margin compression; effectiveness of our risk management processes
and procedures, reliance on models which may be inaccurate or misinterpreted, our ability to manage our credit risk, the sufficiency of our allowance for loan losses and the accuracy of the assumptions or
estimates used in preparing our financial statements; our ability to offset increases in our costs in retailer share arrangements; competition in the consumer finance industry; our concentration in the U.S.
consumer credit market; our ability to successfully develop and commercialize new or enhanced products and services; our ability to realize the value of strategic investments; reductions in interchange
fees; fraudulent activity; cyber-attacks or other security breaches; failure of third parties to provide various services that are important to our operations; disruptions in the operations of our computer
systems and data centers; international risks and compliance and regulatory risks and costs associated with international operations; alleged infringement of intellectual property rights of others and our
ability to protect our intellectual property; litigation and regulatory actions; damage to our reputation; our ability to attract, retain and motivate key officers and employees; tax legislation initiatives or
challenges to our tax positions and state sales tax rules and regulations; significant and extensive regulation, supervision, examination and enforcement of our business by governmental authorities, the
impact of the Dodd-Frank Act and the impact of the CFPB’s regulation of our business; changes to our methods of offering our CareCredit products; impact of capital adequacy rules; restrictions that limit
Synchrony Bank’s ability to pay dividends; regulations relating to privacy, information security and data protection; use of third-party vendors and ongoing third-party business relationships; failure to comply
with anti-money laundering and anti-terrorism financing laws; effect of General Electric Capital Corporation being subject to regulation by the Federal Reserve Board both as a savings and loan holding
company and as a systemically important financial institution; General Electric Company (“GE”) not completing the separation from us as planned or at all, GE’s inability to obtain savings and loan holding
company deregistration (“GE SLHC Deregistration”) and GE continuing to have significant control over us; completion by the Federal Reserve Board of a review (with satisfactory results) of our
preparedness to operate on a standalone basis, independently of GE, and Federal Reserve Board approval required for us to continue to be a savings and loan holding company, including the timing of the
approval and the imposition of any significant additional capital or liquidity requirements; our need to establish and significantly expand many aspects of our operations and infrastructure; delays in receiving
or failure to receive Federal Reserve Board agreement required for us to be treated as a financial holding company after the GE SLHC Deregistration; loss of association with GE’s strong brand and
reputation; limited right to use the GE brand name and logo and need to establish a new brand; GE has significant control over us; terms of our arrangements with GE may be more favorable than what we
will be able to obtain from unaffiliated third parties; obligations associated with being a public company; our incremental cost of operating as a standalone public company could be substantially more than
anticipated; GE could engage in businesses that compete with us, and conflicts of interest may arise between us and GE; and failure caused by us of GE’s distribution of our common stock to its
stockholders in exchange for its common stock to qualify for tax-free treatment, which may result in significant tax liabilities to GE for which we may be required to indemnify GE. For the reasons described
above, we caution you against relying on any forward-looking statements, which should also be read in conjunction with the other cautionary statements that are included elsewhere in this presentation and
in our public filings, including under the heading “Risk Factors” in the Company’s Annual Report on Form 10-K for the fiscal year ended December 31, 2014, as filed on February 23, 2015. You should not
consider any list of such factors to be an exhaustive statement of all of the risks, uncertainties, or potentially inaccurate assumptions that could cause our current expectations or beliefs to change. Further,
any forward-looking statement speaks only as of the date on which it is made, and we undertake no obligation to update or revise any forward-looking statement to reflect events or circumstances after the
date on which the statement is made or to reflect the occurrence of unanticipated events, except as otherwise may be required by law.
Non-GAAP Measures
The information provided herein includes measures we refer to as “platform revenue” and “platform revenue excluding retailer share arrangements” and certain capital ratios, which are not prepared in
accordance with U.S. generally accepted accounting principles (“GAAP”). The reconciliations of such measures to the most directly comparable GAAP measures are included in the appendix of this
presentation.

3
Experienced Management Team
Brian D. Doubles
Chief Financial Officer, Synchrony Financial
CFO since January 2009
Global FP&A leader, GE Consumer Finance
CEO & CFO, GE’s WMC mortgage business
Various other leadership roles at GE
Margaret M. Keane
President & CEO, Synchrony Financial
CEO since April 2011
CEO, Retail Card
SVP, GE Consumer Finance
Various leadership roles at Citicorp
Henry F. Greig
Chief Risk Officer, Synchrony Financial
CRO since October 2010
CRO, GE Retail Card
VP Risk, GE N.A. Retail Finance business
Various other leadership roles at GE
Eric Duenwald
Treasurer, Synchrony Financial
Deputy Treasurer since April 2014
Deputy Treasurer, GE Treasury
COO, CIO, CFO GE Treasury
Various other leadership roles at GE

4
Experienced Board Members
Independent board members
Jeffrey Naylor
Audit Committee Chair
Experience: 25+ years retail and consumer goods
Current position: Founder & Managing Director of Topaz Consulting, LLC
Previous experience: SEVP, Chief Administrative Officer and CFO, TJX Companies, Inc.; SVP & CFO,
Big Lots, Inc.; Controller, Limited, Inc.
Public company boards: The Fresh Market, Inc.
Rick Hartnack
Non-Executive Chairman of the Board
Experience: 40+ years banking and consumer finance
Most recent position: Vice Chairman and Head of Consumer and Small Business Banking, US Bancorp
Previous experience: Vice Chairman, Union Bank; Executive Vice President, First Chicago Corp.
Public company boards: Federal Home Loan Mortgage Corporation (Freddie Mac)
Roy Guthrie
Risk Committee Chair
Experience: 30+ years consumer banking and credit cards
Most recent position: CFO, Discover Financial Services
Previous experience: President & CEO, CitiFinancial; President & CEO CitiCapital; Various roles of
increasing responsibility at Associates First Capital
Public company boards: Lifelock, Inc. and Springleaf Financial, Inc.
GE board members
William H. Cary
Former COO, GE Capital
Daniel O. Colao
FP&A Leader, GE Capital
Alexander Dimitrief
General Counsel, GE Capital
Anne Kennelly Kratky
CRO, GE Treasury
Dmitri L. Stockton
CEO, GE Asset Management
5
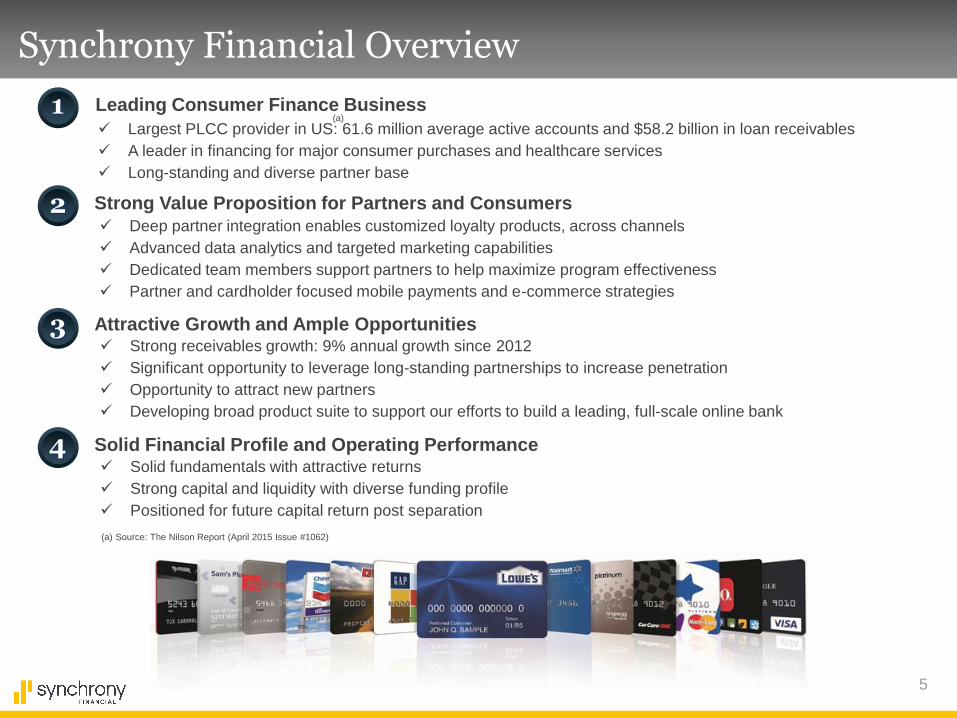
(a) Source: The Nilson Report (April 2015 Issue #1062)
Synchrony Financial Overview
Strong Value Proposition for Partners and Consumers 2 Deep partner integration enables customized loyalty products, across channels
Advanced data analytics and targeted marketing capabilities
Dedicated team members support partners to help maximize program effectiveness
Partner and cardholder focused mobile payments and e-commerce strategies
Attractive Growth and Ample Opportunities 3 Strong receivables growth: 9% annual growth since 2012
Significant opportunity to leverage long-standing partnerships to increase penetration
Opportunity to attract new partners
Developing broad product suite to support our efforts to build a leading, full-scale online bank
Solid Financial Profile and Operating Performance 4 Solid fundamentals with attractive returns
Strong capital and liquidity with diverse funding profile
Positioned for future capital return post separation
Leading Consumer Finance Business
Largest PLCC provider in US: 61.6 million average active accounts and $58.2 billion in loan receivables
A leader in financing for major consumer purchases and healthcare services
Long-standing and diverse partner base
(a) 1

6
Partner-Centric Business with Leading Sales Platforms
Payment Solutions Retail Card CareCredit
Private label credit cards,
dual cards & small
business credit products
for large retailers
Promotional financing for
major consumer
purchases, offering
private label credit cards
& installment loans
Promotional financing to
consumers for elective
healthcare procedures &
services
Receivables ($B)
(a) Does not include $0.4 billion of loan receivables held for sale
All data is as of March 31, 2015.
(a) $39.7 $11.8 $6.7

7
Long-Standing and Diverse Partner Base
Length of relationship Last renewal
36 years 2014
21 years 2014
18 years 2014
17 years 2014
15 years 2013
15 years 2013
9 years 2013
7 years 2015
3 years 2011
2 years 2012
Partner profile

8
$20
$30
$40
$50
Our Market and Position
Credit card receivables The Nilson Report, % of 2008 market
80%
85%
90%
95%
100%
105% Private Label Credit
Cards are above pre-
crisis levels at $108 billion
General Purpose Credit
Cards are down 11%
from peak at $765 billion
2008 2009 2010 2011 2012 2013
Synchrony PLCC receivables The Nilson Report, PLCC year-end receivables, $ in billions, % PLCC share
$42
$35
$37
SYF +$9 billion
PLCC +$14 billion since 2011
2014 2011 2012
42%
37%
39%
$44
41%
2014 2013

Differentiated Value Proposition for Our Partners & Customers

10
Customer benefits
Providing Value for Partners & Customers
• Increased sales
• Strengthened customer
loyalty
• Enhanced marketing
• Additional economic
benefits
• Instant access to credit
• Attractive discounts, promotional
terms & loyalty rewards
• Ability to obtain separate
financing for major
purchases
Partner benefits

11
Partner Value Proposition
We deliver significant savings and earnings
to our partners
No interchange fees
for in-store purchases
Retailer share
arrangements
enhance engagement
Interchange
savings
Retailer share
arrangements
Margin on
additional sales
$2.6B
++
++
$2.6B+
2014
Economic
benefits
(a) Based on internal research
(b) Metrics as of 12/31/2014
(c) Based on retailer reporting
Engagement throughout customer lifecycle leads to loyalty and retention
Retail Card
customers average
7 year relationship
47% of CareCredit
purchase volume
from reuse of product
by existing customers
Customer
Loyalty
1,000+ FTE dedicated to drive partner sales
Dedicated on-site
teams provide
actionable insights
Targeted marketing
with advanced data
analytics
Enhanced
marketing
Purchase volume (c)
Acquired retailer purchase volume as a
% of prior issuer’s purchase volume
Cardholders spend substantially more than
non-cardholders
Our purchase volume
is growing faster than
market
Promotional financing
influences big-ticket &
healthcare spend
Increased
sales
Purchase volume (a)
Retailer A Retailer B Retailer C
+43%
+86%
+39% +39%
+82%
Pre
Acq. Year 1
Gray = non-cardholder
Blue = cardholder
Year 2 Year 3
Post Acquisition
+115%
(b)

12
Attracting New Partners
Retail Card Payment Solutions CareCredit
• Experience
• Partnership with on-site dedicated
teams for large partners
• Long history of improving sales
• Customer loyalty & retention
Recent wins
• Differentiated capabilities:
Marketing and analytics
Mobile and online
Deep domain expertise in retail POS
Underwriting and lifecycle management
We attract partners who value our
All three platforms continue to increase partners and locations

13
Availability of credit differentiates
partners & helps customers
Significant acquisition & lifecycle
benefits vs General Purpose
61.6 million average active cardholders enjoying our card benefits
Rewards tailored
to each customer
Making purchases & procedures
obtainable
Customer Value Proposition
Other payment Postpone
48% 52%
48% of CareCredit customers would postpone or reduce scope of
treatment without financing
Promotions
& rewards
Promotional
financing
5% - 40%
1% - 10%
Synchrony
rewards value
Up to 5%
1% - 2%
General Purpose
cash back
Promo Everyday
(b) Source: 2014 CareCredit Internal Study (1,502 respondents)
Promo Everyday
(b)
(a) Based on a 2014 Company survey of the terms of ten general purpose cash back credit cards
(a)

14
Leveraging Data to Differentiate Our Value Proposition
Transactions on our closed loop network vs. general purpose
Customer Merchant Acquirer Network Issuer
General Purpose Card
PLCC Card
Date Merch. Channel Brand Cat./SKU $
4/2/15 Belk In-
Store
DKNY Women’s
shoes
468XUTY
$83.44
4/9/15 Belk Mobile Coach Women’s
handbags
229HHREO
$212.17
Enables customized offers SKU and category offers
Synchrony’s more robust data provides insight Illustrative PLCC customer transactions
Date Merch. Channel Brand Cat./SKU $
4/2/15 Belk $83.44
4/9/15 Belk $212.17
General purpose transaction data Illustrative GPCC customer transactions
Citi
Capital One
Chase

15
Digital, Loyalty and Analytics Capabilities
LOYALTY ANALYTICS MOBILE
• Digital wallets:
Apple Pay
Samsung Pay
CurrentC
• Mobile services:
Application
Servicing
Rewards
Payment
• Digital cards
• GPShopper
investment
Proprietary Closed-Loop Network
• Enables valuable data capture
• Integrated multi-
tender loyalty
solution
• Ability to deliver
targeted offers
across channels
• Seamlessly
migrate non-
credit customers
to credit
products
ONLINE
• Partnered with
retailers growing
online
• CareCredit
Provider Locator
• 31% of apps
through digital
channels in 2014
• 2014 digital
purchase volume
up 18% vs. 2013
• Receive
SKU/category level
data on over 50% of
SYF’s network
transactions
• Actionable retail
analytics, market
research and
creative services
• Dedicated analytic
centers and
Synchrony Connect
advisory team to
drive growth
• No interchange fees
(a) Includes online and mobile
(a)
(a)

Financial Performance

17
Financial Update
Net earnings $ in millions
1Q’14 1Q’15
Strong, stable earnings
Loan receivables $ in billions
7% growth
Net charge-offs % of average loan receivables
4.86% 4.53%
Platform revenue $ in millions
$2,449 $2,581
5% growth
Stable losses
$558 $552
$54.3 $58.2
1Q’14 1Q’15
1Q’14 1Q’15
1Q’14 1Q’15
(a)
(a) Platform revenue is the sum of “interest and fees on loans,” plus “other income,” less “retailer share arrangements”. See Non-GAAP reconciliation in appendix
(b)
(b) Includes loan receivables held for sale

18
2014 Platform
revenue
26%
74%
200,000 next largest programs
Majority auto-renew
No ongoing program
exceeds 0.1%
Significant % of Revenue Under Long-Term Contracts
$10,126
Largest 40 programs
Typically under long-term
exclusive contracts
(a)
(a) Platform revenue is the sum of “interest and fees on loans,” plus “other income,” less “retailer share arrangements”. See Non-GAAP reconciliation in appendix
(b) 40 largest ongoing program agreements, based on 2014 platform revenue
2014 Platform revenue $ in millions, % of 2014 Platform revenue
Renewal highlights
67% of our platform revenue generated under programs with current
contractual terms that continue through at least January 1, 2017
Renewed our five largest programs in 2013 and 2014
(b) Contractual expiration
2%
5% 5%
Partners
7%
16%
2017 2016 2015 2019
4 5 4 7
2018
10
11%
2020
3
28%
2021+
7

19
Credit Quality Overview
Synchrony controls underwriting and credit line decisions
Over 70% of assets at FICO greater than 660
Stronger portfolio U.S. consumer FICO
Delinquency performance 30+ days delinquencies
4.22% 4.09% 3.79%
1Q’15 1Q’14 1Q’13
(a)
(a) Prior to 3Q’12 a proprietary scoring model was used and converted to a FICO equivalent score
4.40%
1Q’12
19% 8%
20%
20%
61% 72%
601-660
661+
2008 2014
≤ 600

20
Funding Profile
Deposits
Securitized Debt
Unsecured Debt
1Q’15 Long-term
target
8%
59%
24%
15%-20%
60%-70%
15% -20%
9% Bank Loan
Diverse funding sources % of liabilities excluding non-debt liabilities
Fueled by strong deposit growth $ in billions
1Q’14 4Q’13
$25.7 $27.4
2Q’14
$30.5
3Q’14
$32.7
4Q’14
$35.0
1Q’15
$35.0
21
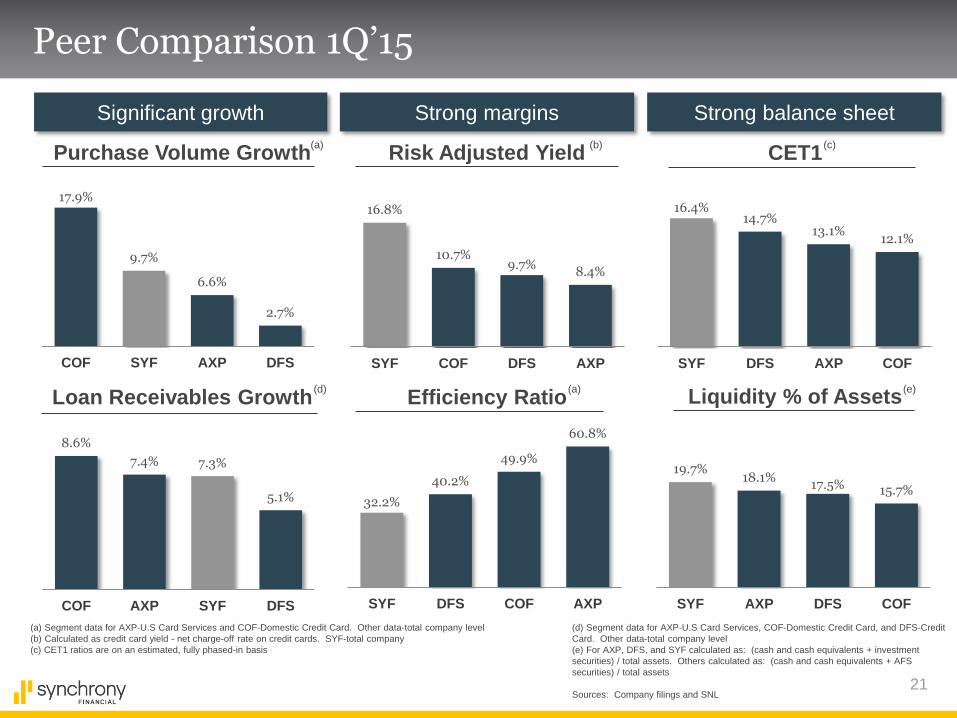
Peer Comparison 1Q’15
(a) Segment data for AXP-U.S Card Services and COF-Domestic Credit Card. Other data-total company level
(b) Calculated as credit card yield - net charge-off rate on credit cards. SYF-total company
(c) CET1 ratios are on an estimated, fully phased-in basis
32.2%
40.2%
49.9%
60.8%
SYF DFS COF AXP
Efficiency Ratio
Risk Adjusted Yield
16.8%
10.7% 9.7%
8.4%
SYF COF DFS AXP
17.9%
9.7%
6.6%
2.7%
COF SYF AXP DFS
Purchase Volume Growth
Liquidity % of Assets
19.7% 18.1%
17.5% 15.7%
SYF AXP DFS COF
16.4% 14.7%
13.1% 12.1%
SYF DFS AXP COF
CET1
(e)
Strong margins Significant growth Strong balance sheet
Loan Receivables Growth
8.6%
7.4% 7.3%
5.1%
COF AXP SYF DFS
(a)
(d)
(d) Segment data for AXP-U.S Card Services, COF-Domestic Credit Card, and DFS-Credit
Card. Other data-total company level
(e) For AXP, DFS, and SYF calculated as: (cash and cash equivalents + investment
securities) / total assets. Others calculated as: (cash and cash equivalents + AFS
securities) / total assets
Sources: Company filings and SNL
(c)
(a)
(b)

22
Summary
Growth supported by online bank
with strong deposit growth
Solid fundamentals with strong returns
Attractive growth opportunities, particularly to further leverage
data analytics, loyalty, mobile and e-capabilities
Private Label Credit Card leader well-positioned
to capitalize on deep partner integration
Differentiated business model with solid value proposition
for both partners and consumers

Synchrony Credit Card Master Note Trust (SYNCT)

24
Master Note Trust Changes
Sponsor / originator Credit enhancement Servicer
Synchrony Bank continues
as…
Trust sponsor
Receivables originator
Synchrony Bank
Wholly owned
subsidiary of
Synchrony Financial
• S&P (BBB-)
• Fitch (BBB-)
Synchrony Financial and
subsidiaries to continue
performing receivables
servicing activities as sub-
servicer for GECC
Increased enhancement
Reflects sponsor’s
parent credit rating
Implemented pre IPO
Hired agencies have
assigned or affirmed AAA
ratings
Trust Name Change Name changed to Synchrony Credit Card Master Note Trust
Ticker: SYNCT
Sub-servicing
arrangement to remain
until alternative
servicing structure
implemented
No change to key
securitization personnel

25
Trust Stratification Highlights
• +70% prime concentration
• Lower balances and credit lines compared
to general purpose credit cards
• Highly seasoned accounts … +90%
accounts over 3 years (peak losses 18-30
months after origination)
Portfolio features Retailer composition
FICO distribution (a)
FICO Score
Total
Receivables (MM) Percentage
16,108
Less than 600 1,188 7.4%
600-659 3,166 19.7%
660-719 6,467 40.1%
720+ 5,217 32.4%
No Score 70 0.4%
48% 55% 61% 63%
14% 15%
17% 17% 15% 15%
16% 16% 16% 15%
6% 4% 7%
2012 2013 2014 2015
0-1 yrs
1-3 yrs
3-5 yrs
5-7 yrs
7+ yrs
Account age
(# accounts by %)
JCP 21%
Sam's 23%
Lowes 17%
Walmart 15%
GAP Family
13%
Other 11%
(a)
(a) As of 3/31/2015
(a)
26
0.00%
2.00%
4.00%
6.00%
8.00%
10.00%
12.00%
14.00%
16.00%
18.00%
20.00%
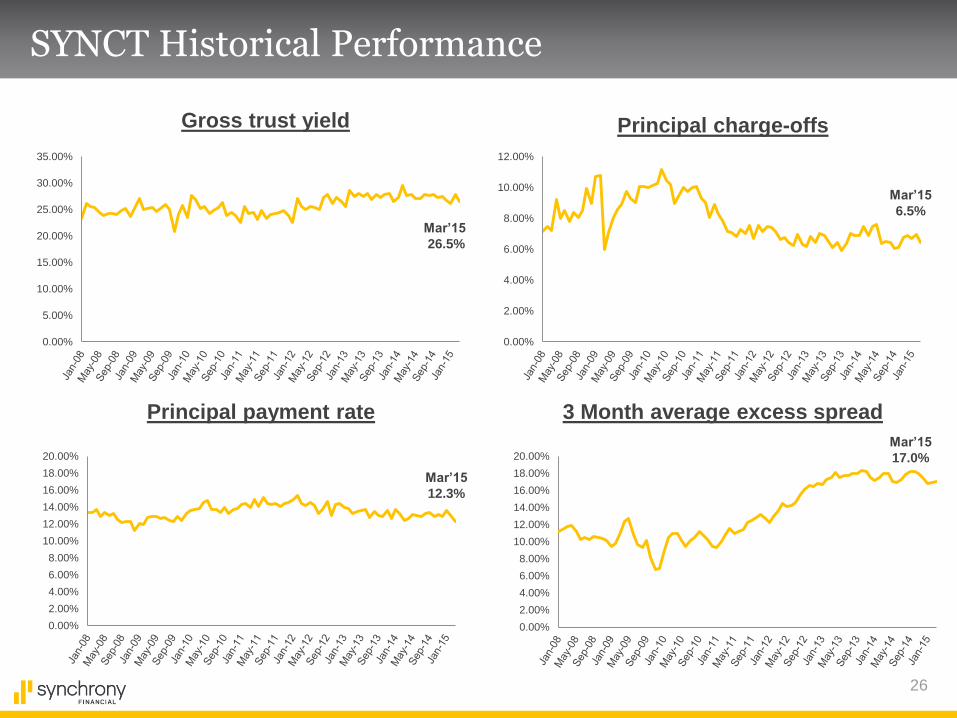
SYNCT Historical Performance
0.00%
5.00%
10.00%
15.00%
20.00%
25.00%
30.00%
35.00%
Gross trust yield
Mar’15
26.5%
Principal payment rate
Mar’15
12.3%
0.00%
2.00%
4.00%
6.00%
8.00%
10.00%
12.00%
Principal charge-offs
Mar’15
6.5%
0.00%
2.00%
4.00%
6.00%
8.00%
10.00%
12.00%
14.00%
16.00%
18.00%
20.00%
3 Month average excess spread
Mar’15
17.0%

Appendix

28
Financial Results
Summary earnings statement
First quarter 2015 highlights
$ in millions, except ratios
Total interest income $3,150 $2,933 $217 7%
Total interest expense 275 190 (85) (45)%
Net interest income (NII) 2,875 2,743 132 5%
Retailer share arrangements (RSA) (660) (594) (66) (11)%
NII, after RSA 2,215 2,149 66 3%
Provision for loan losses 687 764 77 10%
Other income 101 115 (14) (12)%
Other expense 746 610 (136) (22)%
Pre-Tax earnings 883 890 (7) (1)%
Provision for income taxes 331 332 1 0%
Net earnings $552 $558 $(6) (1)%
Return on assets 3.0% 3.9% (0.9)pts.
1Q'15 1Q'14 % $
B/(W) • $552 million Net earnings, 3.0% ROA
• Net interest income up 5% driven by
growth in loan receivables
Interest and fees on loan receivables up 7%
in-line with receivable growth
Interest expense increase driven by liquidity,
funding mix and growth
• Provision for loan losses declined 10%
Asset quality improved … 30+ delinquencies
down 30bps. and NCO rate down 33bps. vs.
prior year
• Other income declined 12%
Increased loyalty partially offset with
interchange due to program growth
• Other expense in-line with expectations
Other expense increase primarily driven by
infrastructure build and growth

29
Non-GAAP Reconciliations
In order to assess and internally report the revenue performance of our three sales platforms, we use measures we refer
to as “platform revenue” and “platform revenue excluding retailer share arrangements.” Platform revenue is the sum of
three line items in our Condensed Consolidated and Combined Statements of Earnings prepared in accordance with
GAAP: “interest and fees on loans,” plus “other income,” less “retailer share arrangements.” Platform revenue and
platform revenue excluding retailer share arrangements are not measures presented in accordance with GAAP. To
calculate platform revenue we deduct retailer share arrangements but do not deduct other line item expenses, such as
interest expense, provision for loan losses and other expense, because those items are managed for the business as a
whole. We believe that platform revenue is a useful measure to investors because it represents management’s view of the
net revenue contribution of each of our platforms. Platform revenue excluding retailer share arrangements represents
management’s view of the gross revenue contribution of each of our platforms. These measures should not be considered
a substitute for interest and fees on loans or other measures of performance we have reported in accordance with GAAP.
We present certain capital ratios. As a new savings and loan holding company, we historically have not been required by
regulators to disclose capital ratios, and therefore these capital ratios are non-GAAP measures. We believe these capital
ratios are useful measures to investors because they are widely used by analysts and regulators to assess the capital
position of financial services companies, although our Basel I Tier 1 common ratio is not a Basel I defined regulatory
capital ratio, and our Basel I and Basel III Tier 1 common ratios may not be comparable to similarly titled measures
reported by other companies. Our Basel I Tier 1 common ratio is the ratio of Tier 1 common equity (as calculated
below) to total risk-weighted assets as calculated in accordance with the U.S. Basel I capital rules. Our Basel III Tier 1
common ratio is the ratio of common equity Tier 1 capital to total risk-weighted assets, each as calculated in accordance
with the U.S. Basel III capital rules (on a fully phased-in basis). Our Basel III Tier 1 common ratio is a preliminary
estimate reflecting management’s interpretation of the final Basel III capital rules adopted in July 2013 by the Federal
Reserve Board, which have not been fully implemented, and our estimate and interpretations are subject to, among other
things, ongoing regulatory review and implementation guidance.

30
Non-GAAP Reconciliation
The following table sets forth each component of our platform revenue for periods indicated below.
($ in millions)
2015 2014 2014
Platform Revenue
Total:
Interest and fees on loans . . . . . . . . . . . . . . . . . .. . . . . . . . . . . . . . . . . . . . . . . . . . . . . . . . . . . . . . . . . $3,140 $2,928 $12,216
Other income . . . . . . . . . . . . . . . . . . . . . . . . . . . .. . . . . . . . . . . . . . . . . . . . . . . . . . . . . . . . . . . . . . . . . $101 $115 $485
Retailer share arrangements . . . . . . . . . . . . . . . . . . . . . . . . . . . . . . . . . . . . . . . . . . . . . . . . . . . . . . . . . $(660) $(594) $(2,575)
Platform revenue . . . . . . . . . . . . . . . . . . . . . . . . . . . . . . . . . . . . . . . . . . . . . . . . . . . . . . . . . . . . . . . . . $2,581 $2,449 $10,126
Retail Card:
Interest and fees on loans . . . . . . . . . . . . . . . . . . .. . . . . . . . . . . . . . . . . . . . . . . . . . . . . . . . . . . . . . . . . $2,337 $2,178 $9,040
Other income . . . . . . . . . . . . . . . . . . . . . . . . . . . . . . . . . . . . . . . . . . . . . . . . . . . . . . . . . . . . . . . . . . . . $86 $96 $407
Retailer share arrangements . . . . . . . . . . . . . . . . .. . . . . . . . . . . . . . . . . . . . . . . . . . . . . . . . . . . . . . . . $(651) $(584) $(2,530)
Platform revenue . . . . . . . . . . . . . . . . . . . . . . . . . .. . . . . . . . . . . . . . . . . . . . . . . . . . . . . . . . . . . . . . . . $1,772 $1,690 $6,917
Payment Solutions:
Interest and fees on loans . . . . . . . . . . . . . . . . . . .. . . . . . . . . . . . . . . . . . . . . . . . . . . . . . . . . . . . . . . . . $403 $372 $1,582
Other income . . . . . . . . . . . . . . . . . . . . . . . . . . . . .. . . . . . . . . . . . . . . . . . . . . . . . . . . . . . . . . . . . . . . . . $5 $8 $32
Retailer share arrangements . . . . . . . . . . . . . . . . .. . . . . . . . . . . . . . . . . . . . . . . . . . . . . . . . . . . . . . . . . $(8) $(9) $(41)
Platform revenue . . . . . . . . . . . . . . . . . . . . . . . . . . . . . . . . . . . . . . . . . . . . . . . . . . . . . . . . . . . . . . . . . . $400 $371 $1,573
CareCredit:
Interest and fees on loans . . . . . . . . . . . . . . . . . . .. . . . . . . .. . . . . . . . . . . . . . . . . . . . . . . . . . . . . . . . . $400 $378 $1,594
Other income . . . . . . . . . . . . . . . . . . . . . . . . . . . . .. . . . . . . . . . . . . . . . . . . . . . . . . . . . . . . . . . . . . . . . . $10 $11 $46
Retailer share arrangements . . . . . . . . . . . . . . . . . . . . . . . . . . . . . . . . . . . . . . . . . . . . . . . . . . . . . . . . . . $(1) $(1) $(4)
Platform revenue . . . . . . . . . . . . . . . . . . . . . . . . . . . . . . . . . . . . . . . . . . . . . . . . . . . . . . . . . . . . . . . . . . $409 $388 $1,636
For the
Three Months Ended
March 31,
For the
Twelve Months Ended
December 31,

31
COMMON EQUITY MEASURES
GAAP Total common equity…………………………………………………..…….
Less: Goodwill…………………………………………………………..…….
Less: Intangible assets, net……………………………………………..……..
Tangible common equity……………………………………………………..……
Adjustments for certain other intangible assets, deferred tax liabilities
and certain items in accumulated comprehensive income (loss)………….…...
Basel I – Tier 1 capital and Tier 1 common equity…………………………..…..
Adjustments for certain other intangible assets and deferred tax liabilities…...
Basel III – Tier 1 common equity…………………………………………..……..
ASSET MEASURES
Total assets……………………………………………………………………..……
Adjustments for:
Disallowed goodwill and other disallowed intangible assets,
net of related deferred tax liabilities………………………………………….
Other……………………………………………………………………..……
Total assets for leverage purposes – Basel I………………………………..…….
Risk-weighted assets – Basel I………………………………………………….....
Additional risk weighting adjustments related to:
Deferred taxes………………………………………………………………....
Loan receivables delinquent over 90 days…………………………..……..….
Other……………………………………………………………………..……….
Risk-weighted assets – Basel III (fully phased in)………………………..……..…
Non-GAAP Reconciliation
The following table sets forth a reconciliation of each component of our capital ratios to the comparable GAAP component at
March 31, 2015.
$11,036
(949)
(557)
$9,530
293
$9,823
(12)
$9,811
$72,721
(1,213)
136
$71,644
$58,184
1,224
528
(10)
$59,926
$ in millions at
March 31, 2015