fix it or fail: why we must cut company tax no · submission to the senate inquiry into enterprise...
TRANSCRIPT

Submission to the Senate Inquiry into Enterprise Tax Plan Bill 2016 Page 1
Fix it or Fail: Why we must cut company tax now
Related publications RR15: Michael Potter, The case against tax increases in Australia: the growing burden, 2016
PM87: Sinclair Davidson, The Faulty Arguments Behind Australia’s Corporate Tax, 2008
Table of Contents Fix it or Fail: Why we must cut company tax now .......................................................................... 1
Summary ................................................................................................................................. 3
1 Introduction ..................................................................................................................... 4
2 Australia’s company tax system is uncompetitive .............................................................. 5
2.1 Headline tax rate ................................................................................................................. 5
Box 1: How does imputation affect international comparisons? ................................................... 8
2.2 Company Tax to GDP .......................................................................................................... 9
2.3 Effective rate of tax ........................................................................................................... 10
Box 2: How does the United States handle a high company tax rate? ........................................ 12
2.4 Reliance on company tax .................................................................................................. 12
2.5 Other measures of competitiveness ................................................................................. 13
3 Benefits of the company tax cut ...................................................................................... 14
3.1 Summary of the benefits of a company tax cut ................................................................ 14
3.2 Investment ........................................................................................................................ 14
Box 3: Explaining the impact of the tax cut for foreign investors, according to the modelling ... 17
3.3 Benefit to Wages & Employment...................................................................................... 18
3.4 Economic growth & GDP ................................................................................................... 19
3.5 National income ................................................................................................................ 20
3.6 Productivity growth .......................................................................................................... 20
3.7 Improvement to overall wellbeing .................................................................................... 21
4 Other arguments for company tax cut ............................................................................. 21
4.1 Reliance on a smaller number of taxpayers ...................................................................... 21
4.2 Company tax is like a tariff on capital imports ................................................................. 22
5 Costs of the company tax cut........................................................................................... 24
5.1 Impact of tax cut on Budget .............................................................................................. 24
5.2 Impact of tax cut on overall tax burden ............................................................................ 25
5.3 Comparison with other policies ........................................................................................ 26
6 Tax avoidance ................................................................................................................. 27
6.1 Should the tax cut be cancelled because of corporate tax avoidance? ............................ 27
6.2 Tax avoidance in the modelling ........................................................................................ 28

Submission to the Senate Inquiry into Enterprise Tax Plan Bill 2016 Page 2
7 Benefits to foreigners ...................................................................................................... 29
7.1 Benefit to US Treasury ...................................................................................................... 29
Box 4: Australia Institute’s estimate of the ‘benefit’ to the US Treasury ..................................... 30
8 Concerns with the policy and alternate approaches ......................................................... 30
8.1 Phasing in/speed of tax cut ............................................................................................... 30
8.2 Lower rate for small business ........................................................................................... 31
Conclusion ................................................................................................................................. 33
Appendix A: how to present benefits of the tax cut ..................................................................... 34
Appendix B: details of data ........................................................................................................ 35
Acknowledgements This research report has been assisted by the comments and suggestions from Sinclair Davidson,
Simon Cowan, Tony Shepherd, Pero Stojanovski, Spiro Premetis, and Karla Pincott. I am particularly
grateful for research assistance I received from Miguel Forjaz and Matthew Stocks. Karla Pincott
edited the report and Ryan Acosta provided the design and layout. I am grateful for all this
assistance. Naturally, any errors or omissions remain my responsibility.

Submission to the Senate Inquiry into Enterprise Tax Plan Bill 2016 Page 3
Summary Australia needs to cut company tax to 25% to address Australia’s poor investment, wages,
income and productivity performance.
o Business investment is currently at recessionary levels despite the economy being
nowhere near a recession.
The boost to the economy is supported by Treasury modelling and substantial international
evidence.
Australia’s investment performance is hampered by our uncompetitive company tax system,
with our company tax rate above OECD, regional and global averages, and not declining
despite cuts in many other countries since 2001.
The tax to GDP ratio, the tax to profit ratio, and company tax as a share of total revenue are
all greatly above OECD averages, including after adjustment for imputation (even though
this adjustment is largely unwarranted).
The benefits of the company tax cut are likely underestimated, because the modelling
assumes Australian investors are unaffected by company tax, when in fact the average
Australian shareholder probably feels at least one third of the impact of company tax.
Australia is becoming increasingly reliant on a small number of corporate taxpayers, so the
budget is becoming much more exposed to the fortunes of these individual companies.
o The short run benefit of the tax cut is concentrated on a small number of businesses
because the tax revenue is also concentrated.
The tax cut should not be abandoned just because foreigners (including the US Treasury)
benefit. We should not sacrifice an advantage simply because foreigners also gain; this
would be self-destructive xenophobia.
In the longer term, neither big business nor foreigners obtain a big benefit from the tax cut:
most of the benefit instead goes to workers.
The company tax is similar to other import tariffs. It should be cut similarly to Australia’s
previous tariff reforms, and will provide equivalent (or greater) economic benefits.
The budget impact of the tax cut is small and can be completely funded by other measures
in the recent budget. If the tax cut is abandoned, the tax burden will likely go above previous
record highs.
The tax cut is an investment in the future, just like education and infrastructure; and all
investment policies should be subject to detailed analysis of costs and benefits similar to the
tax cut policy.
Cancelling the tax cut because of supposed tax avoidance would penalise the companies
who pay the most tax, and won’t affect the biggest tax avoiders who pay no tax. It will even
encourage tax avoidance to grow.
o Taxpaying companies are in no way responsible for other companies that don’t pay
tax. Collective responsibility for the ‘sins’ of others is antithetical to good public
policy.
The greatest benefit comes from cutting tax on all business, rather than cutting the taxes on
small business only.

Submission to the Senate Inquiry into Enterprise Tax Plan Bill 2016 Page 4
1 Introduction The Australian government plans to cut the company tax rate from its current level of 30% to 25%
over the next 10 years (a lower rate currently applies to small business).1 Company tax raised $64.7
billion dollars in 2015–16, or 3.9% of Australia’s GDP, and revenue is forecast to grow quickly to 4.6%
of GDP in 2019–20.2 This is well above the historical average of 3.6%.3 This growth in company tax
revenue is a major contributor to closing the budget deficit, which is forecast to fall from 2.4% of
GDP to 0.3% over the coming four years. Company tax contributes almost one third of this reduction
in the deficit, similar to the contribution from personal tax (largely due to bracket creep4), so these
two taxes alone provide well over half the budget repair in the next four years (see Figure 1).
By contrast, all the reductions in government spending combined contribute only a quarter of the
budget repair during that period.5 The heavy lifting on budget repair is being provided by increases
in two taxes: company and personal. The contribution to budget repair is shown in Figure 1,
compared with the estimated costs of the company tax cut — the gross cost and the net cost when
the dynamic benefits of the tax cut are factored in, as discussed in Section 5.1.
Figure 1 shows that the increased tax burden on companies in the next four years is more than the
gross cost of the tax cut, and substantially more than the net cost. So the cost of the tax cut could be
more than fully funded by the higher tax impost on companies over this four year period. Similarly,
the total burden on companies will still be higher than today, even with the tax cut.
Figure 1: Contributions to closing budget deficit over next four years, compared with cost of company tax cut
Source: 2016–17 Budget, Independent Economics (2016) & Kouparitsas et al (2016).6 The deficit reduction (totalling 2.1%
of GDP) relates to the period 2015–16 to 2019–20. “Other” is made up of changes in other taxes and changes in Future
Fund earnings.
This growing company tax burden contrasts with the state of the economy, which is showing some
weaknesses and facing substantial risks — as discussed later in this paper. Australia’s company tax
system is not well placed to address these risks. The tax rate was 49% in the 1980s, and was cut
several times since then to reach 30% in 2001–02,7 but has not changed since then.

Submission to the Senate Inquiry into Enterprise Tax Plan Bill 2016 Page 5
The uncompetitive nature of Australia’s company tax system is examined in this paper, along with
the benefits of the tax cut; and responses to some of the arguments presented against the policy.
2 Australia’s company tax system is uncompetitive Australia’s company tax system imposes a much larger burden than other comparable countries,
based on various measures considered in this section. The comparisons are largely with the OECD —
which covers most but not all developed countries — and relate to the corporate tax levied by all
levels of government except where indicated. Details of the data and calculations are in Appendix B.
Further discussion of issues with international tax comparisons can be found in the related CIS
publication, The case against tax increases in Australia: the growing burden.8
2.1 Headline tax rate The simplest comparison between countries is of the headline corporate tax rate at the national
level. The Australian company tax rate of 30% is above the unweighted OECD average of 22.8% and
the OECD weighted average of 27.3%.9 However, these comparisons do not account for the
relationship between country size and tax rate: smaller economies tend to have lower company tax
rates than larger economies (see Figure 2). This means Australia should be comparing itself to
economies that are closer to it in size.
Figure 2: Relationship between company tax rate and economy size for OECD excluding US
Source: OECD Revenue Statistics, OECD.Stat and author’s calculations, see Appendix B for details. The
company tax rate used is the combined rate for all levels of government in 2015. GDP is converted to US
dollars at purchasing power parity. Overlapping labels have been removed. Dotted line is line of best fit. The
US is excluded as an outlier in this graph, but the relationship including the US is similar.

Submission to the Senate Inquiry into Enterprise Tax Plan Bill 2016 Page 6
Smaller countries tend to have lower tax rates because foreign investment into these countries is
more affected by tax, they have more economic activity that is internationally mobile (while
businesses in larger economies are more domestically focussed), and larger countries have (slightly)
more control over the global price of capital.10
A regression of OECD corporate tax rates in 2015 on economy size, shown in Figure 2, indicates
Australia’s tax rate is well above what would be expected for an economy of our size. In fact, a rate
of between 24.5% and 24.8% would be called for on this analysis (depending on whether the US is
included). These figures relate to the combined tax rate of all levels of government; if the national
tax rate alone is used, the ideal rate for Australia falls to 22.8%.11
Also note that the high-taxing Nordic countries have lower company tax rates: according to the
OECD, the tax rate in Sweden is 22%; Finland is 20%; Denmark is 22%; Iceland is 20%; and Norway is
25%.12
2.1.1 Trends in tax rate over time
The analysis should also consider the trend in tax rates, as investment decisions are often made over
long time horizons. These trends show that, while Australia’s company rate has remained
unchanged, the tax rate in the rest of the developed world is declining quickly.
Since the last cut in Australia’s corporate tax rate, 32 of the 35 OECD countries in Figure 3 have cut
their overall corporate tax rate (the combined rate of all levels of government), with the (weighted)
average falling by 5.7 percentage points.13 This is shown in Figure 3, with Australia’s position circled.
Figure 3: Change in corporate tax rate in OECD, 2001–2016
Source: OECD Revenue Statistics and OECD.Stat, see Appendix B for details. This shows the combined tax rate
for all levels of government (for example the national rate for the US did not change over this period, but state
tax rates changed). The average decline in the tax rate is 6.9 percentage points while the weighted average
decline is 5.7 points. The changes for the corporate tax rate at the national level alone are similar.

Submission to the Senate Inquiry into Enterprise Tax Plan Bill 2016 Page 7
The OECD weighted average corporate tax rate is falling and will be below 25% in 10 years’ time if
trends are projected forward (see Figure 4). Despite the proposed cuts to Australia’s tax rate, we will
still be above the weighted and unweighted average in every year, including the year when the tax
rate is set to fall to 25% (2026–27).
Figure 4: Australia's corporate tax rate — history and forecasts
Sources: OECD Revenue Statistics, OECD.Stat and 2016–17 Budget, see Appendix B for details. Trend lines are
extrapolated based on figures from 2000 to 2016. The rate shown for Australia is the rate for the largest
businesses.
Australia’s company tax rate also fares poorly in comparison with countries in our region. The KPMG
online tax database has the average corporate tax rate for Asia at nearly 22% in 2016 and the
average rate for Oceania at 26%.14 The Asia average has declined by 7.0 percentage points over the
past 10 years, while the Oceania average has declined by 4.6 points. The global average tax rate is
23.6% in 2016, a rate that has declined by 3.9 points since 2006.15 Over this whole period, Australia’s
rate remained unchanged.
It is sometimes argued16 that Australia’s imputation system makes our company tax system more
competitive. This is a dubious claim, as discussed in Box 1.

Submission to the Senate Inquiry into Enterprise Tax Plan Bill 2016 Page 8
Box 1: How does imputation affect international comparisons?
Australia’s imputation system gives a credit to Australian shareholders for the tax that has already
been paid at the company level.17 This effectively means that profits are taxed at an Australian
investor’s personal tax rate instead of the company tax rate, but only when profits are paid out as
dividends. If a company has only Australian shareholders, and distributes all its profits immediately,
the company tax rate is not relevant.
Therefore, it is tempting to argue that imputation should be removed in international comparisons
of the company tax system. However, this is largely incorrect, because investors do not put full
value on imputation credits, and discount the value by 50% or more. There are two main reasons
for this: foreign investors largely receive no benefit from imputation credits, and the credits are
devalued over time for domestic investors because of retention of profits.
First, foreign investors have limited use for imputation (or franking) credits so the imputation
system provides little benefit to them.18 It is this foreign investment that Australia needs to attract,
and foreign investors are particularly responsive to company tax (see Section 3.2.2). This means the
most relevant comparisons relate to foreign investors, and should not be adjusted for imputation.
Second, Australian investors also devalue imputation credits, mainly because profits are frequently
retained in the company, and may not be paid out as dividends for years.19 As a result, the value of
imputation credits can be diminished in present value terms compared to the time when the profits
were made.
The average profit retention rate for Australian companies is fairly high at around 40–50% as shown
in ATO data (see Table 1). The ATO figures also indicate strong yearly growth in franking account
balances, which is another indicator of substantial rates of retained earnings.
Table 1: Profit retention rates & growth in franking credit balances
Source: ATO Taxation Statistics, see Appendix B for details. Profit retention ratio = percentage of profits or income that
aren’t paid out as dividends and is equal to 1 – dividend payout ratio.
Figures from the Reserve Bank indicate listed companies in Australia have a profit retention ratio
averaging 33% over the period 2005–2015,20 but this is not representative of all Australian
companies, where the retention ratio is higher as noted above.
So neither local nor foreign investors place full value on imputation credits. This is supported by the
behaviour of both companies and investors. A 2004 survey of companies showed a large majority
didn’t adjust their cost of capital for imputation, and a very small minority (4%) valued the credits at
more than 50% of nominal value.21

Submission to the Senate Inquiry into Enterprise Tax Plan Bill 2016 Page 9
2.2 Company Tax to GDP Australia’s corporate tax to GDP ratio was at 4.9% in 2013 (the most recent year with OECD data),
which is well above the OECD average of 2.8% and the weighted average of 2.6% for 2013.24 This is
shown in Figure 5. Australia is second highest of the 32 countries included, and has been second or
third highest since 2006.25
Figure 5: Company tax to GDP ratio in OECD
Source: OECD Revenue Statistics and OECD.Stat, see Appendix B for details. Figures are for 2013.
The Australian figures include rent taxes;26 there is a good argument to remove these taxes as they
don’t apply to business in general. Making this adjustment, the tax to GDP ratio declines to 4.7%.
Taking off the proposed tax cut as well takes the ratio to 4.3%. There is a weaker argument to
remove imputation credits (see discussion in Box 1); nevertheless, making this adjustment takes the
tax to GDP ratio to 3.1%. In all cases, these adjustments still leave the tax to GDP ratio above both
the weighted and unweighted averages.27
Box 1 continued
Similarly, the market discounts the value of imputation credits by a substantial amount, with studies
showing the discount to be 50% or more.22 Assuming the figure is 50%, this means that investors,
on average, expect to only recoup 50% of the costs of company tax — or conversely the imputation
system only offsets 50% of the impact of company tax.
Nevertheless, figures in the main text do a full adjustment for imputation, with no discount. The
figure subtracted is $19bn, which is Treasury’s calculation of the value of imputation credits used by
personal taxpayers, charities and superannuation funds.23

Submission to the Senate Inquiry into Enterprise Tax Plan Bill 2016 Page 10
2.2.1 Trends in tax to GDP over time
Australia’s company tax to GDP ratio has increased in recent decades, with some fluctuations around
this trend. This increase has even occurred with the various cuts in the tax rate before 2001, as
shown in Figure 6. The recent weakness in this measure coincides with GFC and the end of the
mining boom, when corporate profits have also declined. However, tax revenue is forecast to
rebound strongly in coming years, and is a large contributor to the budget repair process (see
Introduction). This also means that Australia’s position relative to the OECD may be getting worse
over time.
Figure 6: Company tax to GDP ratio for Australia — history and forecasts
Source: ATO, 2016–17 Budget, PBO & ABS, see Appendix B for details. The average is from 1982–83 to
2015−16.
Similar results have occurred in other OECD countries: company tax revenue has actually increased
as a share of GDP after the tax rate was cut in the United Kingdom, Canada, Ireland and New
Zealand.28 The reasons for this include increased corporate profits, increased incorporation, and
changes to broaden the tax base. Treasury and the OECD have discussed these reasons and analysed
in more detail the different measures of tax burden, including the effective tax rate (explored in the
next section).29
Nevertheless, the increase in revenue after taxes were cut also supports the argument in Section 5.1
that the costs of corporate tax cuts can be partly recouped due to the dynamic benefits of tax cuts.30
2.3 Effective rate of tax The effective rate of tax is broadly the ratio of tax paid to company profits. This is generally a better
measure of the impact of company tax, because it takes into account deductions and exemptions
from the tax base, which carry substantial weight in investment decisions31 and particularly affects
the United States (see Box 2).

Submission to the Senate Inquiry into Enterprise Tax Plan Bill 2016 Page 11
Australia has an uncompetitive effective tax rate, as shown in a number of comparisons.32
A report for the US Business Roundtable by PriceWaterhouse Coopers found that the effective tax
rate for companies headquartered in Australia was 27.1% from 2006–2009, which is fifth highest of
the 28 surveyed countries and well above the average of 22.8%.33
The World Bank’s Doing Business report for 2016 found the profit tax rate (which measures the tax
on profits as a percentage of commercial profit) for Australia is 26%, which is well above the world
average (16.2%), the EU/EFTA average (12.6%), non-EU OECD average (16.1%), and the Asia-Pacific
average (17.6%).34
A report for the Minerals Council of Australia found Australia has one of the highest marginal
effective tax rates on investment (tax paid as a share of pre-tax rate of return on capital) among the
OECD, as well as among a larger sample of 45 countries. From 2005 to 2015, Australia’s effective tax
rate moved from 10th highest to 4th highest in the OECD.35
2.3.1 Trends in effective tax rate over time
Australia’s effective corporate tax rate has been increasing over time, as shown in Figure 7; there
have been substantial fluctuations around this long-run trend, particularly due to the Global
Financial Crisis. However, the Budget forecast is for this upward trend to continue in coming years.
The upward trend is explained by the same factors that explain the upward trend in tax to GDP —
namely increased corporate profits, increased incorporation, changes to broaden the tax base, and
partial recoupment of the costs of corporate tax cuts.
Figure 7: Company tax to profit ratio for Australia — history and forecasts
Source: 2016–17 Budget and PBO, see Appendix B for details. Profit is measured by gross operating surplus
(GOS), which is similar to profit.36 Forecasts for GOS are from page 4-9 of the Budget.
Submission to the Senate Inquiry into Enterprise Tax Plan Bill 2016 Page 12
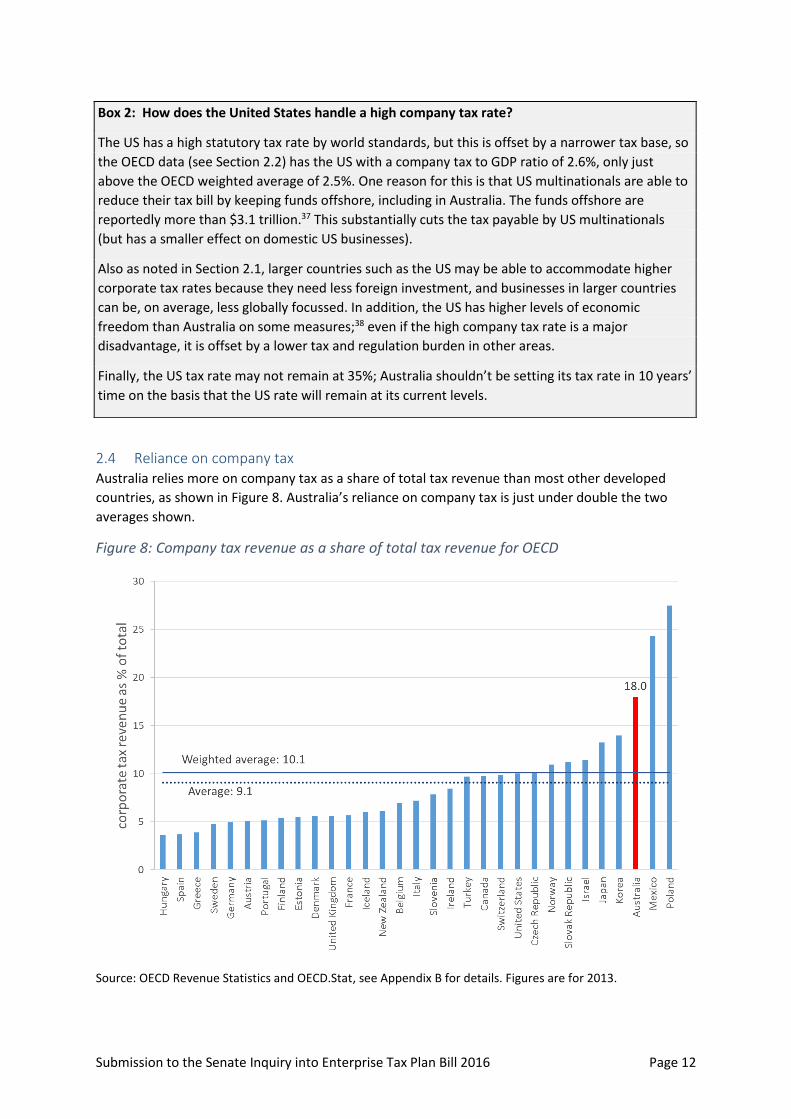
2.4 Reliance on company tax Australia relies more on company tax as a share of total tax revenue than most other developed
countries, as shown in Figure 8. Australia’s reliance on company tax is just under double the two
averages shown.
Figure 8: Company tax revenue as a share of total tax revenue for OECD
Source: OECD Revenue Statistics and OECD.Stat, see Appendix B for details. Figures are for 2013.
Box 2: How does the United States handle a high company tax rate?
The US has a high statutory tax rate by world standards, but this is offset by a narrower tax base, so
the OECD data (see Section 2.2) has the US with a company tax to GDP ratio of 2.6%, only just
above the OECD weighted average of 2.5%. One reason for this is that US multinationals are able to
reduce their tax bill by keeping funds offshore, including in Australia. The funds offshore are
reportedly more than $3.1 trillion.37 This substantially cuts the tax payable by US multinationals
(but has a smaller effect on domestic US businesses).
Also as noted in Section 2.1, larger countries such as the US may be able to accommodate higher
corporate tax rates because they need less foreign investment, and businesses in larger countries
can be, on average, less globally focussed. In addition, the US has higher levels of economic
freedom than Australia on some measures;38 even if the high company tax rate is a major
disadvantage, it is offset by a lower tax and regulation burden in other areas.
Finally, the US tax rate may not remain at 35%; Australia shouldn’t be setting its tax rate in 10 years’
time on the basis that the US rate will remain at its current levels.

Submission to the Senate Inquiry into Enterprise Tax Plan Bill 2016 Page 13
If rent taxes are removed from this calculation, the company tax share becomes 17.3%, while
adjusting for the proposed company tax cut takes this share to 15.8%. There is a weaker case to
adjust these figures for imputation (see Box 1); nevertheless making this adjustment takes the
company tax share to 11.4%. In all cases, Australia’s reliance on company tax is still well above both
of the averages.
These comparisons show that Australia’s tax mix is heavily skewed towards company tax, compared
to other developed countries: and the OECD has stated the company tax is the most harmful to
growth of all the major taxes levied in the OECD.39
2.5 Other measures of competitiveness Australia is also becoming less competitive on more general measures of regulatory burden, which
include the impact of company tax. For example:40
The World Economic Forum has Australia’s Global Competitiveness Ranking falling from 16th
in 2007 to 21st in 2016.41
IMD World Competitiveness Yearbook has Australia’s ranking falling from 5th in 2010 to 17th
in 2016.42
The Heritage Foundation Index of Economic Freedom has Australia’s score declining by
almost 3 points from 2012 to 2016. Over the same period, the world average freedom index
has increased by almost 1 point.43
In addition, the Productivity Commission argues that Australia has recently become one of the most
restrictive countries for foreign investment.44 Australia’s high company tax rate is compounding the
adverse effects of the uncompetitiveness of Australian regulations.

Submission to the Senate Inquiry into Enterprise Tax Plan Bill 2016 Page 14
3 Benefits of the company tax cut The uncompetitive nature of Australia’s company tax system is one reason there are important
weaknesses showing up in the economy. The company tax cut will help address these risks and
problems. In particular, the policy will boost investment, increase employment and wages, lift labour
productivity, stimulate growth in GDP and national income and lead to a rise in exports. These
economic benefits result in governments receiving more tax revenue, substantially offsetting the
costs of the tax cut.
3.1 Summary of the benefits of a company tax cut The federal Treasury has modelled the long-run impact of a company tax cut from 30% to 25%,
finding under several different assumptions there are multiple and substantial benefits of the
company tax cut, as shown in Table 2.
Table 2: Summary of Treasury modelling of company tax cut
Variable Scenario 1: Funded by lump sum tax
Scenario 2: Funded by increased personal tax
Scenario 3: Funded by cutting wasteful government spending
% change (compared to situation with no tax cut)
Investment 2.8 2.6 2.9 Employment 0.4 0.1 0.1 Wages after tax 1.1 0.4 1.1 Labour productivity
0.8 0.9 1.0
GDP 1.2 1.0 1.1 National income 0.8 0.6 0.7 Exports 2.2 2.0 2.1
Budget impact Zero — all scenarios have the cost of the tax cut fully offset by other changes Source: Kouparitsas et al (2016)45, Table 1; for productivity, author’s calculations based on Kouparitsas et al
(2016), Table 1.46 Figures are in real (after inflation) terms.
The actual tax cut proposed by the government is funded from several sources, so the modelling
does not reflect the exact proposal of the government. The benefits are smallest in the scenario
where the funding for the tax cut comes from personal tax increases (Scenario 2), 47 but the funding
doesn’t come from this source as argued in Section 5.1. As a result, the benefits are likely to be
closer to the figures in scenarios 1 and 3.
The Treasury commissioned separate modelling from Independent Economics and KPMG, who found
similar benefits to the figures in Table 2 above.48 These modelling results are not identical, because
of differences in the underlying models and assumptions.
3.2 Investment Australia competes globally with other nations to secure investment: there are substantial global
funds seeking places to invest, and businesses can often move to where the investment climate is
most friendly. This investment is essential to maintaining and boosting Australia’s economic growth,
jobs and overall wellbeing. The benefits to Australia from international investment is supported by a
number of studies:49
Between 1984 and 1989, foreign capital meant Australia’s real national income was 15%
higher than otherwise.

Submission to the Senate Inquiry into Enterprise Tax Plan Bill 2016 Page 15
A 10% increase in foreign direct investment over the period 2010 to 2020 would increase
real GDP by 1.2%.
Conversely, a reduction of foreign capital inflow and investment of 1% of GDP would reduce
Australia’s national income by about 0.5% each year over a ten-year period.
The Productivity Commission and Treasury have argued other benefits of foreign investment include
promoting competition, productivity, the transfer of foreign technology and knowledge to Australia
and increasing access to global supply chains.50
3.2.1 Australia has a significant problem with declining investment
The substantial benefits of international investment highlight the problems caused by business
investment being very weak. Non-mining investment is at recessionary levels: historically, it has only
been this low in the depths of the 1990 recession, as shown in Figure 9.
Figure 9: Business investment in Australia (% of GDP)
Source: ABS and Treasury.51 Forecasts are from the 2016–17 Budget.
This is particularly troubling: the economy was clearly much weaker during the 1990 recession than
today, but investment is at similar levels. Mining investment is somewhat higher, but is falling at a
very fast rate due to the end of the mining boom, as shown in Figure 9. NAB is forecasting mining
investment to decline by 70% over the next three years,52 and mining investment is not being
replaced by non-mining investment.
Similarly, the flow of foreign direct investment into Australia slowed in 2015 to be at its lowest level
since 2005, with the fall much larger than the decline in other commodity producing nations such as
Canada and Brazil. By comparison, global investment flows in 2015 increased by 38%, or 15%
excluding corporate restructures.53
In Australia, investment funds are not significantly going into business investment, instead funds are
going into housing and bonds, as shown in record low yields for bonds54 and rental properties in key

Submission to the Senate Inquiry into Enterprise Tax Plan Bill 2016 Page 16
markets.55 The decline in bond yields is a global phenomenon, so there are substantial global funds
looking to invest in low-risk assets. However, returns on Australian equities are not high enough to
compensate for risk compared to these other assets.
The natural conclusion of this analysis is that business investment in Australia is not attractive.
3.2.2 The effect of tax on investment
The substantial impact of the corporate tax rate on investment, including foreign investment, is
shown in numerous international studies, including:
The OECD (2010)56 found that reducing the company income tax rate by 5 percentage points
would lead to an increase in the investment to capital ratio of around 1.9%.
Feld and Heckemeyer (2011)57 synthesised 45 papers on this issue as finding a 1 percentage
point reduction in tax rates leads to an increase in foreign investment by between 1.19% and
2.28%.
The IMF Fiscal monitor for April 2016 examined 103 countries from 1990 to 2013 and found
that a 1 percentage point cut in the corporate tax rate is associated with an increase in
foreign investment by 4.4% in advanced countries.58
Djankov et al (2010)59 studied the impact of corporate taxes in 85 countries and found that
the effective corporate tax rate (discussed in Section 2.3) has a large and significant adverse
effect on total investment, foreign investment and entrepreneurial activity.
Arnold et al (2011)60 in a study of 21 OECD countries, including Australia, found that a
5 percentage point reduction in the corporate tax rate implies a long-run increase in the
investment to capital ratio by 1.9%.
Vartia (2008)61 in an industry-level study of 16 OECD countries, including Australia, found
that a 5 percentage point reduction in the corporate tax rate results in an increase in the
investment to capital ratio by 1.0% to 2.6% in the long run, depending on the empirical
specification.
Mertens and Ravn (2013)62 found that a 1 percentage point reduction in the US corporate
tax rate leads to an increase in nonresidential investment of up to 2.3%.
The adverse impact of company tax on investment is supported by a number of statements from
businesses indicating they have cut Australian investment because of our company tax rate,
including CSL which indicated it would build a new project in Switzerland instead of Australia due to
factors including a lower company tax rate. The new plant, worth $500m would have created 500
new jobs.63
Similarly, Malaysia-based Catcha Group rejected a proposal to move to Sydney because the
Australian company tax rate is too high. Patrick Grove from Catcha Group is reported saying “The tax
rate has been a deal breaker for me considering Australia as a hub personally and pursuing
investment opportunities there.”64
3.2.3 How cutting company tax will boost investment
The company tax cut will cause a boost in international investment into Australia, by increasing the
return after tax for foreign investors. These investors will respond by purchasing more Australian
shares, injecting capital into existing businesses, and establishing new Australian businesses, as
explained in Box 3.
Treasury estimates that the tax cut policy will lead to an increase in investment by 2.6% to 2.9%
(Table 2), based on investment levels in 2013–14.65 This is an increase of about 0.5% of GDP; given

Submission to the Senate Inquiry into Enterprise Tax Plan Bill 2016 Page 17
investment is now smaller as a proportion of GDP, this means the percentage growth in investment
is potentially much larger at 3.4% to 3.8%, based on 2016–17 investment levels.66
3.2.4 The modelling probably underestimates the benefit to investment
In addition to increased foreign investment, there are two other channels for investment to increase
— and these channels are broadly assumed away in the modelling of the tax cut.
First, the modelling, and some of the commentary on the tax cut policy,69 assumes imputation
means company tax does not affect Australian investors. However, this does not reflect reality. As
discussed in Box 1, market evidence indicates that investors as a whole value imputation credits at
50% or less. If we assume foreign investors do not value credits at all, this implies that local investors
alone put a value on credits of 63% or less on average70 (as foreign ownership of Australian shares is
Box 3: Explaining the impact of the tax cut for foreign investors, according to the modelling
The short and long run effects of the tax cut on foreign investors are shown in the diagram below,
based on Treasury explanation of their modelling.67
The return on foreign investment before the tax cut is shown in the leftmost column. The tax cut
initially results in the post-tax return on capital increasing (middle column below), causing an
expansion in investment. This then causes the rate of return on capital to decline due to diminishing
returns (each additional dollar of capital produces slightly less than the previous dollar). The
modelling assumes this investment occurs until the return is back to its previous level before the tax
cut (rightmost column below). This means there is no long run benefit to foreign investors. While this
is unrealistic, the results only change slightly if it is assumed returns don’t go back to their previous
level and returns to foreign investors remain higher.68
The argument that the tax cut should be rejected because it provides benefits to foreigners is
critiqued in Section 7.
Figure 10: Effect of a company tax cut on returns to foreign equity investment
Submission to the Senate Inquiry into Enterprise Tax Plan Bill 2016 Page 18
at about 20%71). If foreign investors place a positive value on imputation credits, then the value put
on credits by Australians would be below 63%.
This means Australian investors as a whole expect to feel at least one third of the impact of the
company tax rate — and the direct effect of the policy on investment decisions by Australians,
assumed away in the modelling, is influenced by the company tax cut.72
Second, there are companies themselves. The evidence in Box 1 suggests that companies largely
ignore imputation credits in their cost of capital calculations, despite Australian shareholders
benefiting from imputation. This means that most Australian companies will lower their cost of
capital due to the tax cut, and will increase their investment, probably by more than assumed in the
modelling.
As a result of these two additional channels, the modelling most likely (a) overstates the impact of
imputation, (b) understates the increase in investment from Australians, and therefore (c)
underestimates the benefit of a company tax cut.
There are other reasons to expect that investment will occur through these two additional channels:
The comments of some companies indicate the Australian company tax system affects their
investment decisions, with numerous business leaders arguing that more investment will
occur with a lower tax rate.73 For example, Grant King from Origin has argued that a lower
company tax rate is crucial to getting future gas investment projects underway, and Andrew
Smith, chairman of Shell Australia argued that the company tax rate will therefore have a
direct effect on competitiveness of local projects.74 Again, to the extent these investments
are locally financed, this means the benefits are greater than shown in the modelling.
A survey by COSBOA reportedly showed that 40,000 small businesses will expand their
operations due to the tax cut.75 While this was reported negatively, in fact this result shows
that there will be an increase in Australian-financed investment.76 An expansion by 40,000
businesses is more than the number in the modelling which is about zero (or even negative)
by assumption.
3.3 Benefit to Wages & Employment Wages growth is at historically low levels,77 and the company tax cut rate should help boost this
growth rate. The improvement to wages occurs because the tax cut results in more capital being
invested in Australia (see Section 3.2). This makes the economy larger, and a larger economy results
in increased wages. Another way of explaining this is the increase in capital in the economy means
there is more capital per worker. Each worker becomes more productive as a result. The increased
productivity of each worker raises the wages paid to workers.
The increase in wages is modelled to lie between 0.4% and 1.1% (See Table 2). The higher figure
would add about half a years’ growth to wages (at current growth rates). As argued in Section 5.1,
the company tax cut is not being financed by a hike in personal taxes, so the wage increase is likely
to be closer to the higher figure of 1.1%.
3.3.1 Studies showing an increase in wages
A wide array of economic studies support the case that company tax cuts lead to higher wages, or
conversely tax increases lead to lower wages, including:
Arulampalam Devereux, and Maffini (2012)78 found a rise in corporate tax of $1 would
reduce the wage bill by 49c in the long run and 64c in the short run. This study uses firm-
level accounting data for just over 55,000 companies in nine European countries.

Submission to the Senate Inquiry into Enterprise Tax Plan Bill 2016 Page 19
Felix (2007)79 studied household incomes in 30 countries, including Australia, and estimated
that a 10 percentage point increase in the corporate tax rate decreases annual gross wages
by 7%, with a similar impact on low- and high-skilled workers.
Fuest, Peichl & Siegloch (2013)80 found a €1 increase in the corporate tax bill leads to a 77%
decline in the wage bill.
Liu & Altshuler (2013)81 found that a $1.00 increase in US corporate tax revenue decreases
wages by approximately $0.60. This paper importantly includes businesses having some
market power (or monopoly power), and they find the impact of company tax on wages is
greater if markets are more concentrated.
Andrew Leigh, the Shadow Assistant Treasurer, summarised82a report by Gentry (2007)83 for
the US Treasury as finding that an increase in company taxes by 10 percentage points leads
to a fall in wages of 6-10%.
3.3.2 Impact on employment
In relation to employment, the modelling indicates a smaller gain — but it is still an improvement.
This smaller gain is broadly because the models assume there is no involuntary unemployment, a
fairly standard assumption in economic models. However, a greater benefit to employment seems
likely, as there are workers ready to take jobs, with unemployment currently 1.6 percentage points
above its recent low of 4.0% in August 2008.84 This implies that the benefit to employment will be
larger (and the gain to wages will be smaller).
But regardless of the assumption about employment and wages, workers benefit.
3.4 Economic growth & GDP Australia’s economic growth is currently good, particularly compared to other developed countries.85
However, this report highlights many other measures of economic performance that are much
weaker; and Australia will not be able to sustain growth in the longer run without improvements in
these other measures, particularly productivity and investment.
3.4.1 Benefit of the tax cut to GDP
The Treasury modelling indicates the company tax cut will increase GDP by 1.0–1.2% because of the
boost to investment (see Section 3.2) and employment (Section 3.3). The correct ways to present
this increase in GDP are discussed in Appendix A.
Treasury has argued this gain to GDP is substantial, only slightly less than the combined benefit of
the major reforms to telecommunications, ports and rail in the 1990s.86 The gain from the tax cut is
also similar to the estimated gain to GDP of 1.1% from an extensive range of reforms proposed by
Infrastructure Australia, including large productivity improvements in gas, electricity, the NBN,
telecommunications, water and transport.87 And these two examples are not single reforms, like a
company tax cut, but a collection of numerous reforms covering many separate changes to
regulations, and taking years to design and enact.
3.4.2 Other evidence for an increase in GDP and growth after company tax cut
Several studies have shown the beneficial impact of corporate tax cuts on GDP and growth including:
Ferede & Dahlby (2012)88 found for Canada that a 1 percentage point cut in the corporate
tax rate is related to a 0.1–0.2 percentage point increase in the annual growth rate (which
can have a large effect when compounded over time).
Mertens and Ravn (2013)89 examined US tax changes and found a one percentage point cut
in the corporate income tax rate raises real GDP per capita on impact by 0.4% and by 0.6%
after one year.

Submission to the Senate Inquiry into Enterprise Tax Plan Bill 2016 Page 20
Arnold et al (2011)90 in an empirical study of 21 OECD countries, including Australia, found
that a 1 percentage point cut in the corporate tax rate is associated with an increase in GDP
per person of 2%. The effect of an income tax cut and an income tax increase are roughly
symmetrical in this study.
These findings are also consistent with findings of an OECD study that corporate taxes are the most
harmful to growth,91 and the evidence that company tax is particularly detrimental to economic
wellbeing (see Section 3.7).
3.5 National income One measure that is showing significant weakness is national income, which is (broadly) GDP minus
payments to foreigners.92 Gross national income per person is 1.5% below the peak in December
2011 in trend terms, and has been growing at an annual rate of 0.6% since the GFC, compared to the
pre-GFC growth rate of 3.0% per year.93
Some of the increased production (GDP) from the tax cut needs to be paid to foreigners as income
on their investment into Australia. Subtracting these payments from GDP gives the improvement to
national income,94 which is forecast to grow by 0.6%–0.8% in the Treasury modelling — this broadly
indicates the extra money that households will have as a result of the tax cut. This boost to national
income is about equal to one full year’s worth of growth in national income at current growth rates.
Janine Dixon of Victoria University95 argues that company tax cuts result in increased GDP,
employment, productivity and wages, but cause a decline in national income. However, Dixon’s
modelling is not of the tax cut proposed by the government; it is in fact modelling of a different
proposal put forward by the Business Council of Australia.96 Therefore it is not directly applicable to
the policy proposed by the government.
Dixon’s results have also been criticised by Warwick McKibbin of ANU who said Dixon’s results imply
that Australia would benefit from cutting foreign investment,97 in complete contradiction with the
evidence of the large benefits of foreign investment outlined in Section 3.2. More detailed critiques
of Dixon’s modelling have been provided by Chris Murphy from Independent Economics98 and Peter
Nash and Brendan Rynne from KPMG.99
3.6 Productivity growth Productivity is essentially the amount of inputs (including capital and workers) required by business
to make a particular output. If more output can be produced with a fixed quantity of inputs, then
productivity has improved. Growth in productivity is essential to improvements in household
incomes and standards of living.100
However, productivity is currently growing weakly, and well below what is needed to maintain
historical growth rates in Australia’s living standards.101 Treasury has argued that if labour
productivity grows at its long-term average from 2014 to 2025, then income growth per person will
slow to less than half the historical rate. Conversely, if we want income growth to be maintained,
then productivity will need to grow at almost double its rate since 2000.102
Treasury has also noted that Australia’s high company tax rate affects productivity;103 and the
evidence that company tax is highly inefficient (see Section 3.6) indicates the productivity benefits of
reducing this tax.
The Treasury modelling supports this argument. The modelling results in Table 2 have GDP (output)
increasing by more than labour input; this means that the policy should increase labour productivity
by 0.8%–1% over time. This is a bit under half a year’s worth of historical productivity growth.
Submission to the Senate Inquiry into Enterprise Tax Plan Bill 2016 Page 21
This result is consistent with Arnold et al (2011) who found in a study of 21 OECD countries,
including Australia, that lower corporate tax rates are estimated to boost productivity;104 and Vartia
(2008) who found in a study of 16 OECD countries, including Australia, that the average effective
corporate tax rate had a negative effect on productivity.105
3.7 Improvement to overall wellbeing There is common agreement that the company tax is the most harmful federal tax in terms of its
adverse effect on the economic wellbeing of Australians. This is often missed in the arguments about
the tax cut, and is a powerful counter to the arguments against the policy: cutting a particularly
harmful tax should be in the interests of all Australians. While studies differ on how harmful the tax
is, all the relevant studies agree that it is the worst federal tax:
Treasury analysis, cited in the government’s Tax discussion paper (Re:think), finds that
company tax is about twice as harmful to wellbeing as the personal tax, and more than 2.5
times as damaging as the GST.106
Modelling by KPMG Econtech for the Henry Tax Review found that company tax is more
than 1.5 times as harmful as a tax on labour, and 5 times as harmful as the GST.107
Modelling by Independent Economics in 2016 found that company tax is much more
harmful: over three times as detrimental as personal tax, and more than 7 times as
detrimental as the GST.108
Here, harm to wellbeing is the amount a household would pay to avoid a tax increase of a dollar.109
These figures mean that households receive a much greater improvement in their wellbeing from a
cut in the company tax rate than a cut in any other federal tax. In addition, the figures also are an
indication of the relative inefficiency of company tax compared to other taxes.
4 Other arguments for company tax cut
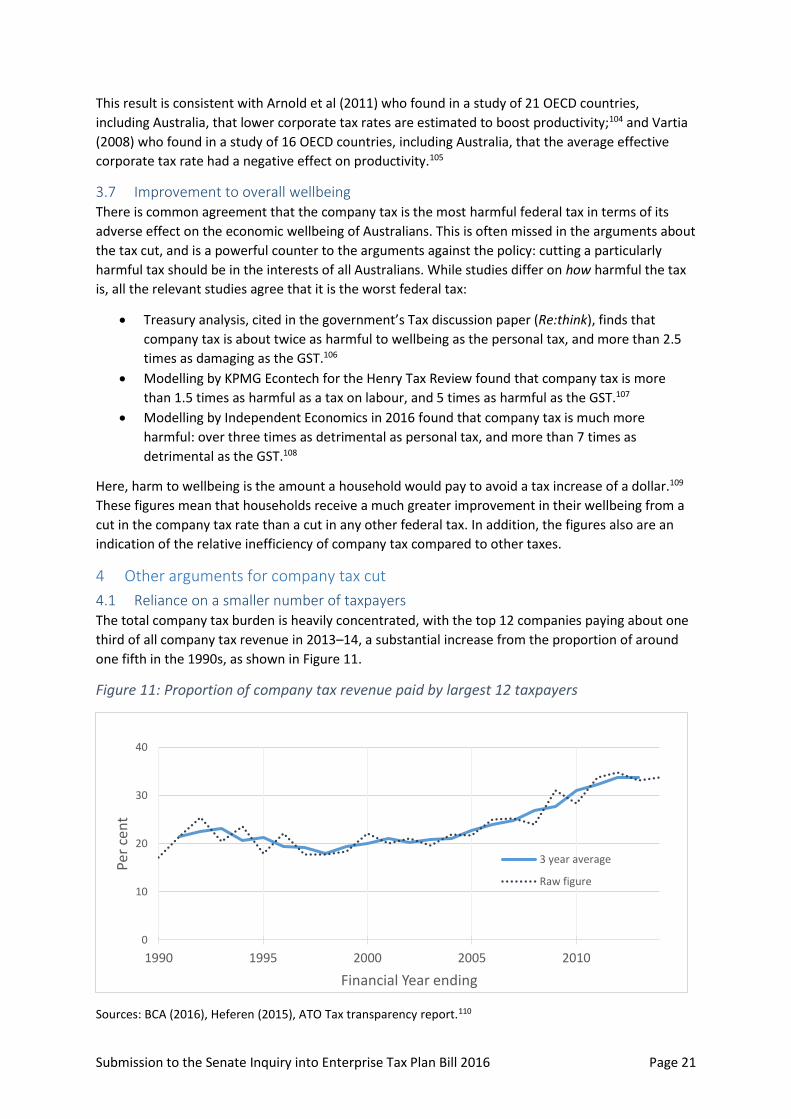
4.1 Reliance on a smaller number of taxpayers The total company tax burden is heavily concentrated, with the top 12 companies paying about one
third of all company tax revenue in 2013–14, a substantial increase from the proportion of around
one fifth in the 1990s, as shown in Figure 11.
Figure 11: Proportion of company tax revenue paid by largest 12 taxpayers
Sources: BCA (2016), Heferen (2015), ATO Tax transparency report.110
0
10
20
30
40
1990 1995 2000 2005 2010
Per
cen
t
Financial Year ending
3 year average
Raw figure

Submission to the Senate Inquiry into Enterprise Tax Plan Bill 2016 Page 22
A comparison with two other developed countries is informative. In the United Kingdom, corporate
taxpayers with a company tax bill over £50m paid a third (33%) of the total corporate tax bill in 2006,
but about a sixth (16%) in 2015.111 Over this period, the UK cut its corporate tax rate from 30% to
20%.112 By contrast, the concentration in the US has grown, and they have not cut their (federal)
company tax rate: in 1994, the taxpayers paying more than $100m paid 43% of total corporate tax
revenue, and this has grown to 69% in 2013.113 This is much faster than the growth in GDP over the
same period.114 So the reliance on large taxpayers has declined in the UK, where there were large tax
cuts, while the reliance has grown in the US where there were no tax cuts.
This indicates the risks to our tax system if there is no change to our company tax rate. Our tax
revenue is becoming more and more exposed to the risks and threats facing these individual
companies. A bad year for just one of these companies can create a major headache for the
government. In addition, the largest taxpayers may have no alternative but to be located in Australia
for the moment, but there is a risk that one or more of these companies may be driven to relocate
offshore if the gap to other tax rates becomes too great.
In the US, where the federal corporate tax rate remains at 35%, a number of multinational
businesses have moved offshore in so-called ‘corporate inversions’, potentially reducing US tax
payments by $US40 billion over the next 10 years.115 Similar moves could occur in Australia.
Some companies that could conceivably move offshore are those with substantial international
income, such as ANZ Bank (which paid $1.96 billion in Australian company tax payments in
2013−14), BHP Billiton (tax payments of $3.95 billion) or Rio Tinto ($3.05 billion).116 The loss of one
or more of these businesses would be a major hit to Australia’s tax revenue. While the move is
unlikely at the moment, it can’t be ruled out; and it is made more likely as our tax system becomes
more and more uncompetitive.
Policymakers should ask: is it worth risking the loss of such large amounts of tax revenue?
4.1.1 Do most of the benefits of the tax cut go to large businesses (including banks)?
Most of the company tax is paid by the largest businesses, so this means the short-run benefit of the
tax cut is focussed on these taxpayers as well. This has been used as an argument against the tax
cut,117 but this is the wrong perspective. In fact, this emphasises the problems noted above with the
current system, and the major risks faced by failing to reform the tax rate. The tax system is at
substantial risk from being so dependent on particular taxpayers, including the risk of one or more
leaving Australia.
In addition, the argument that large businesses benefit from the tax cut ignores the evidence that
workers obtain substantial benefits from the tax cut in the long run (see Section 3.3), and the rest of
the benefit of the tax cut goes to shareholders, with imputation reducing the impact on Australian
shareholders (see Box 1).
The argument that the company tax rate should be cut for small business alone is discussed in
Section 8.2.
4.2 Company tax is like a tariff on capital imports The company tax acts like a tariff on imported capital, as stated by senior Treasury officials.118
Australia has been well served by reducing its tariffs on imported goods, with studies showing that
Australia unilaterally opening for trade has benefited the economy as a whole.119 A similar argument
applies to company tax cuts: Australia as a whole will benefit from cuts to its tariffs on imported
capital. Some other perspectives from the tariff debate could be applied to company tax:

Submission to the Senate Inquiry into Enterprise Tax Plan Bill 2016 Page 23
Australia doesn’t have different tariff rates on small and large business; similarly, different
tax rates shouldn’t apply to small and large business (see Section 8.2).
Tariffs had different effects on different parts of the economy, but the decision to proceed
with the cuts was driven by the benefit to the whole economy. The cuts weren’t cancelled
because one segment of the economy benefitted or lost. Company tax cuts should be
analysed along the same lines: look at the benefit to the whole economy (see Section 3).
o Similarly, tariff cuts provided short run benefits to foreigners who sold products to
Australians; the tax cuts weren’t cancelled because of this supposed benefit. The
same approach should apply to company tax cuts (see Section 7).
Any concerns about the transitional impact of tariff cuts were partly addressed by phasing in
the tariff cuts over time; if there are similar concerns about the company tax cut then
phasing it in should address these concerns (see Section 8.1).
Tariff reform and tax cuts do not need to be budget neutral, noting that the company tax cut
combined with other policies is likely to be budget neutral in the long term (see Section 5.1).
Alternative uses for the revenue from tariffs did not lead to the tariff cuts being cancelled. A
similar approach could apply to company tax (see Section 5.3).

Submission to the Senate Inquiry into Enterprise Tax Plan Bill 2016 Page 24
5 Costs of the company tax cut
5.1 Impact of tax cut on Budget The gross cost of the company tax cut from 30% to 25% is about $8.2 billion or 0.5% of GDP,
assuming no investment response.120 However, the whole point of the tax cut is for investment to
expand and the economy to grow, and this is what the modelling finds (see Table 1). The larger
economy results in more tax revenue: company tax, personal tax and other tax revenue increases,
partly offsetting the cost of the tax cut. Factoring this in, the net cost of the company tax cut is
reduced by up to 49% in the Treasury modelling.121 This generates a net cost to revenue of 0.3% of
GDP (around $4.2 billion, see Table 3).
This is consistent with international evidence. For example, the UK Treasury argued that
between 45% and 60% of the cost of a UK corporate rate cut will be recouped because of
economic growth.122 A 50% recoupment has been suggested for the US.123
The long run cost of the tax cut is almost exactly offset by other measures in the 2016–17 budget: as
a result these measures combined have a long-run impact on the budget that is negligible, as shown
in Table 3, or an improvement if the superannuation measures announced on 15 September 2016124
are included.
Table 3: Funding the company tax cut
Measure Long run budget impact in 2015–16 dollars ($m)
Sources
Company tax cut
Gross cost -8,203 Independent Economics.
Net cost -4,184 Independent Economics, with Treasury’s net cost applied.125
Funding measures in 2016–17 Budget — estimated long-run impact
Anti-tax avoidance measures: diverted profits & integrity
1,417 2016–17 Budget, figure for 2019–20 converted to 2015–16 dollars.
Tobacco tax increase 2,038 2016–17 Budget, figure for 2019–20 converted to 2015–16 dollars.
Superannuation measures (combined effect of all measures)
721 2016–17 Budget, figures for 2019–20 converted to 2015–16 dollars.126
Total 4,176
Net impact -7
Note: Positive numbers indicate an increase in the budget balance while negative numbers indicate a
reduction. The changes to the superannuation measures announced on 15 September 2016127 are estimated
to provide a long run improvement to the budget of $76m in 2015–16 dollars, so including these changes
would mean the package as a whole improves the budget position by about $69m in the long run.128
The government has already stated that the revenue impact of the tax cut is offset by the first anti-
avoidance measure;129 allocating the other two items in Table 3 to fund the tax cut will mean the
package as a whole has negligible impact on the budget.
In addition, the net cost of the tax cut on its own ($4.2 billion) is likely to be an overestimate. As
argued in Section 3.2.4, the modelling underestimates the investment response of the tax cut, thus
also underestimating the dynamic benefits to tax revenue. In addition, Treasury’s modelling assumes
that companies don’t change their debt to equity ratio,130 even though companies are likely to

Submission to the Senate Inquiry into Enterprise Tax Plan Bill 2016 Page 25
reduce debt financing with a company tax cut,131 reducing their debt deductions and hence the
revenue cost of the policy.
This means that the measures in Table 3 in the long run are likely to improve the budget position.
Therefore, it is misleading to compare the modelling benefits to a supposed budget cost, because
the budget cost, at least in the long run, is zero or better. This is discussed further in Appendix A.
In addition, this means that the company tax cut need not be funded by bracket creep (the failure to
index personal tax thresholds to inflation or wages growth132), as has been argued;133 it can instead
be funded by the revenue raising measures in Table 3.
If the measures in Table 3 are seen to be inadequate to fund the company tax cut, then further
funding could come from abandoning the legislated increase in the superannuation guarantee (SG)
to 12% (therefore maintaining the SG at its current rate of 9.5%). This would increase revenue by an
estimated $2.2 billion.134 Not only does the SG increase have a significant cost to the Budget, it also
is expected to lead to a reduction in GDP, wages, employment, and even investment — all contrary
to the expected outcomes of the company tax cut. Evidence for these harmful effects is detailed in
Potter (2016).135
5.2 Impact of tax cut on overall tax burden Cancelling the company tax cut will mean that Australia foregoes all the economic benefits detailed
earlier in this paper. In addition, the overall tax burden will increase to record highs. The 2016−17
Budget makes the technical assumption that the total tax burden will reach 23.9% of GDP in
2021−22 and be permanently capped at this level.
If the company tax cut is abandoned, the tax burden will breach this assumed cap. The budget will
be taking the tax increases in Table 3, but not providing the offsetting cut in company tax.
The impact on the overall tax burden is shown in Figure 12. The forecast total tax burden after
2018−19 (light blue line) is growing strongly. If the tax cut is cancelled, the total tax burden (red line)
will grow further, and go above its previous all-time high in 2026–27 (dashed line), based on current
forecasts.

Submission to the Senate Inquiry into Enterprise Tax Plan Bill 2016 Page 26
Figure 12: Forecast tax burden for federal government
Source: 2016–17 Budget, PBO, author’s calculations. The record for the highest tax burden as a share of GDP
(24.27%) was reached in 2004–05. See further discussion in Potter (2016).136 Note that these figures are for the
gross cost of the company tax cut, not the net cost.
However, if the tax cap becomes government policy, then the revenue cost of the tax cut will be fully
offset by the measures in Table 3, and the tax cut will not be paid for by bracket creep as has been
argued.137 As a result, the company tax cut will have no impact on the ability to provide personal tax
cuts.
5.3 Comparison with other policies It has been argued that the funds for a company tax cut should be used for other policies, such as
education.138 However, a reduction in company tax does not mean that other worthwhile
investments must be abandoned. Government decisions do involve tradeoffs between competing
goals, but this does not mean that a company tax cut prevents everything else from occurring.
Proposals with benefits substantially greater than costs should proceed, regardless of whether there
are other policies with substantial benefits. The government only needs to choose between different
policies if they have substantial budget costs. However, this does not have to apply to the company
tax cut — as argued in Section 5.1, the policy is budget neutral when combined with several other
policies from the 2016–17 Budget, meaning there is no need to choose between the tax cut and any
other policy.
Therefore, a company tax cut does not mean that spending on education cannot occur. They can
both occur, and both should be subject to detailed assessment of their costs and benefits to see if
the policies are worthwhile — similar to the detailed analysis that has occurred for the company tax
cut, with multiple reports being provided into the long and short run impact of the policy.
However, the proposals for large increases in education spending have not been subject to nearly as
rigorous analysis as the company tax cut. There have been generic statements about the value of
education in the broadest terms, but no cost-benefit analysis of the proposals being put forward,
even in rough terms.139
Tax burden with tax cut: 23.90
Tax burden without tax cut: 24.40Previous all time high: 24.27
23.0
23.5
24.0
24.5
2019 2021 2023 2025 2027
% o
f G
DP
Financial year ended

Submission to the Senate Inquiry into Enterprise Tax Plan Bill 2016 Page 27
Most alternate policies, including education spending or infrastructure spending, involve a cost
today for a benefit in the future; but this is similar to the company tax cut. So the concerns that the
benefits of the tax cut don’t occur for some time apply equally to the education and infrastructure
policies. Conversely, if it is worthwhile spending money today on education to improve economic
outcomes in several decades, then it is also sensible to provide a tax cut where the benefit will occur
more quickly (as noted in Section 8.1).
6 Tax avoidance Much of the debate over the company tax cut has focussed on tax avoidance, particularly by
multinational companies.
6.1 Should the tax cut be cancelled because of corporate tax avoidance? An argument is sometimes made that the company tax cut should not go ahead because of
supposedly widespread corporate tax avoidance.140 This argument is particularly odd: it is effectively
arguing that (a) taxes should remain unaffected at zero on the largest tax avoiders who pay no tax;
but (b) taxes should remain highest on those businesses who pay the full rate of tax. Similarly,
cancelling the tax cut will have the greatest harmful effect on the businesses who pay the most tax
and the smallest impact on those who pay the least tax.
In addition, companies supposedly not paying tax have nothing to do with the companies that do
pay tax. Why should the tax rate of Australian-focussed businesses such as Woolworths and
Wesfarmers (each paying around $1bn in tax in 2013–14)141 be determined by the tax practices of
the (supposed) multinational tax avoiders? This is like putting a penalty on the local corner store or
hairdresser because the local petrol station had a fuel leak. It is imposing a type of collective
responsibility for the ‘sins’ of others, which is antithetical to good public policy.
Even worse, failing to reduce company tax will actually encourage tax avoidance, as tax avoidance is
greater when the tax rate is higher.142
Reducing tax avoidance and tax cuts should not be seen as alternatives. They can and should happen
simultaneously. In fact, Section 5.1 notes that the company tax cuts are being funded by measures
to address tax avoidance.
6.1.1 Evidence of tax avoidance
The overall tax revenue data does not indicate there is currently a major problem with tax
avoidance, as Australia’s tax to GDP ratio and the effective tax rate are well above historical
averages and forecast to increase in coming years (see Section 2). The ATO itself has argued that the
evidence does not support the argument that there is widespread corporate tax avoidance.143
Nevertheless, there are likely to be individual companies that are reducing their taxes. But this again
does not argue against overall tax cuts: the companies that avoid tax have nothing to do with those
that don’t avoid tax.
The ATO’s corporate tax transparency report144 shows a number of companies paying zero tax, or
less than the 30% tax rate, in 2013–14. However, this can occur for entirely valid reasons, including:
A business making a loss. In each of the last 10 years, between 20% and 30% of the ASX top
500 companies made a loss.145
Businesses making losses in previous years that they carry forward to offset against tax in
2013–14. These companies are being penalised because they effectively can’t obtain the full
value of the loss for several years.

Submission to the Senate Inquiry into Enterprise Tax Plan Bill 2016 Page 28
Companies receiving foreign income, particularly where the income has been subject to tax
overseas.
Businesses making use of tax incentives, such as the R&D tax concession and accelerated
depreciation.
Other reasons for companies paying what might appear to be low rates of tax have been highlighted
by the ATO.146
All these reasons for low rates of tax payment have been explicitly put into the tax law by
Parliament, often with bipartisan support.147 As a result, the community should welcome, not
criticise, the use of these provisions.
6.1.2 The future of tax avoidance
While tax avoidance might not be a current issue, it may grow strongly in coming decades, for
reasons including:
More economic activity may move to low tax locations: activities that have no physical
location at all (such as the sale of software), or services that can be delivered remotely (such
as legal, accounting, design, administration and some medical services). Online services such
as Airtasker are facilitating this change.148
Similarly, intangible assets (such as patents, trademarks and goodwill) can be located in low
tax jurisdictions and licenced out to Australian operations at high prices. Because these
intangibles are usually unique, it is very hard to argue that these licencing prices are
excessive.149
Consumers will be more easily able to bypass taxes imposed on Australian businesses by
buying directly from overseas. Examples include digital downloads, and Australian
consumers buying insurance direct from offshore insurers. The government has recently
imposed GST on these type of transactions, but it is hard to see that any company tax could
be imposed.
Cryptocurrencies will make it easier to conduct transactions that are, at least in theory,
completely undetectable and impossible to tax.
A higher company tax rate will encourage this process of erosion of the company tax base,150 and
will penalise the local companies that can’t implement these avoidance (or evasion) strategies.
6.2 Tax avoidance in the modelling The modelling includes assumptions that businesses avoid Australian tax through shifting profits to
low-tax countries, or other forms of tax avoidance.
The assumptions about tax avoidance have been debated, with some questioning whether tax
avoidance is particularly affected by the company tax rate.151 However, the Treasury modelling is
only slightly sensitive to the assumptions about tax avoidance. In addition, if the doubters are
correct and avoidance is not particularly responsive to tax rates, then the Treasury modelling says
the economic benefit is larger, not smaller.152
The Independent Economics results have been criticised because of their assumptions about tax
avoidance and they have responded to these criticisms.153

Submission to the Senate Inquiry into Enterprise Tax Plan Bill 2016 Page 29
7 Benefits to foreigners Australia’s imputation system means that company tax has a greater short run impact on foreign
shareholders than Australian shareholders (see Box 1). This conversely means that in the short run,
the tax cut provides a disproportionate benefit to foreigners.154
This has been used as an argument against the tax cut.155 But it is truly perverse to argue that
Australia should forego a benefit to our wages, employment, incomes, GDP, exports and investment,
just because some foreigners benefit as well — this is a self-destructive form of xenophobia.
In fact, if there are foreigners who benefit as well as Australians, this should strengthen the
arguments for the tax cut. A policy that indirectly benefits foreigners should increase our support for
the policy, not decrease it: just the same as a policy that caused collateral damage to foreigners
should garner lower levels of support.
In addition, the supposed benefit to foreigners is probably overestimated in both the short term and
long term:
The short term benefits of the tax cut for domestic investors are assumed away in the
modelling, when in reality Australian investors may feel at least a third of the impact of the
tax cut on average (see Section 3.2.4). So this rebalances the short term benefit towards
Australians.
In the long term, the benefit to foreigners is unlikely to last: the Treasury modelling argues
that foreign investors obtain no benefit at all in the longer term156 (see further discussion in
Box 3).
7.1 Benefit to US Treasury It has been argued that the proposed tax cut will generate a large ‘gift’ to the US government,
because US companies operating in Australia will pay more US tax if the Australian tax rate is
reduced.157 This is called the treasury transfer effect. However, this argument is a furphy, as stated
above: Australia shouldn’t forego a benefit to ourselves just because some non-Australians
(including the US Treasury) also gain a benefit.
In addition, if this treasury transfer offset occurred dollar for dollar, then every effort of a US
multinational to reduce their Australian tax would be completely fruitless, having no impact on their
bottom line. Yet we have accusations of large-scale tax avoidance by US multinationals such as
Google, Microsoft, Apple and Chevron, contradicting the impact of the treasury transfer effect.
The OECD has downplayed the relevance of the treasury transfer effect,158 as has the Canadian
Department of Finance159 and the Henry Tax Review, 160 which also cited evidence that foreign
investment is very sensitive to company tax rates regardless of whether or not the source country
operated a credit system like the US.161 In other words, Australian company tax cuts lead to
increases in investment from the US just as much as investment from other countries.
Zodrow (2010)162 states that the treasury transfer effect is of ‘severely limited’ relevance for
numerous reasons. In particular, many US firms are able to defer US tax by keeping funds offshore;
the value of these offshore funds are greater than $3.1 trillion according to reports (also discussed in
Box 2).163 The incentives for US firms to retain funds in Australia will increase if Australia cuts its
company tax rate; this will encourage these businesses to reinvest in Australia. Other reasons cited
by Zodrow (2010)164 include: US firms having excess foreign tax credits; the use of ‘tax sparing’
provisions; and US firms using avoidance strategies to reduce or eliminate additional US taxes on
profits earned offshore.

Submission to the Senate Inquiry into Enterprise Tax Plan Bill 2016 Page 30
8 Concerns with the policy and alternate approaches
8.1 Phasing in/speed of tax cut The government is proposing that the company tax cut be phased in over 10 years, reaching 25% in
2026–27.169 However, the government has not provided an adequate explanation of this slow phase
in. There is a clear question: if the tax cut has the substantial benefits highlighted in the rest of this
paper, why not achieve these benefits sooner? There is a need today for greater investment, higher
productivity and faster wages growth (see Section 3), and these benefits will be delayed with a slow
phase in of the tax cuts. If the reform is worthwhile doing, it is worthwhile doing now.
While the government hasn’t made this clear, the most likely reason for the slow phase in is to limit
the short term cost of the policy. However, this approach is not needed: the tax cut, when combined
with other measures from the 2016–17 Budget, has no long-term impact on the budget (see Section
5.1). This is similar to the previous company tax cut, from 36% to 30%, which was fully funded by
changes to business tax concessions, and was introduced over a much shorter period than the
current proposal.
Other possible arguments for phasing in the tax reduction are:
If the tax cut is seen as ‘locked in’, then business investment is likely to respond before the
tax cuts are fully phased in. This brings forward the benefits of the tax cut: the Treasury
model argues that the benefits phase in over 20 years;170 a guaranteed future tax cut will
mean the benefits occur earlier, probably by several years (although this bring forward
hasn’t been quantified precisely).
o This means there will be increased business investment at no budget cost, compared
to a tax cut that isn’t preannounced.
Box 4: Australia Institute’s estimate of the ‘benefit’ to the US Treasury
The Australia Institute has argued the benefit of the Australian tax cut to the US Treasury is about
$1 billion in 2026–27.165 However, this calculation has major flaws, rendering it of no value.
First, the data they use has US companies paying total Australian tax of about $US2.9bn on average,
but they are unable to indicate what proportion of this is from Australian company tax (as opposed
to other Australian taxes). So the report guesses that the proportion is 80%.166 The report argues
that the other possible Australian taxes would make up only a small portion of the total figure,
stating that interest withholding taxes are low in value. However, the report doesn’t (and probably
couldn’t) remove the effect of all other relevant Australian taxes. Hence there is no real analysis
behind the 80% proportion, which the final figure of $1bn relies on.167 As this 80% figure is simply
fabricated, the overall figure should be treated as being made up as well.
Second, the calculations do not include the impact of excess foreign tax credits. US companies with
excess tax credits will feel no impact of an Australian company tax cut, as argued by Zodrow
(2006).168 This will partly, or fully, offset the supposed ‘transfer’ to the US Treasury — but the
Australia Institute does not even mention excess foreign tax credits, let alone estimate the impact
on their figure.
As a result of these problems, the Australia Institute’s figure of the supposed transfer to the US
Treasury can be dismissed as having no value for policy analysis.

Submission to the Senate Inquiry into Enterprise Tax Plan Bill 2016 Page 31
o Importantly, this benefit only occurs if the tax cut is guaranteed. If there is
uncertainty about the policy happening — for example if some politicians commit to
repealing the tax cut — then this bring forward will be much smaller or zero.
The faster investment will bring forward all the other benefits of the tax cut, including higher
GDP and wages, and the offsetting boost in tax revenue, a point noted in the Treasury
modelling.171 This may mean that some of the offsetting revenue from the tax cut can occur
before the cut is fully implemented. This also means the transition costs of the policy are
smaller.
A phase in over time will moderate the incentive for businesses to shift revenue or costs
between years when the tax rate changes.
The phase in will substantially reduce any windfall gain to existing investment (including
foreign investors), because of the depreciation of assets over the phase in period.
However, these arguments for phasing can be better addressed by an alternate policy — reducing
tax on new (equity) investment only. This would limit the revenue cost, allowing for a larger tax cut
on new investment; substantially reduce tax avoidance opportunities (including through profit
shifting); and largely eliminate any windfall gains. A paper written for the Henry Tax Review
discusses this proposal, implemented as an Allowance for Corporate Equity.172 This is also better
than an investment allowance, which cuts tax on business asset purchases only; this proposal has
been critiqued as distortionary and increasing complexity by the government’s tax discussion paper
(Re:think),173 and the Henry tax review.174
8.2 Lower rate for small business The company tax rate is 28.5% for small business, and 30% for all other businesses.175 This approach
could continue, with a lower tax rate for smaller businesses, however defined. While this option has
not been modelled, there are a number of reasons to expect that a greater economic benefit occurs
from providing the tax cuts to larger businesses.
For example, over the period 2009 to 2015, employment in larger businesses grew much faster than
their share in total employment; similarly the value added by larger businesses grew faster than
their share of total value added. This is shown in Figure 13.
Figure 13: Contributions to growth in employment and value added by business size
Source: ABS (2016).176
0%
20%
40%
60%
employment small employment large value added small value added large
Share in 2014-15 Share of growth 2008-09 to 2014-15

Submission to the Senate Inquiry into Enterprise Tax Plan Bill 2016 Page 32
There are many other characteristics of larger businesses indicating that hampering their growth will
be problematic. For example, larger businesses, in comparison to small business, are more likely
to:177
Provide flexible work hours
Allow staff to purchase extra annual leave, cash out annual leave or take leave without pay
Allow selection of roster or shift
Allow job sharing
Allow work from home
Provide paid parental leave
Provide flexible use of leave (such as to care for other people)
Collaborate with other businesses
Export
Face more competition
Experience increased profitability, productivity and employment in the year to 2014−15
Provide increased formal training for employees, and support for community projects,
charity contributions or support in the year to 2014–15
Small business have a greater proportional burden from regulation than larger business,178 but also
face advantages over larger business from payroll tax. A small business can pay no payroll tax at all,
while a large business can pay more than 6% tax on their payroll costs.179 So it isn’t clear that a lower
company tax rate is required to offset other regulatory or tax burdens imposed by the government.
The complexity and cost of having two rates are reasons why a lower tax rate for small business was
rejected by the Henry Tax Review,180 and the UK’s Mirrlees Review in 2011,181 and critiqued by the
government’s tax discussion paper (Re:think).182

Submission to the Senate Inquiry into Enterprise Tax Plan Bill 2016 Page 33
Conclusion It is hard to find an economic policy the Australian government could adopt that would produce the
economic benefits of the company tax cut relative to its cost,183 particularly as the policy can be
adjusted so it has no net impact on the budget. The arguments for the policy include:
Australia’s company tax system is uncompetitive on many measures, and is likely to become
more so as most other countries continue to reduce their tax rates. This uncompetitiveness
exists even when the effect of imputation is fully removed, though the arguments for doing
this adjustment are weak.
This shows the substantial risks facing the tax system, which are further shown by the
growing reliance of company tax on a small number of taxpayers. These risks are being
compounded by the failure to reduce the tax rate.
The tax cut provides substantial benefits, which should help address Australia’s poor
investment, wages, income and productivity performance.
o Nevertheless, the modelling probably underestimates the benefits of the tax cut,
particularly by assuming locally-financed investment does not increase due to
reductions in the tax rate. The evidence from the financial market and companies
themselves suggest the investment response will be larger than assumed.
A large number of international studies support these benefits to investment, wages, GDP
and productivity.
Company tax is similar to import tariffs and should be reformed, similar to Australia’s
substantial trade liberalisation program.
Tax avoidance argues for, not against, the tax cut. There is no argument for cancelling the
tax cut for companies paying the full rate of tax because some other unrelated companies
are (supposedly) avoiding tax. Individual corporate taxpayers have absolutely no
responsibility for unrelated businesses that avoid tax.
If additional benefits of the tax cut go to foreigners then this actually enhances the
arguments for the tax cut.
The long term benefits of the tax cut largely go to workers, rather than large businesses or
foreigners.
The cost of the measure to the budget is small, or negligible if funded by other budget
revenue measures.
In addition, the benefits of the policy suggest it should be implemented more quickly. The evidence
also suggests that the tax cut should not be restricted to small business only, but should be provided
to all business.

Submission to the Senate Inquiry into Enterprise Tax Plan Bill 2016 Page 34
Appendix A: how to present benefits of the tax cut There are numerous ways to present the benefits of the tax cut; some of these ways incorrectly
downplay the net benefits of the policy.
The simple rule is: compare the costs and benefits on the same basis.
Most importantly, the modelling results, including the results in Table 2, are net of costs; the
benefits shown in the modelling are after the costs are subtracted. So it is misleading to compare
these results to gross costs. For example, the improvement in national income of 0.6% in Treasury’s
scenario 2 (see Table 2) is not readily comparable to the reduction in revenue from the tax cut,
because this scenario has no impact on total tax revenue: the company tax cut is fully funded from
other tax increases. The net revenue cost of this option is zero — or the benefits come at zero net
cost.
This means the revenue cost should not be compared to the benefits in scenarios where the total tax
burden is unchanged. A comparison is less problematic in Treasury scenario 3, which does not
involve offsetting tax increases — the tax cut is instead funded by cutting wasteful government
spending: this is because the costs of the tax cut are effectively assumed away in this scenario.
Similarly, the company tax cut combined with other measures in the 2016–17 Budget has no long-
term impact on the budget (see Section 5.1), again arguing that comparing benefits with revenue
cost is misleading.
Even assuming there are none of these offsets to revenue, there are still issues with the way the
benefits of the tax cut can be presented as detailed below.
Approach 1: change in growth rates If benefits are presented as changes in growth rates, then costs should also be.
It has been argued the modelling has the additional wages growth because of the tax cut as around
0.1% per year over 20 years. But on the same basis, the slowing of federal government revenue
growth is also about 0.1% per year over 20 years (noting that the national wage bill is substantially
larger than federal government revenue)184.
Approach 2: level of numbers after 25 years It has been argued the tax cut will mean that income per person will be 45.7% higher in 25 years’
time, and without the tax cut incomes will instead be 45.1% higher.185
But revenue should also be presented on the same basis: without the tax cut, federal government
revenue per person will be 45.7% higher in 25 years’ time, and with the tax cut revenue will be
43.6% higher (note that national income is much larger than government revenue186). This revenue
cost won’t dramatically change the government revenue story.
Approach 3: adding across years If costs are added together across many years, then the benefits should also be. It is incorrect to
compare the benefit in one year with the costs over the next 10 years. So it is also wrong to compare
the 10 year cost of $48bn with the single year improvement in wages of 1.1%. As the benefits of the
tax cut occur gradually over time, there are no simple figures on the benefits summed over the next
10 years.
A better comparison is of the long-run yearly cost and long-run yearly benefit: the net revenue cost
is $4.2 billion (see Section 5.2) while the benefit to national income is $8.9 billion.187

Submission to the Senate Inquiry into Enterprise Tax Plan Bill 2016 Page 35
Appendix B: details of data
International Comparisons All data for international comparisons is sourced from the OECD unless otherwise specified. Data for
the OECD will not match data sourced from Australia, in particular because Australia reports annual
data on a financial year basis, while the OECD reports on a calendar year basis.
The OECD does not represent all developed countries, particularly excluding Taiwan. This issue is
discussed in Potter (2016),188 section 5.1. Figures are generally for 2013, as this is the most recent
year with Australian data. The weighted average is weighted by GDP at purchasing power parity
(using OECD numbers) at the relevant year.
The deductions from international comparisons are as follows:
The revenue impact of the company tax cut is $7,727m in 2013 dollars. This is calculated as
the estimated cost of $8,203m for 2015–16 (from Independent Economics),189 converted to
2013 dollars using nominal GDP as the deflator.
The value of imputation credits is $19bn, from the government’s tax discussion paper
(Re:think).190
The revenue from rent taxes is $1,817m, the total of the figures for the Petroleum Resource
Rent Tax and the Mining Resource Rent Tax for the 2012–13 financial year, sourced from the
2014–15 Budget (the figure for the 2013–14 financial year is lower).
ATO Data on retained earnings The data on retained earnings is from the ATO Taxation Statistics for 2013–14, Company table 1.191
Dividends as percentage of profit covers the period 1995–96 to 2013–14, and is calculated as the
ratio of total dividends for all companies divided by total profits for all companies. Dividends as
percentage of taxable income covers the period 2009–10 to 2013–14, and is calculated as the ratio
of total dividends for all companies divided by total taxable income for all companies. Growth in
franking accounts covers the period 1995–96 to 2013–14.
Australian data Budget figures are sourced from the 2016–17 Budget and are on a cash basis. Economic figures are
from the ABS National Accounts for June 2016. Historical data on company tax rates is from the
ATO’s Taxation Statistics for 2013–14, Company Table 1.192 Historical data on company tax revenue is
sourced from Parliamentary Budget Office (2014).193
As noted above, these figures do not match OECD figures for Australia.

Submission to the Senate Inquiry into Enterprise Tax Plan Bill 2016 Page 36

Submission to the Senate Inquiry into Enterprise Tax Plan Bill 2016 Page 37
1 Scott Morrison & Mathias Cormann (2016) 2016–17 Budget, Paper 2, page 41. 2 Sources: 2016–17 Budget and ABS, see Appendix for details. 3 Sources: Parliamentary Budget Office (PBO), 2016–17 Budget and ABS, see Appendix B for details. Average is for the years 1982–83 (the earliest year with available data from the PBO) to 2015–16. 4 See Robert Carling & Michael Potter (2015) Exposing the Stealth Tax: the Bracket Creep Rip-off, CIS Research Report 8, 13 December. 5 2016–17 Budget. 6 2016–17 Budget; Independent Economics (2016) Company tax scenario, Report prepared for the Department of the Treasury. The net revenue figure is the Independent Economics figure offset by 49%, the revenue dividend in scenario 3 in Michael Kouparitsas, Dinar Prihardini & Alexander Beames (2016) Analysis of the long term effects of a company tax cut, Treasury Working Paper 2016-02. 7 See Appendix B. 8 Michael Potter (2016) The case against tax increases in Australia: The growing burden, CIS Research Report 15, Section 5.1. 9 Source: OECD Revenue Statistics. See Appendix B for details. The tax rate is for 2016, while the weighting is based on GDP figures for 2015. The OECD average of 25% sometimes quoted is the unweighted average of the corporate tax rate of all levels of government. 10 Céline Azémar, Rodolphe Desbordes & Ian Wooton (2015) "Country Size and Corporate Tax Rate: Rationale and Empirics" CEPR Discussion Papers 10800; and Davide Furceri & Georgios Karras (2011) "Tax Design in the OECD: A Test of the Hines-Summers Hypothesis" Eastern Economic Journal, 37(2), pp239-247. See also page 8 of Christopher Heady (2010) Directions in Overseas Tax Policy, paper presented to Melbourne Institute – Australia’s Future Tax and Transfer Policy Conference. 11 Source: OECD Revenue Statistics. See Appendix B for details. Linear regression is of corporate tax rate in 2015 against GDP at purchasing power parity in 2015 (the most recent year available). The r-squared is 29% for the regression including the US, and 24% for the regression excluding the US. The r-squared for regressions on the national corporate tax rate are lower at 13% (including US) and 2% (excluding US). 12 Source: OECD Revenue Statistics. Figures are for 2016. 13 See Appendix B. 14 Source: KPMG Corporate tax rates table, available from: https://home.kpmg.com/xx/en/home/services/tax/tax-tools-and-resources/tax-rates-online/corporate-tax-rates-table.html Australia is included in Oceania, see details here: https://home.kpmg.com/xx/en/home/services/tax/tax-tools-and-resources/tax-rates-online.html 15 Source: KPMG Corporate tax rates table. Note that these are unweighted averages. 16 John Daley & Brendan Coates (2016) “The full story on company tax cuts and your hip pocket”, The Conversation, 18 May; David Richardson (2016) Company Tax cuts: an Australian Gift to US Internal Revenue Service, The Australia Institute Briefing Paper, May; and David Richardson (2015) Cutting the company tax rate: Why would you? The Australia Institute Discussion Paper, December. 17 The ATO explains imputation in more detail at this link: https://www.ato.gov.au/business/imputation/in-detail/dividends---imputation/reference-guide/imputation-reference-guide/ 18 Deloitte Corporate Finance (2014) Franking credits who is Right?, November; and Australian Government (2015) Re:think Tax discussion paper, page 86. Foreign investors can use imputation credits to offset dividend withholding taxes, but these two cited reports argue that the value to foreign shareholders is limited. 19 Other reasons for devaluing imputation credits are stated in Stephen Gray (2016) JASSA: Dividend imputation and the corporate cost of capital, Finsia’s InFinance, 18 April. 20 Michelle Bergmann (2016) “The Rise in Dividend Payments”, RBA Bulletin, March Quarter. 21 Giang Truong, Graham Partington, and Maurice Peat (2008) “Cost-of-Capital Estimation and Capital-Budgeting Practice in Australia” Australian Journal of Management, June, 33, pp95-121. 22 Deloitte Corporate Finance (2014) Franking credits who is Right?; and Gray (2016) Dividend imputation and the corporate cost of capital. This paper states the most recent decisions of the Australian Competition Tribunal were that imputation credits should be discounted by 75% (ie valued at 25% of face value). 23 Australian Government (2015) Re:think, page 83. 24 Source: OECD Revenue Statistics, see Appendix B for details. 25 As above. 26 The OECD figures for company tax revenue include resource rent taxes, see Peter Hendy & Dick Warburton (2006) International comparison of Australia's taxes, p51.

Submission to the Senate Inquiry into Enterprise Tax Plan Bill 2016 Page 38
27 Source: OECD Revenue Statistics and author’s calculations, see Appendix B for details. 28 Source: OECD Revenue Statistics, see Appendix B for details. 29 OECD (2000) Tax Burdens: Alternative Measures, OECD Tax Policy Studies No. 2, OECD; and John Clark, Brant Pridmore and Nicholas Stoney (2007) “Trends in Aggregate Measures of Australia’s Corporate Tax Level”, Economic Roundup, Winter. 30 The tax cuts are expected to cause increased growth, and this growth leads to higher tax revenue. See discussion in Section 5.1. 31 See for example Russell Thomson (2013) The effectiveness of R&D tax credits: cross-industry evidence, Melbourne Institute Working Paper 18/13; and Nirupama Rao (2013) “Do Tax Credits Stimulate R&D Spending? The Effect of the R&D Tax Credit in its First Decade”, Journal of Public Economics, 140, pp1–12. 32 The OECD.Stat figures do not separately report on corporate profits; instead the figures combine both corporate and non-corporate profits. As a result the effective tax rate on company tax can’t be calculated from OECD figures. 33 Source: Figure 2 of PwC & Business Roundtable (2011) Global Effective Tax Rates, April 14. The average in the Business Roundtable paper excludes the United States; the average in this paper includes the US. 34 Source: http://www.pwc.com/gx/en/services/tax/paying-taxes-2016/comparative-modeller.html The World Bank report was written in conjunction with PriceWaterhouse Coopers. 35 Jack Mintz, Philip Bazel & Duanjie Chen (2016) Growing the Australian economy with a competitive company tax, Minerals Council of Australia Policy paper, March. 36 More details on GOS and the differences with corporate profit are in Clark et al (2007) Trends in Aggregate Measures of Australia’s Corporate Tax Level. 37 Lynnley Browning (2016) “Trump's offshore tax-cut pitch falls flat in Silicon Valley”, Sydney Morning Herald, August 29. 38 The World Economic Forum’s Global Competitiveness Ranking has the US at 3rd, compared to Australia at 21st, in 2016. The IMD World Competitiveness Yearbook rates the US at 3rd and Australia at 17th in 2016. However, Australia is rated better than the US on the Heritage Foundation Index of Economic Freedom. See references in Section 2.5. 39 OECD (2010) Tax Policy Reform and Economic Growth, OECD Tax Policy Studies No 20. 40 The Fraser Institute’s measure of Economic Freedom of the World also shows Australia’s ranking falling from fifth in 2010 (the highest ranking Australia has achieved) to tenth in 2014, the latest year available. See: https://www.fraserinstitute.org/resource-file?nid=10159&fid=4820 41 World Economic Forum (2015) Global Competitiveness Report 2015-2016, 30 September. 42 IMD World Competitiveness Center World Competitiveness Yearbooks, report for Australia, available from CEDA’s website: http://www.ceda.com.au/research-and-policy/explore-all-ceda-research/surveys/world-competitiveness-yearbook 43 The Heritage Foundation Index of Economic Freedom, available from: http://www.heritage.org/index/ 44 Productivity Commission (2016) Regulation of Agriculture, Draft Report, p460. 45 Kouparitsas et al (2016) Analysis of the long term effects of a company tax cut. 46 Labour productivity is measured as the increase in GDP divided by the increase in employment. 47 Treasury also indicates the benefits under scenario 2 may be overestimates. See Kouparitsas et al (2016), pages 4 and 20. 48 Independent Economics (2016) Company tax scenario; KPMG Economics (2016) Modelling the macroeconomic impact of lowering the company tax rate in Australia, report to the Treasury. A table comparing the results of the three models is in Table 3 in The Treasury (2016) Economy-wide modelling for the 2016-17 Budget, 3 May. 49 Box 12.1 of Productivity Commission (2016) Regulation of Agriculture. 50 Page 448 of Productivity Commission (2016) Regulation of Agriculture; and Adam McKissack and Jessica Xu (2016) Foreign investment into Australia, Treasury Working Paper 2016-01. 51 Australian Bureau of Statistics (2015) Australian System of National Accounts, 2014-15, Cat No 5204; and 2016–17 Budget. 52 NAB Group Economics (2016) “The Mining ‘Cliff’: How far have we come?”, 10 June. 53 United Nations Conference on Trade and Development (UNCTAD) (2016) World Investment Report 2016 54 The average price for three-month bank accepted bills was 1.76% in August 2016, the lowest since the RBA’s records started in June 1969. Source: http://www.rba.gov.au/statistics/tables/xls/f01hist.xls six-month bills are similarly at a record low. 55 Su-Lin Tan (2016) “Record low rental yields in Sydney and Melbourne a risky sign, Moody’s warns” Australian Financial Review, 11 April.

Submission to the Senate Inquiry into Enterprise Tax Plan Bill 2016 Page 39
56 Box B.5 of OECD (2010) Tax and economic growth. 57 Lars Feld & Jost Heckemeyer (2011) “FDI and Taxation: A Meta-Study” Journal of Economic Surveys 25, pp233–272. 58 Page 48 of International Monetary Fund (2016) IMF Fiscal Monitor, April. 59 Simeon Djankov, Tim Ganser, Caralee McLiesh, Rita Ramalho and Andrei Shleifer (2010) “The Effect of Corporate Taxes on Investment and Entrepreneurship.” American Economic Journal: Macroeconomics, 2(3), pp31-64. 60 Jens Matthias Arnold, Bert Brys, Christopher Heady, Åsa Johansson, Cyrille Schwellnus & Laura Vartia (2011) “Tax Policy for Economic Recovery and Growth”, The Economic Journal, 121(550), pp F59–F80. 61 Laura Vartia (2008) “How do taxes affect investment and productivity? Industry level analysis of OECD countries” OECD Economics Department Working Papers, No. 656. 62 Karel Mertens and Morten Ravn (2013) “The Dynamic Effects of Personal and Corporate Income Tax Changes in the United States” American Economic Review 103 (4), June, pp1212–1247. 63 Brent Balinski (2014) “CSL chooses high-cost Switzerland over Australia for new plant”, Manufacturers’ Monthly, 18 August; and Jessica Gardner (2014) “Why CSL chose high cost Switzerland over high cost Australia”, Australian Financial Review, 18 August. 64 Ben Potter (2016) “Company tax canned shift to Sydney, Catcha Group's Patrick Grove says”, Australian Financial Review, 9 June. 65 Kouparitsas et al (2016), p32. 66 The figures are author’s calculations. The increase in investment was converted to share of 2013–14 GDP, then converted back into percentages of the Treasury forecast of business investment in 2016–17. 67 Kouparitsas et al (2016), p13. 68 This is the assumption about capital mobility, discussed on pages 34-35 of Kouparitsas et al (2016). The gain to GDP, national income and wages are in most scenarios 0.1 percentage point lower with the alternate assumption, see Table 6 of Kouparitsas et al (2016). 69 For example, Richardson (2016) and Richardson (2015), see citations in endnote 16. 70 To generate a weighted average valuation on credits by all investors of 50%, this means the valuation on Australian investors alone is 0.5/(1-0.207) or 63%. 71 The foreign ownership of Australian shares is 20.7%, according to Kouparitsas et al (2016), p34. 72 While this is not stated explicitly, the modelling likely does include the indirect (second round) effect of the tax cut on Australian investment, through two channels: firstly, the lower pre-tax rate of return in the long run (see Error! Reference source not found.) means Australian investors have a lower post-tax rate of return (as Australians are assumed to pay personal tax only and not company tax), and will therefore reduce their local investment; secondly, the larger economy means Australian households and businesses will have more funds to invest. These two effects will offset to some extent. 73 Ben Potter and Patrick Durkin (2016) “Election 2016: Top CEOs rail at Labor's big business tax wedge”, Australian Financial Review, 9 June; Jacob Greber (2016) “Business leaders fire back at tax-cut critics”, Australian Financial Review, 8 June; and Annabel Hepworth, Damon Kitney (2016) “Orica’s Malcolm Broomhead: Don’t take us for fools on tax cuts” The Australian, 11 May. 74 Mark Ludlow & Angela Macdonald-Smith (2016) “Corporate tax cuts will get gas projects across the line”, Australian Financial Review, 6 June. 75 Lenore Taylor (2016) “Fraction of small businesses likely to use Coalition tax cuts to expand — industry body” Guardian Australia, 1 June. 76 The large majority of small business are locally owned, so in the modelling they would not be assumed to increase investment. In 2014–15, 97% of businesses employing 0-4 people were wholly Australian owned. Source: Australian Bureau of Statistics (2016) Characteristics of Australian Business, 2014–15, Cat No 8167, Table 1. 77 Australian Bureau of Statistics (2016) Wage Price Index, Australia, Jun 2016, Cat No 6345. 78 Wiji Arulampalama, Michael Devereux & Giorgia Maffini (2012) “The direct incidence of corporate income tax on wages” European Economic Review 56(6), August, pp1038–1054. 79 R. Alison Felix (2007) “Passing the Burden: Corporate Tax Incidence in Open Economies” Federal Reserve Bank of Kansas City Regional Research Working Paper 07-01. 80 Clemens Fuest, Andreas Peichl & Sebastian Siegloch (2013) “Do Higher Corporate Taxes Reduce Wages? Micro Evidence from Germany” IZA Discussion Paper 7390. 81 Li Liu and Rosanne Altshuler (2013) “Measuring the Burden of the Corporate Income Tax under Imperfect Competition” National Tax Journal, 66(1), March, pp215-238. 82 Andrew Leigh (2010) “Abbott tax hits workers”, Australian Financial Review, 16 May.

Submission to the Senate Inquiry into Enterprise Tax Plan Bill 2016 Page 40
83 William Gentry (2007) “A Review of the Evidence on the Incidence of the Corporate Income Tax”, US Treasury Office of Tax Analysis Paper 101. 84 Australian Bureau of Statistics (2016) Labour Force, Australia, Aug 2016, Cat No 6202. 85 Scott Morrison (2016) National Accounts — June Quarter 2016, Media Release, 7 September. 86 Roger Brake (2016) Tax reform and policy for an economy in transition, Address to the Queensland Tax Forum, 18 August. 87 PwC (2016) Modelling of potential policy reforms, Final Report to Infrastructure Australia. PwC models GDP to increase by $39.0bn in 2040, off a base of $3,485.1bn, a 1.1% increase. 88 Ergete Ferede and Bev Dahlby (2012) “The Impact of Tax Cuts on Economic Growth: Evidence from the Canadian Provinces” National Tax Journal 65(3), pp563–594. 89 Karel Mertens and Morten Ravn (2013) “The Dynamic Effects of Personal and Corporate Income Tax Changes in the United States” American Economic Review 103 (4), June, pp1212–1247. 90 Arnold et al (2011) Tax Policy for Economic Recovery and Growth. See Table 1, column 2. This tax cut is constrained to be budget neural, so implicitly includes the lost GDP from increases in non-income taxes. 91 OECD (2010) Tax and economic growth. 92 More details on the measures of national income is in ABS (2016) Australian System of National Accounts: Concepts, Sources and Methods, Cat No 5216. 93 Author’s calculations based on Australian Bureau of Statistics (2016) Australian National Accounts: National Income, Expenditure and Product, June 2016, Cat No 5206, Table 1. The pre-GFC annual average is for June 1991 to December 2008. 94 The Treasury modelling refers to Gross National Income. 95 Janine Dixon & Jason Nassios (2016) Modelling the Impacts of a Cut to Company Tax in Australia, Centre of Policy Studies Working Paper G-260. 96 As above, page 8. 97 Ben Potter (2016) Election 2016: Cost of company tax cut no reason not to go ahead, says McKibbin, Australian Financial Review, 12 May. 98 Chris Murphy (2016) Budget Forum 2016: The Economic Impact of the Company Tax Cut, Austaxpolicy: Tax and Transfer Policy Blog, 9 May 2016. 99 Peter Nash and Brendan Rynne (2016) “Basic economics tell us company taxes are too high and uncompetitive” Australian Financial Review, 15 April 2016. 100 Peter Harris (2013) Observations on Productivity, National Income and the Demographic Outlook, speech to Australian Institute of Company Directors, Perth, 19 November; and Patrick D’Arcy and Linus Gustafsson (2012) Australia’s Productivity Performance and Real Incomes, RBA Bulletin, June. 101 Productivity Commission (2015) PC Productivity Update, July, p1. 102 Martin Parkinson (2014) Enhancing our living standards through tax reform, Speech to the Business Council of Australia/Price Waterhouse Coopers Tax Reform Forum, 11 September. 103 Rob Heferen (2015) Tax reform and the economic backdrop, Address to the Minerals Council of Australia Biennial Tax Conference, 26 March. 104 Arnold et al (2011) Tax Policy for Economic Recovery and Growth, at page F66. This paper analyses total factor productivity, which is the productivity of all inputs, not just labour inputs. 105 Vartia (2008) How do taxes affect investment and productivity? This paper also analyses total factor productivity. 106 Liangyue Cao, Amanda Hosking, Michael Kouparitsas, Damian Mullaly, Xavier Rimmer, Qun Shi, Wallace Stark, and Sebastian Wende (2015) Understanding the Economy-Wide Efficiency and Incidence of Major Australian Taxes, Treasury Working Paper 2015-01, April. 107 KPMG Econtech (2010) CGE analysis of the current Australian tax system, Report for the Australia’s Future Tax System review, 26 March. 108 Independent Economics (2016) Company tax scenario. 109 Technically known as the Marginal Excess Burden of the tax. This concept is explained in more detail in Cao et al, pp11-13. 110 Figure 12 in BCA (2016) Realising Our Full Potential: Tax Directions for a Transitioning Economy, which is sourced from Heferen (2015) Looking forward 100 years: Where to for income tax?, Address to the Tax and Transfer Policy Institute. Figure for 2013–14 is from ATO (2016) Corporate tax transparency: report of entity tax information for 2013–14. 111 Source: HM Revenue & Customs Statistics, for 2011 and 2016, available from: https://www.gov.uk/government/collections/analyses-of-corporation-tax-receipts-and-liabilities

Submission to the Senate Inquiry into Enterprise Tax Plan Bill 2016 Page 41
Note that, all else being equal, we would expect the proportion of the tax bill above a fixed pound (or dollar) threshold to go up over time, not down, because of inflation and growth in GDP. 112 Source: OECD Revenue Statistics. 113 US Internal Revenue Service SOI Tax Stats — Corporation Data by Size, available from: https://www.irs.gov/uac/soi-tax-stats-corporation-data-by-size Historical US corporate tax rate: http://www.taxpolicycenter.org/statistics/corporate-top-tax-rate-and-bracket 114 The growth in the tax share is 246% (sourced from IRS data, as above), while GDP grew by 127% over this same period (sourced from OECD.Stat). 115 Jeffrey Zients, Seth Hanlon (2016) “The Corporate Inversions Tax Loophole: What You Need to Know”, Whitehouse blog, 8 April. 116 ATO Corporate tax transparency report for the 2013–14 income year. 117 Saul Eslake (2016) Election FactCheck: will Australia’s big banks reap $7.4 billion over ten years from company tax cuts? The Conversation, 30 May. 118 Kouparitsas et al (2016), p1. As noted in section 3.2.4, the Treasury modelling assumes that imputation means company tax has no direct effect on Australian investors — this means their modelling effectively assumes that the short run effect of the company tax is on foreign investors only. The long run impact in the modelling is very different as explained in Box 3. 119 Craig Emerson (2010) Trade liberalisation the pathway to growth, jobs and prosperity, Speech delivered at the launch of the Australian Services Roundtable report on services in the Australian economy, 4 October; Gary Banks (2003) Gaining from trade liberalisation: some reflections on Australia’s experience, presentation to the IIBE&L/CEDA Conference, New Horizons in Trade: The WTO Round and Australia’s Free Trade Negotiations, Adelaide Convention Centre, 5 June. 120 Independent Economics (2016) Company tax scenario. This is similar to the PBO’s estimate of the budget cost, deflated to 2016–17 figures, in Parliamentary Budget Office (2016) 2016 post-election report, page 211. 121 Kouparitsas et al (2016). Independent Economics (2016) has the dynamic gain to the budget at about 55% of the gross cost, see page 3. 122 HM Revenue & Customs, HM Treasury (2013) Analysis of the dynamic effects of corporation tax reductions, 5 December. 123 N. Gregory Mankiw, Matthew Weinzierl (2004) “Dynamic Scoring: A Back-of-the-Envelope Guide” NBER Working Paper No 11000. 124 Scott Morrison & Kelly O’Dwyer (2016) “Even fairer, more flexible and sustainable superannuation — Joint media release”, 15 September. 125 Kouparitsas et al (2016), p26. This is the net cost after the dynamic revenue benefits to all levels of government. The federal government could capture all of this benefit by adjusting payments to the States if it so wishes. A better approach is to acknowledge that the dynamic benefit to the federal government will be larger than modelled because Australian-financed investment will increase (see Section 3.2.4), and make necessary improvements to the models. The revised dynamic benefit to the federal government will reduce or eliminate the need to adjust payments to States. 126 See 2016–17 Budget, superannuation measures in Paper 2, pages 4 and 5. 127 Morrison & O’Dwyer (2016) Even fairer, more flexible and sustainable superannuation. 128 The long run benefit of the measures announced on 15 September is calculated as the annualised figure that would generate the total benefit over the period 2020–21 to 2026–27 ($490m), assuming the annual figure grows in line with nominal GDP. This is then converted to 2015–16 dollars. 129 Senator the Hon Mathias Cormann on ABC Radio National Drive, 4 May 2016, available from: http://www.financeminister.gov.au/transcript/2016/05/04/abc-radio-national-drive 130 Kouparitsas et al (2016), p5. 131 Djankov et al (2010) The Effect of Corporate Taxes on Investment and Entrepreneurship; and Mihir Desai, Fritz Foley & James Hines (2004) “A Multinational Perspective on Capital Structure Choice and Internal Capital Markets” The Journal of Finance, 59: 2451–2487. 132 More details on bracket creep and fiscal drag are in Carling & Potter (2015) Exposing the Stealth Tax: the Bracket Creep rip-off. 133 David Uren (2016) “Company tax cuts ‘make bracket creep inevitable’”, The Australian, 20 September. 134 Source: 2010–11 Budget, Paper 2, page 42. The figure is for 2019–20 ($3.6bn), converted to 2015–16 dollars based on assumptions in 2010–11 budget and 2010 IGR. The 2010–11 figure was for an SG increase from 9% to 12%, so a further adjustment has been made to reflect an increase in SG from the current 9.5% to 12%. 135 Michael Potter (2016) “Don't increase the super guarantee”, Policy 32(3). 136 Potter (2016) The case against tax increases in Australia: the growing burden.

Submission to the Senate Inquiry into Enterprise Tax Plan Bill 2016 Page 42
137 Uren (2016) Company tax cuts ‘make bracket creep inevitable’. 138 Jessica Irvine (2016) “Education spending beats company tax cuts, say economists” Sydney Morning Herald, 22 June. 139 School funding as implemented under both the current government and the previous government, and as proposed by the ALP in the recent election, did not replicate the Gonski proposals. 140 Wayne Swan in an interview on ABC “there is no case for a company tax rate [cut] when so many companies aren’t paying the nominal rate or anywhere near the nominal rate.” Radio National Breakfast, 5 April 2016, available from: http://www.abc.net.au/radionational/programs/breakfast/wayne-swan-talks-tax-evasion/7299242 141 ATO Corporate Tax Transparency Report. 142 Oliver Lang, Karl-Heinz Nöhrbaß, and Konrad Stahl (1997) “On Income Tax Avoidance: The Case of Germany” Journal of Public Economics 66(2), pp327–47; and Martin Feldstein (1999) “Tax Avoidance and the Deadweight Loss of the Income Tax” Review of Economics and Statistics 81(4), pp674–80. See also the discussion and citations in Chris Murphy (2016) The effects on consumer welfare of a corporate tax cut, ANU Working papers in Trade and Development 2016/10. 143 Australian Taxation Office (2015) Submission to Senate Inquiry into Corporate Tax Avoidance 144 ATO Corporate tax transparency report for 2013–14. 145 ATO Corporate tax transparency report for 2013–14, contextual background. 146 As above. 147 For example, both major parties support the R&D tax concession, with some trimming. The ALP’s support is indicated in websites including: http://www.alp.org.au/startupyear and the Coalition’s is indicated in government websites including: https://www.business.gov.au/assistance/research-and-development-tax-incentive. Both parties supported a reduction in the incentive by 1.5% in the 2016 election campaign, see: http://www.100positivepolicies.org.au/labors_budget_repair_strategy 148 Australian Government (2015) Re:think, page 81 and KPMG (2016) Tax 2025, August 149 Kimberly Clausing, Edward Kleinbard & Thornton Matheson (2016) US Corporate Income Tax Reform and its Spillovers. International Monetary Fund Working Paper No. 16/127. 150 See endnote 142. 151 Peter Martin, Mark Kenny (2016) “Federal election 2016: Company tax cut claims built on uncertain foundations, modeller says”, Sydney Morning Herald, 30 June. 152 Kouparitsas et al (2016), p35 & Table 7. 153 Chris Murphy (2016) Budget Forum 2016: The Economic Impact of the Company Tax Cut; Independent Economics (2016) Company tax cut and profit shifting: reply to Peter Martin and Mark Kenny, 1 July. 154 Lenore Taylor (2016) "Goldman Sachs analysis of company tax cut finds benefits would go offshore” Guardian Australia, 1 June. 155 As above. 156 Kouparitsas et al (2016), p1. 157 Richardson (2016) Company Tax cuts: an Australian Gift to US Internal Revenue Service. 158 See page 44 of OECD (2007) Fundamental Reform of Corporate Income Tax, OECD Tax Policy Studies. 159 Department of Finance Canada (2008) Research Report, Considerations in Setting Canada's Corporate Income Tax Rate, Part 2 of Tax Expenditures and Evaluations 2008. 160 Ken Henry, Jeff Harmer, John Piggott, Heather Ridout & Greg Smith (2010) Australia's Future Tax System: Final Report, Part 2, Chapter B1. 161 Treasury (2008) Architecture of Australia’s tax and transfer system, Table 8.1. 162 George Zodrow (2010) “Capital mobility and capital tax competition” National Tax Journal 63, 865–902. 163 Browning (2016) Trump's offshore tax-cut pitch falls flat in Silicon Valley. 164 Zodrow (2010) Capital mobility and capital tax competition. 165 As above. 166 As above, page 5. 167 While it isn’t completely clear, the report appears to calculate the $1bn figure as the total value of Australian taxes paid, times 80%, uplifted to 2026–27 values, and adjusted to reflect the 5% tax cut. 168 George Zodrow (2006) “Capital mobility and source-based taxation of capital income in small open economies” International Tax and Public Finance, 13, at page 272. 169 2016–17 Budget, Statement 2, page 41. 170 Kouparitsas et al (2016), p6; see also Independent Economics (2016) Company Tax Scenario, page v. 171 Kouparitsas et al (2016), p5.

Submission to the Senate Inquiry into Enterprise Tax Plan Bill 2016 Page 43
172 Peter Sørensen & Shane Matthew Johnson (2010) Taxing Capital Income: Options for Reform in Australia, paper presented to Melbourne Institute — Australia’s Future Tax and Transfer Policy Conference. See in particular section 9.7.1 173 Australian Government (2015) Re:think, Page 81. 174 Henry et al (2010) Australia's Future Tax System: Final Report, Part 2, page 156. 175 2016–17 Budget, Statement 2, page 41. The small business rate of 27.5% has not yet been legislated. 176 Australian Bureau of Statistics (2016) Australian Industry, 2014–15, Cat No 8155, Table 5. 177 Source: Australian Bureau of Statistics (2015) Selected Characteristics of Australian Business, 2014–15, various tables. Large business is defined as businesses employing 200 or more people. 178 Treasury (2015) Regulation Impact Statement, Small incorporated business tax cut 2010–11 to 2019–20. 179 Source: Payroll Tax Australia, Payroll Tax Rates and Thresholds, available from: http://www.payrolltax.gov.au/harmonisation/payroll-tax-rates-and-thresholds 180 Henry et al (2010) Australia's Future Tax System: Final Report, page 167. 181 Australian Government (2015) Re:think, page 119. 182 As above. 183 Chris Murphy quotes a senior government official stating “cutting company tax is really cheap” in Chris Murphy (2016) “Company tax cut: high economic benefit for low budgetary cost” Australian Financial Review, 23 June. 184 Federal government revenue is estimated at $388bn in 2015–16 (from Budget papers) while the national wage bill is estimated to be about $800bn in 15–16 (author’s estimate from ABS national accounts). 185 Daley & Coates (2016) The full story on company tax cuts and your hip pocket. 186 National income in 2015–16 is about $1.2 trillion (author’s estimate from ABS national accounts) while federal government revenue is expected to be $388bn, or a bit under one third. 187 0.7% of estimate of net national income for 2015–16 based on 2016–17 Budget. 188 Potter (2016) The case against tax increases in Australia. 189 Independent Economics (2016) Company Tax Scenario, page 27. 190 Australian Government (2015) Re:think, page 83. 191 Available from: http://data.gov.au/dataset/25e81c18-2083-4abe-81b6-0f530053c63f/resource/6217e594-1c2e-4b3e-be66-1c7c502fa28c/download/taxstats2014company1selecteditemsforincomeyears197980to201314.xlsx 192 As above. 193 Parliamentary Budget Office (2014) Trends in Australian Government receipts 1982–83 to 2012–13, Report no 01/2014.