fisk university. david l. lewis, professor/two-time pulitzer prize winning author john lewis, u.s....
TRANSCRIPT

Fisk University
2011–2012 FACT BOOK
OFFICE OF INSTITUTIONAL EFFECTIVENESS

2
Executive Summary
The 2011-2012 Fisk University Fact Book is designed to present and provide basic descriptiveand statistical information about Fisk University collectively and the institutional divisions andmajors individually. The tables in this document illustrate commonly requested data about FiskUniversity. This edition includes data from academic years 2005-2006 through 2011-2012.
Highlights:
There were 1,105 applications, 1, 001 admitted, and 109 enrolled new first time freshmenin fall 2011. Over the last seven years, the institution has averaged 1,255 applications,693 admitted students, and 157 new first time freshmen.
Fall 2011 headcount was 533 with a FTE of 518. Over the last seven years Fisk hasaveraged a student headcount of 735 with a FTE of 721.
During the 2011–2012 academic year, loans account for 46% of the total financial aidsupport Fisk students received. The next highest category was institutional aid, whichaccounted for 32%, and thirdly federal grants accounted for 14% of the total financial aidsupport received by Fisk students.
From fall 2010 to fall 2011, Fisk retained 75% of its enrolled students. Fisk’s average fallto fall retention rate over the last six years is 76%. Fisk has averaged a 90% fall to springretention rate over the past seven years. From fall 2010 to fall 2011, first time freshmen atFisk had fall to spring and fall to fall retention rates of 93% and 76%, respectively. Overthe past six years, Fisk first time freshmen have averaged 91% and 74% for fall to springand fall to fall retention rates, respectively.
The most recent four year and six year graduation rates for the university are 29% and59%, respectively. Over the past seven years, the average four year and six yeargraduation rates have been 39% and 53%, respectively
This Fact Book has been published for internal use among colleagues at Fisk University. Itscontents should be used with discretion. Questions regarding the data, requests for originalreports and/or requests for more detailed data or data analysis may be addressed to the Office ofInstitutional Effectiveness.

3
Table of ContentsPage
EXECUTIVE SUMMARY 2
UNIVERSITY OVERVIEWHistory 5–9Mission, Tagline, Vision, and Values 10Accreditation and Membership 11Board of Trustees 12Administration 13
ADMISSION INFORMATIONFirst Time Freshmen Applied, Admitted, and Enrolled 14–17
HIGH SCHOOL DATARank, GPA, and Test Scores 18
FINANCIAL AID INFORMATIONFinancial Aid Amounts and Percentages by Category 19Percent of Total Enrollment Receiving Aid by Category 20
ENROLLMENT TRENDSHeadcount, FTE, and Annual Enrollment 21Enrollment by Gender 22Enrollment by Ethnicity 23Enrollment by Classification 24Enrollment by Residence 25International Student Enrollment 26Enrollment by Major 27
ACADEMIC PERFORMANCESemester GPA by Classification 28Overall GPA by Classification 29Overall GPA by Major 30
RETENTION AND GRADUATION INFORMATIONOverall Retention Rates 31Four and Six Year Graduation Rates 32First Time Freshmen Retention and Graduation Rates 32Graduates by Major 33–34
FACULTY INFORMATIONFaculty by Work Effort 35Faculty by Tenure 36Faculty by Degree 37

4
FINANCIAL INFORMATIONStatement of Revenue and Expenditures 38Gift Summary and Alumni of Record 39
5
History
Founded in 1866, Fisk University is coeducational, private, and one of America’s premierHistorically Black Universities. The first Black college to be granted a chapter of Phi Beta KappaHonor Society, Fisk serves a diverse student body with students from 40 states and 6 foreigncountries. There are residence halls for men and women. The focal point of the 40-acre campusand architectural symbol of the university is Jubilee Hall, the first permanent building for theeducation of Blacks in the South, named for the internationally renowned Fisk Jubilee Singers,who continue their tradition of singing and sharing classic Negro spirituals along with othergenres of music from African, Brazil, African American and other diverse cultures.
From its earliest days, Fisk faculty and alumni have been among America’s intellectual leadersproviding leadership in several fields including medicine, science, art, humanities, religion,literature, sociology and philosophy. A few examples of the many prominent Fisk alumniinclude:
Ruth E. Anderson, Esq., senior counsel Nissan North America, Inc. Dr. Johnetta B. Cole, director of the Smithsonian’s National Museum of African Art/
former President of Bennett and Spelman Colleges Milele Coggs, Esq., Alderwoman Milwaukee, WI Sixth District The Honorable Paulette J. Delk, Judge U. S. Bankruptcy Court, TN Western District Rel Dowdell, filmmaker Dr. W. E. B. Du Bois, the first black Ph.D. from Harvard, great social critic and
cofounder of the NAACP Dr. John Hope Franklin, historian/scholar Alonzo L. Fulgham, founder and principal of TJM International Consultants, LLC Nikki Giovanni, poet/writer; John F. Harris, Esq., assistant general counsel Ford Motor Company Mandisa Hundley, recording artist/ ‘American Idol’ finalist Judith Jamison, artistic director of the Alvin Ailey Dance Company Dr. Carol R. Johnson, superintendent Boston public schools The Honorable Hazel R. O’Leary, Esq., Fisk’s 14th President and former U.S. Secretary
of Energy Dr. David L. Lewis, professor/two-time Pulitzer Prize winning author John Lewis, U.S. Representative (GA)/civil rights movement leader Margo M. McKay, Esq., U.S. Department of Agriculture Assistant Secretary for Civil
Rights Dr. Alton B. Pollard, III, Dean of the Howard University School of Divinity Dr. Charlene D. Portee, President American Academy of Physical Therapy Dr. Bradley Sheares, Director and Chairman of Compensation and Organization
Committee, Covance Inc.

6
MAJOR HISTORICAL EVENTS
Year Event1865 John Ogden, the Reverend Erastus Milo Cravath, and the Reverend Edward P. Smith
established the Fisk School in Nashville.
1866 On January 9, Fisk convened its first classes.
1867 On August 12, Fisk School was incorporated as Fisk University.
1871 On October 6, the original Jubilee Singers departed Fisk to raise money.
1873 January 1, groundbreaking ceremony held for Jubilee Hall.
1875 Fisk graduated its first class consisting of eight students that included two womenand two whites.
1876 Jubilee Hall was formally dedicated.
1878 Fisk’s first Missionaries, Albert P. Miller and Andrew E. Jackson, graduated. Uponleaving the Mendi Mission, Miller in a short address left Fisk its motto: “Her Sons andDaughters Are Ever On The Alter.”
1880 The Mozart Society, the first Musical Organization in Tennessee, was formed. In lateryears, the Society becomes the Fisk University Choir.
1882 Livingstone Hall was erected through a $60,000 gift by Mrs. Valerie Stone.
1883 The Fisk Herald began.
1884 The Fisk Alumni Association was founded.
1885 The Music Department was created.
1888 W. E. B. Du Bois graduated.
1889 The Gymnasium and workshop (currently Van Vechten Art Gallery) was created.
1891 Bennett Hall, named from the Reverend H.S. Bennett, was erected at the cost of $25,000.
1892 Fisk Memorial Chapel was built with a legacy of $25,000 from the estate of Clinton B.Fisk.

7
MAJOR HISTORICAL EVENTS
Year Event1893 First Football Team was organized.
1906 Chase Hall (Science Building) was erected on the site where the statue of W. E. B. DuBois now stands.
1908 The Carnegie Library (now the Academic Building) was erected.
1925 Fisk students strike against the administration policies of President McKenzie onFebruary 4.
1927 The Fisk News was established as an alumni publication; Fisk celebrated its firstHomecoming.
1930 Fisk became the first Historically Black College to gain accreditation by the SouthernAssociation of Colleges and Schools.
1931 James Weldon Johnson was appointed to the Adam K. Spence Chair in Creative Writing.
1948 The Fisk Forum, the student newspaper, was established.
1949 Georgia O’Keefe presented Fisk with the Alfred Stieglitz collection of Modern Art.
1953 Fisk became the first black college to establish a chapter of the Phi Beta Kappa HonorSociety.
1956 Charles S. Johnson dies, October 28.
1966 Fisk held her Centennial Celebration.
1969 The Modern Black Mass Choir was organized.
1972 Fisk attained an enrollment of 1559, the largest in the college’s history.
1978 Fisk’s entire campus was officially designated an historical district by the U.S.Department of Interior.
1980 The name, Jubilee Singers, became a registered trademark.
1981 The Jubilee Singers Memorial Bridge opened.
1988 Cecilia N. Adkins, ’43, became the first woman elected chair of the Fisk UniversityBoard of Trustees.

8
MAJOR HISTORICAL EVENTS
Year Event1990 Fisk begins restoration of historic buildings after receiving an initial United States
Congressional Grant.
1991 Fisk breaks ground for the Honors Building, the first new building in twenty years.
1996 The Historic Fisk Race Relations Institute is reestablished with a grant from the W.K.Kellogg Foundation.
1998 President Rutherford H. Adkins dies February, after serving only eight months.
2001 Dr. Carolynn Reid Wallace became the 13th President of Fisk University and the firstfemale to serve as President.
2003 Erastus Milo Cravath Hall was renovated.
2004 Charles Fuget became interim President of Fisk.
2009 Dr. John Hope Franklin, renowned historian and Board of Trustees Chair Emeritus, diesMarch 25.
2009 Fisk University accreditation reaffirmed by Southern Association of Colleges andSchools, December 7, 2009
2011 Fisk Receives third Research and Development 100 Award.
2012 The John W. Work house was renovated.

9
Presidents of Fisk University
Erastus M. Cravath1875–1900
James G. Merrill1901–1908
George A. Gates1909–1912
Fayette A. McKenzie1915–1925
Thomas E. Jones1926–1945
Charles S. Johnson1946–1956
Stephen J. Wright1957–1966
James R. Lawson1967–1975
Walter J. Leonard1977–1984
Henry Ponder1984–1996
Rutherford H. Adkins1997–1998
John L. Smith, Jr.1999–2001
Carolynn Reid-Wallace2001–2003
Hazel R. O’Leary2004–Present
10
MISSIONFisk University produces graduates from diverse backgrounds with the integrity and intellectrequired for substantive contributions to society. Our curriculum is grounded in the liberal arts,and our faculty and administrators emphasize the discovery and advancement of knowledgethrough research in the natural and social sciences, business and the humanities. We arecommitted to the success of scholars and leaders with global perspective.
TAGLINE“Cultivating Scholars and Leaders One by One”
VISIONBe the best small liberal arts institution in the United States
VALUES(Our Success is in the D.E.T.A.I.L.S.)
The D.E.T.A.I.L.S. represent Fisk's core values. Our values reflect our overall ethical and moralengagement. We, the FISK Family, seek to internalize these principles and apply them in our day-to-daywork and overall lives.
Diversity We believe that our individual differences are a collective strength. We support and encouragediversity of opinion, of culture. Diversity aids us in building a collective wisdom that results in morepowerful and relevant solutions to our challenges.
Excellence We believe that excellence is the result of a lifelong pursuit of the highest standards. At FISK,our collective quest is to earn merit through commitment to rigorous scholarship, cultural literacy andhigh ethical standards.
Teamwork We believe that individuals achieve high standards when supported by the collective work ofothers. We reinforce this value by constantly creating opportunities to collaborate both inside and outsideof traditional alliances on campus, in the surrounding community and around the world.
Accountability We believe that we must hold ourselves to the highest standard when we makecommitments. Consistent and measurable follow-through is essential for individual and team progress.Forthright about our successes and shortcomings, we position FISK for continuous achievement andimprovement.
Integrity We believe that it is our responsibility to prepare young people to be stewards of an ever-changing global community that means that we must model behavior grounded in truthfulness andcompassion.
Leadership We believe that leaders are obligated to empower those around them. We are consistent,transparent and accountable. Through our words and behaviors, we encourage other to exhibit these sameattributes.
Service We believe that service is our ability to give the gift of knowledge to humanity. As we serve, webecome transformed and so are our communities.
11
Regional AccreditationFisk University is accredited by the Commission on Colleges of the Southern Association ofColleges and Schools to award the Bachelor of Arts (B.A.), Bachelor of Science (B.S.), Bachelorof Music (B.M.), Bachelor of Science in Nursing (B.S.N.) and Master of Arts (M.A.) degrees.Contact the Commission on Colleges at 1866 Southern Lane, Decatur, Georgia 30033-4097 orcall 404-679-4500 for questions about the accreditation of Fisk University.
Program Accreditation & MembershipAmerican Association of Colleges for Teacher EducationAmerican Chemical SocietyCouncil of Graduate SchoolsNational Association of Schools of MusicTennessee State Board of Examiners for Teacher Education Accreditation
12
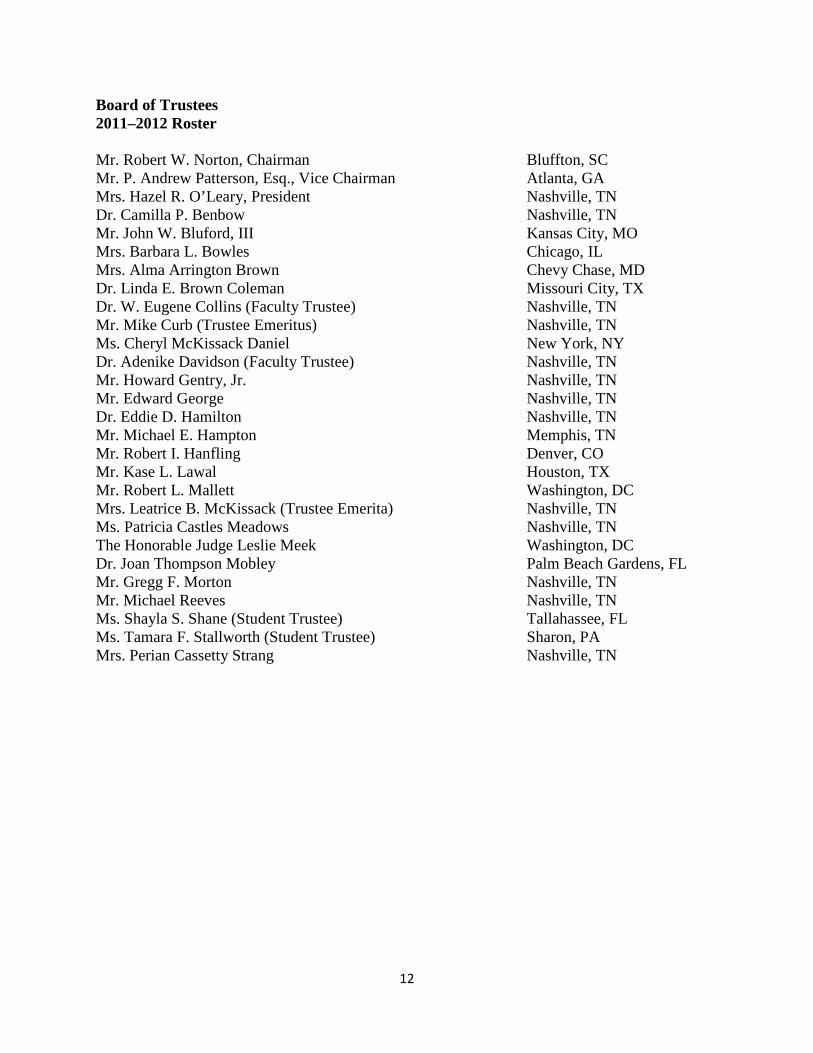
Board of Trustees2011–2012 Roster
Mr. Robert W. Norton, Chairman Bluffton, SCMr. P. Andrew Patterson, Esq., Vice Chairman Atlanta, GAMrs. Hazel R. O’Leary, President Nashville, TNDr. Camilla P. Benbow Nashville, TNMr. John W. Bluford, III Kansas City, MOMrs. Barbara L. Bowles Chicago, ILMrs. Alma Arrington Brown Chevy Chase, MDDr. Linda E. Brown Coleman Missouri City, TXDr. W. Eugene Collins (Faculty Trustee) Nashville, TNMr. Mike Curb (Trustee Emeritus) Nashville, TNMs. Cheryl McKissack Daniel New York, NYDr. Adenike Davidson (Faculty Trustee) Nashville, TNMr. Howard Gentry, Jr. Nashville, TNMr. Edward George Nashville, TNDr. Eddie D. Hamilton Nashville, TNMr. Michael E. Hampton Memphis, TNMr. Robert I. Hanfling Denver, COMr. Kase L. Lawal Houston, TXMr. Robert L. Mallett Washington, DCMrs. Leatrice B. McKissack (Trustee Emerita) Nashville, TNMs. Patricia Castles Meadows Nashville, TNThe Honorable Judge Leslie Meek Washington, DCDr. Joan Thompson Mobley Palm Beach Gardens, FLMr. Gregg F. Morton Nashville, TNMr. Michael Reeves Nashville, TNMs. Shayla S. Shane (Student Trustee) Tallahassee, FLMs. Tamara F. Stallworth (Student Trustee) Sharon, PAMrs. Perian Cassetty Strang Nashville, TN

13
Administration
The Honorable Hazel R. O’Leary, PresidentDr. Princilla Morris, Executive Vice President and ProvostMr. Gary Moore, Vice President for Finance and Chief Financial OfficerMr. Jason Meriwether, Vice President for Student Engagement and Enrollment ManagementDr. Edwina Hamby, Vice President for Institutional AdvancementDr. Michael Self, Vice President for Institutional Effectiveness and Chief Information OfficerDr. Arnold Burger, Vice Provost for Academic InitiativesMr. Anthony Jones, Director of Recruitment and AdmissionMrs. Mary Chambliss, Director of Financial AidMs. Stephanie Cage, University RegistrarDr. Jacenda Davidson, Director of Human ResourcesMs. Lametrius Daniels, Dean of Students

14
Admissions Information
Fall Applications from New First Time Freshmen By StateState Fall 2005 Fall 2006 Fall 2007 Fall 2008 Fall 2009 Fall 2010 Fall 2011 7 Yr Average
Alabama 29 15 32 27 12 15 24 22.00
Alaska 1 0.14
Arizona 2 2 2 4 1 1 1.71
Arkansas 27 21 12 16 9 12 10 15.29
California 189 160 122 72 72 114 253 140.29
Colorado 5 6 9 5 2 2 10 5.57
Connecticut 7 5 12 10 6 7 2 7.00
Delaware 3 5 1 2 3 2 2.29
District of Columbia 19 25 16 21 9 4 7 14.43
Florida 26 43 13 8 14 19 13 19.43
Georgia 90 126 74 75 56 82 68 81.57
Idaho 2 1 1 0.57
Illinois 251 212 184 156 131 142 202 182.57
Indiana 36 35 39 24 18 58 39 35.57
Iowa 1 1 1 0.43
Kansas 3 8 4 5 1 2 5 4.00
Kentucky 19 19 14 8 4 11 7 11.71
Louisiana 12 6 10 8 1 2 4 6.14
Maryland 46 65 40 25 21 10 12 31.29
Massachusetts 8 13 18 6 10 3 6 9.14
Michigan 57 30 54 65 24 50 32 44.57
Minnesota 4 6 7 4 8 3 2 4.86
Mississippi 44 26 20 20 16 8 8 20.29
Missouri 57 63 52 32 20 44 53 45.86
Nebraska 2 5 1 1.14
Nevada 1 2 1 2 4 1.43
New Hampshire 1 1 0.29
New Jersey 20 36 16 6 8 3 9 14.00
New Mexico 2 1 2 0.71
New York 79 82 81 63 41 39 23 58.29
North Carolina 17 25 6 8 4 4 5 9.86
Ohio 55 84 92 71 51 33 34 60.00
Oklahoma 1 3 6 2 5 2 1 2.86
Oregon 7 2 8 8 3 5 1 4.86
Pennsylvania 60 28 20 28 8 4 27 25.00
Rhode Island 4 3 2 2 1.57
South Carolina 13 10 6 3 8 3 2 6.43
Tennessee 299 259 257 149 168 250 148 218.57
Texas 56 48 60 44 22 40 25 42.14
Utah 1 0.14
Vermont 1 1 0.29
Virginia 20 24 23 13 22 14 26 20.29
Virgin Islands 18 11 2 4.43
Washington 24 31 13 6 8 6 14 14.57
West Virginia 2 2 0.57
Wisconsin 12 33 29 14 12 8 8 16.57
Unidentified 56 119 46 49 13 7 22 44.57
Totals 1684 1701 1407 1062 814 1014 1105 1255.29

15
Fall Admitted New First Time Freshmen By StateState Fall 2005 Fall 2006 Fall 2007 Fall 2008 Fall 2009 Fall 2010 Fall 2011 7 Yr Average
Alabama 6 10 22 8 7 13 23 12.71
Arizona 1 1 1 0.43
Arkansas 14 15 8 4 6 8 10 9.29
California 63 42 54 28 31 95 229 77.43
Colorado 1 3 3 3 1 2 9 3.14
Connecticut 1 3 6 3 5 4 1 3.29
Delaware 1 1 2 1 1 0.86
District of Columbia 5 7 2 5 4 3 7 4.71
Florida 18 14 8 3 12 15 13 11.86
Georgia 55 61 40 38 42 79 65 54.29
Idaho 1 1 1 0.43
Illinois 97 75 81 50 64 116 183 95.14
Indiana 17 13 21 10 9 57 35 23.14
Kansas 1 4 2 5 1.71
Kentucky 10 8 6 4 2 11 6 6.71
Louisiana 7 2 8 2 2 4 3.57
Maryland 13 17 19 10 12 6 9 12.29
Massachusetts 1 4 10 2 4 3 4 4.00
Michigan 24 14 22 25 9 47 27 24.00
Minnesota 2 3 5 4 2 2 2.57
Mississippi 16 12 14 7 7 8 7 10.14
Missouri 20 22 25 17 16 42 51 27.57
Nebraska 2 2 0.57
Nevada 1 1 1 2 0.71
New Hampshire 1 1 0.29
New Jersey 5 9 8 4 6 2 7 5.86
New Mexico 2 1 1 0.57
New York 13 16 27 21 19 32 17 20.71
North Carolina 7 8 5 3 3 4 5 5.00
Ohio 16 31 48 30 30 31 31 31.00
Oklahoma 1 2 4 1 5 2 1 2.29
Oregon 7 5 3 4 1 2.86
Pennsylvania 16 7 7 12 2 4 24 10.29
Rhode Island 1 1 1 0.43
South Carolina 2 4 2 1 6 2 1 2.57
Tennessee 154 147 182 71 99 234 136 146.14
Texas 19 28 31 13 12 40 23 23.71
Utah 1 0.14
Vermont 1 0.14
Virginia 8 9 6 8 14 12 24 11.57
Virgin Islands 2 4 2 1.14
Washington 8 9 5 2 4 5 14 6.71
West Virginia 1 0.14
Wisconsin 6 13 13 8 6 7 8 8.71
Unidentified 26 56 23 18 7 6 18 22.00
Totals 661 675 728 427 453 905 1001 692.86

16
Fall New First Time Freshmen Enrollment By StateState Fall 2005 Fall 2006 Fall 2007 Fall 2008 Fall 2009 Fall 2010 Fall 2011 7 Yr Average
Alabama 2 4 3 2 4 6 3.00
Arkansas 4 7 1 1 1 2.00
California 20 11 7 4 2 8 13 9.29
Colorado 1 0.14
Connecticut 1 1 1 0.43
Delaware 1 0.14
District of Columbia 1 1 2 1 1 0.86
Florida 2 5 2 2 4 1 2.29
Georgia 23 22 2 6 11 10 8 11.71
Idaho 1 0.14
Illinois 34 26 17 15 21 19 20 21.71
Indiana 5 3 2 2 1 2 3 2.57
Kansas 1 0.14
Kentucky 5 2 2 3 1.71
Louisiana 3 2 1 1 1 1.14
Maryland 4 5 3 4 2 2 2 3.14
Massachusetts 1 2 2 1 0.86
Michigan 9 3 2 3 2 7 3 4.14
Minnesota 2 1 0.43
Mississippi 6 4 3 1 3 1 2.57
Missouri 2 8 2 1 6 4 3 3.71
Nebraska 2 0.29
New Jersey 3 1 1 0.71
New York 4 3 7 4 4 2 1 3.57
North Carolina 1 2 1 1 0.71
Ohio 5 6 9 8 5 4 5 6.00
Oklahoma 1 1 1 1 0.57
Oregon 1 1 2 0.57
Pennsylvania 1 1 4 1 1.00
South Carolina 1 0.14
Tennessee 85 66 61 22 30 57 25 49.43
Texas 5 11 13 3 3 10 3 6.86
Virginia 1 2 1 1 1 0.86
Virgin Islands 1 0.14
Washington 1 2 1 1 1 0.86
Wisconsin 2 4 5 2 1 2.00
Unidentified 11 34 12 11 6 2 5 11.57
Totals 239 241 161 100 107 145 109 157.43

17
Application and Admission Yield for First Time Freshmen
Fall2005
Fall2006
Fall2007
Fall2008
Fall2009
Fall2010
Fall2011
7 YRAVG
Total Applications 1684 1701 1407 1062 814 1014 1105 1255.29Total Admits 661 675 728 427 453 905 1001 692.86
Admit Yield of Applicants 39% 40% 52% 40% 56% 89% 91% 58%Total New First Time Freshmen 239 241 161 100 107 145 109 157.43New Enrollment Yield of Admits 36% 36% 22% 23% 24% 16% 11% 24%
For fall 2011, 1001 new first time freshmen were admitted, which represented a 91% admit rateof the 1105 applicants. Over the last seven years, the University has averaged 693 admitted newfirst time freshmen each fall semester, with an average admit rate of 58%. One hundred and ninenew first time freshmen enrolled in fall 2011, which represents 10% of all applicants receivedand 11% of those that were admitted. Over the past seven years, the University has averaged 157new first time freshmen each fall, at an average enrollment rate of 24% of admits.
For the past seven years, Tennessee, Illinois, California, Georgia, and Ohio have been the topproducers of applied, admitted and enrolled new first time freshmen.
California Geogria Illinois Ohio Tennessee
140.29
81.57
182.57
60.00
218.57
77.4354.29
95.14
31.00
146.14
9.29 11.71 21.71 6.00
49.43
States with the Highest Seven YearAdmission RatesApplied Admitted Enrolled

18
High School DataNew First Time Freshmen High School Rank
HS Rank Fall 2005 Fall 2006 Fall 2007 Fall 2008 Fall 2009 Fall 2010 Fall 20117 Yr
Average
Top 10% 16.2% 21.4% 25.3% 15.4% 25.8% 13.2% 10.9% 18.31%Top 25% 36,6% 41.0% 44.0% 36.5% 38.7% 36.8% 27.3% 37.27%Top 50% 71.8% 73.5% 73.6% 73.1% 67.7% 63.2% 61.8% 69.24%Bottom 50% 28.2% 26.5% 26.4% 26.9% 32.3% 36.8% 38.2% 30.76%Bottom 25% 4.2% 6.0% 6.6% 9.6% 3.2% 10.5% 18.2% 8.33%
For fall 2011, 10.9% of the new first time freshmen graduated in the top 10% of their graduatingclass. Over the past seven years, approximately 18% of the new first time freshmen in eachentering class has been ranked in the top 10% of their high school graduating classes. For fall2011, approximately 62% of the enrolled first time freshmen were in the top 50% of theirgraduating class in high school, which is slightly lower than the seven year average of 69%.
New First Time Freshmen Average High School GPA
Fall 2005 Fall 2006 Fall 2007 Fall 2008 Fall 2009 Fall 2010 Fall 2011 7 Yr Average
Average Class GPA 3.05 3.11 3.18 2.88 2.99 3.02 2.92 3.02
The average high school grade point average for new first time freshmen that enrolled during thefall 2011 semester was 2.92. For the last seven years, the average high school grade pointaverage for new first time freshmen is 3.02.
New First Time Freshmen SAT and ACT Averages
Fall2005
Fall2006
Fall2007
Fall2008
Fall2009
Fall2010
Fall2011
7 YRAVG
ACT Composite 20.07 21.09 21.62 19.58 20.07 19.14 21.29 20.41ACT Mathematics 18.76 19.46 19.98 18.5 19.1 17.96 19.91 19.10
ACT English 20.59 21.45 21.91 19.79 20.57 19.24 21.57 20.73SAT Mathematics +
Verbal960.92 997.88 1023.34 960.96 924.7 990 960.79 974.08
SAT Verbal 484.12 505.24 520.66 480.77 475.31 499.77 480.26 492.30SAT Mathematics 476.8 492.64 502.68 480.19 449.39 490.23 480.53 481.78
For fall 2011, the average ACT score of new first-time freshmen was 21, slightly above theseven year average of 20. The total SAT Math plus SAT Verbal score for fall 2011 new first-time freshmen was 961, slightly lower than the seven year average of 974.

19
Financial Aid Information
Financial Aid Amounts by Category
Financial Aid 2007-2008 2008-2009 2009-2010 2010-2011 2011-2012 5 YR AVG
Federal Grants $1,436,257 $1,441,640 $1,720,201 $1,776,225 $1,539,281 $1,582,721Institutional Aid $3,600,400 $3,643,286 $3,663,782 $2,665,775 $3,401,122 $3,394,873Loans $6,566,928 $6,130,771 $5,474,777 $5,644,846 $4,993,716 $5,762,208State Aid $630,632 $365,675 $342,556 $508,806 $423,458 $454,225Other Aid $272,769 $362,728 $511,518 $561,095 $404,267 $422,475Total $12,506,986 $11,944,100 $11,712,834 $11,156,747 $10,761,844 $11,616,502
During the 2011–2012 academic year, students received a total of $10, 761, 844. Over the pastfive years, Fisk students, on average, have received a total of $11, 616, 502 in financial aidsupport annually.
Percent of Total Aid by Category
Type of Aid2007-2008
2008-2009
2009-2010
2010-2011
2011-2012
5 YRAVG
Federal Grants 11% 12% 15% 16% 14% 14%Institutional Aid 29% 31% 31% 24% 32% 29%
Loans 53% 51% 47% 50% 46% 49%State Aid 5% 3% 3% 5% 4% 3%Other Aid 2% 3% 4% 5% 4% 4%
Federal Grants14%
InstitutionalAid32%
Loans46%
State Aid4%
Other Aid4%
2011-2012 Financial Aid by Category

20
Percent of Total Enrollment Receiving Aid by Category
Financial Aid2007-2008
2008-2009
2009-2010
2010-2011
2011-2012
5 YR AVG
Federal Grants 41% 41% 44% 54% 52% 46%Institutional Aid 48% 57% 66% 52% 60% 57%Loans 63% 66% 67% 71% 67% 67%State Aid 13% 10% 11% 16% 14% 13%Other 9% 15% 18% 19% 20% 16%Any Form of Aid 88% 89% 90% 92% 92% 89%
Over the past five years, loans have been the dominant source of financial aid for Fisk students,with an average of 67% of the students taking out loans annually, which matched the 2011 –2012 value. The next highest categories are institutional aid and federal aid, with an average of57% and 46% of the annual enrollment participating in each category, respectively. In 2011–2012, the number of students that received institutional and federal aid was larger than theirrespective five year averages.
0%
20%
40%
60%
80%
2007-2008 2008-2009 2009-2010 2010-2011 2011-2012
Percent of Enrollment Receiving Aidby Category
Federal Grants Institutional Aid Loans
State Aid Other

21
Enrollment Trends
Headcount and FTE
Fall 2005 Fall 2006 Fall 2007 Fall 2008 Fall 2009 Fall 2010 Fall 2011 7 YR AVGEnrollment 909 939 814 720 652 580 533 735.29
FTE 895 923 801 707 638 568 518 721.43Spring2005
Spring2007
Spring2008
Spring2009
Spring2010
Spring2011
Spring2012 7 YR AVG
Enrollment 859 887 764 668 628 533 497 690.86FTE 838 856 741 646 610 515 482 669.71
The fall 2011 headcount was 533, with a FTE of 518. For the last seven years, the University hasaveraged a head count of 735 and a FTE of 721 for each fall semester.
Annual Unduplicated Enrollment
2005-2006
2006-2007
2007-2008
2008-2009
2009-2010
2010-2011
2011-2012 7 YR AVG
AnnualEnrollment 963 992 868 748 688 607 563 775.57
Fall 2005 Fall 2006 Fall 2007 Fall 2008 Fall 2009 Fall 2010 Fall 2011
909 939 814 720 652 580 533895 923 801 707 638 568 518
Fall Headcount and FTEEnrollment FTE
963 992 868 748 688 607 563
2005-2006 2006-2007 2007-2008 2008-2009 2009-2010 2010-2011 2011-2012
Annual Unduplicated Enrollment

22
Fall Enrollment By Gender
Semester Females% ofFemales Males
% ofMales Total
Fall 2005 631 69% 278 31% 909Fall 2006 663 71% 276 29% 939Fall 2007 558 69% 256 31% 814Fall 2008 488 68% 232 32% 720Fall 2009 420 64% 232 36% 652Fall 2010 357 62% 223 38% 580Fall 2011 334 63% 199 37% 5337 YR AVG 493 67% 242 33% 735
The percent of female students in fall 2011 was 63%, slightly lower than the seven year averageof 67%.
Fall 2005 Fall 2006 Fall 2007 Fall 2008 Fall 2009 Fall 2010 Fall 2011
69% 71% 69% 68% 64% 62% 63%31% 29% 31% 32% 36% 38% 37%
Enrollment by Gender% of Females % of Males

23
Fall Enrollment By Ethnicity
Semester AfricanAmerican
AmericanIndian Native
AmericanAsian Bi-
Racial Caucasian Hispanic PacificIslander Unknown Total
Students
Fall 2005 865 1 2 1 7 3 2 28 909Fall 2006 882 1 2 4 5 5 2 38 939Fall 2007 746 1 2 4 4 5 1 51 814Fall 2008 642 3 4 3 1 2 65 720Fall 2009 559 3 11 5 1 2 71 652Fall 2010 483 2 13 9 4 2 67 580Fall 2011 445 2 11 12 4 1 58 533
7 YRAVG 660 1 2 7 6 3 2 54
The percent of African American students in fall 2011 was 83.5%, slightly lower than the sevenyear average of 89.8%.
83.5%
0.4%2.1%
2.3% 0.8%0.2%
10.9%
Fall 2011 Enrollment by EthnicityAfrican American American Indian Native American
Bi-Racial Caucasian
Hispanic Pacific Islander
Unknown

24
Fall Enrollment By Classification
Semester Freshmen Sophomore Junior Senior Undergraduate Graduate TotalFall 2005 330 177 178 169 854 55 909Fall 2006 307 227 150 187 871 68 939Fall 2007 196 251 167 151 765 49 814Fall 2008 147 137 232 168 684 36 720Fall 2009 140 93 131 239 603 49 652Fall 2010 186 101 80 151 518 62 580Fall 2011 184 139 87 70 480 53 5337 YR AVG 213 161 146 162 682 53
In fall 2011, there were 184 freshmen, 139 sophomores, 87 juniors, 70 seniors, and 53 graduatestudents enrolled at the University. Over the last seven years, Fisk has averaged 213 freshmen,161 sophomores, 146 juniors, 162 seniors, and 53 graduate students each fall semester.
854 871765
684603
518480
55 68 49 36 49 62 53
Fall 2005 Fall 2006 Fall 2007 Fall 2008 Fall 2009 Fall 2010 Fall 2011
Enrolmment by LevelUndergraduate Graduate

25
Fall Enrollment By State of Residence
StateFall2005
Fall2006
Fall2007
Fall2008
Fall2009
Fall2010
Fall2011
Total
Alabama 13 13 13 9 11 8 11 78
Arkansas 16 21 15 14 11 4 3 84
California 75 67 45 34 21 22 24 288
Colorado 0 1 2 3 1 1 1 9
Connecticut 3 1 2 1 2 9
Delaware 0 1 1 1 1 1 5
District of Columbia 3 4 4 2 4 3 4 24
Florida 12 12 9 9 11 11 8 72
Georgia 44 56 45 43 43 32 31 294
Hawaii 1 1 1 1 1 5
Illinois 111 105 79 84 75 67 75 596
Indiana 6 8 8 10 9 7 7 55
Kansas 1 1 1 2 5
Kentucky 17 16 13 10 5 5 6 72
Louisiana 6 6 6 5 3 4 4 34
Maryland 16 14 17 16 14 12 10 99
Massachusetts 2 4 4 5 4 3 22
Michigan 18 14 11 12 11 15 15 96
Minnesota 0 3 3 2 3 11
Mississippi 13 15 14 12 12 10 8 84
Missouri 17 19 15 11 16 15 12 105
Nebraska 2 2 1 1 6
Nevada 1 2 1 4
New Hampshire 1 1 1 1 1 5
New Jersey 3 6 6 4 4 1 1 25
New Mexico 0 1 1 1 3
New York 18 16 16 16 17 18 15 116
North Carolina 4 3 4 5 4 1 2 23
Ohio 37 36 30 28 24 20 14 189
Oklahoma 3 4 1 2 2 2 3 17
Oregon 3 2 1 2 3 2 13
Pennsylvania 5 4 3 4 3 1 3 23
South Carolina 1 1 2 3 3 1 1 12
Tennessee 362 330 289 216 206 216 184 1803
Texas 25 33 36 30 27 29 25 205
Virginia 12 10 5 3 3 4 3 40
Washington 2 4 1 2 2 3 3 17
Wisconsin 8 11 10 11 7 3 2 52
Over the past seven years, California, Georgia, Illinois, Ohio, and Tennessee have been the topproducers of student enrollment.

26
International Student Enrollment
Country Fall2005
Fall2006
Fall2007
Fall2008
Fall2009
Fall2010
Fall2011
Bahamas 15 15 13 10 6 5 3Barbados 1Bhutan 1 1Brazil 1 2 1 1Ghana 1 2
Jamaica 1 32 34 34 30 3 6Nigeria 2 5 11 13 15 23 23
St. Vincent and Grenadines 1 1 1 1Tanzania 1
Trinidad and Tobago 1 3 2 2 2 1United Arab Emirates 1 1 1 1
United Kingdom 1 1 1 1West Indies 6 6 7 7 1 1
Jamaica, Nigeria and the Bahamas continue to be the largest nations of citizenship for enrolledinternational students at Fisk over the last seven years.
8% 5%
17%
64%
3% 3%
Fall 2011 International Student EnrollmentBahamas Ghana Jamaica Nigeria United Arab Emirates West Indies

27
Enrollment By Major
Major Fall2005
Fall2006
Fall2007
Fall2008
Fall2009
Fall2010
Fall2011
7 YRAVG
Art 14 9 5 6 13 7 7 8.7Elected Studies 0 0 1 0 0 1 0 1.0
English 39 36 37 37 35 29 26 34.1History 26 19 13 14 15 14 10 15.9Music 14 10 12 16 10 11 10 11.9
Music Education 6 10 8 6 4 3 2 5.6Music Performance 6 10 8 8 6 3 3 6.3
Political Science 50 40 31 24 24 26 28 31.9Psychology 110 127 104 91 74 60 67 90.4Sociology 25 46 36 25 18 9 17 25.1Spanish 8 8 6 9 8 5 4 6.9
Special Education 14 12 9 6 8 7 7 9.0Total Humanities and Social
Sciences 339 351 291 259 229 178 181 261.1
Biology 146 161 156 132 116 110 112 133.3Business 122 119 109 102 96 95 71 102.0
Chemistry 31 23 26 26 24 17 21 24.0Computer Science 24 16 16 15 16 21 17 17.9
Mathematics 6 7 9 7 4 4 3 5.7Nursing 30 49 43 22 23 30 19 30.9Physics 9 10 19 20 21 16 11 15.1
Total Natural Science, Mathematicsand Business Administration 368 385 378 324 300 293 254 328.9
Undeclared 149 136 95 101 74 47 45 92.4
Post Bachelors' TeacherCertification 14 17 4 4 8 12 9 9.7
Graduate Biology 1 5 5 6 5 9 7 5.4Graduate Chemistry 3 2 3 0 2 6 5 3.5
Graduate Physics 19 21 14 13 19 25 24 19.3Graduate Psychology 16 22 24 13 15 10 8 15.4
Total Graduate Division 39 50 46 32 41 50 44 43.1
For the past seven years, biology, business, English, political science and psychology have beenthe top five majors with the highest enrollment.

28
Academic Performance
Average Semester GPA by Classification
Semester Freshmen Sophomore Junior Senior Undergraduate PostBachelors Graduate
Fall 2005 2.43 2.62 3.06 3.16 2.74 3.88 3.44Spring2006 2.17 2.62 2.77 3.11 2.71 3.77 3.33
Fall 2006 2.71 2.64 2.70 3.12 2.78 3.29 3.27Spring2007 2.64 2.83 2.77 3.11 2.86 3.63 3.51
Fall 2007 2.43 2.93 2.89 3.03 2.81 2.50 3.24Spring2008 2.34 2.83 2.92 2.99 2.83 3.00 3.48
Fall 2008 2.31 2.77 3.06 3.00 2.83 2.00 2.82Spring2009 1.82 2.80 2.63 3.10 2.76 2.67 3.37
Fall 2009 2.32 2.66 2.81 3.08 2.78 3.14 2.72Spring2010 2.03 2.67 2.67 3.10 2.80 4.00 3.12
Fall 2010 2.65 2.80 2.75 2.94 2.78 3.43 2.96Spring2011 2.01 2.88 2.63 3.06 2.73 3.74 2.93
Fall 2011 2.42 2.77 2.77 2.80 2.68 1.90 2.85Spring2012 1.93 2.85 2.79 3.09 2.76 2.97 3.04
7 YR AVG 2.30 2.76 2.80 3.05 2.78 3.14 3.15
0.00
0.50
1.00
1.50
2.00
2.50
3.00
3.50
Fall2005
Spring2006
Fall2006
Spring2007
Fall2007
Spring2008
Fall2008
Soring2009
Fall2009
Spring2010
Fall2010
Spring2011
Fall2011
Spring2012
Average Semester GPA by Classification
Freshmen Sophomore Junior Senior

29
Average Overall GPA by Classification
Semester Freshmen Sophomore Junior Senior Undergraduate PostBachelors Graduate
Fall 2005 2.50 2.79 3.03 3.08 2.79 3.85 3.42Spring 2006 2.33 2.74 2.92 3.11 2.81 3.72 3.52
Fall 2006 2.75 2.84 2.88 3.08 2.87 3.73 3.49Spring 2007 2.66 2.95 2.90 3.11 2.93 3.59 3.50
Fall 2007 2.47 3.03 3.01 2.99 2.87 3.83 3.47Spring 2008 2.49 2.89 3.12 3.08 2.95 3.78 3.52
Fall 2008 2.35 2.88 3.09 3.04 2.88 3.89 3.36Spring 2009 1.97 2.87 2.97 3.18 2.91 3.73 3.43
Fall 2009 2.40 2.77 2.96 3.11 2.86 3.32 3.35Spring 2010 2.15 2.76 2.89 3.13 2.89 3.79 3.41
Fall 2010 2.64 2.83 2.92 2.99 2.82 3.59 3.46Spring 2011 2.19 3.02 2.87 3.06 2.85 3.74 3.39
Fall 2011 2.51 2.93 2.87 2.97 2.80 2.95 3.44Spring 2012 2.07 2.91 3.00 3.08 2.86 2.98 3.42
7 YR AVG 2.39 2.87 2.96 3.07 2.86 3.61 3.44
Over the last seven years, the higher the undergraduate classification, the higher the term andoverall gpa.
0.00
0.50
1.00
1.50
2.00
2.50
3.00
3.50
Fall2005
Spring2006
Fall2006
Spring2007
Fall2007
Spring2008
Fall2008
Soring2009
Fall2009
Spring2010
Fall2010
Spring2011
Fall2011
Spring2012
Average Overall GPA by Classification
Freshmen Sophomore Junior Senior
30
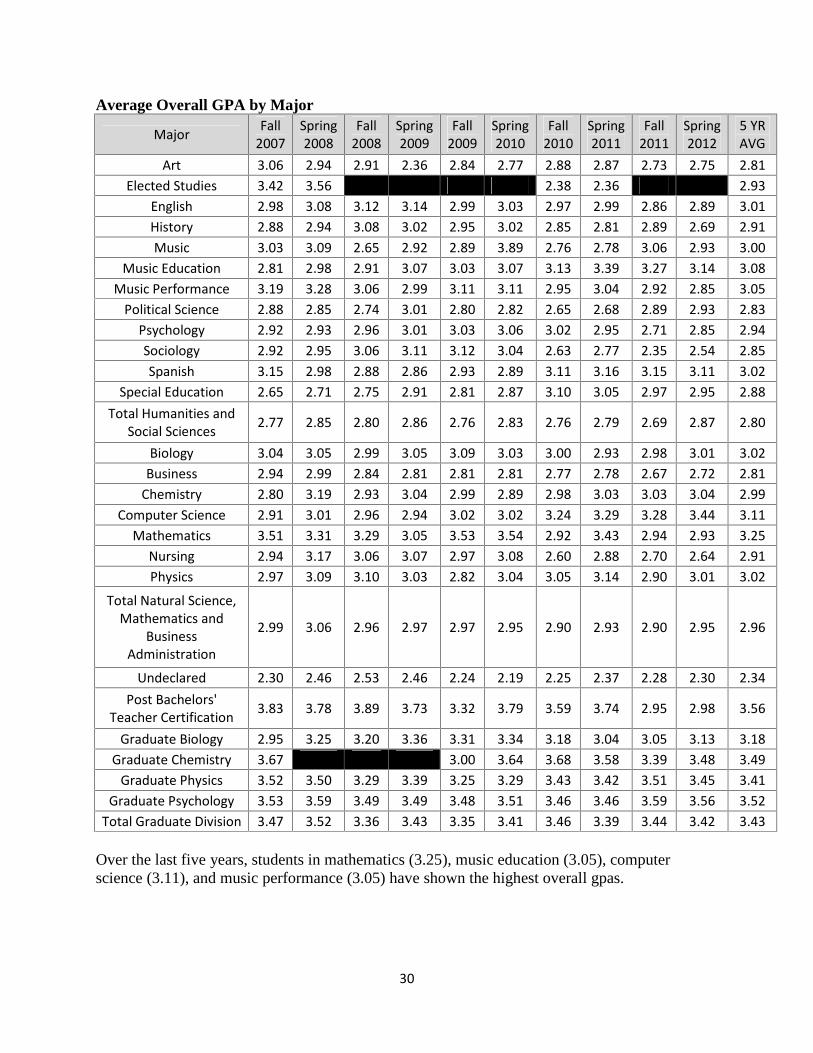
Average Overall GPA by Major
Major Fall2007
Spring2008
Fall2008
Spring2009
Fall2009
Spring2010
Fall2010
Spring2011
Fall2011
Spring2012
5 YRAVG
Art 3.06 2.94 2.91 2.36 2.84 2.77 2.88 2.87 2.73 2.75 2.81Elected Studies 3.42 3.56 2.38 2.36 2.93
English 2.98 3.08 3.12 3.14 2.99 3.03 2.97 2.99 2.86 2.89 3.01History 2.88 2.94 3.08 3.02 2.95 3.02 2.85 2.81 2.89 2.69 2.91Music 3.03 3.09 2.65 2.92 2.89 3.89 2.76 2.78 3.06 2.93 3.00
Music Education 2.81 2.98 2.91 3.07 3.03 3.07 3.13 3.39 3.27 3.14 3.08Music Performance 3.19 3.28 3.06 2.99 3.11 3.11 2.95 3.04 2.92 2.85 3.05
Political Science 2.88 2.85 2.74 3.01 2.80 2.82 2.65 2.68 2.89 2.93 2.83Psychology 2.92 2.93 2.96 3.01 3.03 3.06 3.02 2.95 2.71 2.85 2.94Sociology 2.92 2.95 3.06 3.11 3.12 3.04 2.63 2.77 2.35 2.54 2.85Spanish 3.15 2.98 2.88 2.86 2.93 2.89 3.11 3.16 3.15 3.11 3.02
Special Education 2.65 2.71 2.75 2.91 2.81 2.87 3.10 3.05 2.97 2.95 2.88Total Humanities and
Social Sciences 2.77 2.85 2.80 2.86 2.76 2.83 2.76 2.79 2.69 2.87 2.80
Biology 3.04 3.05 2.99 3.05 3.09 3.03 3.00 2.93 2.98 3.01 3.02Business 2.94 2.99 2.84 2.81 2.81 2.81 2.77 2.78 2.67 2.72 2.81
Chemistry 2.80 3.19 2.93 3.04 2.99 2.89 2.98 3.03 3.03 3.04 2.99Computer Science 2.91 3.01 2.96 2.94 3.02 3.02 3.24 3.29 3.28 3.44 3.11
Mathematics 3.51 3.31 3.29 3.05 3.53 3.54 2.92 3.43 2.94 2.93 3.25Nursing 2.94 3.17 3.06 3.07 2.97 3.08 2.60 2.88 2.70 2.64 2.91Physics 2.97 3.09 3.10 3.03 2.82 3.04 3.05 3.14 2.90 3.01 3.02
Total Natural Science,Mathematics and
BusinessAdministration
2.99 3.06 2.96 2.97 2.97 2.95 2.90 2.93 2.90 2.95 2.96
Undeclared 2.30 2.46 2.53 2.46 2.24 2.19 2.25 2.37 2.28 2.30 2.34Post Bachelors'
Teacher Certification 3.83 3.78 3.89 3.73 3.32 3.79 3.59 3.74 2.95 2.98 3.56
Graduate Biology 2.95 3.25 3.20 3.36 3.31 3.34 3.18 3.04 3.05 3.13 3.18Graduate Chemistry 3.67 3.00 3.64 3.68 3.58 3.39 3.48 3.49
Graduate Physics 3.52 3.50 3.29 3.39 3.25 3.29 3.43 3.42 3.51 3.45 3.41Graduate Psychology 3.53 3.59 3.49 3.49 3.48 3.51 3.46 3.46 3.59 3.56 3.52
Total Graduate Division 3.47 3.52 3.36 3.43 3.35 3.41 3.46 3.39 3.44 3.42 3.43
Over the last five years, students in mathematics (3.25), music education (3.05), computerscience (3.11), and music performance (3.05) have shown the highest overall gpas.
31
Retention and Graduation Information
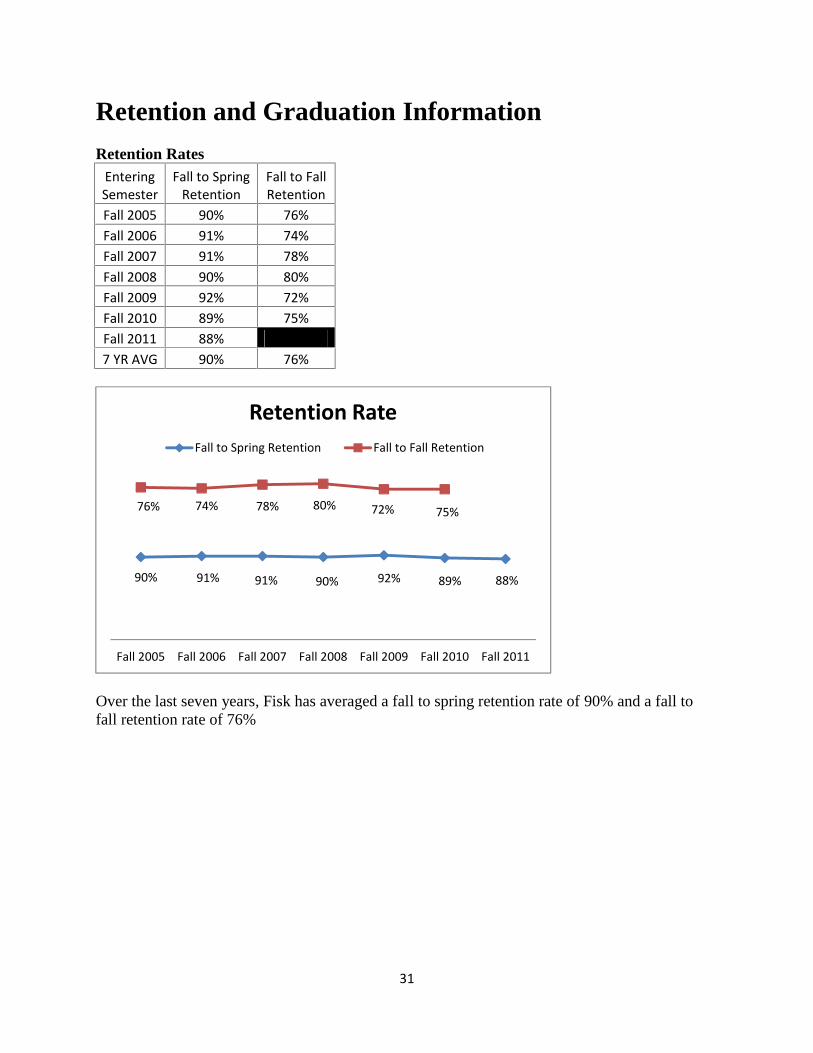
Retention RatesEnteringSemester
Fall to SpringRetention
Fall to FallRetention
Fall 2005 90% 76%Fall 2006 91% 74%Fall 2007 91% 78%Fall 2008 90% 80%Fall 2009 92% 72%Fall 2010 89% 75%Fall 2011 88%7 YR AVG 90% 76%
Over the last seven years, Fisk has averaged a fall to spring retention rate of 90% and a fall tofall retention rate of 76%
90% 91% 91% 90% 92% 89% 88%
76% 74% 78% 80% 72% 75%
Fall 2005 Fall 2006 Fall 2007 Fall 2008 Fall 2009 Fall 2010 Fall 2011
Retention RateFall to Spring Retention Fall to Fall Retention
32
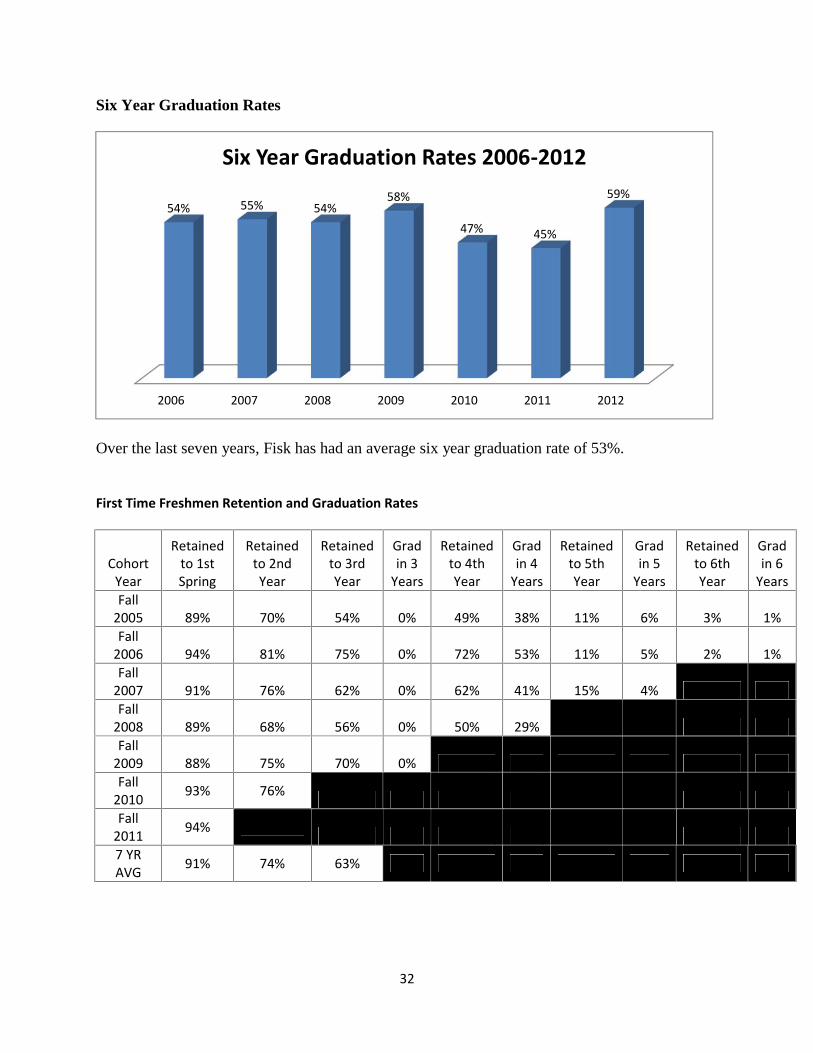
Six Year Graduation Rates
Over the last seven years, Fisk has had an average six year graduation rate of 53%.
First Time Freshmen Retention and Graduation Rates
CohortYear
Retainedto 1stSpring
Retainedto 2ndYear
Retainedto 3rdYear
Gradin 3
Years
Retainedto 4thYear
Gradin 4
Years
Retainedto 5thYear
Gradin 5
Years
Retainedto 6thYear
Gradin 6
YearsFall
2005 89% 70% 54% 0% 49% 38% 11% 6% 3% 1%Fall
2006 94% 81% 75% 0% 72% 53% 11% 5% 2% 1%Fall
2007 91% 76% 62% 0% 62% 41% 15% 4%Fall
2008 89% 68% 56% 0% 50% 29%Fall
2009 88% 75% 70% 0%Fall
2010 93% 76%
Fall2011 94%
7 YRAVG 91% 74% 63%
2006 2007 2008 2009 2010 2011 2012
54% 55% 54%58%
47% 45%
59%
Six Year Graduation Rates 2006-2012

33
Graduates by Major
Major 2005-2006
2006-2007
2007-2008
2008-2009
2009-2010
2010-2011
2011-2012
7 YRAVG
Art 6 2 3 2 5 1 2.7Biology, Bachelors 23 18 15 14 38 16 8 18.9Biology, Masters 3 1 2 0.9
Business 22 27 17 14 29 21 8 19.7Chemistry, Bachelors 6 4 5 4 6 1 3.7Chemistry, Masters 1 1 1 1 2 0.9Computer Science 6 3 1 1 2 3 2 2.6
Elected Studies 1 1 0.3English 11 10 6 14 11 8 3 9.0History 7 6 4 3 8 3 3 4.9
Mathematics 3 1 3 1 1.1Music 3 1 1 0.7
Music Education 3 1 2 1 1 1.1Music Performance 2 1 1 5 1.3
Nursing 5 4 3 1.7Physics, Bachelors 4 6 5 1 3 8 3.9Physics, Masters 6 10 5 6 3 4 4 5.4Political Science 9 16 6 7 6 5 3 7.4
Psychology, Bachelors 32 35 25 32 32 14 16 26.6Psychology, Masters 4 1 8 1 6 2 2 3.4
Sociology 7 17 13 10 8 7 3 9.3Spanish 2 2 1 3 3 4 2 2.4
Special Education 2 1 4 3 1 1.6Teacher Certification 1 1 0.3

34
During 2011–2012, the largest percentage of bachelor degrees were awarded in biology,business, and psychology.
Biology16%
Business16%
Computer Science4%
English6%History
6%
Music Education2%
Political Science6%
Psychology32%
Sociology6%
Spanish4%
Special Education2%
2011-2012 Bachelor Degrees
35
Faculty Information
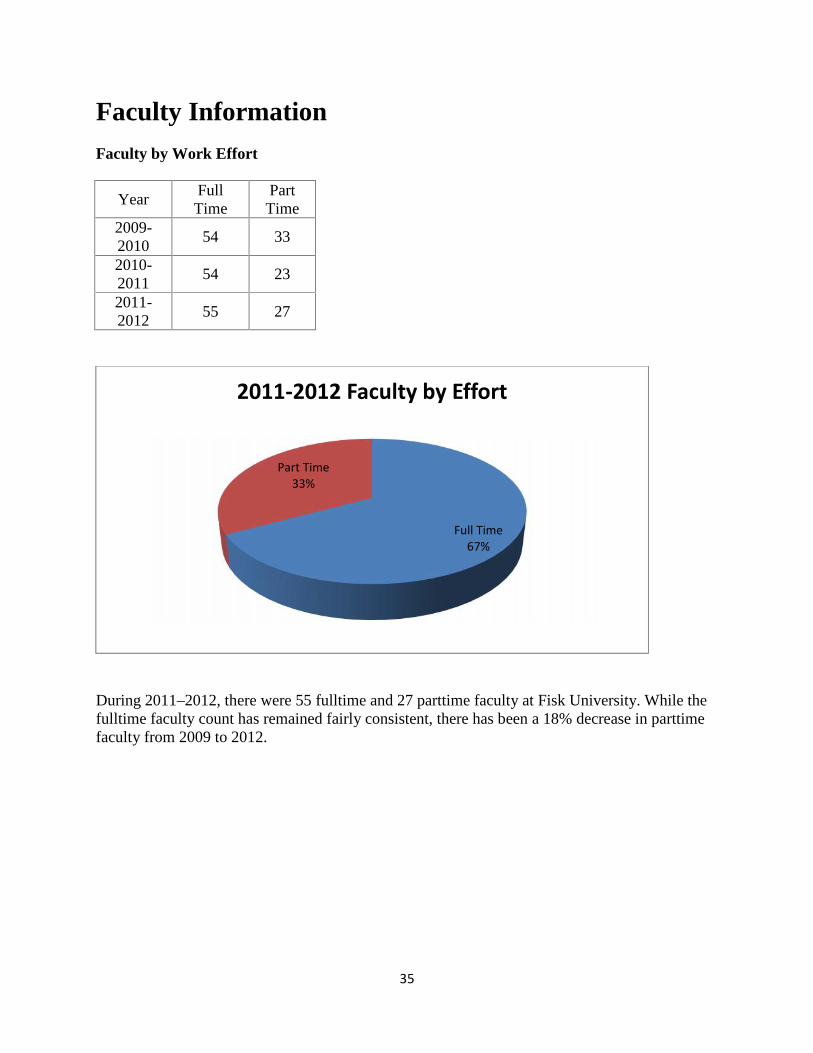
Faculty by Work Effort
YearFull
TimePart
Time2009-2010
54 33
2010-2011
54 23
2011-2012
55 27
During 2011–2012, there were 55 fulltime and 27 parttime faculty at Fisk University. While thefulltime faculty count has remained fairly consistent, there has been a 18% decrease in parttimefaculty from 2009 to 2012.
Full Time67%
Part Time33%
2011-2012 Faculty by Effort

36
Fulltime Faculty by Tenure Status
Year TenuredTenureTrack
Non-TenureTrack
2009-2010
37 8 9
2010-2011
36 7 11
2011-2012
36 9 10
Over the past three years, the distribution of full time faculty by tenure level has remainedfaculty consistent, averaging 36 tenured faculty, 8 faculty on tenure tracks, and 10 non–tenurefaculty annually.
Tenured66%
Tenure Track16%
Non-Tenure Track18%
2011-2012 Faculty by Tenure Status

37
Fulltime Faculty Status by Degree Level
Year DoctoralTerminalMasters
Masters
2009-2010
40 3 11
2010-2011
40 1 13
2011-2012
43 1 11
Over the past three years, an average of 75% of Fisk full time faculty have earned doctoraldegrees.
Doctoral78%
Terminal Masters2%
Masters20%
2011-2012 Faculty by Degree Level

38
Financial Information
Statement of Revenue and Expenses
In fiscal year ending June 30, 2011 (FY2011), tuition and fee revenue was $6 million. Over thepast four fiscal years, Fisk has averaged $6.8 million in tuition and fee revenue. Fisk endowmentat the end of FY2011 was $13, 438, 981. Over the last four fiscal years, Fisk has had an averageending endowment of $12, 867, 005.
REVENUES FY2008 FY2009 FY2010 FY2011 4 YR AVGTUITION AND FEES $7,682,517 $6,990,776 $6,522,387 $5,997,320 $6,798,250PRIVATE GIFTS &
GRANTS$9,543,601 $5,282,935 $2,802,935 $3,693,296 $5,330,692
GOVERNMENTGRANTS/CONTRACTS
$7,492,839 $6,774,067 $7,835,223 $8,124,801 $7,556,733
INVESTMENT INCOME& NET GAINS* ($207,138) ($1,451,892) $471,468 $795,640 -$97,981
SALES/AUXILIARYENTERPRISES
$3,884,024 $3,839,549 $2,934,271 $2,821,199 $3,369,761
OTHER INCOME $742,099 $590,969 $1,232,713 $1,038,008 $900,947TOTAL REVENUES $29,137,942 $22,026,404 $21,798,997 $22,470,264 $23,858,402
EXPENSES FY2008 FY2009 FY2010 FY2011 4 YR AVGINSTRUCTION $6,700,631 $5,665,148 $5,664,987 $5,658,927 $5,922,423
RESEARCH $4,474,084 $3,133,483 $3,853,962 $4,530,090 $3,997,905ACADEMIC SUPPORT $3,551,251 $3,449,009 $2,822,062 $2,783,792 $3,151,529STUDENT SERVICES $2,808,011 $2,265,154 $2,319,115 $2,601,324 $2,498,401
INSTITUTIONALSUPPORT
$7,506,771 $5,844,396 $5,709,880 $5,462,960 $6,131,002
EXPENSES/AUXILIARYENTERPRISES
$1,816,090 $3,817,624 $3,970,130 $4,273,221 $3,469,266
TOTAL EXPENSES $26,856,838 $24,174,814 $24,340,136 $25,310,314 $25,170,526CHANGE IN NET
ASSETS$2,281,104 ($2,148,410) ($2,541,139) ($2,840,050) -$1,312,124
ENDOWMENT $13,276,166 $12,141,741 $12,611,220 $13,438,891 $12,867,005Source: Office of Business and Finance, March 2012
* Note: Revenue amount for fiscal year 2007 includes fair market value on unrealizedappreciation of Art held for investment.

39
Gift Summary and Alumni of Record
Gift Summary and Alumni of Record
2007-08 2008-09 2009-10 2010-114 YRAVG
Alumni $1,667,536 $972,678 $1,000,628 $1,257,386 $1,224,557
Trustees $1,022,612 $378,658 $338,634 $370,215 $527,530
UNCF $350,872 $422,595 $266,651 $336,725 $344,211
Corporations $1,208,113 $796,076 $565,905 $674,378 $811,118
Foundations $3,896,943 $2,218,804 $633,239 $1,111,370 $1,965,089
Non-Alumni Individuals $537,848 $670,072 $216,567 $245,829 $417,579
United Church of Christ $86,064 $82,011 $77,551 $69,418 $78,761
Religious Organizations $120,741 $6,219 $6,975 $36,825 $42,690
Faculty/Staff $114,732 $16,655 $16,734 $21,397 $42,379
Other $97,962 $21,058 $14,494.01 $22,324 $38,959
TOTAL $9,103,422 $5,584,827 $3,137,376 $4,145,864 $5,492,872
2007-08 2008-09 2009-10 2010-114 YRAVG
Alumni of Record 7,554 7,847 7,791 7,718 7,728
Alumni Solicitations 7,554 7,847 7,791 7,718 7,728
Alumni Donors 1,543 1,114 1,187 1,451 1,324Source: Office of Institutional Advancement, July 2012
The 2010–2011 total gift was $4.1 million, approximately a $1 million increase over 2009–2010.Over the past four years, Fisk has averaged $5.5 million in total gifts. In 2010–2011, Fisk had1451 alumni donors, which was significantly higher than the 2009–2010 count of 1187. Over thepast four years, Fisk has averaged having 1324 alumni donors.