fisheries occasional publication
TRANSCRIPT

FISHERIES OCCASIONAL PUBLICATION
DEPARTMENT OF FISHERIES
COMMUNITY SURVEY 2005
By Tara Baharthah
FISHERIES OCCASIONAL PAPER No. 33
Department of Fisheries
168-170 St. George's Terrace Perth WA 6000
January 2006
ISSN 1447- 2058

Department of Fisheries Community Survey 2005
By Tara Baharthah
January 2006
Cover photo: Fishing at Kalbarri
Photo by: Stuart Blight
Fisheries Occasional Paper No. 33 ISSN 1447- 2058
2

CONTENTS ABSTRACT....................................................................................................................................................4
1.0 INTRODUCTION..............................................................................................................................5
2.0 METHOD............................................................................................................................................5
3.0 RESULTS............................................................................................................................................6 3.1 PARTICIPATION RATE IN RECREATIONAL FISHING..............................................................................6 3.2 SATISFACTION INDEX........................................................................................................................9 3.3 SATISFACTION RATE .......................................................................................................................10 3.4 GENERAL FISHING BACKGROUND....................................................................................................11 3.5 FISHING INVOLVEMENT DURING THE LAST TWELVE MONTHS ..........................................................12 3.6 VIEWING FISH AND THE MARINE ENVIRONMENT..............................................................................13 3.7 AWARENESS AND IMPRESSION OF THE DEPARTMENT OF FISHERIES ................................................13 3.8 ALLOCATION OF FISH RESOURCES AMONG THE FISHING SECTORS....................................................22 3.9 AWARENESS AND OPINION OF FISHING REGULATIONS .....................................................................23 3.10 KNOWLEDGE OF RECREATIONAL FISHING REGULATIONS.................................................................24 3.11 SATISFACTION WITH MOST RECENT FISHING TRIP ............................................................................27 3.12 INFORMATION ABOUT RECREATIONAL FISHING ...............................................................................32 3.13 CONTACT WITH THE DEPARTMENT OF FISHERIES............................................................................33 3.14 AWARENESS OF REPRESENTATIVES OF THE DEPARTMENT OF FISHERIES .........................................36 3.15 RECOLLECTION OF THE DEPARTMENT OF FISHERIES .......................................................................37 3.16 OPINION ON AQUACULTURE............................................................................................................38 3.17 DEMOGRAPHICS ..............................................................................................................................41
4.0 REFERENCES.................................................................................................................................43
5.0 APPENDICES ..................................................................................................................................44 5.1 APPENDIX A: SURVEY QUESTIONNAIRE FORM...............................................................................44 5.2 APPENDIX B: SURVEY ANSWER FORM...........................................................................................51
3

Department of Fisheries Community Survey 2005
4
ABSTRACT
A telephone survey of the Western Australian public was conducted to assess the level of success of programs implemented by the Department of Fisheries. The sample comprised of 700 interviews, 422 in the metropolitan area and 278 in regional areas throughout the State.
This community survey was used to determine the level of recall and awareness of the Department of Fisheries, the understanding and support of the community for the Department of Fisheries’ management strategies and to examine key aspects of community participation in recreational fishing.
It is estimated that the overall participation rate for recreational fishing in Western Australia is 537,587 individuals or 31.1 per cent of the total population.
An overall satisfaction-scoring index has been developed to measure and monitor the satisfaction of recreational fishers in Western Australia. The satisfaction index is a combination of knowledge, management, and confidence. The satisfaction index for recreational fishing was 74.6 per cent.
The satisfaction rating of the broader community relates to their perceptions of the extent to which the Department of Fisheries is achieving sustainable fisheries management objectives. The Department of Fisheries was given a satisfaction rate of 83.7 per cent by the Western Australian public.

Department of Fisheries Community Survey 2005
5
1.0 INTRODUCTION
A community survey of the Western Australian public was conducted to assess the level of success of programs implemented by the Department of Fisheries.
The objectives of the research were to:
• Assess the level of recall and awareness of the Department of Fisheries’ informational and promotional activities.
• Assess the understanding and support of the community for the Department of Fisheries’ management strategies across all programs (Recreational Fisheries, Commercial Fisheries, Fish and Fish Habitat Protection, and Aquaculture and Pearling).
• Examine key aspects of community fishing such as satisfaction with the quality of recreational fishing and knowledge of the rules that apply.
2.0 METHOD
The survey was conducted by telephone during May 2005. The fieldwork was conducted by Asset Research. Telephone numbers were selected randomly from the DTMS white pages on CD-ROM. Respondents were males and females older than 17 years and residing in Western Australia. The sample comprised:
• 422 metropolitan interviews; and
• 278 regional interviews.
The same questionnaire (Appendix A) and answer sheet (Appendix B) were used for all respondents.
All data was entered into a Microsoft Access database. Analysis was performed using Microsoft Excel. Graphs were produced using SigmaPlot.
Department of Fisheries Community Survey 2005
6
3.0 RESULTS
3.1 Participation rate in recreational fishing
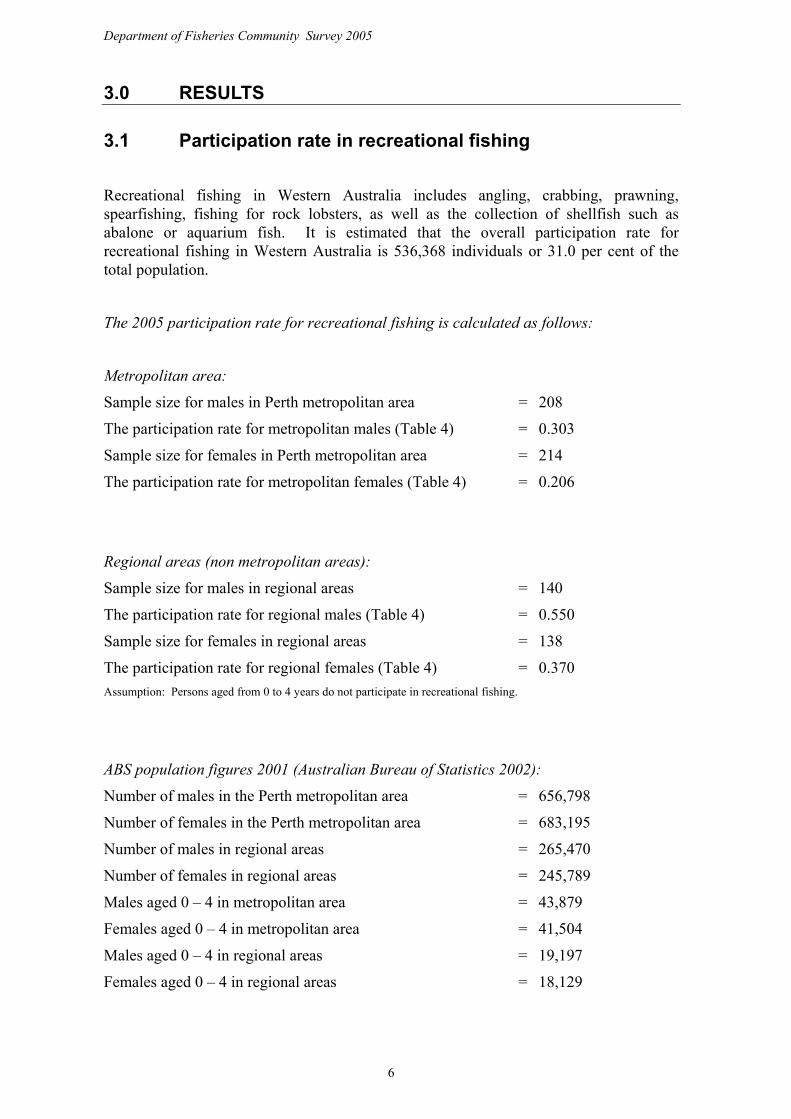
Recreational fishing in Western Australia includes angling, crabbing, prawning, spearfishing, fishing for rock lobsters, as well as the collection of shellfish such as abalone or aquarium fish. It is estimated that the overall participation rate for recreational fishing in Western Australia is 536,368 individuals or 31.0 per cent of the total population.
The 2005 participation rate for recreational fishing is calculated as follows:
Metropolitan area:
Sample size for males in Perth metropolitan area = 208
The participation rate for metropolitan males (Table 4) = 0.303
Sample size for females in Perth metropolitan area = 214
The participation rate for metropolitan females (Table 4) = 0.206
Regional areas (non metropolitan areas):
Sample size for males in regional areas = 140
The participation rate for regional males (Table 4) = 0.550
Sample size for females in regional areas = 138
The participation rate for regional females (Table 4) = 0.370 Assumption: Persons aged from 0 to 4 years do not participate in recreational fishing.
ABS population figures 2001 (Australian Bureau of Statistics 2002):
Number of males in the Perth metropolitan area = 656,798
Number of females in the Perth metropolitan area = 683,195
Number of males in regional areas = 265,470
Number of females in regional areas = 245,789
Males aged 0 – 4 in metropolitan area = 43,879
Females aged 0 – 4 in metropolitan area = 41,504
Males aged 0 – 4 in regional areas = 19,197
Females aged 0 – 4 in regional areas = 18,129
Department of Fisheries Community Survey 2005
7
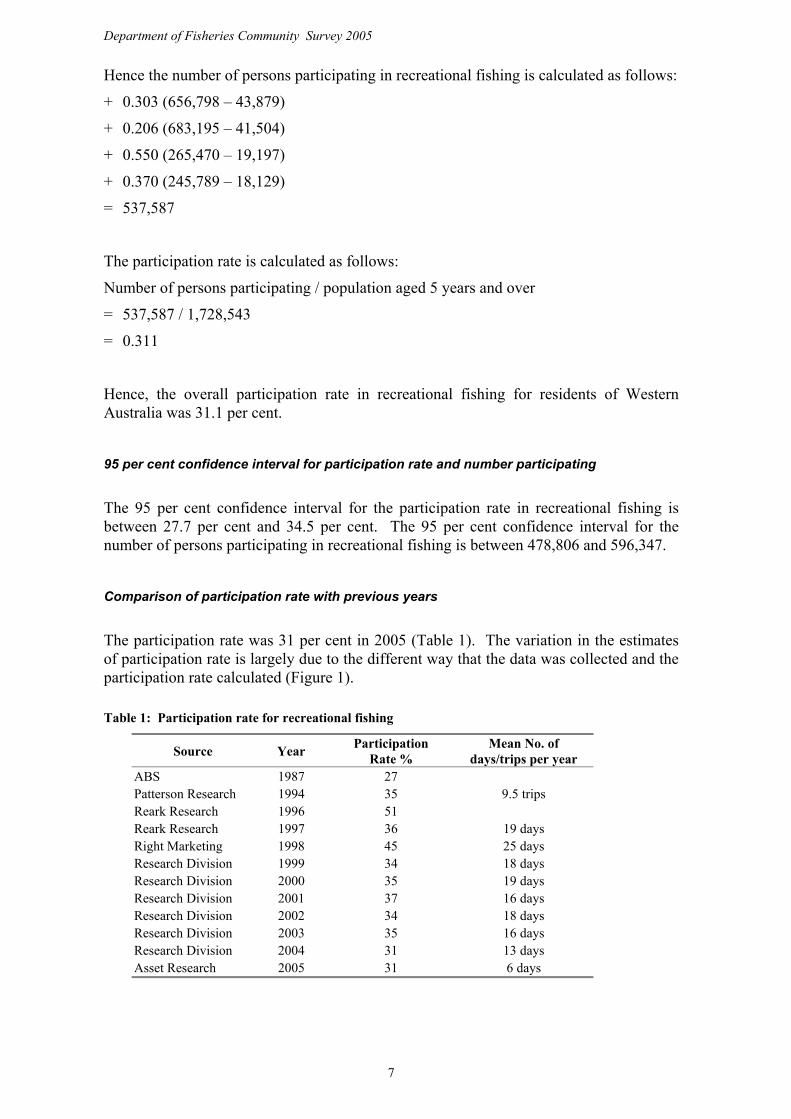
Hence the number of persons participating in recreational fishing is calculated as follows:
+ 0.303 (656,798 – 43,879)
+ 0.206 (683,195 – 41,504)
+ 0.550 (265,470 – 19,197)
+ 0.370 (245,789 – 18,129)
= 537,587
The participation rate is calculated as follows:
Number of persons participating / population aged 5 years and over
= 537,587 / 1,728,543
= 0.311
Hence, the overall participation rate in recreational fishing for residents of Western Australia was 31.1 per cent.
95 per cent confidence interval for participation rate and number participating
The 95 per cent confidence interval for the participation rate in recreational fishing is between 27.7 per cent and 34.5 per cent. The 95 per cent confidence interval for the number of persons participating in recreational fishing is between 478,806 and 596,347.
Comparison of participation rate with previous years
The participation rate was 31 per cent in 2005 (Table 1). The variation in the estimates of participation rate is largely due to the different way that the data was collected and the participation rate calculated (Figure 1). Table 1: Participation rate for recreational fishing
Source Year Participation Rate %
Mean No. of days/trips per year
ABS 1987 27 Patterson Research 1994 35 9.5 trips Reark Research 1996 51 Reark Research 1997 36 19 days Right Marketing 1998 45 25 days Research Division 1999 34 18 days Research Division 2000 35 19 days Research Division 2001 37 16 days Research Division 2002 34 18 days Research Division 2003 35 16 days Research Division 2004 31 13 days Asset Research 2005 31 6 days

Department of Fisheries Community Survey 2005
25
30
35
40
45
50
55
1986 1988 1990 1992 1994 1996 1998 2000 2002 2004 2006
Year
Part
icip
atio
n R
ate
(per
cent
age)
Figure 1: Participation rate for recreational fishing
Days Fished The number of days fished by recreational fishers in the last twelve months ranges from one to 60 days. The mean number of days fishing was six days and the median three days. The majority of recreational fishers in Western Australia fished between one and five days. However, some fished for considerably more days giving a skewed frequency distribution (Figure 2). It is likely that the number of days fished has been overstated due
to the inability of respondents to accurately recall past fishing trips over a 12-month period.
0
20
40
60
80
100
120
140
160
180
1 to 5 6 to 10 11 to 15 16 to 20 21 to 25 26 to 30 31 to 35 36 to 40 41 to 50 > 50
Number of Days
Freq
uenc
y
Figure 2: Frequency distribution of number of days fished
The median number of days fished by recreational fishers in the last twelve months was three days (Figure 3). The median number of days fished appears to be lower than in previous years, however, the trend will become apparent in future years when more data is available.
8

Department of Fisheries Community Survey 2005
YEAR
1998/1999 1999/2000 2000/2001 2001/2002 2002/2003 2003/2004 2004/2005
DAY
S FI
SHED
0
2
4
6
8
10
1998/1999 1999/2000 2000/2001 2001/2002 2002/2003 2003/2004 2004/2005
Figure 3: Median number of days fished
3.2 Satisfaction Index
An overall satisfaction-scoring index has been developed to measure and monitor the satisfaction of recreational fishers in Western Australia.
The satisfaction rate is a combination of Knowledge, Management, and Confidence.
Knowledge = the level of the person’s awareness of biology and behaviour of fish and the best way to catch fish.
Management = the level of the person’s awareness of rules and regulations.
Confidence = the level of the person’s satisfaction with the number, size and variety of fish caught on their last trip and satisfaction with the overall fishing trip.
Satisfaction Index = Mean (Knowledge + Management + Confidence)
= (q9 + q10 (a to c) + q11 (a to e)) / 9
= (0.918 + 0.671 + 0.754 + 0.786 + 0.615 + 0.612 + 0.599 + 0.919 + 0.842)/9
= 0.746
= 74.6% (Note: Responses of the “can’t say”/ “neither” type were excluded from the calculation of the satisfaction rate)
9

Department of Fisheries Community Survey 2005
10
Table 2: Satisfaction Index
Number of Respondents
Satisfaction
%
Knowledge
Habitat and behaviour 219 0.671 Knowledgeable
Ways to catch fish 224 0.754 Knowledgeable
Management
Bag and size limits 224 0.786 Knowledgeable
Awareness of rules and regulations 695 0.918 Knowledgeabl
e
Confidence
Number of fish caught 221 0.615 Satisfied
Variety of fish caught 214 0.612 Satisfied
Size of fish caught 217 0.599 Satisfied
Environment where fishing 222 0.919 Satisfied
Overall fishing trip 221 0.984 Satisfied
Satisfaction Index 0.746
The satisfaction index for recreational fishing was 74.6 per cent (Table 2) with a 95 per cent confidence interval between 72.8 per cent and 76.4 per cent. The satisfaction index is significantly lower than the value of 81.4 per cent reported by the 2004 Community Survey (Baharthah, 2004).
This was primarily due to a decrease in the proportion of respondents who were very satisfied with the number, variety and size of their catch and the environment where fishing and a decrease in the proportion of respondents who were very knowledgeable about the habitat and ways to catch fish. It is also due to a decrease in the proportion of respondents who were very satisfied with the overall fishing trip.
3.3 Satisfaction Rate
The satisfaction rating of the broader community relates to their perceptions of the extent to which the Department of Fisheries is achieving sustainable fisheries management objectives.

Department of Fisheries Community Survey 2005
11
Satisfaction Rate = Mean (Managing commercial fishing
+ Managing recreational fishing
+ Protection of fish habitat
+ Managing aquaculture and pearling
+ Fair allocation of resources between groups)
= (q4b + q5b + q6b + q7b + q8) / 5
= (0.867 + 0.818 + 0.799 + 0.915 + 0.789) / 5
= 0.837
= 83.7% (Note: Responses of the “can’t say”/ “neither” type were excluded from the calculation of the satisfaction rate)
The following results are from the 53.5 per cent of respondents who knew the Department of Fisheries was responsible for one or more of the four sub-programs. Table 3: Satisfaction Rate
Number of respondents
Satisfaction %
Commercial Fisheries 196 0.867 Recreational Fishing 181 0.818 Fish Habitat Protection 139 0.799 Aquaculture and Pearling 94 0.915 Allocation of Resources 199 0.789 Satisfaction Rate 0.837
The Department of Fisheries was given a satisfaction rate of 83.7 per cent by the Western Australian public (Table 3). The 95 per cent confidence interval for the satisfaction rate is between 81.2 per cent and 86.3 per cent. The satisfaction rate is not significantly different to the value of 83.9 per cent reported by the 2004 Community Survey (Baharthah, 2004). Overall, in terms of recreational fishing, commercial fishing, aquaculture and fish habitat protection, 83.7 per cent of the community rated the Department of Fisheries’ performance as good.
3.4 General fishing background
Question 1
In question 1, respondents were asked: “Thinking back over the last twelve months, have you done any recreational fishing, including angling, crabbing, prawning, spearfishing, collecting abalone or aquarium fish?”
Male respondents in regional areas were most likely to participate in recreational fishing during the last twelve months (Table 4).
Department of Fisheries Community Survey 2005
12
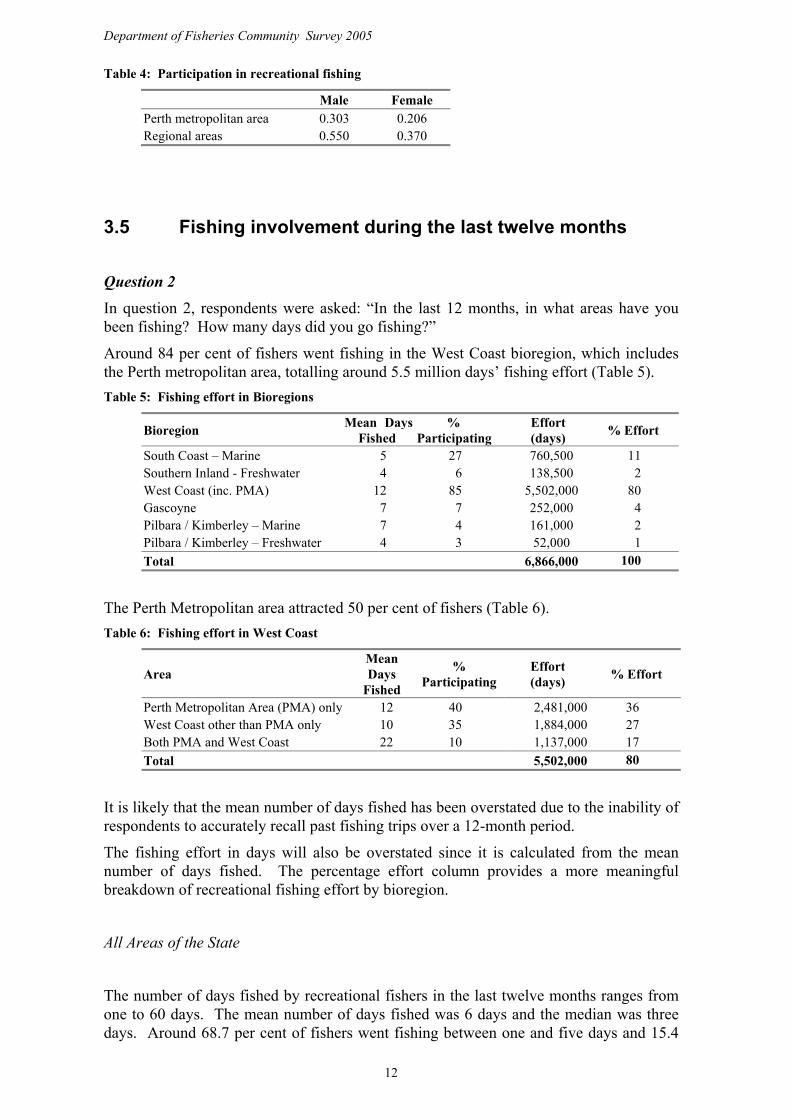
Table 4: Participation in recreational fishing
Male Female Perth metropolitan area 0.303 0.206 Regional areas 0.550 0.370
3.5 Fishing involvement during the last twelve months
Question 2
In question 2, respondents were asked: “In the last 12 months, in what areas have you been fishing? How many days did you go fishing?”
Around 84 per cent of fishers went fishing in the West Coast bioregion, which includes the Perth metropolitan area, totalling around 5.5 million days’ fishing effort (Table 5). Table 5: Fishing effort in Bioregions
Bioregion Mean Days Fished
% Participating
Effort (days) % Effort
South Coast – Marine 5 27 760,500 11 Southern Inland - Freshwater 4 6 138,500 2 West Coast (inc. PMA) 12 85 5,502,000 80 Gascoyne 7 7 252,000 4 Pilbara / Kimberley – Marine 7 4 161,000 2 Pilbara / Kimberley – Freshwater 4 3 52,000 1 Total 6,866,000 100
The Perth Metropolitan area attracted 50 per cent of fishers (Table 6). Table 6: Fishing effort in West Coast
Area Mean Days
Fished
% Participating
Effort (days) % Effort
Perth Metropolitan Area (PMA) only 12 40 2,481,000 36 West Coast other than PMA only 10 35 1,884,000 27 Both PMA and West Coast 22 10 1,137,000 17 Total 5,502,000 80
It is likely that the mean number of days fished has been overstated due to the inability of respondents to accurately recall past fishing trips over a 12-month period.
The fishing effort in days will also be overstated since it is calculated from the mean number of days fished. The percentage effort column provides a more meaningful breakdown of recreational fishing effort by bioregion.
All Areas of the State
The number of days fished by recreational fishers in the last twelve months ranges from one to 60 days. The mean number of days fished was 6 days and the median was three days. Around 68.7 per cent of fishers went fishing between one and five days and 15.4

Department of Fisheries Community Survey 2005
13
per cent fished between six and ten days. However, some fished for considerably more days giving a skewed distribution.
3.6 Viewing fish and the marine environment
Question 3
In question 3, respondents were asked: “Also, thinking back over the last twelve months, have you gone snorkelling or diving just to look at fish and the marine environment rather than to capture fish or other animals?”
Around 24 per cent of respondents went snorkelling or diving just to view fish and the marine environment (Table 7). Table 7: Viewing fish and the marine environment
Count % Yes 165 23.6 No 532 76.1 Can’t Say 2 0.3 Total 699 100
3.7 Awareness and impression of the Department of Fisheries
Question 4a
In question 4a, respondents were asked: “Who, if anyone, do you think is responsible for managing commercial fishing in Western Australia?”
The Department of Fisheries was recognised by 45.1 per cent as responsible for managing commercial fishing in Western Australia and 28.8 per cent of respondents did not know who was responsible (Table 8).
Multiple responses were accepted.
Table 8: Organisations responsible for commercial fishing
Count % Department of Fisheries 315 45.1 Don’t Know 201 28.8 State Government 153 21.9 Other 21 3.0 CALM 20 2.9 Department of Agriculture 8 1.1 Marine & Harbours 4 0.6 Local council/shire 3 0.4
There has been a significant decrease (p < 0.05) in the percentage of respondents that did not know who was responsible for the management of commercial fisheries over the past year and a significant increase in the percentage that said that the State Government and the Department of Fisheries was responsible (Figure 4).

Department of Fisheries Community Survey 2005
Year
1996 1997 1998 1999 2000 2001 2002 2003 2004 2005
Per
cent
age
0
10
20
30
40
50
60
Department of Fisheries CALM Don't Know State Government
Figure 4: Organisations responsible for commercial fishing
Question 4b
“There are a number of rules and regulations in place, which limits catch size, allowable fishing days and designated areas to fish.”
In question 4b, respondents were asked: “How would you rate the Department of Fisheries in their management of commercial fisheries?”
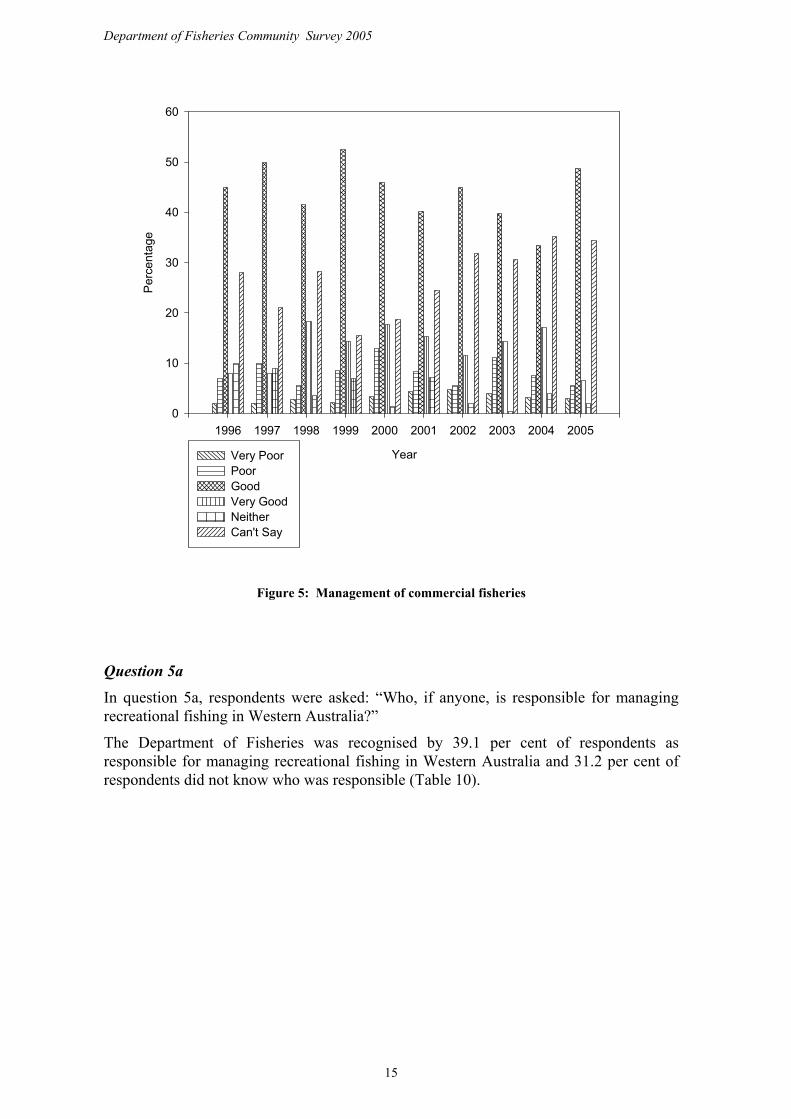
Of the respondents that knew that the Department of Fisheries was responsible for the management of commercial fisheries, 55.2 per cent gave a good or very good rating (Table 9). Table 9: Management of commercial fisheries
Count % Very Good 20 6.5 Good 150 48.7 Poor 17 5.5 Very Poor 9 2.9 Neither 6 2.0 Can’t Say 106 34.4 Total 308 100
Over the last year, there was a significant decrease (p < 0.05) in the proportion of very good responses and an increase in the proportion of good responses in the rating of the management of commercial fisheries (Figure 5).
14
Department of Fisheries Community Survey 2005
Year
1996 1997 1998 1999 2000 2001 2002 2003 2004 2005
Per
cent
age
0
10
20
30
40
50
60
Very Poor Poor Good Very Good Neither Can't Say
Figure 5: Management of commercial fisheries
Question 5a
In question 5a, respondents were asked: “Who, if anyone, is responsible for managing recreational fishing in Western Australia?”
The Department of Fisheries was recognised by 39.1 per cent of respondents as responsible for managing recreational fishing in Western Australia and 31.2 per cent of respondents did not know who was responsible (Table 10).
15

Department of Fisheries Community Survey 2005
Multiple responses were accepted.
Table 10: Organisations responsible for recreational fishing
Count % Department of Fisheries 273 39.1 Don't Know 218 31.2 State Government 156 22.3 Other 36 5.2 CALM 20 2.9 Local council/shire 11 1.6 Recfishwest 7 1.0 Department of Agriculture 3 0.4 Waters & Rivers Commission 1 0.3 Marine & Harbours 1 0.1
There has been a significant increase (p < 0.05) in the percentage of persons that said that the state government was responsible for managing recreational fishing (Figure 6).
Year
1996 1997 1998 1999 2000 2001 2002 2003 2004 2005
Per
cent
age
0
10
20
30
40
50
60
Department of Fisheries CALM Don't Know State Government Local Council
Figure 6: Organisations responsible for recreational fishing
Question 5b
In question 5b, respondents were asked: “How would you rate the Department of Fisheries in their management of recreational fisheries?”
Of the respondents that knew that the Department of Fisheries was responsible for recreational fishing, 56.2 per cent gave a good or very good rating (Table 11). A small 16

Department of Fisheries Community Survey 2005
number of respondents (12.6 per cent) had a poor or very poor opinion of the Department of Fisheries performance. Table 11: Management of recreational fishing
Count % Very Good 17 6.4 Good 131 49.8 Poor 26 9.9 Very Poor 7 2.7 Neither 7 2.7 Can’t Say 75 28.5 Total 263 100
Over the last year there has been a significant decrease (p < 0.05) in the percentage of respondents that gave the Department of Fisheries a very good rating, with a corresponding increase in the percentage that gave a good rating (Figure 7).
Year
1996 1997 1998 1999 2000 2001 2002 2003 2004 2005
Per
cent
age
0
10
20
30
40
50
60
70
Very Poor Poor Good Very Good Neither Can't Say
Figure 7: Management of recreational fishing
Question 6a
In question 6a, respondents were asked: “When you think about the fish habitat in oceans and waterways in Western Australia, that is, where fish live and breed, who do you think, if anyone, is responsible for protecting the fish habitat?”
The Department of Fisheries was recognised by 27.6 per cent of respondents as responsible for protecting the fish habitat (Table 12). A large number of respondents (21.3 per cent) did not know who was responsible.
17
Department of Fisheries Community Survey 2005
Multiple responses were accepted.
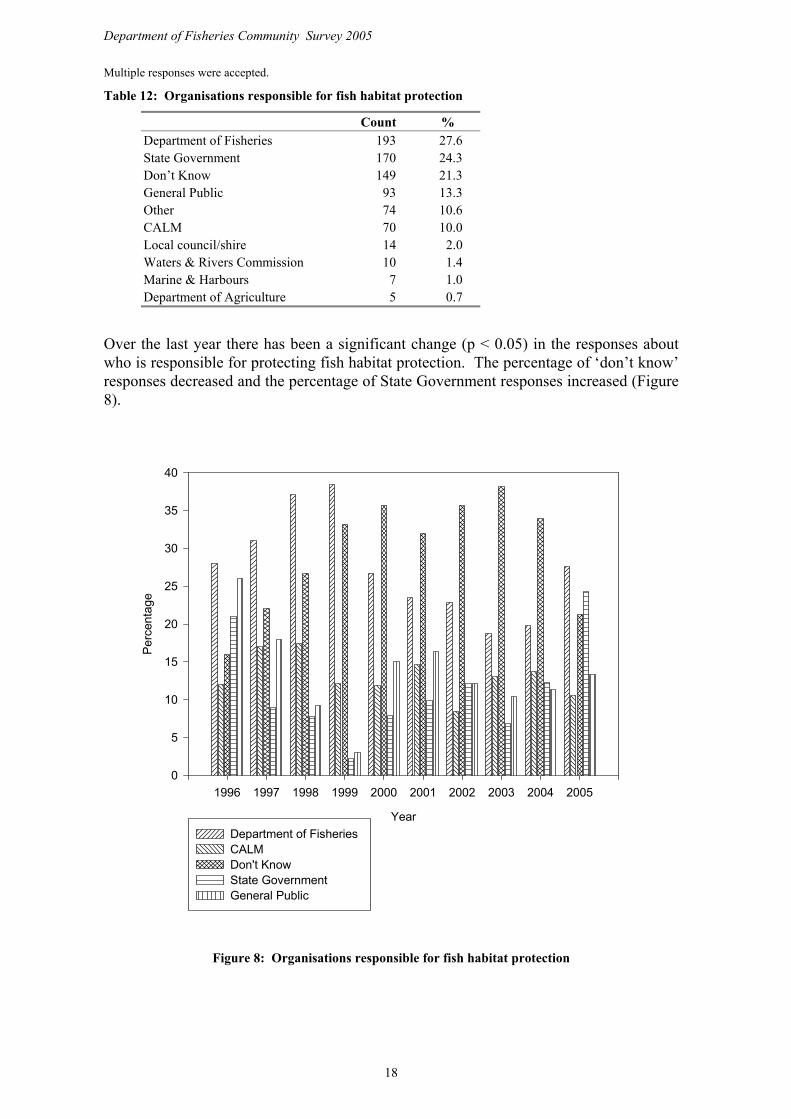
Table 12: Organisations responsible for fish habitat protection
Count % Department of Fisheries 193 27.6 State Government 170 24.3 Don’t Know 149 21.3 General Public 93 13.3 Other 74 10.6 CALM 70 10.0 Local council/shire 14 2.0 Waters & Rivers Commission 10 1.4 Marine & Harbours 7 1.0 Department of Agriculture 5 0.7
Over the last year there has been a significant change (p < 0.05) in the responses about who is responsible for protecting fish habitat protection. The percentage of ‘don’t know’ responses decreased and the percentage of State Government responses increased (Figure 8).
Year
1996 1997 1998 1999 2000 2001 2002 2003 2004 2005
Perc
enta
ge
0
5
10
15
20
25
30
35
40
Department of Fisheries CALM Don't Know State Government General Public
Figure 8: Organisations responsible for fish habitat protection
18

Department of Fisheries Community Survey 2005
Question 6b
In question 6b, respondents were asked: “How would you rate the Department of Fisheries in their conservation and protection of the fish habitat?”
Of the respondents that knew that the Department of Fisheries was responsible for conservation and protection of fish habitat, 59.4 per cent gave a good or very good rating (Table 13). A smaller number of respondents (15.0 per cent) had a poor or very poor opinion of the Department of Fisheries’ performance. Table 13: Conservation and protection of fish habitat
Count % Very Good 14 7.5 Good 97 51.9 Poor 22 11.8 Very Poor 6 3.2 Neither 6 3.2 Can’t Say 42 22.4 Total 187 100
There has been no significant change in the rating of the conservation and protection of fish habitat by Department of Fisheries over the past two years (Figure 9).
Year
1996 1997 1998 1999 2000 2001 2002 2003 2004 2005
Perc
enta
ge
0
10
20
30
40
50
60
Very Poor Poor Good Very Good Neither Can't Say
Figure 9: Conservation and protection of fish habitat
19

Department of Fisheries Community Survey 2005
Question 7a
In question 7a, respondents were asked: “When you think about aquaculture, pearling, or fish farming in Western Australia, who do you think, if anyone, is responsible for managing aquaculture?”
A high proportion of respondents (35.0 per cent) did not know who was responsible for the management of aquaculture (Table 14). However, the Department of Fisheries was recognised by 194 people - 27.6 per cent of the respondents - as responsible for the management of aquaculture in Western Australia. Multiple responses were accepted.
Table 14: Organisations responsible for managing aquaculture
Count % Other 294 41.9 Don’t Know 246 35.0 Department of Fisheries 194 27.6 State Government 148 21.1 Private Industry 57 8.1 Department of Agriculture 25 3.6 CALM 20 2.8 Local council/shire 4 0.6 Marine & Harbours 4 0.6 Waters & Rivers Commission 3 0.4
Over the last year there has been a significant change (p < 0.05) in the responses about who is responsible for managing aquaculture and pearling. The percentage of ‘don’t know’ responses decreased and the percentage of State Government responses increased (Figure 10).
Year
1996 1997 1998 1999 2000 2001 2002 2003 2004 2005
Per
cent
age
0
10
20
30
40
50
60
Department of Fisheries Private IndustryDon't Know State Government
Figure 10: Organisations responsible for managing aquaculture
20

Department of Fisheries Community Survey 2005
Question 7b
“The Department of Fisheries provides information such as advising on technology, identifying suitable sites and conducting and supporting research.”
In question 7b, respondents were asked: “How would you rate the Department of Fisheries in their management and development of aquaculture and pearling?”
Of the respondents that knew that the Department of Fisheries was responsible for the management of aquaculture, 47.5 per cent felt that the Department of Fisheries was doing a good or very good job (Table 15). A very small percentage (4.5 per cent) had a poor or very poor opinion of the Department of Fisheries’ performance. Table 15: Management and development of aquaculture
Count % Very Good 12 6.6 Good 74 40.9 Poor 7 3.9 Very Poor 1 0.6 Neither 2 1.1 Don’t Know 85 46.9 Total 181 100
There has been little change in the rating of the management and development of aquaculture and pearling over the past three years (Figure 11).
Year
1996 1997 1998 1999 2000 2001 2002 2003 2004 2005
Per
cent
age
0
10
20
30
40
50
60
70
Very Poor Poor Good Very Good Neither Don't Know
Figure 11: Management and development of aquaculture
21

Department of Fisheries Community Survey 2005
3.8 Allocation of fish resources among the fishing sectors
Question 8
“The Department of Fisheries is responsible for recreational fishing, commercial fishing, aquaculture and protecting the fish habitat.”
In question 8, respondents were asked: “In your opinion, do you think the Department of Fisheries manages the share of fish resources fairly between these sectors?”
Most respondents (56.3 per cent) thought that the Department of Fisheries allocates resources fairly between its sectors (Table 16). A large number of respondents (28.7 per cent) could not give an opinion. Table 16: Opinion on allocation of resources
Count % Yes 157 56.3 No 42 15.0 Can’t Say 80 28.7 Total 279 100
Over the last year there has been a significant decrease (p < 0.05) in the proportion of respondents who can’t say whether the Department of Fisheries allocates resources fairly between sectors and a significant increase in the proportion of respondents who said that the Department of Fisheries does allocate the share of fish resources fairly between the sectors (Figure 12).
Year
1997 1998 1999 2000 2001 2002 2003 2004 2005
Per
cent
age
0
10
20
30
40
50
60
70
Yes No Can't Say
Figure 12: Opinion on allocation of resources
22
Department of Fisheries Community Survey 2005
3.9 Awareness and opinion of fishing regulations
Question 9
In question 9, respondents were asked: “Before today, were you aware that there are recreational fishing rules that apply when fishing in Western Australian waters?”
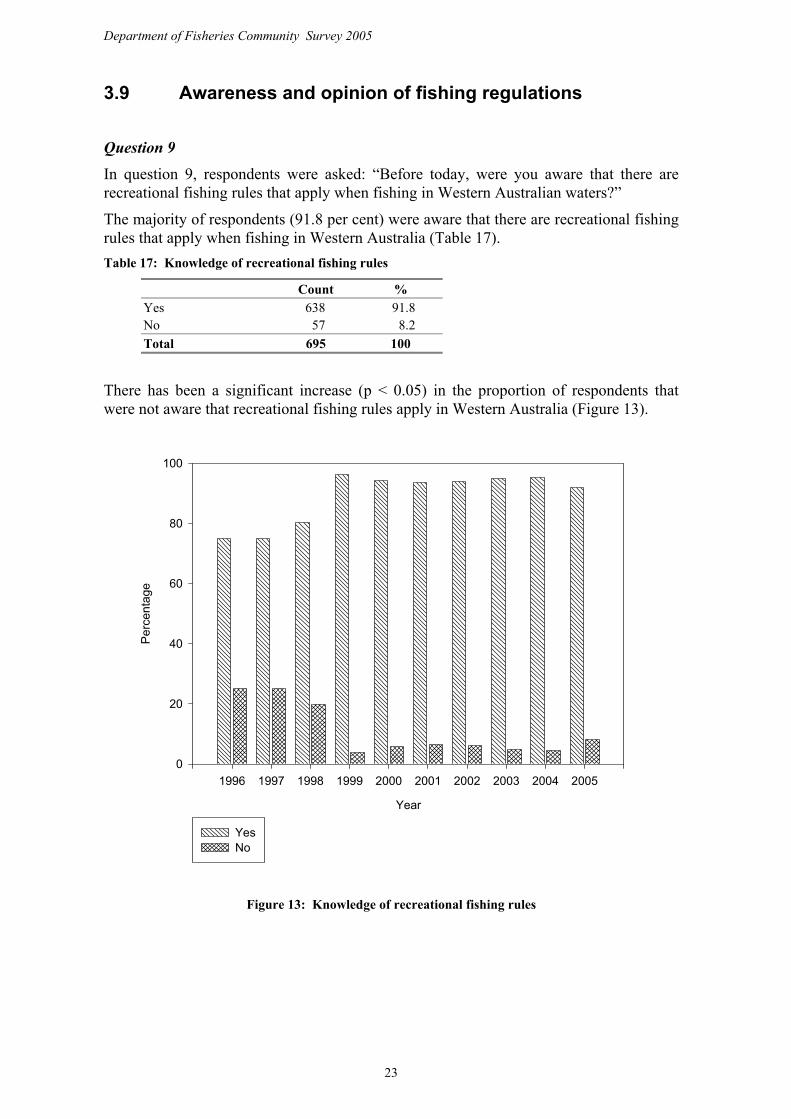
The majority of respondents (91.8 per cent) were aware that there are recreational fishing rules that apply when fishing in Western Australia (Table 17). Table 17: Knowledge of recreational fishing rules
Count % Yes 638 91.8 No 57 8.2 Total 695 100
There has been a significant increase (p < 0.05) in the proportion of respondents that were not aware that recreational fishing rules apply in Western Australia (Figure 13).
Year
1996 1997 1998 1999 2000 2001 2002 2003 2004 2005
Per
cent
age
0
20
40
60
80
100
YesNo
Figure 13: Knowledge of recreational fishing rules
23
Department of Fisheries Community Survey 2005
3.10 Knowledge of recreational fishing regulations
Question 10a
In question 10a, respondents were asked: “Thinking back to the last time you went fishing, how knowledgeable were you of the bag and size limits of fish you were planning to catch?”
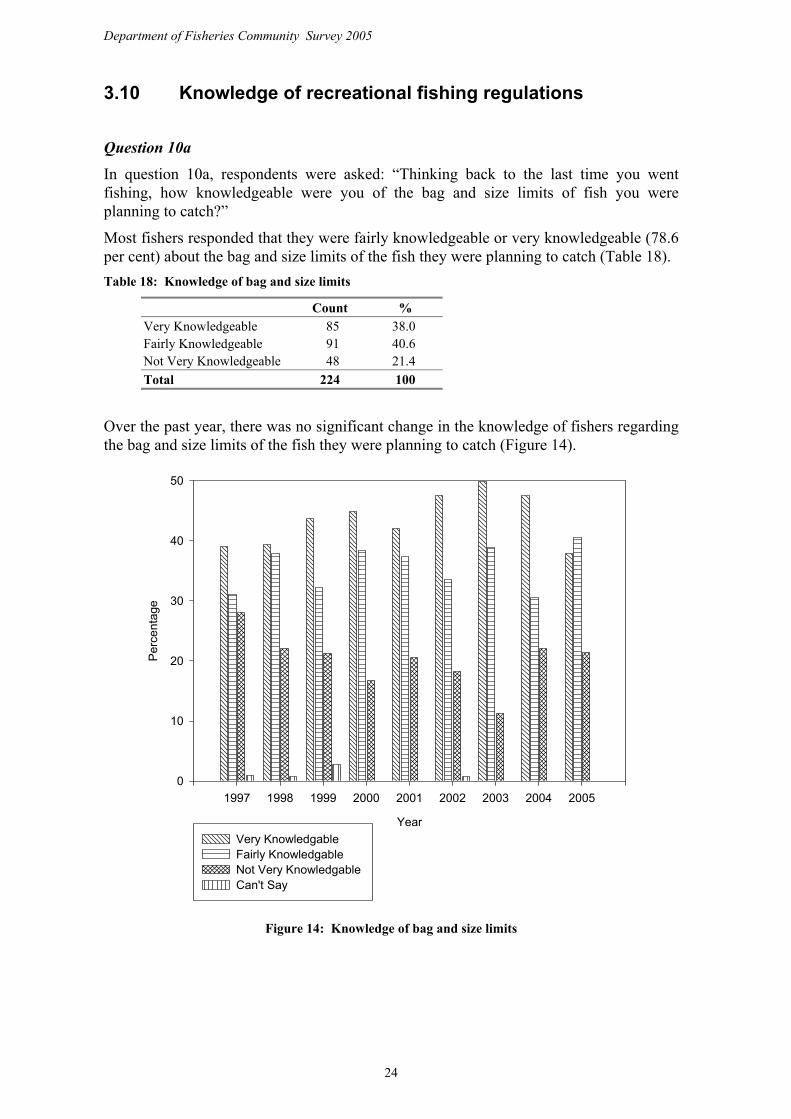
Most fishers responded that they were fairly knowledgeable or very knowledgeable (78.6 per cent) about the bag and size limits of the fish they were planning to catch (Table 18). Table 18: Knowledge of bag and size limits
Count % Very Knowledgeable 85 38.0 Fairly Knowledgeable 91 40.6 Not Very Knowledgeable 48 21.4 Total 224 100
Over the past year, there was no significant change in the knowledge of fishers regarding the bag and size limits of the fish they were planning to catch (Figure 14).
Year
1997 1998 1999 2000 2001 2002 2003 2004 2005
Per
cent
age
0
10
20
30
40
50
Very KnowledgableFairly Knowledgable Not Very Knowledgable Can't Say
Figure 14: Knowledge of bag and size limits
24
Department of Fisheries Community Survey 2005
Question 10b
In question 10b, respondents were asked: “How knowledgeable were you on the best ways to catch the fish you were after (e.g. method, bait, hooks)?”
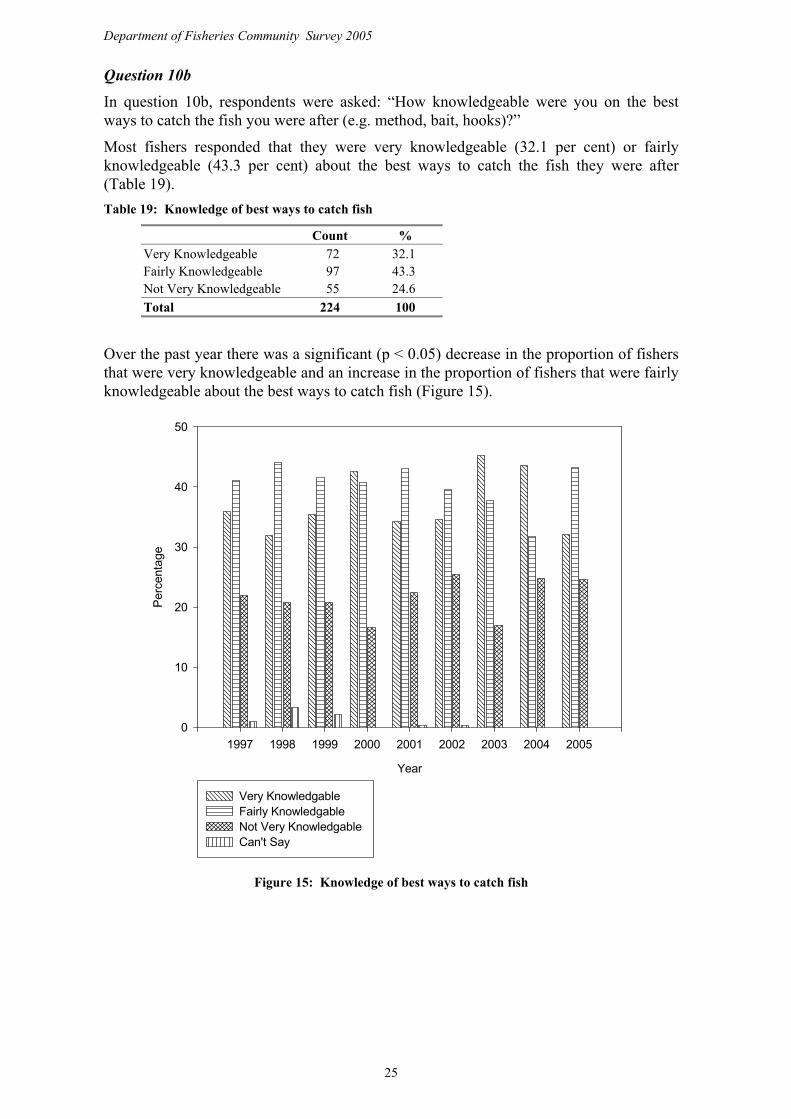
Most fishers responded that they were very knowledgeable (32.1 per cent) or fairly knowledgeable (43.3 per cent) about the best ways to catch the fish they were after (Table 19). Table 19: Knowledge of best ways to catch fish
Count % Very Knowledgeable 72 32.1 Fairly Knowledgeable 97 43.3 Not Very Knowledgeable 55 24.6 Total 224 100
Over the past year there was a significant (p < 0.05) decrease in the proportion of fishers that were very knowledgeable and an increase in the proportion of fishers that were fairly knowledgeable about the best ways to catch fish (Figure 15).
Year
1997 1998 1999 2000 2001 2002 2003 2004 2005
Per
cent
age
0
10
20
30
40
50
Very Knowledgable Fairly Knowledgable Not Very Knowledgable Can't Say
Figure 15: Knowledge of best ways to catch fish
25

Department of Fisheries Community Survey 2005
Question 10c
In question 10c, respondents were asked: “How knowledgeable were you on the habits of the fish you were after (e.g. where found, when feeding)?”
A high proportion of fishers responded that they were fairly knowledgeable (42.2 per cent) about the habits of the fish they were after (Table 20). Table 20: Knowledge of habits and behaviour of fish
Count % Very Knowledgeable 53 23.8 Fairly Knowledgeable 94 42.2 Not Very Knowledgeable 72 32.2 Can’t Say 4 1.8 Total 223 100
Over the past year there was a significant decrease (p < 0.05) in the proportion of fishers that were very knowledgeable and an increase in the proportion of fishers that were fairly knowledgeable about the habits and behaviour of the fish they were after (Figure 16).
Year
1997 1998 1999 2000 2001 2002 2003 2004 2005
Perc
enta
ge
0
10
20
30
40
50
Very Knowledgable Fairly Knowledgable Not Very KnowledgableCan't Say
Figure 16: Knowledge of habits and behaviour of fish
26
Department of Fisheries Community Survey 2005
3.11 Satisfaction with most recent fishing trip
Question 11a
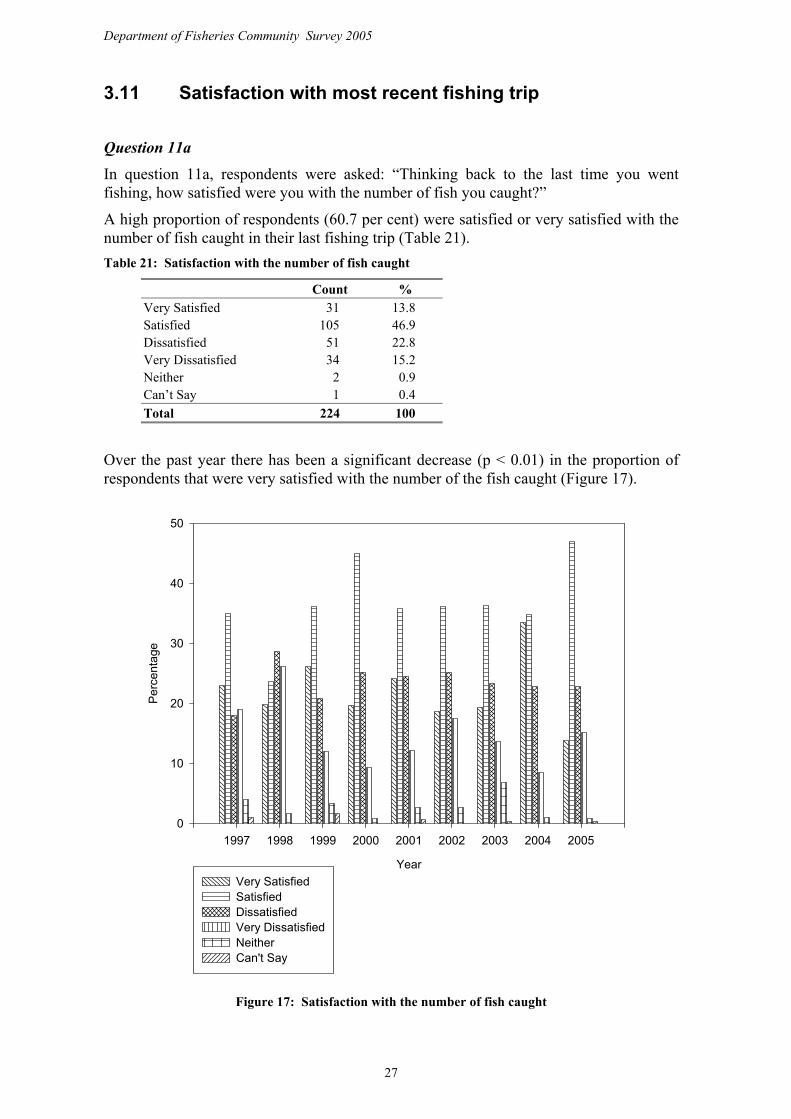
In question 11a, respondents were asked: “Thinking back to the last time you went fishing, how satisfied were you with the number of fish you caught?”
A high proportion of respondents (60.7 per cent) were satisfied or very satisfied with the number of fish caught in their last fishing trip (Table 21). Table 21: Satisfaction with the number of fish caught
Count % Very Satisfied 31 13.8 Satisfied 105 46.9 Dissatisfied 51 22.8 Very Dissatisfied 34 15.2 Neither 2 0.9 Can’t Say 1 0.4 Total 224 100
Over the past year there has been a significant decrease (p < 0.01) in the proportion of respondents that were very satisfied with the number of the fish caught (Figure 17).
Year
1997 1998 1999 2000 2001 2002 2003 2004 2005
Per
cent
age
0
10
20
30
40
50
Very Satisfied Satisfied Dissatisfied Very DissatisfiedNeither Can't Say
Figure 17: Satisfaction with the number of fish caught
27

Department of Fisheries Community Survey 2005
Question 11b
In question 11b, respondents were asked: “How satisfied were you with the variety of fish caught?”
Most fishers (58.8 per cent) were satisfied or very satisfied with the variety of fish caught (Table 22). Table 22: Satisfaction with the variety of fish caught
Count % Very Satisfied 26 11.7 Satisfied 105 47.1 Dissatisfied 54 24.2 Very Dissatisfied 29 13.0 Neither 6 2.7 Can’t Say 3 1.3 Total 223 100
Over the past year there has been a significant decrease (p < 0.01) in the proportion of respondents that were very satisfied with the variety of the fish caught (Figure 18).
Year
1997 1998 1999 2000 2001 2002 2003 2004 2005
Per
cent
age
0
10
20
30
40
50
60
Very Satisfied Satisfied Dissatisfied Very DissatisfiedNeither Can't Say
Figure 18: Satisfaction with the variety of fish caught
28
Department of Fisheries Community Survey 2005
Question 11c
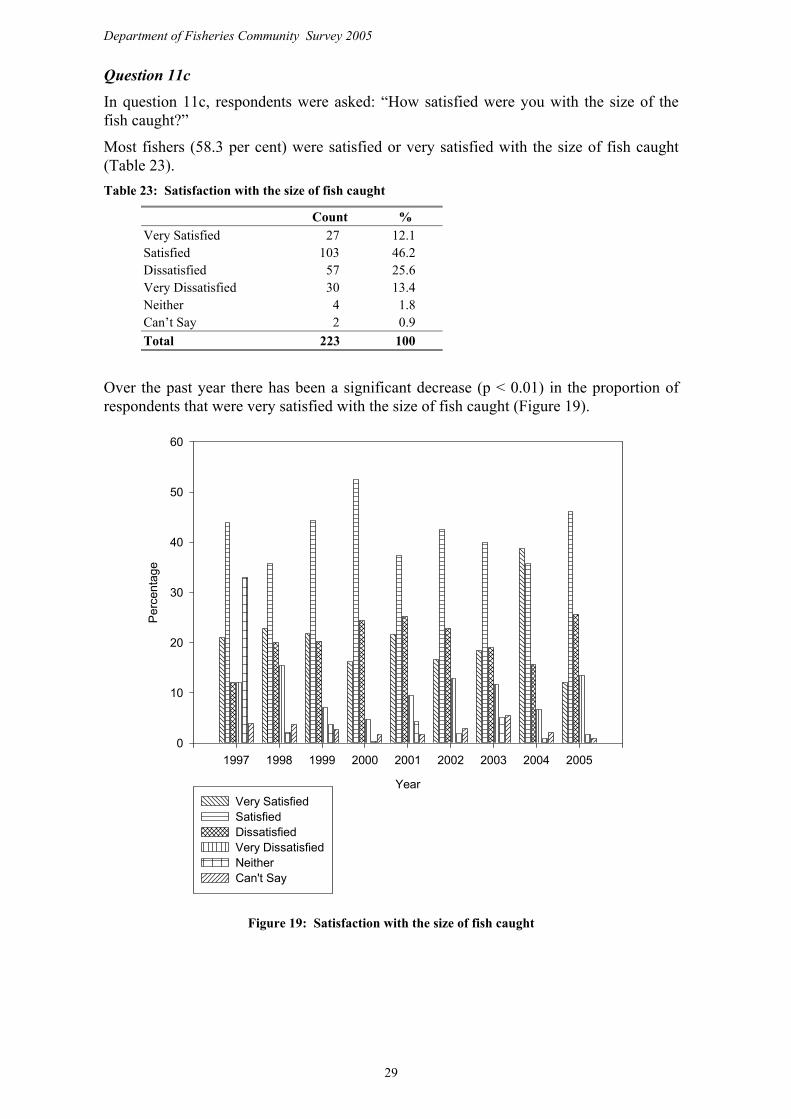
In question 11c, respondents were asked: “How satisfied were you with the size of the fish caught?”
Most fishers (58.3 per cent) were satisfied or very satisfied with the size of fish caught (Table 23). Table 23: Satisfaction with the size of fish caught
Count % Very Satisfied 27 12.1 Satisfied 103 46.2 Dissatisfied 57 25.6 Very Dissatisfied 30 13.4 Neither 4 1.8 Can’t Say 2 0.9 Total 223 100
Over the past year there has been a significant decrease (p < 0.01) in the proportion of respondents that were very satisfied with the size of fish caught (Figure 19).
Year
1997 1998 1999 2000 2001 2002 2003 2004 2005
Per
cent
age
0
10
20
30
40
50
60
Very SatisfiedSatisfiedDissatisfiedVery DissatisfiedNeitherCan't Say
Figure 19: Satisfaction with the size of fish caught
29
Department of Fisheries Community Survey 2005
Question 11d
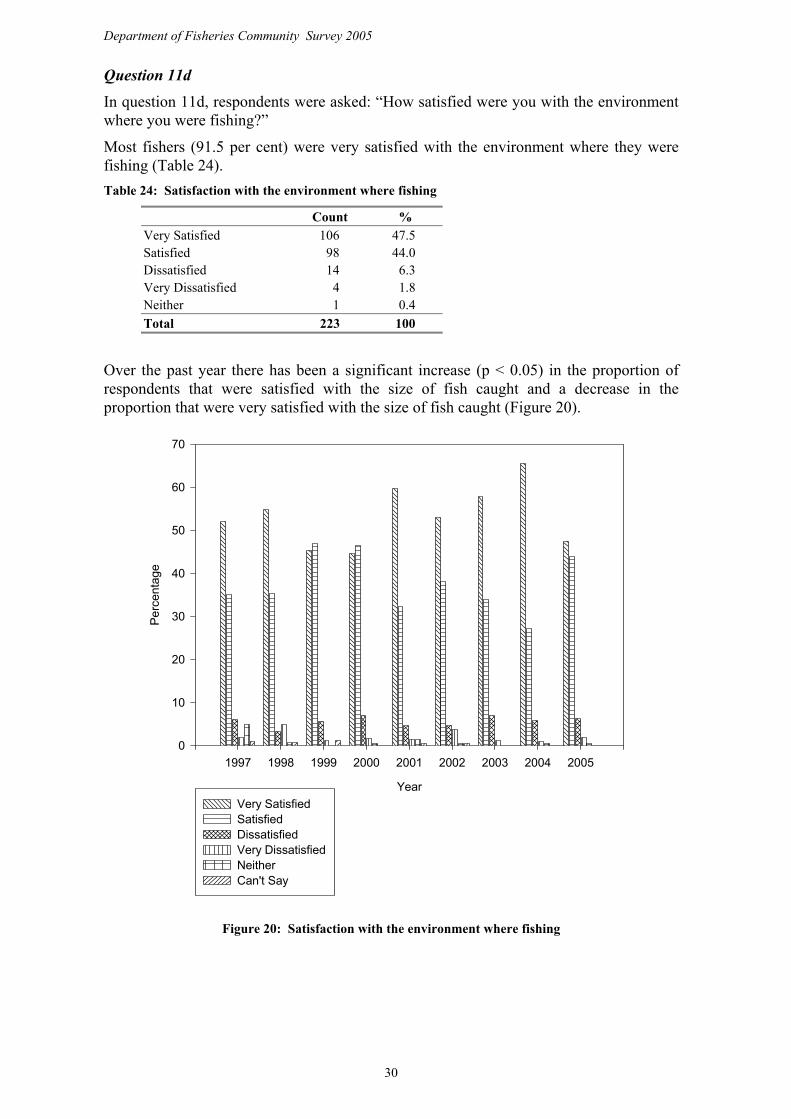
In question 11d, respondents were asked: “How satisfied were you with the environment where you were fishing?”
Most fishers (91.5 per cent) were very satisfied with the environment where they were fishing (Table 24). Table 24: Satisfaction with the environment where fishing
Count % Very Satisfied 106 47.5 Satisfied 98 44.0 Dissatisfied 14 6.3 Very Dissatisfied 4 1.8 Neither 1 0.4 Total 223 100
Over the past year there has been a significant increase (p < 0.05) in the proportion of respondents that were satisfied with the size of fish caught and a decrease in the proportion that were very satisfied with the size of fish caught (Figure 20).
Year
1997 1998 1999 2000 2001 2002 2003 2004 2005
Perc
enta
ge
0
10
20
30
40
50
60
70
Very SatisfiedSatisfiedDissatisfiedVery DissatisfiedNeitherCan't Say
Figure 20: Satisfaction with the environment where fishing
30
Department of Fisheries Community Survey 2005
Question 11e
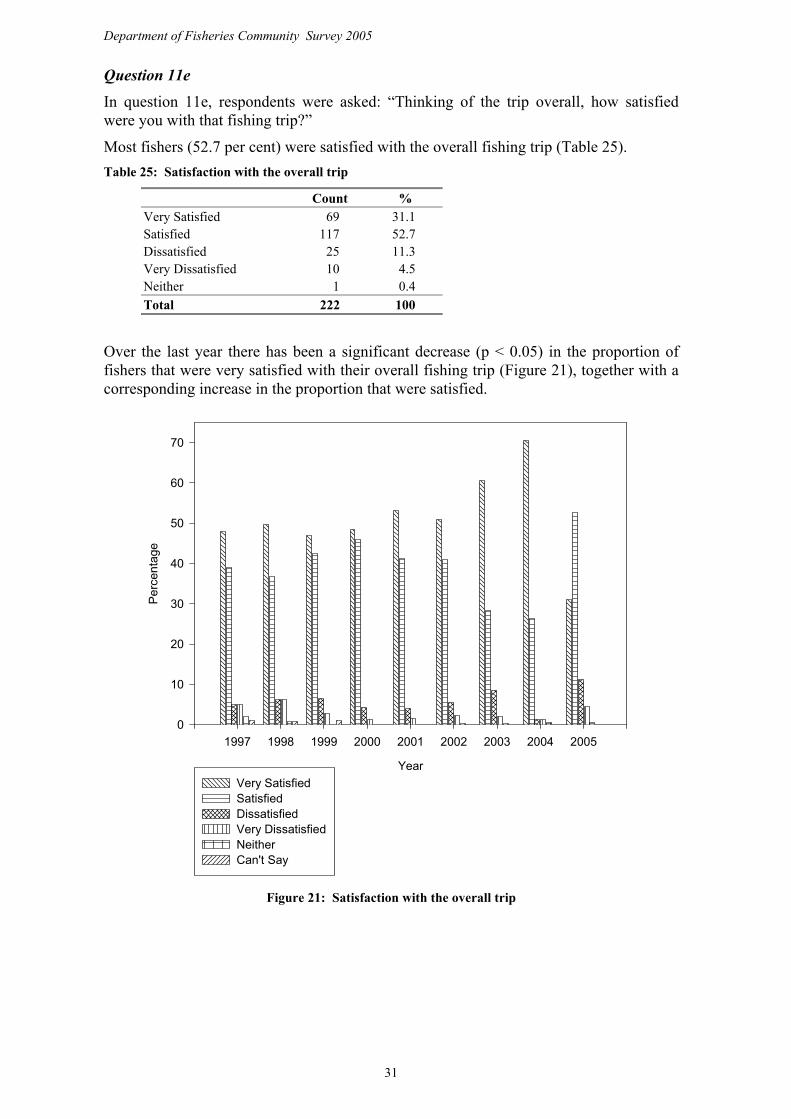
In question 11e, respondents were asked: “Thinking of the trip overall, how satisfied were you with that fishing trip?”
Most fishers (52.7 per cent) were satisfied with the overall fishing trip (Table 25). Table 25: Satisfaction with the overall trip
Count % Very Satisfied 69 31.1 Satisfied 117 52.7 Dissatisfied 25 11.3 Very Dissatisfied 10 4.5 Neither 1 0.4 Total 222 100
Over the last year there has been a significant decrease (p < 0.05) in the proportion of fishers that were very satisfied with their overall fishing trip (Figure 21), together with a corresponding increase in the proportion that were satisfied.
Year
1997 1998 1999 2000 2001 2002 2003 2004 2005
Perc
enta
ge
0
10
20
30
40
50
60
70
Very SatisfiedSatisfiedDissatisfiedVery DissatisfiedNeitherCan't Say
Figure 21: Satisfaction with the overall trip
31

Department of Fisheries Community Survey 2005
32
3.12 Information about recreational fishing
Question 12a
In question 12a, respondents were asked: “Thinking about fishing regulations and other information to do with recreational fishing in W.A…. where do you find out about things to do with fishing?”
Half the fishers asked other fishers (52.2 per cent) about fishing regulations and other information to do with recreational fishing in Western Australia (Table 26). Multiple responses were accepted.
Table 26: Information about fishing
Count % Other fishers 117 52.2 Department of Fisheries brochures / publications 87 38.8 Newspapers 52 23.2 Tackle shops 48 21.4 Other 23 10.3 Fishing magazines 14 6.3 Department of Fisheries internet web site 13 5.8 Other fishing web sites 12 5.4 Department of Fisheries shows / displays 10 4.5 Television 10 4.5 Clubs / associations 7 3.1 Radio 6 2.7 None 4 1.8 Volunteer Fisheries Liaison Officers 2 0.9
Some detail was collected about the ways fishers gain their information. Unfortunately, this information was very sparse.
Some fishers used the Western Angler magazine, the West Australian newspaper, the Sunday Times newspaper, local newspapers and the ABC to gain information about recreational fishing.
Question 12b
In question 12b, respondents were asked: “Which of these is the main way you find out about these things?
Asking other fishers was the main way that a large number of respondents (41.2 per cent) found out about fishing regulations and other information to do with recreational fishing (Table 27).

Department of Fisheries Community Survey 2005
33
Table 27: Main way information about fishing is found
Count % Other fishers 80 41.2 Department of Fisheries brochures / publications 39 20.1 Newspapers 25 12.9 Tackle shops 23 11.9 Other 7 3.6 Department of Fisheries shows / displays 5 2.6 Fishing magazines 4 2.1 Other fishing web sites 4 2.1 Clubs / associations 3 1.5 Department of Fisheries web site 2 1.0 Television 2 1.0 Total 194 100
3.13 Contact with the Department of Fisheries
Question 13a
In question 13a, respondents were asked: “During the past twelve months have you contacted the Department of Fisheries for any reason?”
Only 7.7 per cent of respondents had contacted the Department of Fisheries in the past twelve months (Table 28). Table 28: Contacted the Department of Fisheries
Count % Yes 54 7.7 No 636 91.0 Don’t Know 9 1.3 Total 699 100
Over the past ten years, there has been little change in the percentage of respondents that had contacted the Department of Fisheries (Figure 22).

Department of Fisheries Community Survey 2005
Year
1996 1997 1998 1999 2000 2001 2002 2003 2004 2005
Perc
enta
ge
0
20
40
60
80
100
Yes No Don't Know
Figure 22: Contacted the Department of Fisheries
Question 13b
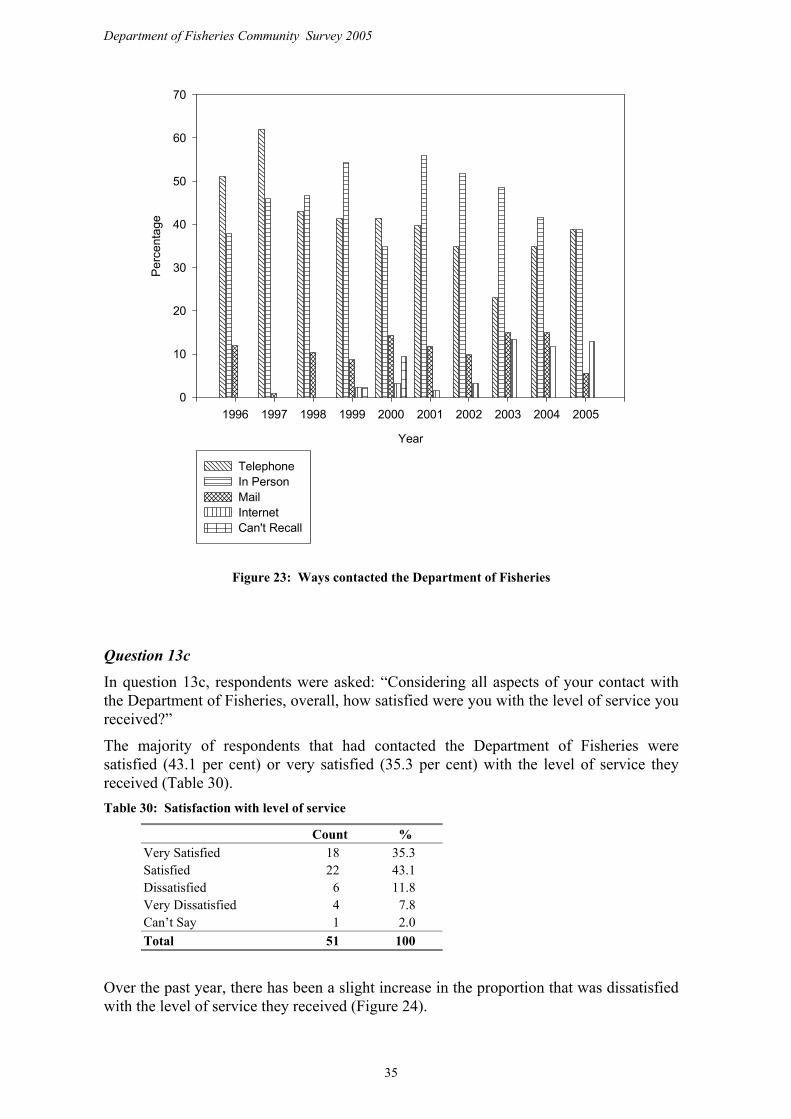
In question 13b, respondents were asked: “How did you make contact with the Department of Fisheries?”
Of the 54 people that contacted the Department of Fisheries in the past twelve months, 38.9 per cent contacted them in person and 38.9 per cent contacted them by telephone (Table 29). Multiple responses were accepted.
Table 29: Ways contacted the Department of Fisheries
Count % In person 21 38.9 Telephone 21 38.9 Internet 7 13.0 Mail 3 5.6 Email 3 5.6
There has been little change in the way respondents have contacted the Department of Fisheries over the past two years (Figure 23).
34
Department of Fisheries Community Survey 2005
Year
1996 1997 1998 1999 2000 2001 2002 2003 2004 2005
Per
cent
age
0
10
20
30
40
50
60
70
Telephone In Person Mail InternetCan't Recall
Figure 23: Ways contacted the Department of Fisheries
Question 13c
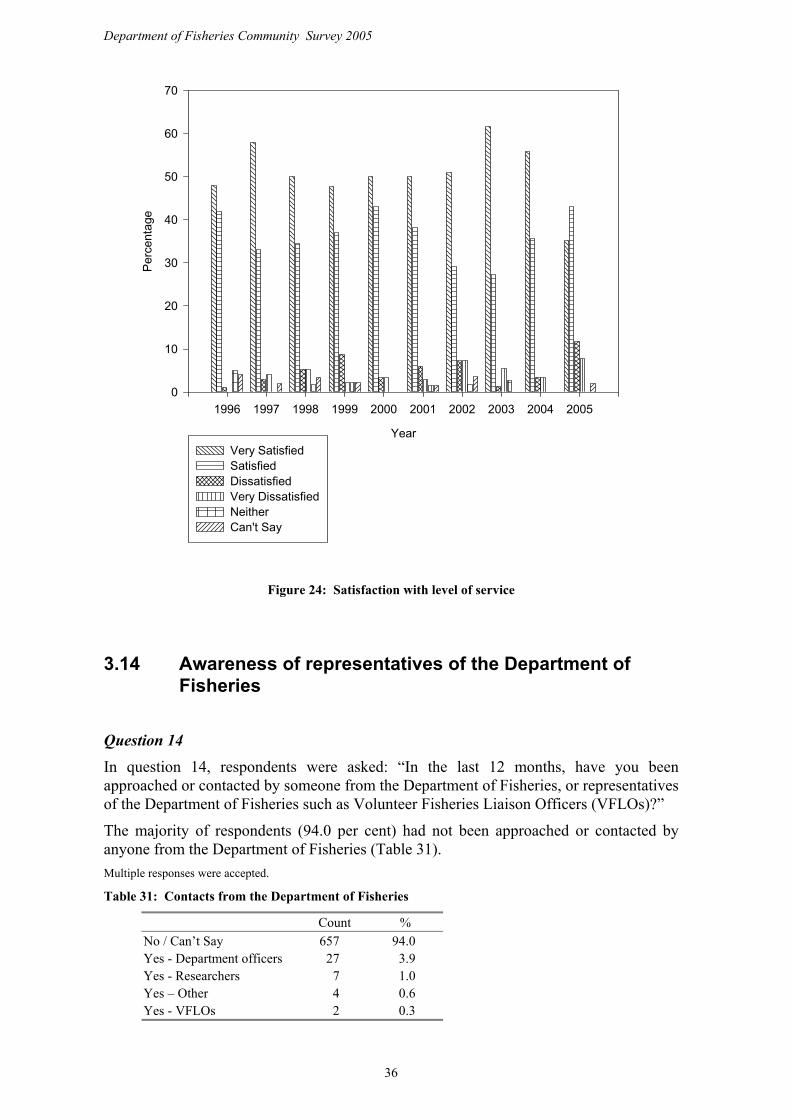
In question 13c, respondents were asked: “Considering all aspects of your contact with the Department of Fisheries, overall, how satisfied were you with the level of service you received?”
The majority of respondents that had contacted the Department of Fisheries were satisfied (43.1 per cent) or very satisfied (35.3 per cent) with the level of service they received (Table 30). Table 30: Satisfaction with level of service
Count % Very Satisfied 18 35.3 Satisfied 22 43.1 Dissatisfied 6 11.8 Very Dissatisfied 4 7.8 Can’t Say 1 2.0 Total 51 100
Over the past year, there has been a slight increase in the proportion that was dissatisfied with the level of service they received (Figure 24).
35
Department of Fisheries Community Survey 2005
Year
1996 1997 1998 1999 2000 2001 2002 2003 2004 2005
Per
cent
age
0
10
20
30
40
50
60
70
Very Satisfied Satisfied Dissatisfied Very DissatisfiedNeither Can't Say
Figure 24: Satisfaction with level of service
3.14 Awareness of representatives of the Department of Fisheries
Question 14
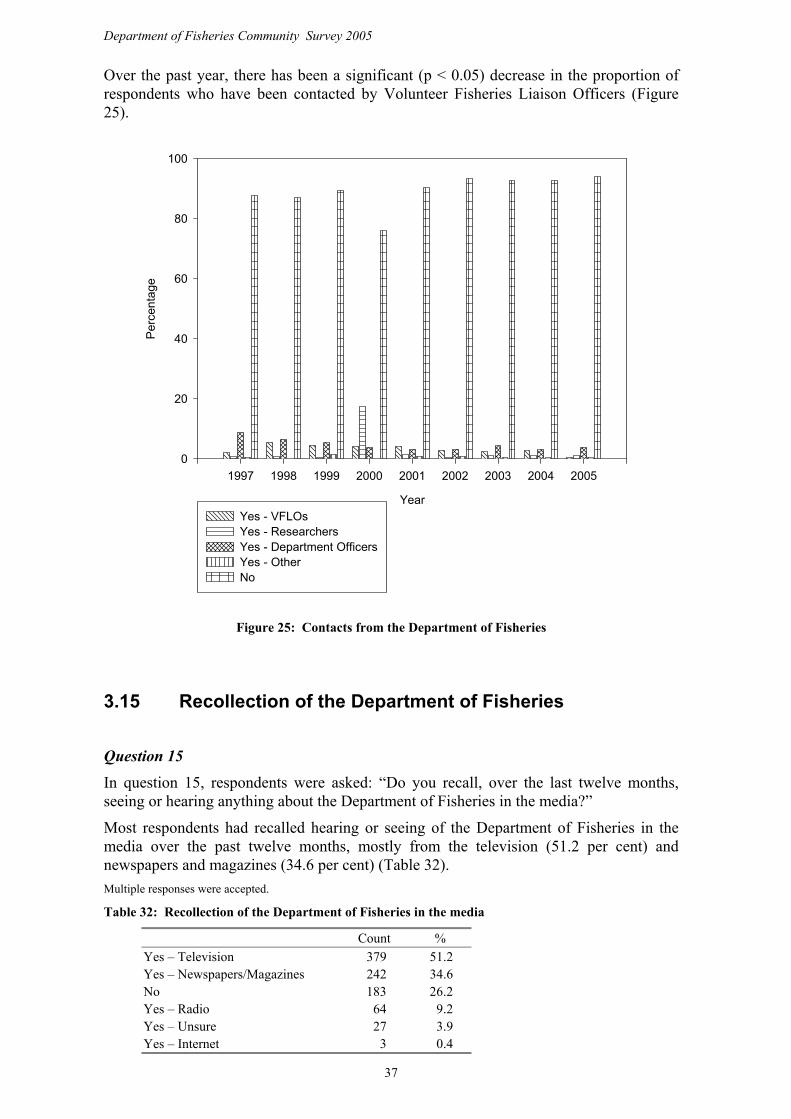
In question 14, respondents were asked: “In the last 12 months, have you been approached or contacted by someone from the Department of Fisheries, or representatives of the Department of Fisheries such as Volunteer Fisheries Liaison Officers (VFLOs)?”
The majority of respondents (94.0 per cent) had not been approached or contacted by anyone from the Department of Fisheries (Table 31). Multiple responses were accepted.
Table 31: Contacts from the Department of Fisheries
Count % No / Can’t Say 657 94.0 Yes - Department officers 27 3.9 Yes - Researchers 7 1.0 Yes – Other 4 0.6 Yes - VFLOs 2 0.3
36
Department of Fisheries Community Survey 2005
Over the past year, there has been a significant (p < 0.05) decrease in the proportion of respondents who have been contacted by Volunteer Fisheries Liaison Officers (Figure 25).
Year
1997 1998 1999 2000 2001 2002 2003 2004 2005
Per
cent
age
0
20
40
60
80
100
Yes - VFLOs Yes - Researchers Yes - Department OfficersYes - Other No
Figure 25: Contacts from the Department of Fisheries
3.15 Recollection of the Department of Fisheries
Question 15
In question 15, respondents were asked: “Do you recall, over the last twelve months, seeing or hearing anything about the Department of Fisheries in the media?”
Most respondents had recalled hearing or seeing of the Department of Fisheries in the media over the past twelve months, mostly from the television (51.2 per cent) and newspapers and magazines (34.6 per cent) (Table 32). Multiple responses were accepted.
Table 32: Recollection of the Department of Fisheries in the media
Count % Yes – Television 379 51.2 Yes – Newspapers/Magazines 242 34.6 No 183 26.2 Yes – Radio 64 9.2 Yes – Unsure 27 3.9 Yes – Internet 3 0.4
37

Department of Fisheries Community Survey 2005
Over the past year, there has been a slight decrease in the proportion that heard on the radio and a slight increase in the proportion of respondents who were unsure where they heard about the Department of Fisheries in the media (Figure 26).
Year
1996 1997 1998 1999 2000 2001 2002 2003 2004 2005
Perc
enta
ge
0
10
20
30
40
50
60
Yes - TelevisionYes - NewspapersYes - RadioYes - InternetYes - UnsureNo
Figure 26: Recollection of the Department of Fisheries or the fishing industry in the media
3.16 Opinion on Aquaculture
Question 16a
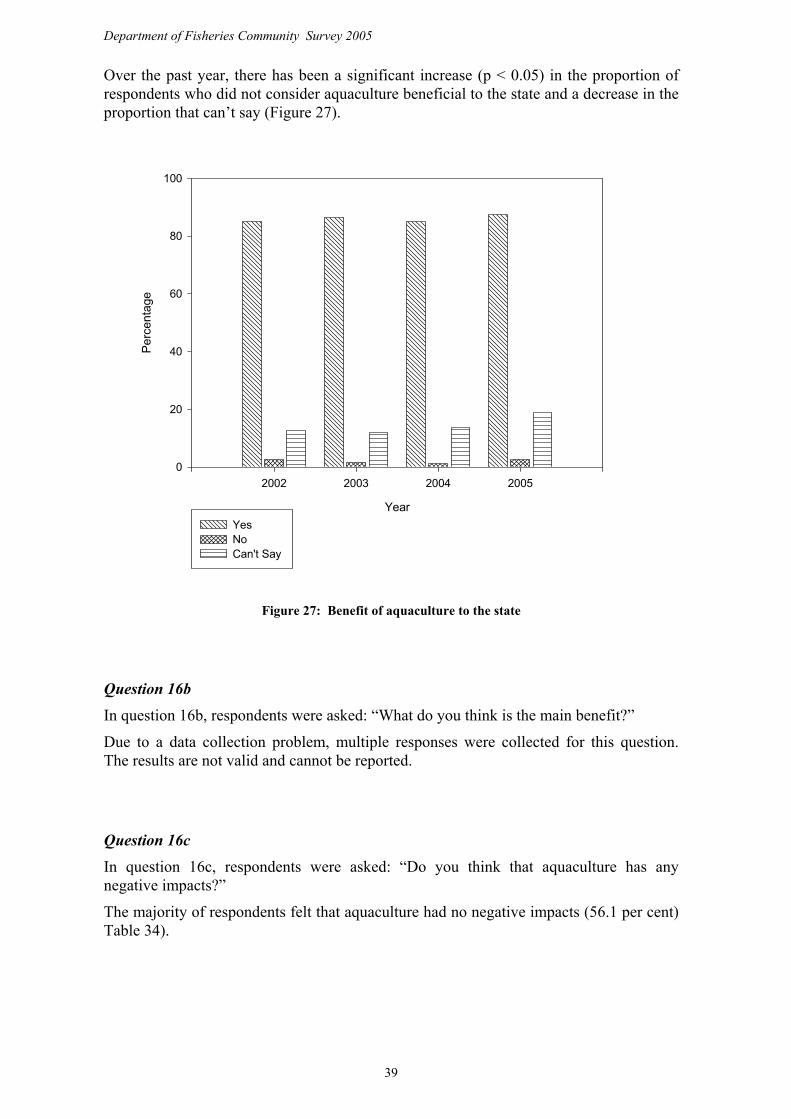
In question 16a, respondents were asked: “Aquaculture is the farming of aquatic plants and animals. Do you feel that aquaculture is beneficial to the state?”
The majority of respondents felt that aquaculture was beneficial to the state (87.3 per cent) (Table 33). Table 33: Benefit of aquaculture to the state
Count % Yes 611 87.3 No 19 2.7 Can’t Say 70 10.0 Total 700 100
38
Department of Fisheries Community Survey 2005
Over the past year, there has been a significant increase (p < 0.05) in the proportion of respondents who did not consider aquaculture beneficial to the state and a decrease in the proportion that can’t say (Figure 27).
Year
2002 2003 2004 2005
Perc
enta
ge
0
20
40
60
80
100
Yes No Can't Say
Figure 27: Benefit of aquaculture to the state
Question 16b
In question 16b, respondents were asked: “What do you think is the main benefit?”
Due to a data collection problem, multiple responses were collected for this question. The results are not valid and cannot be reported.
Question 16c
In question 16c, respondents were asked: “Do you think that aquaculture has any negative impacts?”
The majority of respondents felt that aquaculture had no negative impacts (56.1 per cent) Table 34).
39

Department of Fisheries Community Survey 2005
Table 34: Negative impact of aquaculture
Count % Yes 138 19.9 No 389 56.1 Can’t Say 166 24.0 Total 693 100
Over the past three years, there has been little change in the proportion of respondents who thought that aquaculture had any negative impacts (Figure 28).
Year
2002 2003 2004 2005
Perc
enta
ge
0
10
20
30
40
50
60
70
Yes No Can't Say
Figure 28: Negative impact of aquaculture
Question 16d
In question 16d, respondents were asked: “What do you think is the main negative impact?”
Of the respondents that felt that aquaculture had negative impacts, a large proportion considered that pollution (25.8 per cent) and the risk of disease (22.7 per cent) were the main negative impacts of aquaculture (Table 35).
40

Department of Fisheries Community Survey 2005
41
Table 35: Negative impacts of aquaculture
Count % Risk of disease 30 22.7 Pollution 34 25.8 Competition for space 25 18.9 Other 22 16.7 Can’t Say 15 11.4 Economic viability 6 4.5 Total 132 100
3.17 Demographics
Question 17
In question 17 respondents were asked: “Firstly, into which of these age groups do you fall?”
The age structure of respondents was significantly different (p < 0.05) to the population age structure of Western Australia (Table 36), mostly due to a lower proportion of respondents aged between 25 and 34 and a higher proportion of respondents aged between 55 and 64. Table 36: Age categories
Count % 18 to 19 years 26 3.7 20 to 24 years 43 6.1 25 to 34 years 84 12.0 35 to 44 years 158 22.6 45 to 54 years 137 19.6 55 to 64 years 117 16.7 65 years & over 122 17.4 Unknown 13 1.9 Total 700 100
Question 18
In question 18 respondents were asked: “Which of the following categories best describes what you currently do?”
A large number of respondents (44.7 per cent) were employed in full-time work (Table 37). Some were retired or aged pensioners (21.4 per cent) and others involved in part-time work (16.9 per cent). The activity structure of respondents was significantly different (p < 0.05) to the population activity structure of Western Australia, possibly due to the low number of people doing home duties and the high number of retired and aged pensioner respondents.

Department of Fisheries Community Survey 2005
42
Table 37: Activity structure
Count % Full - time work in a job or business 313 44.7 Part - time or casual work in a job or business 118 16.9 Full - time student 28 4.0 Looking for work 18 2.6 Retired or aged pensioner 150 21.4 Other pensioner 13 1.8 Home duties 53 7.6 Unknown 7 1.0 Total 700 100
Question 19
In question 19 respondents were asked: “What kind of work do you do?”
There were 313 respondents employed in a full or part-time capacity. Of these, 21.7 per cent were professionals, 15.5 per cent were tradespersons and 11.1 per cent were technicians and associated professionals (Table 38). There was no significant difference between the employment structure of respondents and the population employment structure of Western Australia. Table 38: Type of work
Count % Managers 20 5.4 Professionals 80 21.6 Technicians and associated professionals 41 11.0 Tradespersons 57 15.4 Production, plant and transport operators 38 10.2 Clerical, sales and service - advanced, intermediate 60 16.2 Clerical, sales and service – elementary 41 11.1 Labourers, process workers, cleaners etc 29 7.8 Refused 5 1.3 Total 371 100
Question 20
In question 20 respondents were asked: “What is the postcode of the suburb/town in which you live?”
Question 21
In question 21, the sex of the respondent was recorded.

Department of Fisheries Community Survey 2005
43
4.0 REFERENCES
Australian Bureau of Statistics (1987). Recreational Fishing Western Australia. Australian Bureau of Statistics (1998). Western Australian Year Book. Australian Bureau of Statistics (2000). Population by Age and Sex, Western Australia, 30 June 1999. Australian Bureau of Statistics. (2002). Census results. Patterson Market Research (1994). Consultants report for the Department of Fisheries. Reark Research (1996) Community Attitudes Survey. Consultants report for the Department of Fisheries. Reark Research (1997) Community Attitudes Survey. Consultants report for the Department of Fisheries. Right Marketing (1998) The Department of Fisheries Community Survey 1998. Consultants report for the Department of Fisheries. T. Baharthah & N. R. Sumner (1999) Department of Fisheries Community Survey 1999. T. Baharthah & N. R. Sumner (2000) Department of Fisheries Community Survey 2000. T. Baharthah & N. R. Sumner (2001) Department of Fisheries Community Survey 2001. T. Baharthah & N. R. Sumner (2002) Department of Fisheries Community Survey 2002. Fisheries Occasional Paper No. 8. T. Baharthah & N. R. Sumner (2003) Department of Fisheries Community Survey 2003. T. Baharthah (2004) Department of Fisheries Community Survey 2004. Fisheries Occasional Paper No. 14.
Department of Fisheries Community Survey 2005
5.0 APPENDICES
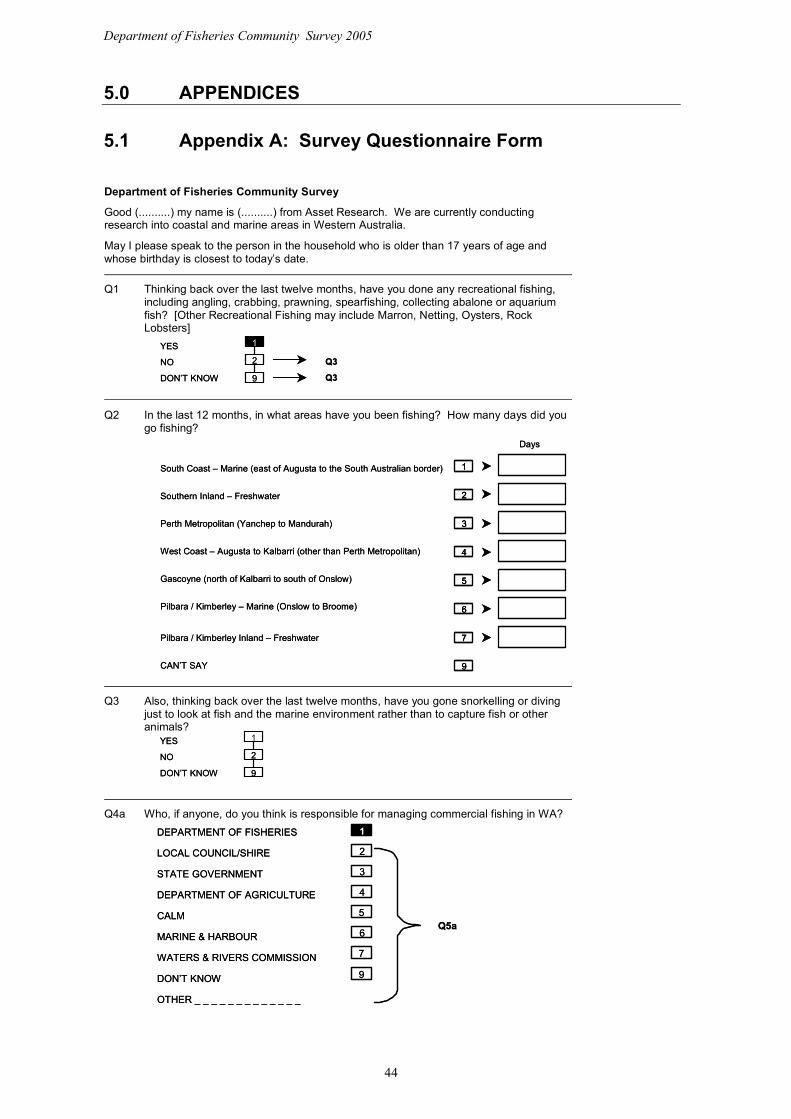
5.1 Appendix A: Survey Questionnaire Form
Department of Fisheries Community Survey
Good (..........) my name is (..........) from Asset Research. We are currently conducting research into coastal and marine areas in Western Australia.
May I please speak to the person in the household who is older than 17 years of age and whose birthday is closest to today’s date.
Q1 Thinking back over the last twelve months, have you done any recreational fishing, including angling, crabbing, prawning, spearfishing, collecting abalone or aquarium fish? [Other Recreational Fishing may include Marron, Netting, Oysters, Rock Lobsters]
YES
NO
DON’T KNOW
1
2 Q3
Q39
YES
NO
DON’T KNOW
1
2 Q3
Q39
Q2 In the last 12 months, in what areas have you been fishing? How many days did you go fishing?
South Coast – Marine (east of Augusta to the South Australian border)
Southern Inland – Freshwater
Perth Metropolitan (Yanchep to Mandurah)
West Coast – Augusta to Kalbarri (other than Perth Metropolitan)
Gascoyne (north of Kalbarri to south of Onslow)
Pilbara / Kimberley – Marine (Onslow to Broome)
Pilbara / Kimberley Inland – Freshwater
CAN’T SAY
1
2
3
4
5
6
7
9
Days
South Coast – Marine (east of Augusta to the South Australian border)
Southern Inland – Freshwater
Perth Metropolitan (Yanchep to Mandurah)
West Coast – Augusta to Kalbarri (other than Perth Metropolitan)
Gascoyne (north of Kalbarri to south of Onslow)
Pilbara / Kimberley – Marine (Onslow to Broome)
Pilbara / Kimberley Inland – Freshwater
CAN’T SAY
11
22
33
44
55
66
77
99
Days
Q3 Also, thinking back over the last twelve months, have you gone snorkelling or diving just to look at fish and the marine environment rather than to capture fish or other animals?
YES
NO
DON’T KNOW
1
2
9
YES
NO
DON’T KNOW
1
2
9
Q4a Who, if anyone, do you think is responsible for managing commercial fishing in WA? DEPARTMENT OF FISHERIES
LOCAL COUNCIL/SHIRE
STATE GOVERNMENT
DEPARTMENT OF AGRICULTURE
CALM
MARINE & HARBOUR
WATERS & RIVERS COMMISSION
DON’T KNOW
OTHER _ _ _ _ _ _ _ _ _ _ _ _ _
1
2
3
4
5
6
7
9
Q5a
DEPARTMENT OF FISHERIES
LOCAL COUNCIL/SHIRE
STATE GOVERNMENT
DEPARTMENT OF AGRICULTURE
CALM
MARINE & HARBOUR
WATERS & RIVERS COMMISSION
DON’T KNOW
OTHER _ _ _ _ _ _ _ _ _ _ _ _ _
1
2
3
4
5
6
7
9
Q5a
44
Department of Fisheries Community Survey 2005
45
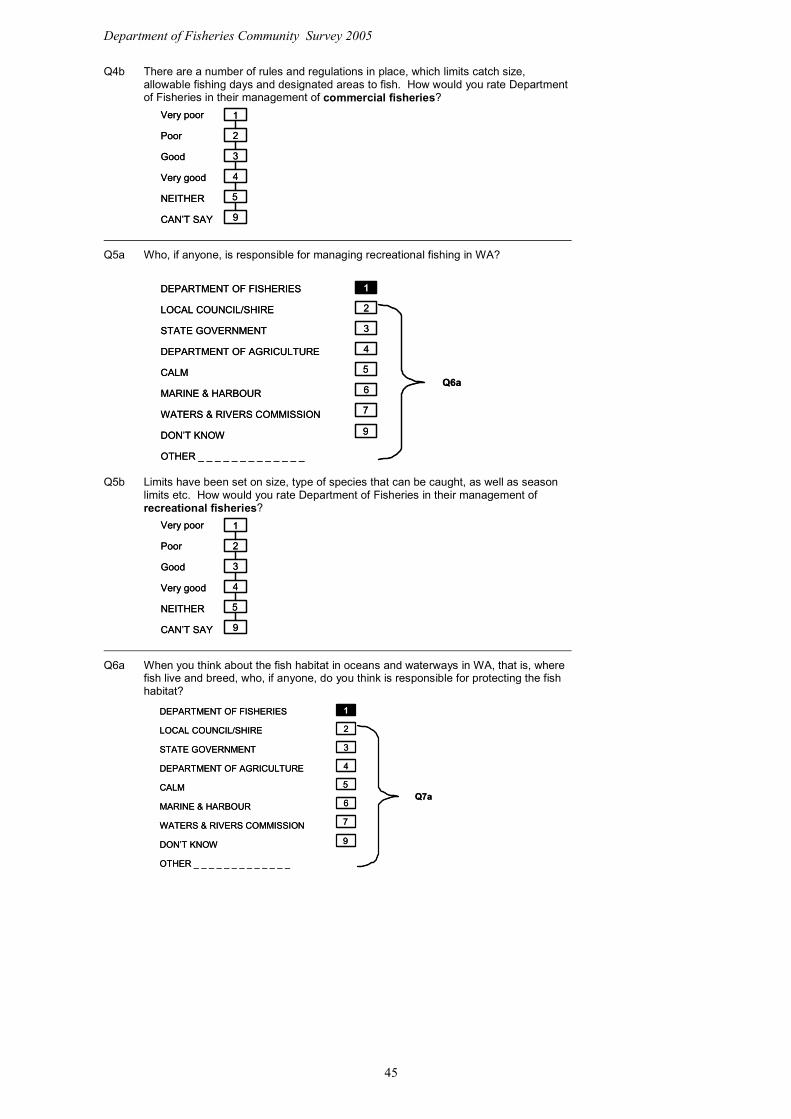
Q4b There are a number of rules and regulations in place, which limits catch size, allowable fishing days and designated areas to fish. How would you rate Department of Fisheries in their management of commercial fisheries?
Very poor
Poor
Good
Very good
NEITHER
CAN’T SAY
1
2
3
4
5
9
Very poor
Poor
Good
Very good
NEITHER
CAN’T SAY
1
2
3
4
5
9
Q5a Who, if anyone, is responsible for managing recreational fishing in WA?
DEPARTMENT OF FISHERIES
LOCAL COUNCIL/SHIRE
STATE GOVERNMENT
DEPARTMENT OF AGRICULTURE
CALM
MARINE & HARBOUR
WATERS & RIVERS COMMISSION
DON’T KNOW
OTHER _ _ _ _ _ _ _ _ _ _ _ _ _
1
2
3
4
5
6
7
9
Q6a
DEPARTMENT OF FISHERIES
LOCAL COUNCIL/SHIRE
STATE GOVERNMENT
DEPARTMENT OF AGRICULTURE
CALM
MARINE & HARBOUR
WATERS & RIVERS COMMISSION
DON’T KNOW
OTHER _ _ _ _ _ _ _ _ _ _ _ _ _
1
2
3
4
5
6
7
9
Q6a
Q5b Limits have been set on size, type of species that can be caught, as well as season limits etc. How would you rate Department of Fisheries in their management of recreational fisheries?
Very poor
Poor
Good
Very good
NEITHER
CAN’T SAY
1
2
3
4
5
9
Very poor
Poor
Good
Very good
NEITHER
CAN’T SAY
1
2
3
4
5
9
Q6a When you think about the fish habitat in oceans and waterways in WA, that is, where fish live and breed, who, if anyone, do you think is responsible for protecting the fish habitat?
DEPARTMENT OF FISHERIES
LOCAL COUNCIL/SHIRE
STATE GOVERNMENT
DEPARTMENT OF AGRICULTURE
CALM
MARINE & HARBOUR
WATERS & RIVERS COMMISSION
DON’T KNOW
OTHER _ _ _ _ _ _ _ _ _ _ _ _ _
1
2
3
4
5
6
7
9
Q7a
DEPARTMENT OF FISHERIES
LOCAL COUNCIL/SHIRE
STATE GOVERNMENT
DEPARTMENT OF AGRICULTURE
CALM
MARINE & HARBOUR
WATERS & RIVERS COMMISSION
DON’T KNOW
OTHER _ _ _ _ _ _ _ _ _ _ _ _ _
1
2
3
4
5
6
7
9
Q7a
Department of Fisheries Community Survey 2005
46
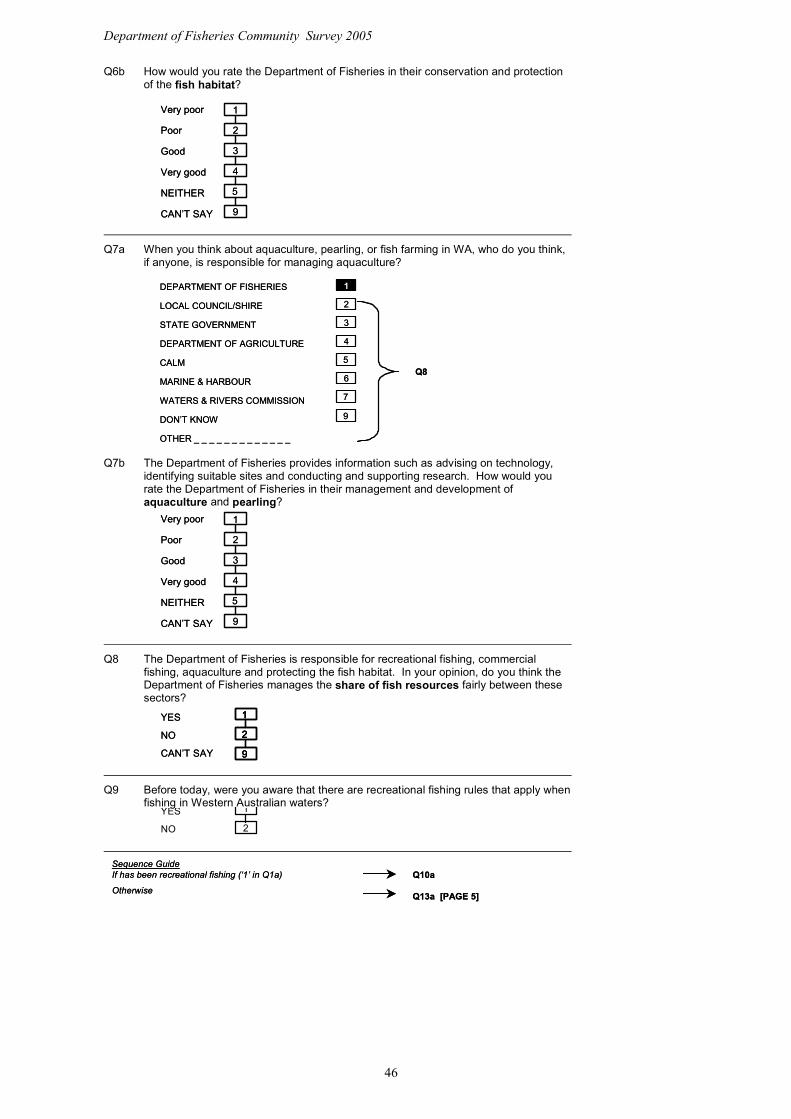
Q6b How would you rate the Department of Fisheries in their conservation and protection of the fish habitat?
Very poor
Poor
Good
Very good
NEITHER
CAN’T SAY
1
2
3
4
5
9
Very poor
Poor
Good
Very good
NEITHER
CAN’T SAY
1
2
3
4
5
9
Q7a When you think about aquaculture, pearling, or fish farming in WA, who do you think, if anyone, is responsible for managing aquaculture?
DEPARTMENT OF FISHERIES
LOCAL COUNCIL/SHIRE
STATE GOVERNMENT
DEPARTMENT OF AGRICULTURE
CALM
MARINE & HARBOUR
WATERS & RIVERS COMMISSION
DON’T KNOW
OTHER _ _ _ _ _ _ _ _ _ _ _ _ _
1
2
3
4
5
6
7
9
Q8
DEPARTMENT OF FISHERIES
LOCAL COUNCIL/SHIRE
STATE GOVERNMENT
DEPARTMENT OF AGRICULTURE
CALM
MARINE & HARBOUR
WATERS & RIVERS COMMISSION
DON’T KNOW
OTHER _ _ _ _ _ _ _ _ _ _ _ _ _
1
2
3
4
5
6
7
9
Q8
Q7b The Department of Fisheries provides information such as advising on technology, identifying suitable sites and conducting and supporting research. How would you rate the Department of Fisheries in their management and development of aquaculture and pearling?
Very poor
Poor
Good
Very good
NEITHER
CAN’T SAY
1
2
3
4
5
9
Very poor
Poor
Good
Very good
NEITHER
CAN’T SAY
1
2
3
4
5
9
Q8 The Department of Fisheries is responsible for recreational fishing, commercial fishing, aquaculture and protecting the fish habitat. In your opinion, do you think the Department of Fisheries manages the share of fish resources fairly between these sectors?
YES
NO
CAN’T SAY
1
2
9
YES
NO
CAN’T SAY
1
2
9
1
2
9
1
2
9
Q9 Before today, were you aware that there are recreational fishing rules that apply when fishing in Western Australian waters?
YES
NO
1
2
Sequence GuideIf has been recreational fishing (‘1’ in Q1a)
Otherwise
Q10a
Q13a [PAGE 5]
Sequence GuideIf has been recreational fishing (‘1’ in Q1a)
Otherwise
Q10a
Q13a [PAGE 5]
Department of Fisheries Community Survey 2005
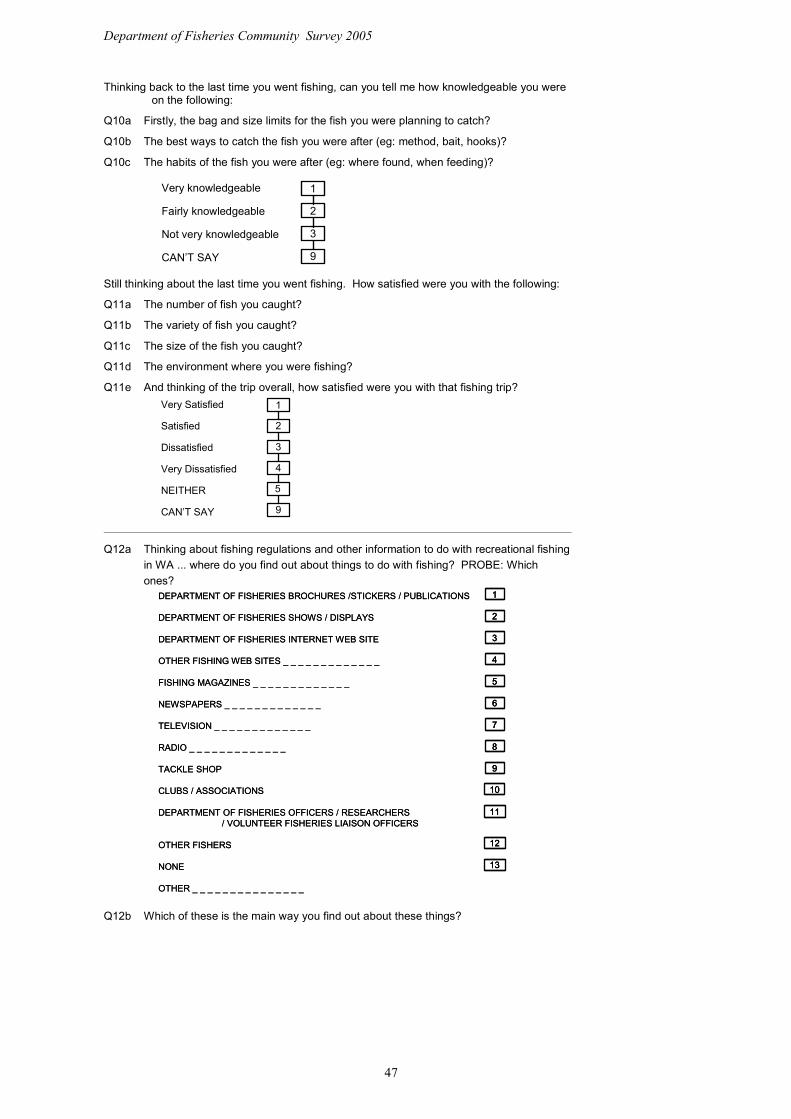
Thinking back to the last time you went fishing, can you tell me how knowledgeable you were
on the following:
Q10a Firstly, the bag and size limits for the fish you were planning to catch?
Q10b The best ways to catch the fish you were after (eg: method, bait, hooks)?
Q10c The habits of the fish you were after (eg: where found, when feeding)?
Very knowledgeable
Fairly knowledgeable
Not very knowledgeable
CAN’T SAY
1
2
3
9
Still thinking about the last time you went fishing. How satisfied were you with the following:
Q11a The number of fish you caught?
Q11b The variety of fish you caught?
Q11c The size of the fish you caught?
Q11d The environment where you were fishing?
Q11e And thinking of the trip overall, how satisfied were you with that fishing trip?
Very Satisfied
Satisfied
Dissatisfied
Very Dissatisfied
NEITHER
CAN’T SAY
1
2
3
4
5
9
Q12a Thinking about fishing regulations and other information to do with recreational fishing in WA ... where do you find out about things to do with fishing? PROBE: Which ones?
DEPARTMENT OF FISHERIES BROCHURES /STICKERS / PUBLICATIONS
DEPARTMENT OF FISHERIES SHOWS / DISPLAYS
DEPARTMENT OF FISHERIES INTERNET WEB SITE
OTHER FISHING WEB SITES _ _ _ _ _ _ _ _ _ _ _ _ _
FISHING MAGAZINES _ _ _ _ _ _ _ _ _ _ _ _ _
NEWSPAPERS _ _ _ _ _ _ _ _ _ _ _ _ _
TELEVISION _ _ _ _ _ _ _ _ _ _ _ _ _
RADIO _ _ _ _ _ _ _ _ _ _ _ _ _
TACKLE SHOP
CLUBS / ASSOCIATIONS
DEPARTMENT OF FISHERIES OFFICERS / RESEARCHERS/ VOLUNTEER FISHERIES LIAISON OFFICERS
OTHER FISHERS
NONE
OTHER _ _ _ _ _ _ _ _ _ _ _ _ _ _ _
1
2
3
4
5
6
7
8
9
10
11
12
13
DEPARTMENT OF FISHERIES BROCHURES /STICKERS / PUBLICATIONS
DEPARTMENT OF FISHERIES SHOWS / DISPLAYS
DEPARTMENT OF FISHERIES INTERNET WEB SITE
OTHER FISHING WEB SITES _ _ _ _ _ _ _ _ _ _ _ _ _
FISHING MAGAZINES _ _ _ _ _ _ _ _ _ _ _ _ _
NEWSPAPERS _ _ _ _ _ _ _ _ _ _ _ _ _
TELEVISION _ _ _ _ _ _ _ _ _ _ _ _ _
RADIO _ _ _ _ _ _ _ _ _ _ _ _ _
TACKLE SHOP
CLUBS / ASSOCIATIONS
DEPARTMENT OF FISHERIES OFFICERS / RESEARCHERS/ VOLUNTEER FISHERIES LIAISON OFFICERS
OTHER FISHERS
NONE
OTHER _ _ _ _ _ _ _ _ _ _ _ _ _ _ _
11
22
33
44
55
66
77
88
99
1010
1111
1212
1313
Q12b Which of these is the main way you find out about these things?
47

Department of Fisheries Community Survey 2005
48
Q13a During the past 12 months have you contacted the Department of Fisheries for any reason?
YES
NO
DON’T KNOW
1
2 Q14
Q149
YES
NO
DON’T KNOW
1
2 Q14
Q149
Q13b How did you make contact with the Department of Fisheries?
Telephone
In person
Fax
Internet
DON’T KNOW / CAN’T RECALL
OTHER _ _ _ _ _ _ _ _ _ _ _ _ _
1
2
3
4
5
6
9
Telephone
In person
Fax
Internet
DON’T KNOW / CAN’T RECALL
OTHER _ _ _ _ _ _ _ _ _ _ _ _ _
1
2
3
4
5
66
99
Q13c Considering all aspects of your contact with the Department of Fisheries, overall, how satisfied were you with the level of service you received?
Very Satisfied
Satisfied
Dissatisfied
Very Dissatisfied
NEITHER
DON’T KNOW
NOT RELEVANT
1
2
3
4
5
9
10
Q14 In the last 12 months, have you been approached or contacted by someone from Department of Fisheries, or representatives of Department of Fisheries such as Volunteer Fisheries Liaison Officers?
YES - VFLO’s (Yellow Shirts)
YES - Researchers (Red Shirts)
YES - Department officers (Uniforms)
YES - OTHER _ _ _ _ _ _ _ _
NO / CAN’T SAY
1
2
3
9
YES - VFLO’s (Yellow Shirts)
YES - Researchers (Red Shirts)
YES - Department officers (Uniforms)
YES - OTHER _ _ _ _ _ _ _ _
NO / CAN’T SAY
1
2
3
9
Q15 Do you recall over the last twelve months seeing or hearing anything about the Department of Fisheries in the media?
9
YES - TV
YES - Newspapers/Magazines
YES - Radio
YES - UNSURE WHERE
NO / UNSURE
1
2
3
5
YES - Internet 4
9
YES - TV
YES - Newspapers/Magazines
YES - Radio
YES - UNSURE WHERE
NO / UNSURE
1
2
3
5
YES - Internet 4
YES - TV
YES - Newspapers/Magazines
YES - Radio
YES - UNSURE WHERE
NO / UNSURE
1
2
3
5
YES - Internet 4

Department of Fisheries Community Survey 2005
Q16a Aquaculture is the farming of aquatic plants and animals. Do you feel that aquaculture is beneficial to the state?
YES
NO
DON’T KNOW
1
2 Q16c
Q16c9
YES
NO
DON’T KNOW
1
2 Q16c
Q16c9 Q16b What do you think is the main benefit of aquaculture?
Relieves pressure on wild fish stocks
Provides fresh seafood
Provides consumers with greater range and availability of seafood
Provides regional employment and economic development
DON’T KNOW
OTHER _ _ _ _ _ _ _ _ _ _ _ _ _
1
2
3
4
9
Relieves pressure on wild fish stocks
Provides fresh seafood
Provides consumers with greater range and availability of seafood
Provides regional employment and economic development
DON’T KNOW
OTHER _ _ _ _ _ _ _ _ _ _ _ _ _
1
2
3
4
9
Q16c Do you feel that aquaculture has any negative impacts to the state?
YES
NO
DON’T KNOW
1
2 Q17
Q179
YES
NO
DON’T KNOW
1
2 Q17
Q179
Q16d What do you think is the main negative impact?
Risk of disease
Pollution
Competition for space
Economic viability
OTHER _ _ _ _ _ _ _ _ _ _ _ _ _
1
2
3
4
DON’T KNOW 9
Risk of disease
Pollution
Competition for space
Economic viability
OTHER _ _ _ _ _ _ _ _ _ _ _ _ _
1
2
3
4
DON’T KNOW 9
Finally to make sure we’ve spoken to a cross section of people I would like to ask you some questions about yourself.
Q17 Firstly, into which of these age groups do you fall? 18 to 19 years
20 to 24 years
25 to 34 years
35 to 44 years
45 to 54 years
55 to 64 years
65 years & over
REFUSED
1
2
3
4
5
6
7
8
Q18 Which of the following categories best describes what you currently do?
Full - time work in a job or business
Part - time work in a job or business
Full - time student
Looking for work
Retired or aged pensioner
Other pensioner
Home duties
OTHER _ _ _ _ _ _ _ _ _ _ _ _ _
1
2
3
4
5
6
7
Q20
Full - time work in a job or business
Part - time work in a job or business
Full - time student
Looking for work
Retired or aged pensioner
Other pensioner
Home duties
OTHER _ _ _ _ _ _ _ _ _ _ _ _ _
1
2
3
4
5
6
7
Q20
49

Department of Fisheries Community Survey 2005
50
Q 19 What kind of work do you do? Managers
Professionals
Technicians and associated professionals
Tradespersons
Production, plant and transport operators
Clerical, sales and service - advanced, intermediate
Clerical, sales and service - elementary
Labourers, process workers, cleaners etc.
OTHER _ _ _ _ _ _ _ _ _ _ _ _ _
1
2
3
4
5
6
7
8
W
ould you mind telling me your first name?
(Just in case my supervisor wants to check that the work was done properly.)
ECORD NAME ON FORM
E
SEX
R
Q20 POSTCO
D
Q21
MALE
FEMALE
1
2 END
hank you for your time!
TAMP YOUR NAME ON THE TOP LEFT HAND CORNER. ENTER SAMPLE NUMBER IN THE RIGHT HAND ORNER.
T
SC

Department of Fisheries Community Survey 2005
5.2 Appendix B: Survey Answer Form Department of Fisheries Community Survey 2005 Respondent Name:_ _ _ _ _ _ _ _ _ _ _
M F
Q1 1 2 9 Q12a 1 2 3
Q2 1 4
2 5
3 6
4 7
5 8
6 9 10 11 12 13
7 9 OTHER
Q3 1 2 9
Q4a 1 2 3 4 5 6 7 9 Q12b
OTHER Q13a 1 2 9
Q4b 1 2 3 4 5 9 Q13b 1 2 3 4 5 6 9
Q5a 1 2 3 4 5 6 7 9 OTHER
OTHER Q13c 1 2 3 4 5 9 10
Q5b 1 2 3 4 5 9 Q14 1 2 3 9
Q6a 1 2 3 4 5 6 7 9 OTHER
OTHER Q15 1 2 3 4 5 9
Q6b 1 2 3 4 5 9 Q16a 1 2 9
Q7a 1 2 3 4 5 6 7 9 Q16b 1 2 3 4 9
OTHER Q16c 1 2 9
Q7b 1 2 3 4 5 9 Q16d 1 2 3 4 9
Q8 1 2 9 OTHER
Q9 1 2 Q17 1 2 3 4 5 6 7 8
Q10a 1 2 3 9 Q18 1 2 3 4 5 6 7
Q10b 1 2 3 9 OTHER
Q10c 1 2 3 9 Q19 1 2 3 4 5 6 7 8
Q11a 1 2 3 4 5 9 OTHER
Q11b 1 2 3 4 5 9
Q11c 1 2 3 4 5 9 Respondent Name:
Q11d 1 2 3 4 5 9
Q11e 1 2 3 4 5 9
Sex
Postcode
Sample No
Fully Responded 1 Interviewer Name
Part Refusal 3
Response Report
51