fisheries centre - sea around us · principe depends for its food security. i. ntroduction. sao...
TRANSCRIPT
Fisheries Centre
The University of British Columbia
Working Paper Series
Working Paper #2015 - 67
Fisheries of Sao Tome and Principe, a catch reconstruction (1950-2010)
Dyhia Belhabib
Year: 2015
Email: [email protected]
This working paper is made available by the Fisheries Centre, University of British Columbia, Vancouver, BC, V6T 1Z4, Canada.

FISHERIES OF SAO TOME AND PRINCIPE, A CATCH RECONSTRUCTION (1950-2010)
Dyhia Belhabib
Sea Around Us, Fisheries Centre, University of British Columbia, 2202 Main Mall, Vancouver, BC, V6T 1Z4, Canada
ABSTRACT
Sao Tome and Principe is a small island country in West Africa, whose fisheries catches were reconstructed to include small-scale artisanal and subsistence catches and foreign industrial catches. Total catches increased from around 4,500 t in 1950 to around 20,100 t in 1984, fluctuated slightly between then and 2000, before increasing to a peak of around 31,600 t in 2002, then decreasing to around 14,400 t in 2010. Domestic catches were 4 times as high as the data reported to the FAO, while foreign catches, which represented the overwhelming bulk of removals from Sao Tome and Principe’s exclusive economic zone, were dominated by the catches of fleets from the European Union. Although the limited documentation about Sao Tome and Principe fisheries fails to document over-exploitation, declining fish consumption, declining catches and expanding effort suggest overexploitation is likely to occur. If so, this would threaten the very sector upon which the coastal population of Sao Tome and Principe depends for its food security.
INTRODUCTION
Sao Tome and Principe (or: São Tomé e Príncipe in Portuguese), the least populated country of West Africa, is located in the Gulf of Guinea, off the coast of Gabon (Figure 1). As its name indicates, the country is comprised of two islands, Sao Tome and Principe, separated by some 140 km.
The islands of Sao Tome and Principe were uninhabited before they were discovered by Portuguese mariners; the first settlers from Portugal found land suitable for agriculture on these islands, particularly for sugarcane planting. The extensive exploitation of sugar required bringing in a large number of slaves from the African mainland, but after the Dutch took over the colony in the 16th century, sugar production declined and the islands became the transit point for the transatlantic slave trade. The economy shifted to coffee and cocoa production in the early 19th century, mainly by Portuguese companies, and within a few years Sao Tome and Principe became the world’s largest producer of cocoa, still the most important economic activity today.
Historically, it is only in 1951 that Sao Tome and Principe became an overseas province of Portugal. Sao Tome and Principe gained independence from Portugal in 1975 following the 1974 revolution in Portugal. First elections were conducted in 1986 and in 1991 political pluralism began1, followed by a succession of conflicts emanating from newly discovered oil resources. However, since independence, there has been no armed conflict in the country. In fact the army of Sao Tome and Principe is so small that some 300 fishers join it occasionally (U.S. Department of State 1994).
1 http://www.bbc.com/news/world-africa-14093670 [Accessed on 22/04/2014].
1
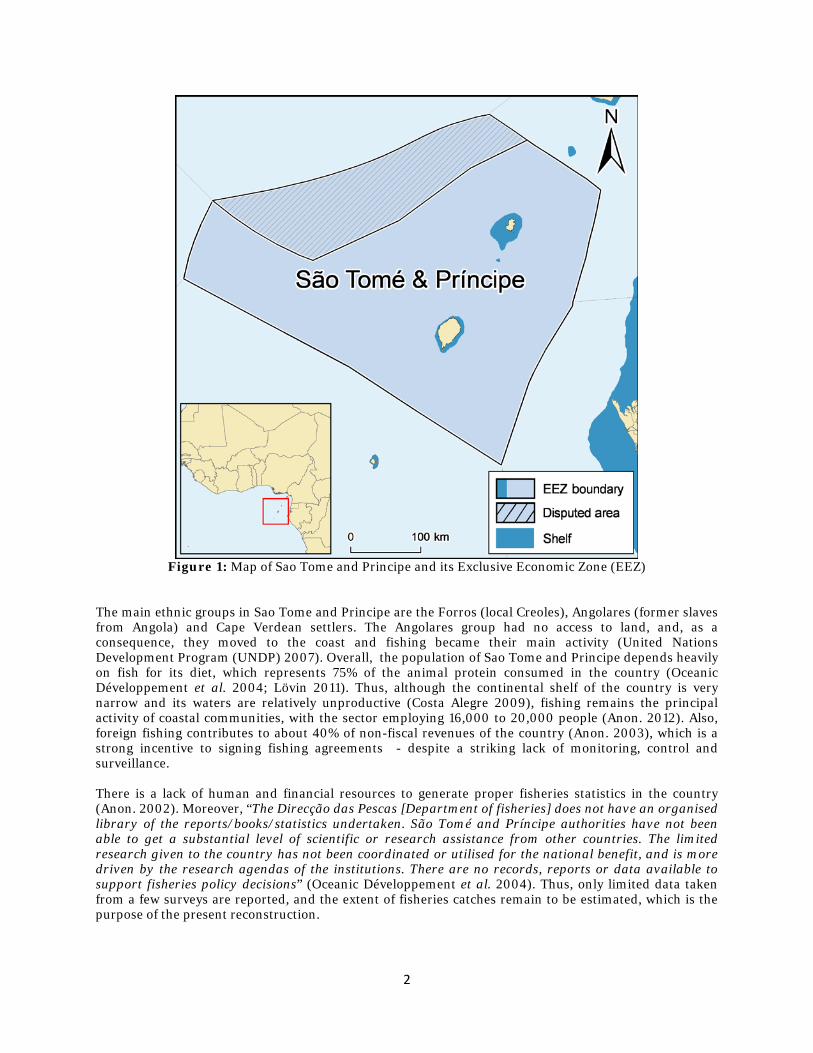
Figure 1: Map of Sao Tome and Principe and its Exclusive Economic Zone (EEZ)
The main ethnic groups in Sao Tome and Principe are the Forros (local Creoles), Angolares (former slaves from Angola) and Cape Verdean settlers. The Angolares group had no access to land, and, as a consequence, they moved to the coast and fishing became their main activity (United Nations Development Program (UNDP) 2007). Overall, the population of Sao Tome and Principe depends heavily on fish for its diet, which represents 75% of the animal protein consumed in the country (Oceanic Développement et al. 2004; Lövin 2011). Thus, although the continental shelf of the country is very narrow and its waters are relatively unproductive (Costa Alegre 2009), fishing remains the principal activity of coastal communities, with the sector employing 16,000 to 20,000 people (Anon. 2012). Also, foreign fishing contributes to about 40% of non-fiscal revenues of the country (Anon. 2003), which is a strong incentive to signing fishing agreements - despite a striking lack of monitoring, control and surveillance. There is a lack of human and financial resources to generate proper fisheries statistics in the country (Anon. 2002). Moreover, “The Direcção das Pescas [Department of fisheries] does not have an organised library of the reports/books/statistics undertaken. São Tomé and Príncipe authorities have not been able to get a substantial level of scientific or research assistance from other countries. The limited research given to the country has not been coordinated or utilised for the national benefit, and is more driven by the research agendas of the institutions. There are no records, reports or data available to support fisheries policy decisions” (Oceanic Développement et al. 2004). Thus, only limited data taken from a few surveys are reported, and the extent of fisheries catches remain to be estimated, which is the purpose of the present reconstruction.
2
METHODS
Total and coastal population
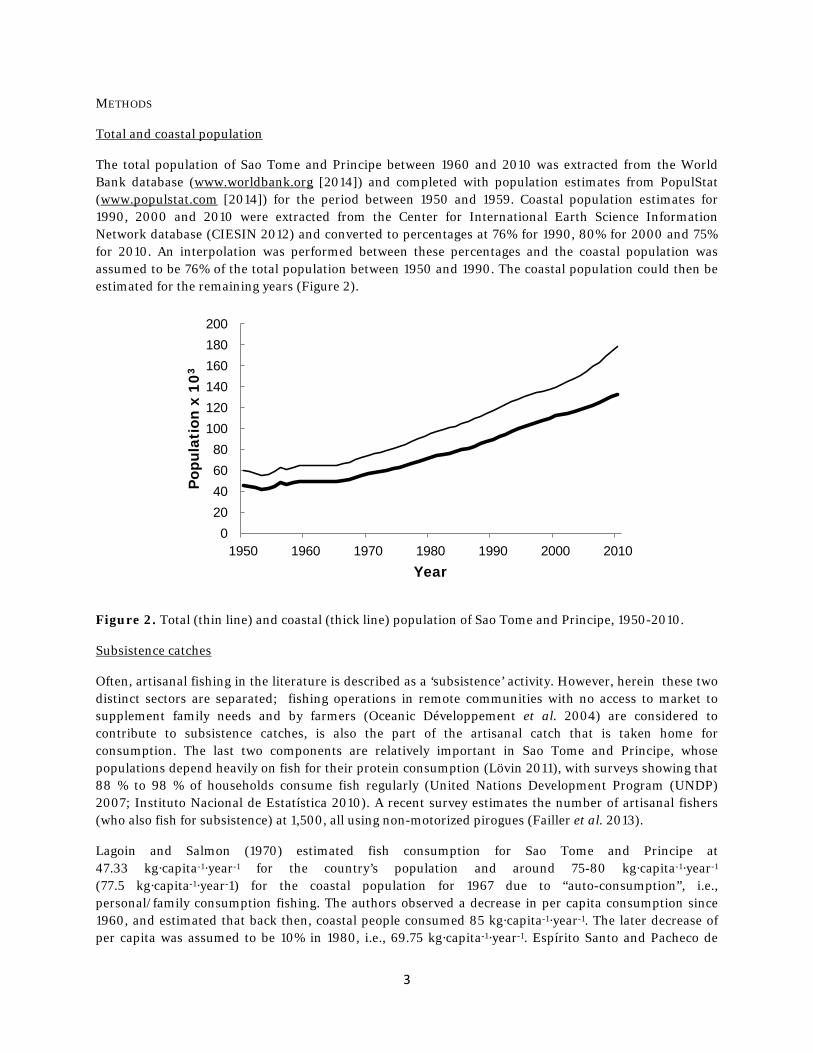
The total population of Sao Tome and Principe between 1960 and 2010 was extracted from the World Bank database (www.worldbank.org [2014]) and completed with population estimates from PopulStat (www.populstat.com [2014]) for the period between 1950 and 1959. Coastal population estimates for 1990, 2000 and 2010 were extracted from the Center for International Earth Science Information Network database (CIESIN 2012) and converted to percentages at 76% for 1990, 80% for 2000 and 75% for 2010. An interpolation was performed between these percentages and the coastal population was assumed to be 76% of the total population between 1950 and 1990. The coastal population could then be estimated for the remaining years (Figure 2).
Figure 2. Total (thin line) and coastal (thick line) population of Sao Tome and Principe, 1950-2010.
Subsistence catches
Often, artisanal fishing in the literature is described as a ‘subsistence’ activity. However, herein these two distinct sectors are separated; fishing operations in remote communities with no access to market to supplement family needs and by farmers (Oceanic Développement et al. 2004) are considered to contribute to subsistence catches, is also the part of the artisanal catch that is taken home for consumption. The last two components are relatively important in Sao Tome and Principe, whose populations depend heavily on fish for their protein consumption (Lövin 2011), with surveys showing that 88 % to 98 % of households consume fish regularly (United Nations Development Program (UNDP) 2007; Instituto Nacional de Estatística 2010). A recent survey estimates the number of artisanal fishers (who also fish for subsistence) at 1,500, all using non-motorized pirogues (Failler et al. 2013).
Lagoin and Salmon (1970) estimated fish consumption for Sao Tome and Principe at 47.33 kg·capita-1·year-1 for the country’s population and around 75-80 kg·capita-1·year-1
(77.5 kg·capita-1·year-1) for the coastal population for 1967 due to “auto-consumption”, i.e., personal/family consumption fishing. The authors observed a decrease in per capita consumption since 1960, and estimated that back then, coastal people consumed 85 kg·capita-1·year-1. The later decrease of per capita was assumed to be 10% in 1980, i.e., 69.75 kg·capita-1·year-1. Espírito Santo and Pacheco de
0
20
40
60
80
100
120
140
160
180
200
1950 1960 1970 1980 1990 2000 2010
Pop
ulat
ion
x 10
3
Year
3
Carvalho (2010) surveyed fish consumption in Sao Tome and Principe and found that 98% of households consumed fish twice a week in the 2000s, with 4.1 kg·household-1·week-1 for 2002 and 6.9 kg·household-1·week-1 for 2008, which, with 4 members per household (Instituto Nacional de Estatística 2010), translates to 53.4 kg·capita-1·year-1 for 2002 and 89.9 kg·capita-1·year-1 for 2008. Similarly, Scopa et al. (2007) surveyed reported a consumption of 50 kg·capita-1·year-1 for 2007 for coastal populations (and 10 kg·capita-1·year-1 for inland populations). Given these large discrepancies (which might be due to the sampling methods and other factors that are unknown to the author), a linear equation was used to adjust for the discrepancies, which led, given the previous estimates to 69.6 kg·capita-1·year-1 for 2007 to 73.5 kg·capita-1·year-1 for 2008. Given the recent patterns of over-exploitation, the latest consumption rate (2008) was adjusted by -10%. The consumption rate in 1950 was assumed to be similar to that of 1960. Then, each estimate of consumption rate was multiplied by the corresponding estimate of coastal population; interpolation between these anchor points yielded total consumption from small-scale fishers and their families. Subsistence catches were assumed as the difference between consumption and artisanal (small-boat) catches between 1950 and 2002, and artisanal small-boat and advanced artisanal catches thereafter given that these catches were likely available to the coastal population as well.
Artisanal catches
Artisanal fishers in Sao Tome and Principe use pirogues between 3.5 and 12 m, with a crew ranging from one to two fishers (Lagoin and Salmon 1970) to 3-4 fishers (Horemans et al. 1994); their motors, when available, are comprised between 6.5 and 15 hp, and they operate from 23 fishing beaches and 12 secondary beaches (Oceanic Développement et al. 2004). Many canoes are still un-motorized (Horemans et al. 1994); however there is an increasing tendency to equip the canoes with motors. Although the government of Sao Tome and Principe considers fiber-glass open deck boats between 12 and 15 m as ‘semi-industrial’ (Oceanic Développement et al. 2004), in other West African countries these can be small enough to be considered artisanal. Indeed Carneiro (2012) suggests that the semi-industrial fleet is basically an artisanal larger fleet that has motors and operates fiberglass boats. For the purpose of this study, these “advanced artisanal” or “offshore artisanal” vessels are qualified as semi-industrial, as they operate mainly off Gabon, Cameroon and in fewer instances Equatorial Guinea to which they are reflagged (Oceanic Développement et al. 2004). These vessels either land in these countries (and sometimes tranship in Sao Tome and Principe), or tranship their catches at sea, in which case, they are unknown (Oceanic Développement et al. 2004). This segment of the fleet is considered part of the domestic fishery of the above mentioned countries (regardless of their origin). In the past, the statistical system relied on “beach chiefs” who would provide fisheries catch statistics of active pirogues (Lagoin and Salmon 1970). These statistics included only beaches were catches were surveyed, and when the “beach chiefs” themselves did not go fishing, in which case catches of other pirogues were not reported. There was no extrapolation factor (Lagoin and Salmon 1970; Horemans et al. 1994). Furthermore, many fishers directly supplying plantations were not reporting their catches, which leads to underestimations (Lagoin and Salmon 1970). The latter estimated that catches might be 2.5 as high as the data officially recorded for artisanal fisheries. More recently, it was observed that no “[no]o regular catch statistics are generated” and estimates were derived from annual surveys (Oceanic Développement et al. 2004). In reality “Direcção das Pescas (or department of fisheries) has a statistical unit, staffed by one person, which is the only structure conducting surveys of the artisanal fisheries. There is in place a statistical data collecting system for artisanal fisheries, although this is only mobilised when funds are available from external projects. The last complete survey was in 1997, with extrapolations based on number of canoes being used to calculate catches since then”. This puts major constraints on fisheries statistics (Anon. 2002). In some best scenarios, it was mentioned that a monthly survey was conducted by the department of fisheries at six beaches in Sao Tome and 2 in Principe, 18-19 days per month to record catch and effort and cost (Pikitch and Doukakis 2005).
4

Data on the number of artisanal fishers and the number of motorized and un-motorized canoes were available from various literature sources for the scattered years as summarized in Table 1. To estimate the number of canoes for 1950, the number of fishers for 1950 was first computed as the product of the coastal population for 1950 and the percentage of fishers over the coastal population for 1964, when the first estimate for the number of fishers was available (Table 1). Then the number of fishers per canoe for 1964 was obtained by dividing the number of fishers by the number of canoes for the same year. Thereafter, the estimated number of fishers for 1950 was divided by the number of fishers per canoe for 1964 (Table 1).
The same approach was applied for 1993, when only the number of fishers was reported, using the number of fishers per canoe of 1995 (Table 1). The estimated number of canoes was then interpolated to complete the effort time series. Lagoin and Salmon (1970) estimated a catch per unit of effort (CPUE) of 1.3 t·boat-1·year-1 for 1970. Pikitch and Doukakis (2005) reported a CPUE averaged at 38.5 kg·boat-1·trip-1 for motorized boats and 7 kg·boat-1·trip-1 for un-motorized boats. The number of trips was assumed to be 100 per year, based on estimates by Horemans et al. (1994) on the average annual versus daily catch of a canoe. Therefore, after weighing the former CPUEs by the number of boats in each category, the resulting CPUE was re-expressed in an annual basis. A CPUE of 1.89 t·boat-1·year-1 for 1995 could be obtained. It was assumed that this CPUE declined by 5% between then and 2010 as fuel prices increased after fuel subsidies had been removed since 1990 (Horemans et al. 1994), as caused by declining catches due to increasing effort (Pikitch and Doukakis 2005). Given the lower motorization rate of 1950, the CPUE was assumed to be 20% lower than in 1970 (Lagoin and Salmon 1970); the CPUE estimates were then interpolated, and artisanal catches were obtained by multiplying the CPUE by the number of canoes.
Advanced artisanal (or artisanal offshore) catches were estimated at 330 t·year-1 in 1967 (Lagoin and Salmon 1970), and reported by Horemans et al. (1994) for the period between 1983 and 1985, and by Anon. (2012) for the period between 2000 and 2010. The first estimate was already adjusted for under-estimation by Lagoin and Salmon (1970), as catches were then believed to be 2.5 times higher than what was then reported. The reported catches were adjusted by adding a conservative value of +50% for the other time periods, with the start of this fishery set in 1958 (Lagoin and Salmon 1970); interpolations then filled the gaps.
The sum of artisanal and advanced (or offshore) artisanal catches represents the total artisanal catch in Sao Tome and Principe.
The species disaggregation provided by Oceanic Développement et al. (2004) was applied to artisanal and subsistence catches.
Industrial foreign tuna catches
Industrial fishing in Sao Tome and Principe is conducted by foreign fleets mostly targeting large pelagic species (Lövin 2011) from the European Union (EU), Japan, Taiwan, the former Soviet Union (in the past) and vessels from the EU reflagged to African countries and Flags of Convenience (FoC) countries more recently (mostly Spanish reflagged to Equatorial Guinea, Gabon, Belize, Curaçao, Panama, Cape Verde and Ghana under private license very recently; (Horemans et al. 1994; Pikitch and Doukakis 2005; Lövin 2011; Failler et al. 2013). The first agreement with the EU was signed around 1984, when the first Japanese longliners started operating in the country’s EEZ (Oceanic Développement et al. 2004; Failler et al. 2013). With the collapse of the Soviet Union (i.e., mostly Russia), all fishing operations for tunas by this country ceased in the waters of Sao Tome and Principe (Horemans et al. 1994). All agreements targeted tunas and license fees were based on the amount of fish these fleets caught, which strongly incentivized under-reporting (Oceanic Développement et al. 2004). The differences between catches reported to the European Commission by the European fleet and those reported to the ICCAT (Failler et al. 2013), despite the legal requirement the EU fleet to properly report catches, suggest a bias in reporting,
5
which under the actual scheme of license fees, raises strong suspicion that the actual fishing effort and catches under the EU-Sao Tome and Principe agreement are substantially greater than implied by the catch records (Oceanic Développement et al. 2004). The Sao Tome and Principe fisheries department “currently has no capacity for inspections and monitoring at sea and no monitoring or inspection activities on EU vessels fishing under the protocol have been conducted” (Oceanic Développement et al. 2004). These issues also apply to other fleets (Japan, Taiwan) as the government of Sao Tome and Principe doesn’t know how much fish is caught overall by the foreign fleets operating under agreement in its waters (Anon. 2009). Lagoin and Salmon (1970) reported that a Portuguese fleet was operating in the waters of Sao Tome in Principe since 1964; it was conservatively assumed that this “fleet” included two vessels for the first four years. This effort was multiplied by the average CPUE obtained by dividing the EU catch per year for 1984, 1985 and 1986 (first reported catches available) (Horemans et al. 1994), by the number of EU boats for the same year (Carneiro 2012), i.e., 108 t·boat-1·year-1. Catches were then interpolated to 0 t in 1984, the last year that the Portuguese licensed vessels did not report catches from Sao Tome and Principe (Oceanic Développement et al. 2004). For the remaining EU fleet, i.e., Spain and France, reported catches of main targeted species were reported for the period between 1984 and 1992 (Horemans et al. 1994) and between 1999 and 2010 (Failler et al. 2013), including albacore tuna (Thunnus alalunga), skipjack (Katsuwonus pelamis), bigeye (Thunnus obesus); interpolations were used to fill the gaps. Other species are caught but not reported or included in the previous estimated catch, such as blue sharks (Prionace glauca), swordfish (Xiphias gladius), Atlantic blue marlin (Makaira nigricans), Mako shark (Isurus oxyrinchus) and sailfish (Istiophorus albicans). Failler et al. (2013) provided the percentage contribution of each taxon to catches between 2006 and 2010. The percentages were assumed constant between 1964 and 2006 and applied these to EU catches to complete the estimate. The former Soviet Union (mainly Russia) was assumed to have started fishing in the EEZ of Sao Tome and Principe in 1968 when a number of boats for “miscellaneous fleets” were reported by Lagoin and Salmon (1970); their catch were interpolated between then and the first reported catches (Horemans et al. 1994). Catches by Russia were set at zero after 1992 as no agreement was reported between Sao Tome and Principe and Russia since then. Around 4 Chinese boats were operating in the EEZ in 2003 (Oceanic Développement et al. 2004) and assumed constant between then and 2010. These Chinese tuna were assumed to have the same fishing capacity than the EU boats. Their annual CPUE was estimated via the EU boats, by dividing their estimated catch (Failler et al. 2013) by the reported active EU effort (Oceanic Développement et al. 2004; Costa Alegre 2009; Carneiro 2012) between 2003 and 2010, then multiplying by the number of Chinese vessels. The number of Japanese (25%) and Taiwanese vessels (75%) were reported for the period between 2000 and 2003 (Costa Alegre 2009), assumed constant thereafter. They were multiplied the number of boats by the CPUE of the EU fleet, assuming a similar profile, then allocated as 75% of catches to Taiwan and 25% to Japan (Oceanic Développement et al. 2004). Japan started operating in the waters of Sao Tome and Principe in 1989 (Failler et al. 2013); thus, , their catches were interpolated between zero then and the first estimated catch in 2000. Other by-catch of lower commercial value of minor tunas and undersized fish are caught by these fleet, but landed in Abidjan (Côte d’Ivoire), including smaller tunas such as skipjack and bullet tuna (Auxis rochei rochei), yellowfin (Thunnus albacares), bigeye, little tunny (Euthynnus alletteratus) and undersized species of Atlantic blue marlin, sailfish, wahoo (Acanthocybium solandri), dolphinfish (Coryphaena hippurus), barracudas (Sphyraena barracuda), triggerfish (Balistes capriscus) and various sharks (Chavance et al. 2011). Belhabib and Pauly (2014) estimated the amount of “faux poissons” landed in Abidjan by these fleets as a proportion of species landed since the activity began. These percentages were applied to each fleet and the “faux poissons” catches taken from the waters of Sao Tome and Principe and landed in Abidjan were estamated. The targeted species were identified using the catch data reported by Oceanic Développement et al. (2004) between 1991 and 2000 and by Failler et al. (2013) thereafter.
6
RESULTS
Subsistence catches
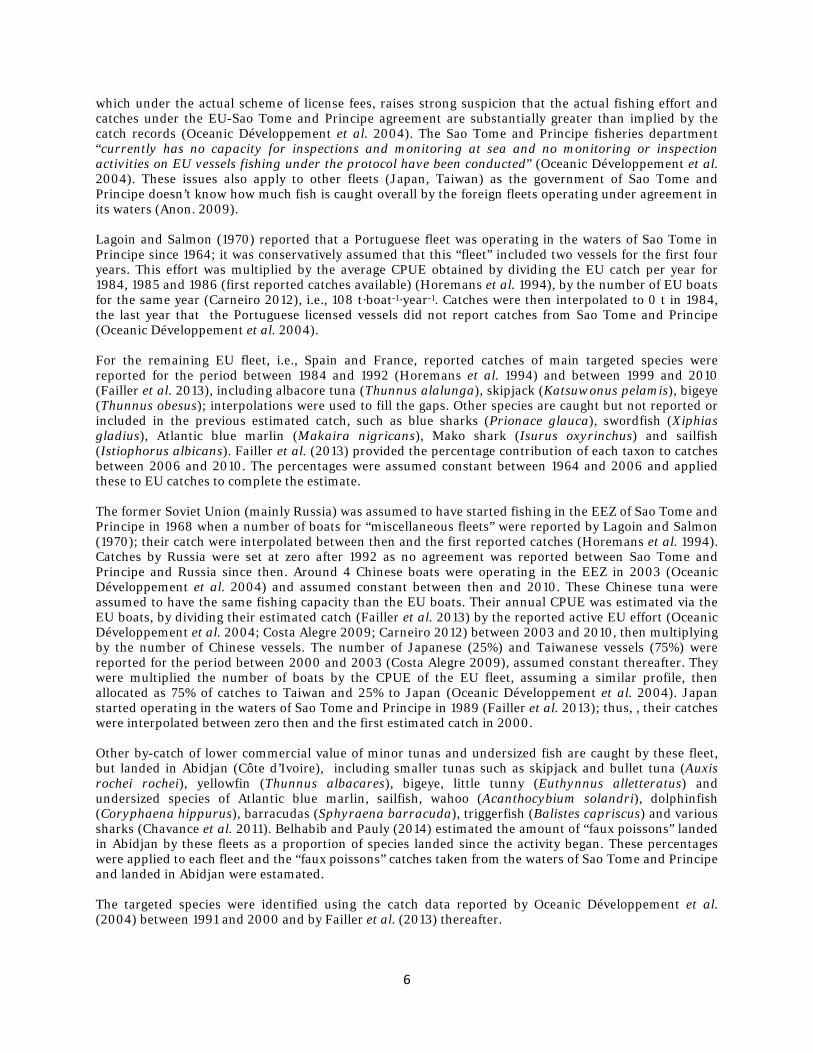
Subsistence catches increased declined slowly from around 2,400 t in 1950 to their historical minimum of 1,500 t in 2002, before increasing to a peak of 3,700 t in 2007, and then slightly declined to around 3,200 t in 2010 (Figure 3).
Figure 3. Total reconstructed subsistence catches from Sao Tome and Principe, 1950-2010.
Artisanal catches
Artisanal (small-canoe) catches increased gradually from around 1,500 t in 1950 to a peak of around 4,700 t in in 2002, around which catches fluctuated thereafter with the changes in the number of boats (Figure 4). Advanced artisanal (large-canoe) catches increased from low levels in 1957 to a peak of 3,800 t in 1984, decreased to 960 t in in 2004, and then increased slightly to around 1,700 t in 2010 (Figure 4). Total artisanal catches, i.e., the sum of artisanal and advanced artisanal catches, increased from around 1,500 t in 1950 to a peak of 6,900 t in 1984 and then decreased slightly to remain at around 6,000 t on average in the late 2000s (Figure 4).
0
1
2
3
4
1950 1960 1970 1980 1990 2000 2010
Cat
ch (
t x
103 )
Year
7

Figure 4. Total reconstructed artisanal and advanced artisanal (offshore artisanal) catches in Sao Tome and Principe, 1950-2010.
Industrial catches
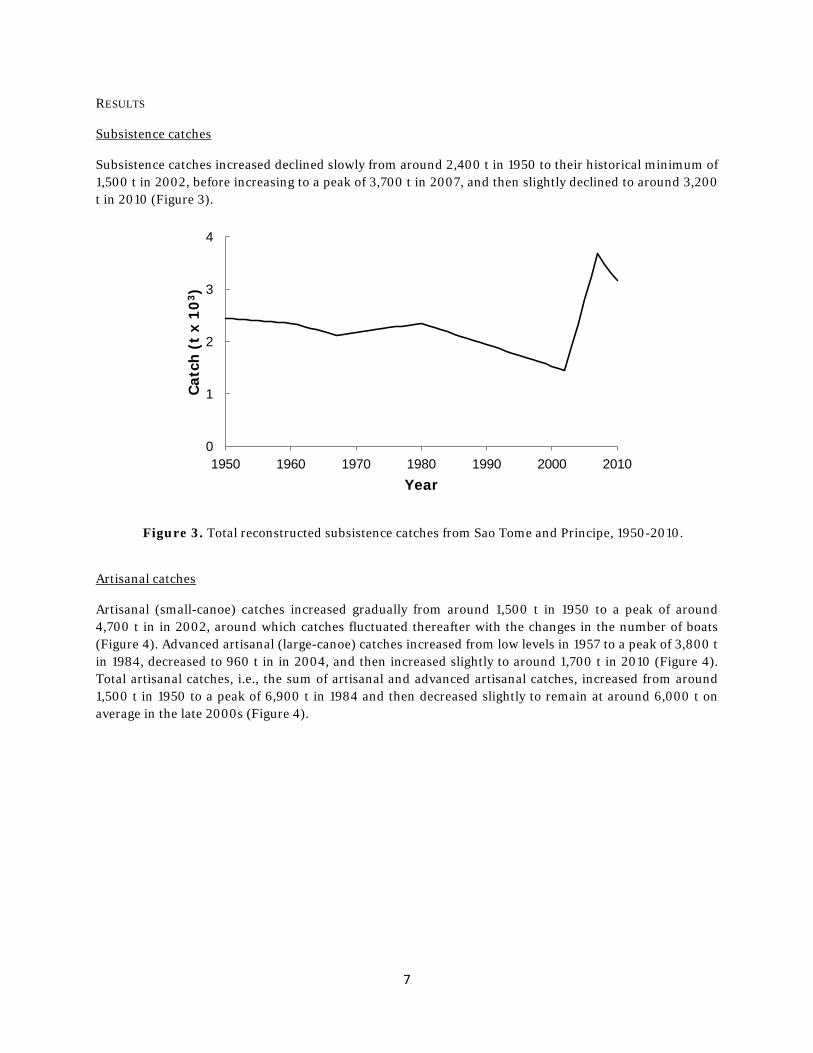
Industrial catches remained at low levels between 1964 and 1983, at around 400 t·year-1 on average all taken by Portuguese fleets, before increasing to 6,600 t in 1984 when the first agreement with the EU was signed (Figure 5a). Catches increased slightly to 7,700 t in 2001 before peaking at 20,700 t in 2002 and then 18,900 t in 2005, to decrease to less than 550 t in 2010, likely driven by the decreasing effort (Figure 5a). Industrial catches were primarily Portuguese prior to the first agreement with the EU, then catches by Spain and France dominated; more recently Chinese catches increased (Figure 5a). The contribution of target species catches to total tuna catches decreased over time since the introduction of the EU-Sao Tome and Principe fishing agreements, while by-catch increased and remained at constant levels since then (Figure 5b). On the other hand, “faux poissons” catches and contribution to total tuna catch (in %) increased over time, these catches being likely landed in Abidjan and not reported.
0
1
2
3
4
5
6
7
8
1950 1960 1970 1980 1990 2000 2010
Cat
ch (
t x
103 )
Year
Artisanal
Advanced artisanal
8
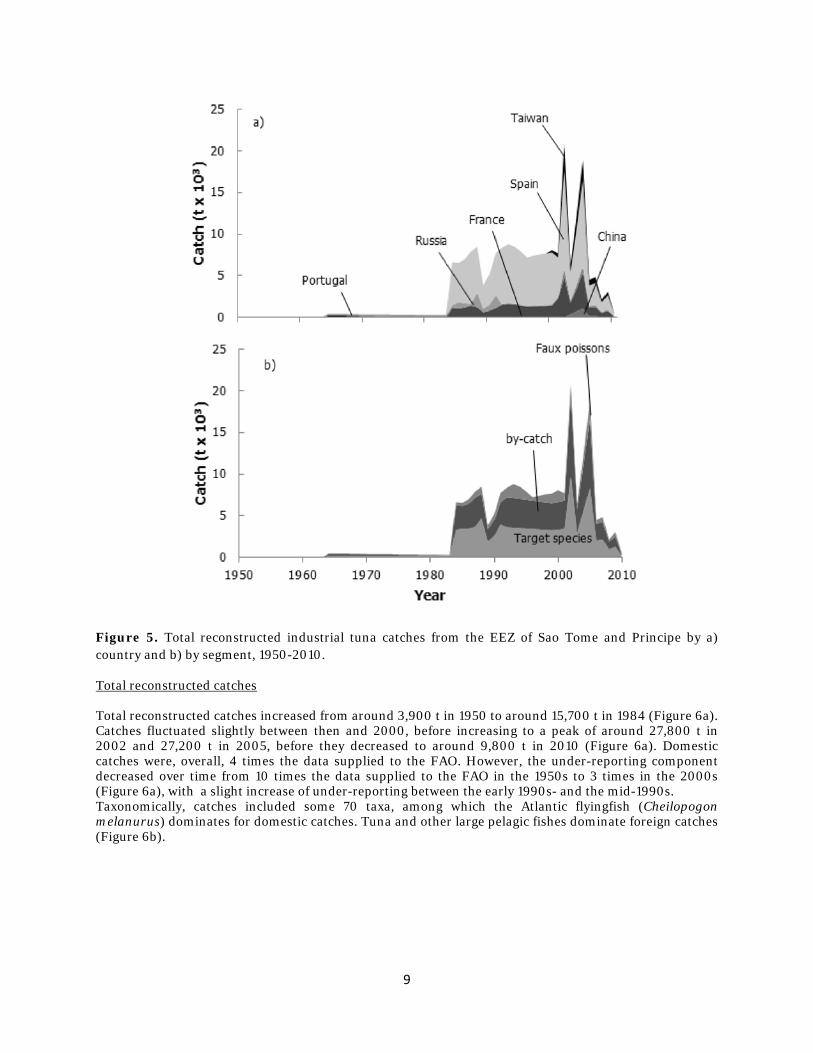
Figure 5. Total reconstructed industrial tuna catches from the EEZ of Sao Tome and Principe by a) country and b) by segment, 1950-2010.
Total reconstructed catches Total reconstructed catches increased from around 3,900 t in 1950 to around 15,700 t in 1984 (Figure 6a). Catches fluctuated slightly between then and 2000, before increasing to a peak of around 27,800 t in 2002 and 27,200 t in 2005, before they decreased to around 9,800 t in 2010 (Figure 6a). Domestic catches were, overall, 4 times the data supplied to the FAO. However, the under-reporting component decreased over time from 10 times the data supplied to the FAO in the 1950s to 3 times in the 2000s (Figure 6a), with a slight increase of under-reporting between the early 1990s- and the mid-1990s. Taxonomically, catches included some 70 taxa, among which the Atlantic flyingfish (Cheilopogon melanurus) dominates for domestic catches. Tuna and other large pelagic fishes dominate foreign catches (Figure 6b).
9
Figure 6. Total reconstructed catches from the EEZ of Sao Tome and Principe by a) domestic sector and foreign catch with reported catches overlaid as a line graph and b) taxon, 1950-2010 DISCUSSION
Total reconstructed domestic catches from the waters of Sao Tome and Principe were higher than the data supplied to the FAO. In addition, foreign catches were high; however, since literature data were used, to which catches were added that were estimated from catch rates, the overall catch presented here is fairly conservative. The under-reporting component reflects the political situation of the country as under-reporting increased with the establishment of a multiparty system which negatively impacted statistics in the country (U.S. Department of State 1994). Moreover, the under-reporting component was at its maximum between the mid-1970s and the 1980s when the fisheries administration of Sao Tome and Principe was part of 8 successive ministries (Horemans et al. 1994). The reconstruction shows that a large component of catches are for subsistence, which also reflects the nature of the economy for Sao Tome and Principe, which –excluding cocoa exports – consists mostly of subsistence agriculture and fishing (U.S. Department of State 1994).
0
5
10
15
20
25
30
1950 1960 1970 1980 1990 2000 2010
Cat
ch (
t x
103 )
Title
Artisanal
Subsistence
Foreign
Reported data
0
5
10
15
20
25
30
1950 1960 1970 1980 1990 2000 2010
Cat
ch (
t x
103 )
Year
Other large pelagics
Tunas
Flyingfishes
Miscellaneous
10
Fish consumption, obtained by dividing small-scale catches by the total population is declining over time, which is in line with literature estimates (Lagoin and Salmon 1970; Scopa et al. 2007; Espírito Santo and Pacheco de Carvalho 2010). This, if it continues, may threaten food security in the country. Furthermore, fishers of Sao Tome and Principe are already a vulnerable group, often living under extreme poverty (United Nations Development Program (UNDP) 2007; Anon. 2009), and threatened by climate change (Anon. 2009). Indeed, climate change, besides inducing migrations of species (Cheung et al. 2009), will likely increase erosion, and over 100,000 people will be impacted, including fishing communities (Anon. 2004).
Foreign catches were high, yet their precise values remain unknown to the country, as foreign fleets fail to report their catches to the government of Sao Tome and Principe. However, the fact that the tuna stocks are attractive to foreign fleets, and that the country relies on the revenues from fishing agreements which account for 4% of its budget, makes these deals attractive regardless of lack of monitoring (Costa Alegre 2009) and weak enforcement (Sao Tome and Principe has no surveillance vessels (Anon. 2003). Although foreign fleets exploit mainly offshore tuna in the EEZ of Sao Tome and Principe, small-scale fishers often point the finger at foreign fleets to explain declining coastal catches. Moreover, a survey suggested that the catches of some species of fish have declined due to the use of illegal fishing gear, notably hand grenades. As a consequence, there are increasing conflicts among fishers from different areas (Bonfim and Carvalho 2009). This adds to the challenge at sea, as fishing conditions are often dangerous. To adapt to this situation, and in contrast to what is observed elsewhere in West Africa, fishers use motorization as a mean to ensure security at sea, as they spend less time at sea than with unmotorized crafts (Carneiro 2012). However, despite the security issue, declining catches and increasing effort suggest fishers tend to expand their fishing grounds as they increasingly “feel the need to go further” (Pikitch and Doukakis 2005).
ACKNOWLEDGEMENTS
This is a contribution of the Sea Around Us, as scientific collaboration between the University of British Columbia and The Pew Charitable Trusts. I thank Daniel Pauly and Dirk Zeller for input.
11
REFERENCES
Anon. (2002) Atelier Paris 21 pour l'Afrique du Centre sur l'utilisation des statistiques dans les politiques de lutte contre la pauvrete et de developpement. Democratic Republic of Sao Tome and Principe, Yaounde. 26 p.
Anon. (2003) Programme d'appui participatic a l'agriculture familiale et a la peche artisanale (PAPAFPA). Rapport de pre-evaluation. Volume II. 1482-ST, Fonds international de d6veloppement agricole, Rome. 369 p.
Anon. (2004) Première communication nationale sur les changements climatiques. Ministére des Ressources Naturelles et l’Environnement, Sao Tome. 95 p.
Anon. (2009) Rapport national de mise en oeuvre du prgramme d'actions de Bruxelles en faveur des PMA pour la decennie 2001-2010: l'experience de la Republique Democratique de Sao Tome et Principe. Republique Democratique de Sao Tome et Principe, Sao Tome. 56 p.
Anon. (2012) Second national poverty reduction strategy II (2012-2016). Democratic Republic of Sao Tome and Principe. IMF Country Report 14, International Monetary Fund, Washington, D.C. 137 p.
Belhabib D and Pauly D (2015) Cote d'Ivoire: fisheries catch reconstruction, 1950-2010. Fisheries Centre Working Paper #2015-66, University of British Columbia, Vancouver, 30 p.
Bonfim F and Carvalho S (2009) Fourth national report on the biodiversity. Ministry of Natural Resources, Energy and Environment, Directorate General of the Environment, Sao Tome. 93 p.
Carneiro G (2012) "They come, they fish, and they go". EC fisheries agreements with Cape verde and São Tomé e Príncipe. Marine Fisheries Review 73(4): 1-25.
Chavance P, Amon Kothias J, Dewals P, Pianet R, Amandè MJ, De Molina AD and Djoh A (2011) Statistics on tuna surface fishery's bycatch landed in Abidjan, Cote d'Ivoire, for the 1982-2009 Period. Collect. Vol. Sci. Pap. ICCAT 66, ICCAT. 2104-2112 p.
Cheung WWL, Lam VWY, Sarmiento JL, Kearney K, Watson R and Pauly D (2009) Projecting global marine biodiversity impacts under climate change scenarios. Fish and Fisheries 10(3): 235-251.
CIESIN (2012) National Aggregates of Geospatial Data Collection: Population, Landscape, And Climate Estimates, Version 3 (PLACE III). NASA Socioeconomic Data and Applications Center (SEDAC), Palisades, NY. Available at: http://sedac.ciesin.columbia.edu/data/set/nagdc-population-landscape-climate-estimates-v3 [Accessed: 29/10/2012].
Costa Alegre M (2009) Towards a national ocean policy in Sao Tome and principe. . The United Nations-Nippon Foundation Fellowship Programme 2009 - 2010, New York. 76 p.
Espírito Santo S and Pacheco de Carvalho B (2010) Food consumption, food chains and market evolution in São Tomé e Principe: a case study in Su-Saharan Africa. Instituto Suprior Politécnico de São Tomé e Principe, Sao Tome. 18 p.
Failler P, Fonteneau A and Defaux V (2013) Evaluation retrospective et prospective du protocole de l'accord de partenariat dans le secteur de la peche entre l'Union Europeene et la Republique democratique de Sao Tome e principe. COFREPECHE, MRAG, Poseidon Aquatic Resource Management Ltd., NFDS, Brussels. 123 p.
Horemans B, Gallene J and Njock J (1994) Revue sectorielle de la pêche artisanale â Sao Torné et Principe. Rapport Technique 55, DIPA, Cotonou. 55 p.
Instituto Nacional de Estatística (2010) Inquérito Demográfico e Sanitário (IDS STP 2008-2009). Ministério da Saúde, Sao Tome. 435 p.
Lagoin Y and Salmon G (1970) Etude Technique et Economique comparée de la distribution du poisson de mer dans le pays de L'Afrique Centrale Atlantique. Secretériat d'état aux affaires étrangères chargé de la coopération. 500 p.
Lövin I (2011) Draft opinion of the Committee on Development for the Committee on Fisheries. European Parliament, Brussels. 5 p.
Oceanic Développement, Poseidon Aquatic Resource Management Ltd and MegaPesca Lda (2004) Framework contract for performing evaluations, Impact Analyses and Monitoring Services in the context of Fisheries Partnership Agreements concluded between the Community and Non-Member coastal states. Sao Tome and Principe. Re. Ares 2011, European Commission, Concarneau, France. 126 p.
Pikitch E and Doukakis P (2005) Recommendations for fisheries reform for São Tomé and Príncipe. Pew Institute for Ocean Science, Washington, D.C. 14 p.
12

Scopa A, Nkawambi W, Delbaere J, Salvaterra H and Bongi S (2007) Analyse Globale de la Sécurité Alimentaire et de la Vulnérabilité. Republique democratique de Sao Tome et Principe. Programme alimentaire mondial, Service de l’analyse de la sécurité alimentaire (OMXF), Sao Tome. 84 p.
U.S. Department of State (1994) Sao Tome and Principe human rights practices. United States Department of State, Washington, DC. Available at: file:///C:/Users/d.belhabib/Desktop/Catch_reconstructions/Sao%20Tome%20and%20pricipe/1993%20Human%20Rights%20Report%20%20SAO%20TOME%20AND%20PRINCIPE%20.htm [Accessed: 11/04/2014].
United Nations Development Program (UNDP) (2007) Uniten Nations System in Sao Tome and Principe. Sao Tome and Principe: Common country assessment. UNPD, New York. 124 p.
13