fiscal year march 2017 first half … motor corporation 1 highlights fiscal year march 2017 first...
TRANSCRIPT

FISCAL YEAR MARCH 2017 FIRST HALF FINANCIAL RESULTS

1 Mazda Motor Corporation
Highlights
Fiscal Year March 2017 First Half Results
Fiscal Year March 2017 Full Year Forecast
Structural Reform Stage 2
Progress of Key Initiatives/Future Initiatives
PRESENTATION OUTLINE

2 Mazda Motor Corporation
HIGHLIGHTS
【FY March 2017 - First Half Results】
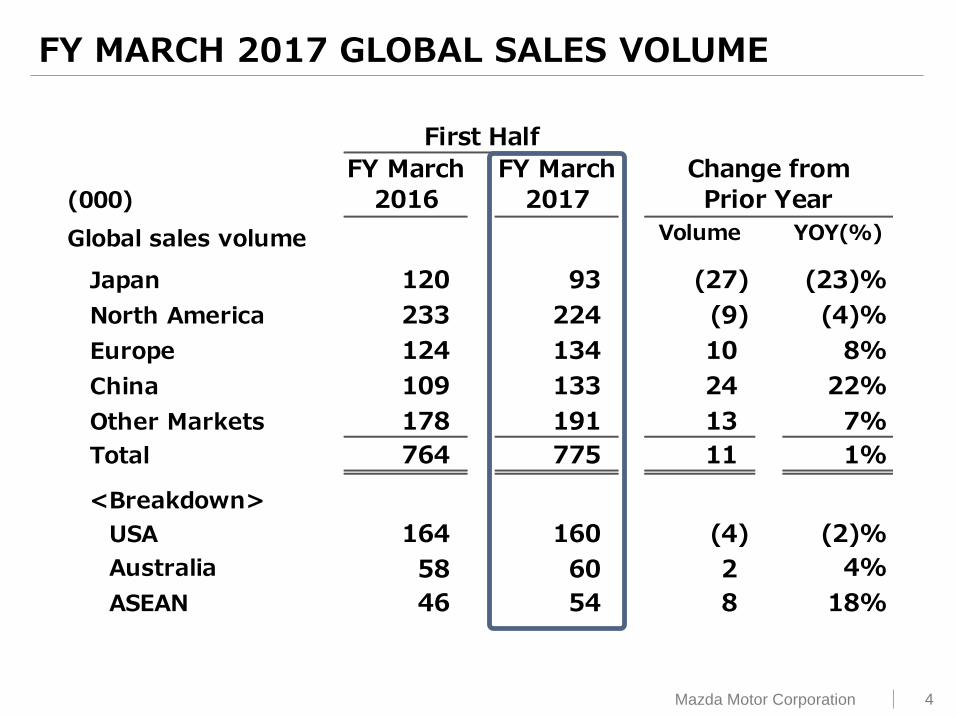
Global sales volume for the period was a record 775,000
units. The new CX-9 and CX-4, and updated Mazda3 and
Mazda6 contributed to sales volume and profit
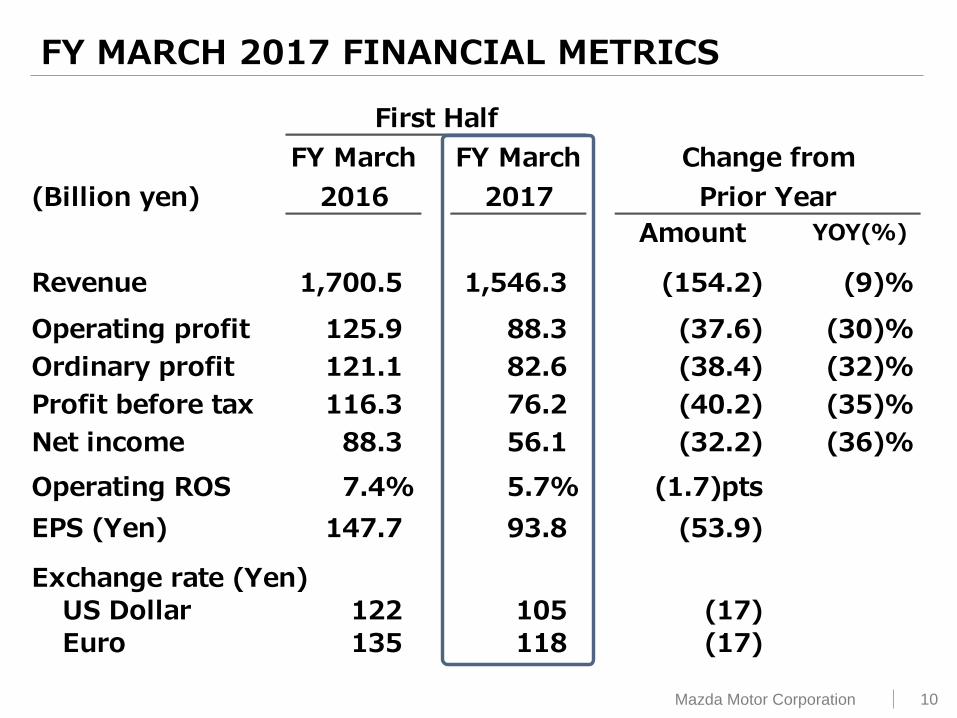
Revenue was ¥1,546.3 billion, operating profit was
¥88.3 billion and net income was ¥56.1 billion
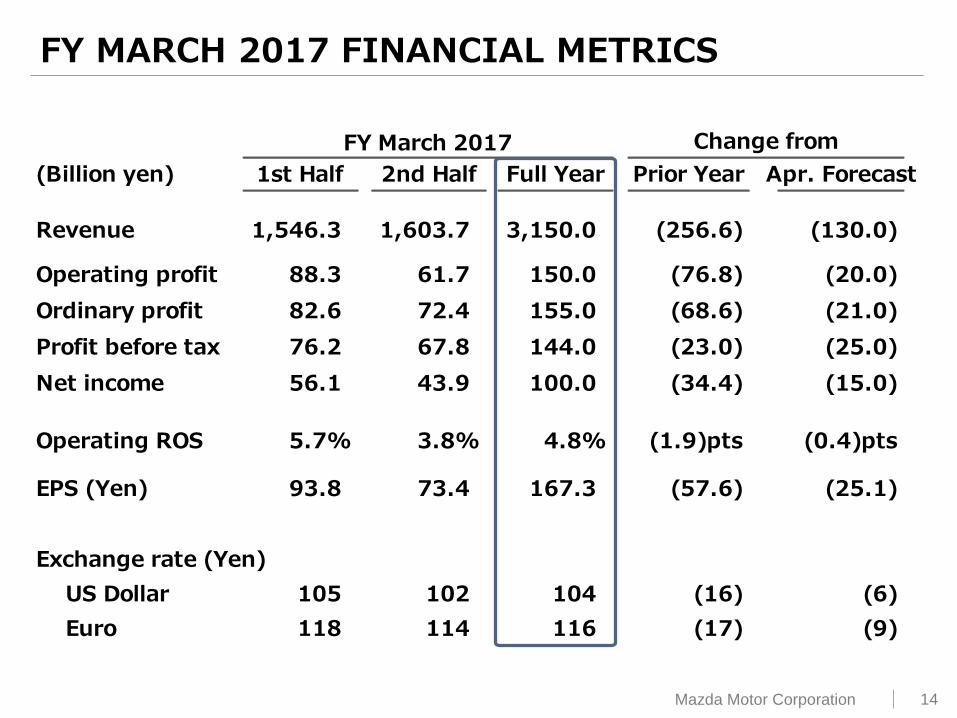
【FY March 2017 - Full Year Forecast】
Global sales volume forecast is unchanged at
1.55 million units
Revised full-year exchange assumptions: ¥104 to the US
dollar, ¥116 to the euro
Revised forecast revenue to ¥3,150 billion, operating profit
to ¥150 billion and net income to ¥100 billion
No change to annual divided of ¥35 per share

3 Mazda Motor Corporation
FISCAL YEAR MARCH 2017 FIRST HALF RESULTS
4 Mazda Motor Corporation
First Half
FY March FY March Change from
(000) 2016 2017 Prior Year
Global sales volume Volume YOY(%)
Japan 120 93 (27) (23)%
North America 233 224 (9) (4)%
Europe 124 134 10 8%
China 109 133 24 22%
Other Markets 178 191 13 7%
Total 764 775 11 1%
<Breakdown>
USA 164 160 (4) (2)%
Australia 58 60 2 4%
ASEAN 46 54 8 18%
FY MARCH 2017 GLOBAL SALES VOLUME

5 Mazda Motor Corporation
First Half Sales Volume
JAPAN
120
93
0
50
100
150
(000)
(23)%
FY March 2016 FY March 2017
Mazda6
Sales were 93,000 units, down 23% year on year
Market share was 4.0%, down 1.2 points year on year. Registered vehicle market share was 4.8%, down 2.0 points year on year
Mazda3 and Mazda6 were updated and sales are increasing
Updated Mazda2 and CX-3 will be launched and enhanced competitiveness of these key models will help improve sales momentum in the second half
Sales of the MX-5 RF will begin within the year

6 Mazda Motor Corporation
NORTH AMERICA
164 160
69 64
0
100
200
(4)% 233 224
(000)
New CX-9
Canada &
others
USA
First Half Sales Volume
FY March 2016 FY March 2017
Sales were 224,000 units, down 4% year on year
USA: Sales were 160,000 units, down 2% year on year
- Launch updated Mazda3 and Mazda6 to strengthen sales in car segment
- Sales of new CX-9, which started in earnest in June, are promising with the ratio of high-grade models increasing
Mexico: Sales were 25,000 units, down 9% year on year
- Sales environment has deteriorated due to actions against weak MXN

7 Mazda Motor Corporation
Mazda3
14 11
110 123
0
50
100
150
124 134
EUROPE
+8%
+12%
(20)%
(000)
Europe (excl. Russia)
Russia
FY March 2016 FY March 2017
First Half Sales Volume
Sales were 134,000 units, up 8% year on year
Strong sales of CX-3 and MX-5 contributed to volume growth
Sales in Europe excluding Russia grew 12% year on year to 123,000 units
- Germany: 33,000 units, up 9% year on year
- UK: 23,000 units, down 3% year on year
Sales in Russia were 11,000 units, down 20% year on year due to declining demand and weaker RUB

8 Mazda Motor Corporation
CHINA
109
133
0
50
100
150
FY March 2016 FY March 2017
22%
(000)
New CX-4
First Half Sales Volume
Sales were 133,000 units, up 22% year on year
Mazda3 led sales, thanks in part to the compact car tax reduction scheme
New CX-4 was launched in June and is selling well
Updated Mazda6 was launched in August and is also selling well
Updated CX-5 continues to contribute to sales growth

9 Mazda Motor Corporation
OTHER MARKETS
46 54
58 60
74 77
0
50
100
150
200
FY March 2016 FY March 2017
178 191 +7%
(000)
Others
Australia
ASEAN
CX-3
First Half Sales Volume
Sales were 191,000 units, up 7% year on year
Australia: Sales were 60,000 units, up 4% year on year, and market share reached 10%
- Second highest-selling brand
- CX-3 and CX-5 are the best sellers in their segments
ASEAN: Sales were 54,000 units, up 18% year-on-year
- In Thailand, sales increased 14% year on year
- In Vietnam, sales increased 77% year on year
Others: New Zealand and Colombia achieved record-high sales
10 Mazda Motor Corporation
First Half
FY March FY March Change from
(Billion yen) 2016 2017 Prior Year
Amount YOY(%)
Revenue 1,700.5 1,546.3 (154.2) (9)%
Operating profit 125.9 88.3 (37.6) (30)%
Ordinary profit 121.1 82.6 (38.4) (32)%
Profit before tax 116.3 76.2 (40.2) (35)%
Net income 88.3 56.1 (32.2) (36)%
7.4% 5.7% (1.7)pts
EPS (Yen) 147.7 93.8 (53.9)
Exchange rate (Yen)
US Dollar 122 105 (17)
Euro 135 118 (17)
Operating ROS
FY MARCH 2017 FINANCIAL METRICS

11 Mazda Motor Corporation
125.9 + 0.5
(64.8)
+ 30.8 + 2.3
(6.4)
88.3
0
50
100
150
FY March 2017
FY March
2016
Includes lower material prices
【Exchange】
USD EUR CAD AUD GBP Other
(7.3) (9.8) (7.1)
(14.3) (14.2) (12.1)
Improved profitability with new and updated models despite lower volume in Japan, etc.
(Deterioration)
Improvement
FY March 2017 OPERATING PROFIT CHANGE
FY March 2017 1st Half vs. FY March 2016 1st Half (Billion yen)
Change from Prior Year (37.6)
Volume & Mix
Exchange
Cost Improvement
Marketing Expense
Other

12 Mazda Motor Corporation
FISCAL YEAR MARCH 2017 FULL YEAR FORECAST

13 Mazda Motor Corporation
FY March 2017
(000) 1st Half 2nd Half Full Year Prior Year Apr. Forecast
Global sales volume YOY(%) Volume
Japan 93 117 210 (10)% (23)
North America 224 225 449 3% 0
Europe 134 126 260 1% 0
China 133 126 259 10% 21
Other Markets 191 181 372 0% 2
Total 775 775 1,550 1% 0
<Breakdown>
USA 160 165 325 6% 0
Australia 60 61 121 4% 3
ASEAN 54 52 106 5% 0
Change from
FY MARCH 2017 GLOBAL SALES VOLUME
14 Mazda Motor Corporation
7月公表
FY March 2017 2017年3月期
(Billion yen) 1st Half 2nd Half Full Year Prior Year Apr. Forecast
Revenue 1,546.3 1,603.7 3,150.0 (256.6) (130.0)
Operating profit 88.3 61.7 150.0 (76.8) (20.0)
Ordinary profit 82.6 72.4 155.0 (68.6) (21.0)
Profit before tax 76.2 67.8 144.0 (23.0) (25.0)
Net income 56.1 43.9 100.0 (34.4) (15.0)
Operating ROS 5.7% 3.8% 4.8% (1.9)pts (0.4)pts
EPS (Yen) 93.8 73.4 167.3 (57.6) (25.1)
Exchange rate (Yen)
US Dollar 105 102 104 (16) (6)
Euro 118 114 116 (17) (9)
Change from
FY MARCH 2017 FINANCIAL METRICS

15 Mazda Motor Corporation
226.8 + 19.0
(123.0)
+ 48.0
(3.0)
(17.8)
150.0
0
100
200
300
FY March 2016
FY March 2017
【Exchange】
USD CAD GBP
(22.8) (16.0)
(22.1)
(29.4) (23.0) (9.7)
EUR AUD
Other
Improve volume and profitability by introducing new products and updated models
Includes lower material prices
Increase R&D for future growth, etc.
(Deterioration)
Improvement
FY March 2017 OPERATING PROFIT CHANGE
FY March 2017 Full Year vs. FY March 2016 Full Year
(Billion yen)
Change from Prior Year (76.8)
Volume & Mix
Exchange
Cost Improvement Marketing
Expense Other
16 Mazda Motor Corporation
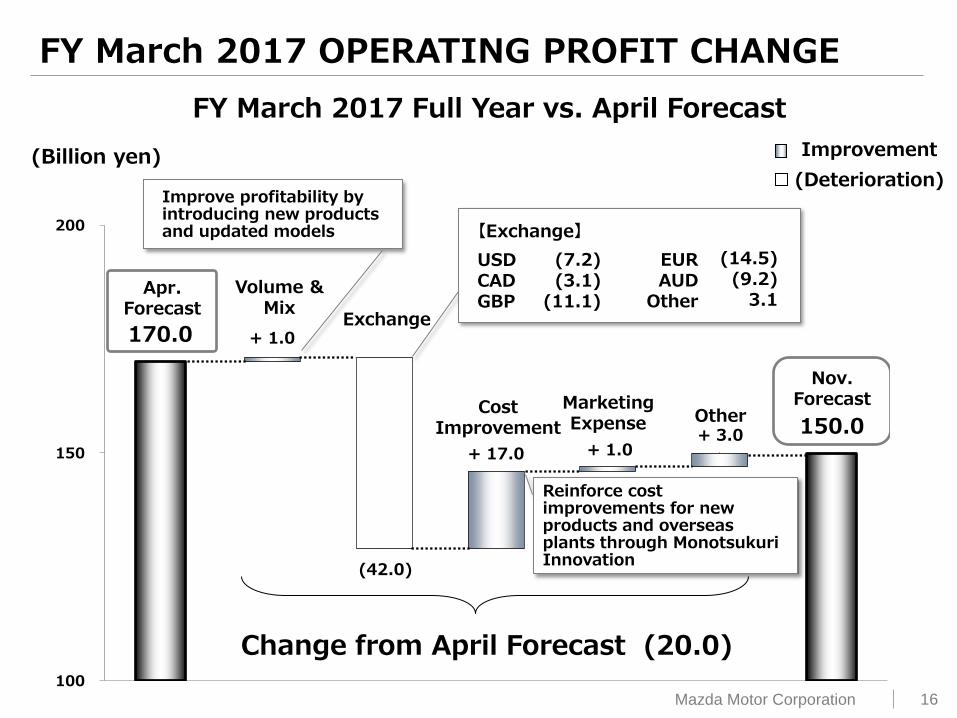
170.0 + 1.0
(42.0)
+ 17.0 + 1.0 + 3.0 150.0
100
150
200
Apr. Forecast
Nov. Forecast
【Exchange】
USD CAD GBP
(7.2) (3.1)
(11.1)
(14.5) (9.2) 3.1
EUR AUD
Other
Reinforce cost improvements for new products and overseas plants through Monotsukuri Innovation
Improve profitability by introducing new products and updated models
(Deterioration)
Improvement
FY March 2017 OPERATING PROFIT CHANGE
FY March 2017 Full Year vs. April Forecast
(Billion yen)
Change from April Forecast (20.0)
Volume & Mix
Exchange
Cost Improvement
Marketing Expense Other
17 Mazda Motor Corporation
PROGRESS OF KEY INITIATIVES / FUTURE INITIATIVES
Structural Reform Stage 2
18 Mazda Motor Corporation
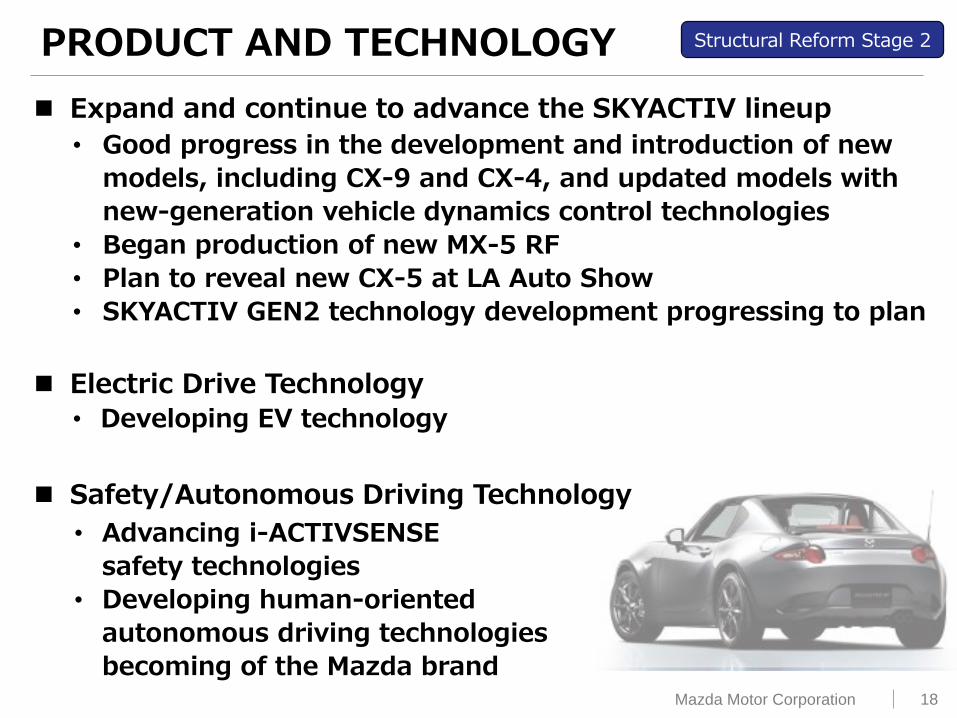
PRODUCT AND TECHNOLOGY Structural Reform Stage 2
• Good progress in the development and introduction of new
models, including CX-9 and CX-4, and updated models with
new-generation vehicle dynamics control technologies
• Began production of new MX-5 RF
• Plan to reveal new CX-5 at LA Auto Show
• SKYACTIV GEN2 technology development progressing to plan
• Advancing i-ACTIVSENSE
safety technologies
• Developing human-oriented
autonomous driving technologies
becoming of the Mazda brand
Expand and continue to advance the SKYACTIV lineup
Electric Drive Technology
Safety/Autonomous Driving Technology
• Developing EV technology

19 Mazda Motor Corporation
GLOBAL SALES AND NETWORK ENHANCEMENT Structural Reform Stage 2
Mazda Brand Space Osaka GLOBAL MX-5 CUP Model
Maintain volume growth at 50,000 units per year by launching new and updated models and strengthening initiatives to improve brand value
Increase net revenue, reduce incentives and improve residual values by ensuring good penetration of the “right-price” sales policy
Globally deploy initiatives to improve retention ratio by
trade cycle management
20 Mazda Motor Corporation
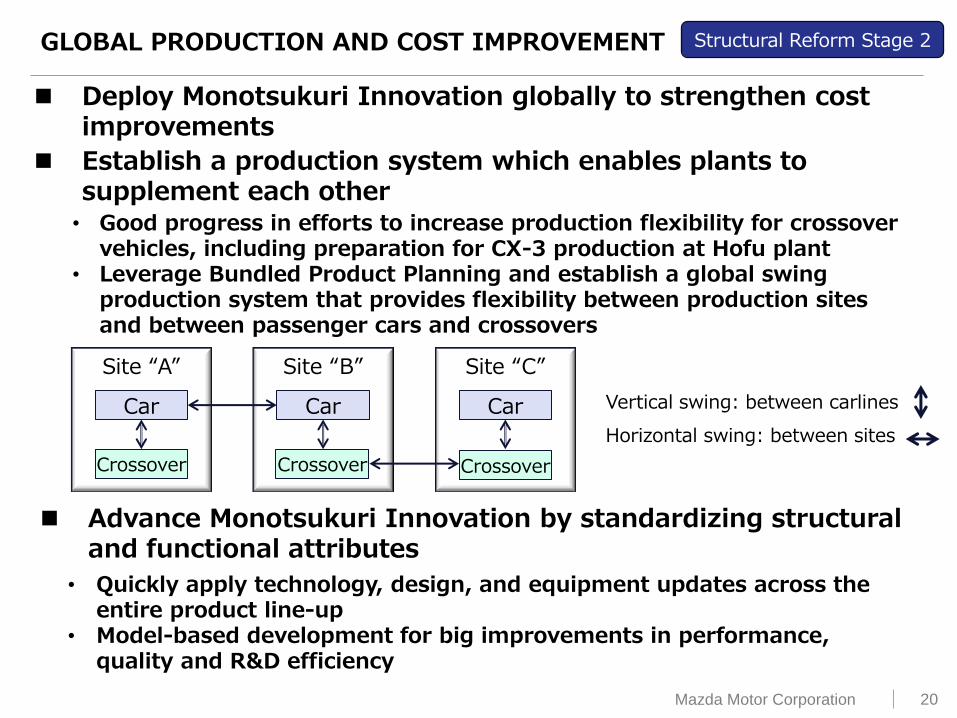
GLOBAL PRODUCTION AND COST IMPROVEMENT Structural Reform Stage 2
Site “A”
Car
Crossover
Site “B”
Car
Site “C”
Car
Deploy Monotsukuri Innovation globally to strengthen cost improvements
Establish a production system which enables plants to supplement each other • Good progress in efforts to increase production flexibility for crossover
vehicles, including preparation for CX-3 production at Hofu plant • Leverage Bundled Product Planning and establish a global swing
production system that provides flexibility between production sites and between passenger cars and crossovers
Advance Monotsukuri Innovation by standardizing structural and functional attributes
• Quickly apply technology, design, and equipment updates across the entire product line-up
• Model-based development for big improvements in performance, quality and R&D efficiency
Vertical swing: between carlines
Horizontal swing: between sites
Crossover Crossover

21 Mazda Motor Corporation
Equity ratio
45%
or more
Dividend payout ratio Operating ROS
7%
or more
20%
or more
【Target for FY March 2019】
(¥120/USD, ¥130/euro)
STERNGHTEN FIANACIAL BASE AND SHAREHOLDER RETURNS
Global sales volume
1.65 million units
Structural Reform Stage 2
Generate stable profit and cash flow by steadily increasing sales volume and improving brand value
Improve balance-sheet, including equity ratio and net debt
Strengthen financial base while advancing R&D and other investments for future growth
Improve shareholder returns while reinforcing financial base Dividend policy: Realize stable and steadily improving dividend payments
Target will be revised based on changes in business environment including exchange rates at an appropriate time.

22 Mazda Motor Corporation

23 Mazda Motor Corporation
APPENDIX
24 Mazda Motor Corporation
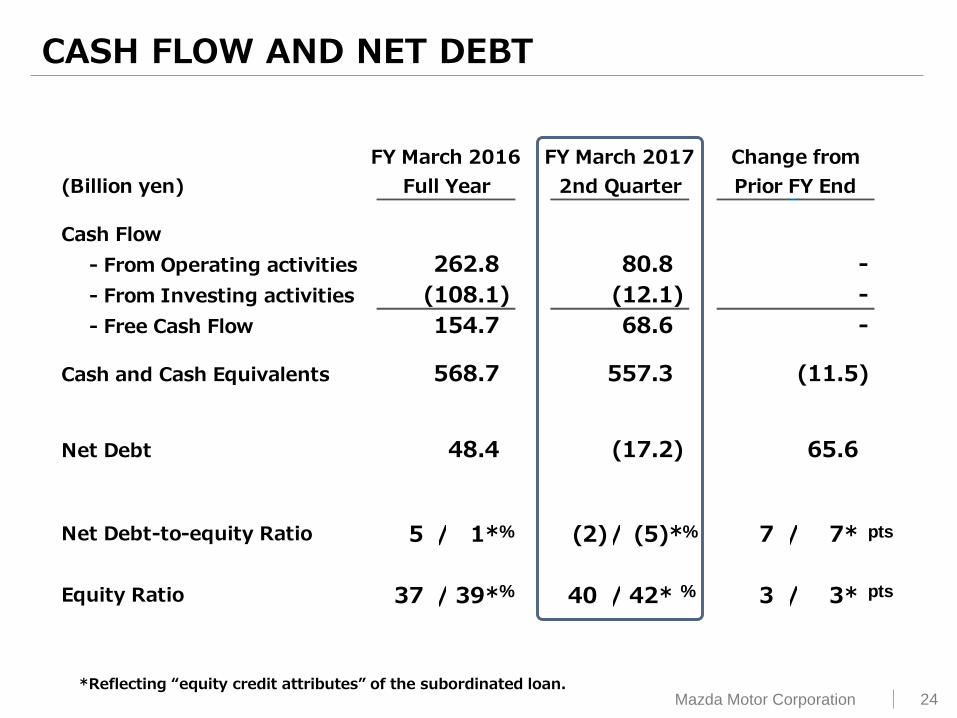
FY March 2016 FY March 2017 Change from
(Billion yen) Full Year 2nd Quarter Prior FY End
Cash Flow
- From Operating activities
- From Investing activities
- Free Cash Flow
Cash and Cash Equivalents
Net Debt
5 / 1* (2)/ (5)* 7 / 7*
37 / 39* 40 / 42* 3 / 3*
(11.5)
65.6
80.8
(12.1)
68.6
-
-
-
Net Debt-to-equity Ratio
Equity Ratio
557.3
(17.2)
262.8
(108.1)
154.7
568.7
48.4
% % pts
% % pts
CASH FLOW AND NET DEBT
*Reflecting “equity credit attributes” of the subordinated loan.

25 Mazda Motor Corporation
FY March 2017
244.3 270.3 230.5
271.2 215.1
256.0
291.0 304.6
284.6 277.3
281.4 236.0
144.0
183.8
180.6 166.6
154.1 145.4
126.7
135.8
151.6 143.7
125.6 132.8
0
300
600
900 858.8 806.0
847.3 894.5
776.2 770.1
(Billion yen)
1Q 2Q 3Q 4Q 1Q
FY March 2016
2Q
REVENUE BY REGION
Japan
North America
Europe
Other

26 Mazda Motor Corporation
693.5 775.8
728.9 727.7 662.8 656.3
59.0
61.8 61.6 61.8
57.3 57.4
53.5
56.9 56.8 69.3
56.1 56.5
0
300
600
900
776.2 806.0
894.5 847.3 858.8
770.1
(Billion yen)
1Q 2Q 3Q 4Q 1Q 2Q
REVENUE BY PRODUCT
Parts
Other
Vehicles / Parts for Overseas Production
FY March 2017 FY March 2016

27 Mazda Motor Corporation
(9)%
2%
(11)%
(14)%
(9)%
(4)%
1%
6%
Total Volume & Mix Exchange
Japan (4)% Overseas 6%
REVENUE CHANGE
FY March 2017 1st Half vs. FY March 2016 1st Half
(Billion yen)
FY March 2017 1,546.3 FY March 2016 1,700.5

28 Mazda Motor Corporation
(14)%
(2)%
(12)%
(18)%
(8)%
2%
12%
Total Volume & Mix Exchange
Japan (3)% Overseas 1%
REVENUE CHANGE
FY March 2017 2nd Quarter vs. FY March 2016 2nd Quarter
(Billion yen)
FY March 2017 770.1 FY March 2016 894.5

29 Mazda Motor Corporation
Second Quarter
FY March FY March Change from
(000) 2016 2017 Prior Year
Global sales volume Volume YOY(%)
Japan 63 54 (9) (15)%
North America 117 111 (6) (5)%
Europe 70 68 (2) (2)%
China 52 74 22 43%
Other Markets 92 93 1 1%
Total 394 400 6 1%
Consolidated wholesales
Japan 60 49 (11) (20)%
North America 110 95 (15) (13)%
Europe 71 66 (5) (7)%
Other Markets 97 99 2 1%
Total 338 309 (29) (9)%
GLOBAL SALES VOLUME AND CONSOLIDATED WHOLESALES

30 Mazda Motor Corporation
72.6
(10.8)
(30.9)
+ 16.5
(0.2)
(11.3)
35.9
0
25
50
75
FY March 2016
FY March 2017
【Exchange】
USD CAD GBP
(2.6) (3.8)
(4.4)
(8.9) (6.7)
(4.5)
EUR AUD
Other
(Billion yen)
FY March 2017 OPERATING PROFIT CHANGE
FY March 2017 2nd Quarter vs. FY March 2016 2nd Quarter
(Deterioration)
Improvement
Volume & Mix
Exchange Cost
Improvement Marketing Expense Other
Change from Prior Year (36.7)

31 Mazda Motor Corporation
Full Year
FY March FY March
(Yen) 2016 2017 Change
US Dollar 120 104 (16)
Euro 133 116 (17)
Canadian Dollar 92 80 (12)
Australian Dollar 89 79 (10)
British Pound 181 136 (45)
EXCHANGE RATES
32 Mazda Motor Corporation
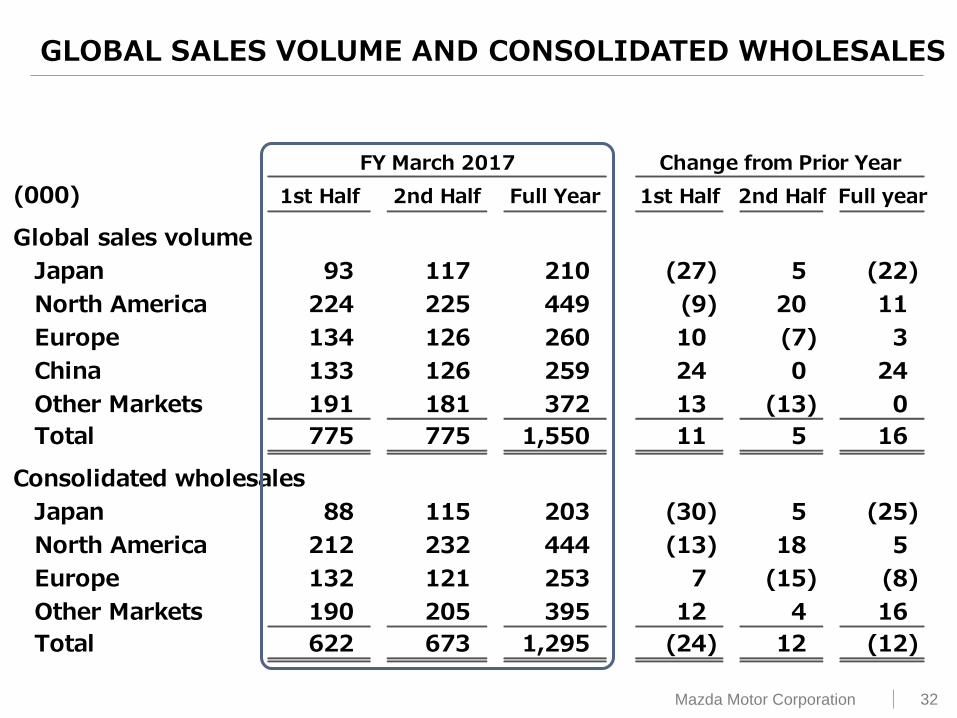
FY March 2017 Change from Prior Year 2016年3月期
(000) 1st Half 2nd Half Full Year 1st Half 2nd Half Full year
Global sales volume
Japan 93 117 210 (27) 5 (22)
North America 224 225 449 (9) 20 11
Europe 134 126 260 10 (7) 3
China 133 126 259 24 0 24
Other Markets 191 181 372 13 (13) 0
Total 775 775 1,550 11 5 16
Consolidated wholesales
Japan 88 115 203 (30) 5 (25)
North America 212 232 444 (13) 18 5
Europe 132 121 253 7 (15) (8)
Other Markets 190 205 395 12 4 16
Total 622 673 1,295 (24) 12 (12)
GLOBAL SALES VOLUME AND CONSOLIDATED WHOLESALES

33 Mazda Motor Corporation
36.9 35.8 38.8 39.4
55.0 58.8
0
50
100
150
Full Year
First Half
105.0
79.0 83.0
116.6
125.0
89.2
KEY DATA
Capital Expenditures
FY March 2016
Depreciation Cost
R&D Cost
FY March 2017
FY March 2016
FY March 2017
FY March 2016
FY March 2017
Full Year
Full Year
First Half
First Half
(Billion yen)
34 Mazda Motor Corporation
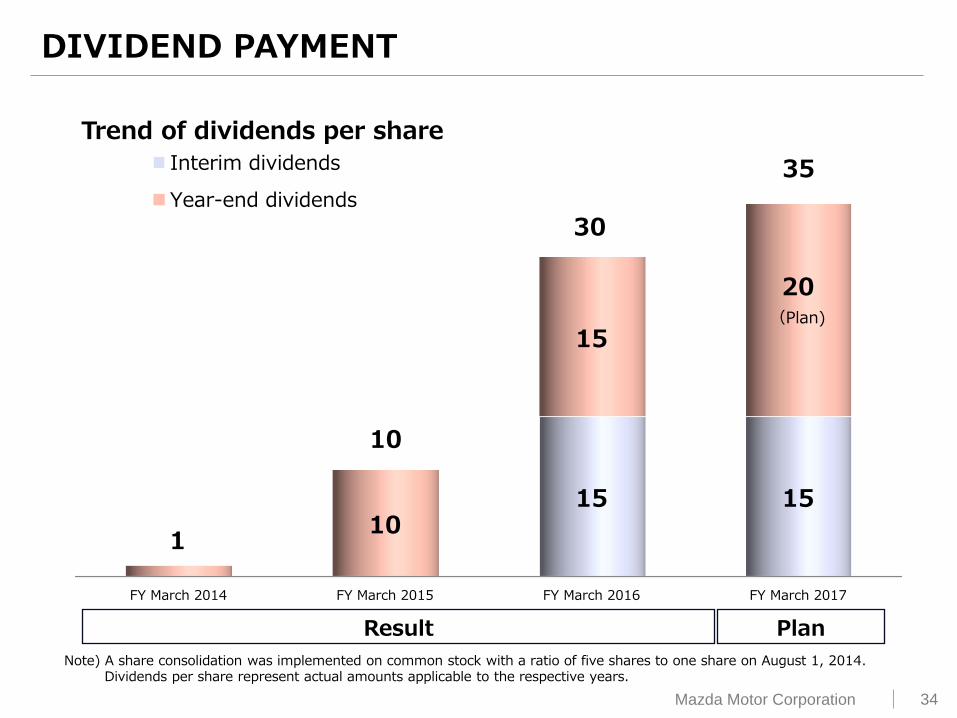
DIVIDEND PAYMENT
FY March 2014 FY March 2015 FY March 2016 FY March 2017
15 15 10
15
20
Trend of dividends per share
Interim dividends
Year-end dividends
35
30
10
Plan Result
1
Note) A share consolidation was implemented on common stock with a ratio of five shares to one share on August 1, 2014. Dividends per share represent actual amounts applicable to the respective years.
(Plan)
35 Mazda Motor Corporation
DISCLAIMER
The projections and future strategies shown in this presentation are based on various uncertainties including without limitation the conditions of the world economy in the future, the trend of the automotive industry and the risk of exchange-rate fluctuations. So, please be aware that Mazda's actual performance may differ substantially from the projections.
If you are interested in investing in Mazda, you are requested to make a final investment decision at your own risk, taking the foregoing into consideration. Please note that neither Mazda nor any third party providing information shall be responsible for any damage you may suffer due to investment in Mazda based on the information shown in this presentation.