fiscal year 2017 management reports · financial results for the fiscal year 2017 . page . table of...
TRANSCRIPT

FISCAL YEAR 2017 MANAGEMENT REPORTS ENDING JUNE 30, 2017
OFFICE OF BUDGET & FISCAL PLANNING

i
Oregon State University Financial Results for the Fiscal Year 2017
Page Table of Contents ......................................................................................................................................................................... i
Introduction .................................................................................................................................................................................... 1
Graphs: Sources and Uses of Funds ...................................................................................................................................... 2
Analysis of Financial Results: Budgeted Operations Operating Funds - Summary Balance Sheet ............................................................................................................... 3 Operating Funds - Revenue & Expense Statement ................................................................................................. 4 Graphs: Fund Balances ........................................................................................................................................................ 5 Education and General Funds Reports .......................................................................................................................... 6
E&G Overall ..................................................................................................................................................................... 7 OSU – Corvallis ............................................................................................................................................................. 10 OSU – Cascades ............................................................................................................................................................ 13
Statewide Public Services ................................................................................................................................................. 16 Agricultural Experiment Stations ........................................................................................................................... 17 Extension Service ......................................................................................................................................................... 20 Forest Research Laboratory ..................................................................................................................................... 24
Analysis of Financial Results: Auxiliary Operations Housing & Dining Services .............................................................................................................................................. 28 Student Centers & Activities ........................................................................................................................................... 30 Athletics .................................................................................................................................................................................. 33 Student Health Services & CAPS ................................................................................................................................... 36 Parking .................................................................................................................................................................................... 39 Auxiliary Operations at OSU-Cascades ....................................................................................................................... 42 Miscellaneous Auxiliary Funds ....................................................................................................................................... 44
Analysis of Financial Results: Service Center Operations Infrastructure Services ...................................................................................................................................................... 47 Printing and Mailing .......................................................................................................................................................... 50 Motor Pool ............................................................................................................................................................................. 53 Client Services ...................................................................................................................................................................... 55 Miscellaneous Service Center Funds ............................................................................................................................ 58
Designated Operations, Gift Funds & Externally Funded Expenditures ................................................................ 61
Royalties Funds ............................................................................................................................................................................ 63
Debt Service .................................................................................................................................................................................. 64

Oregon State University
MANAGEMENT REPORTS Fiscal year ending June 30, 2017 .
The following unaudited financial statements have been prepared for internal
management purposes, providing a summary of all operating funds and detailing
information on revenues, expenses, transfers, and fund balances for the Education and
General Program, Statewide Public Services, Auxiliary Operations, Service Center
Operations, and the inclusion of Supplemental Schedules. The report includes fiscal year
2017 balance sheets, operating and cash flow statements, and comparisons with results
for fiscal year June 30, 2016.
Page 1 of 65 Unaudited - For Management Purposes Only
Fiscal year ending June 30, 2017
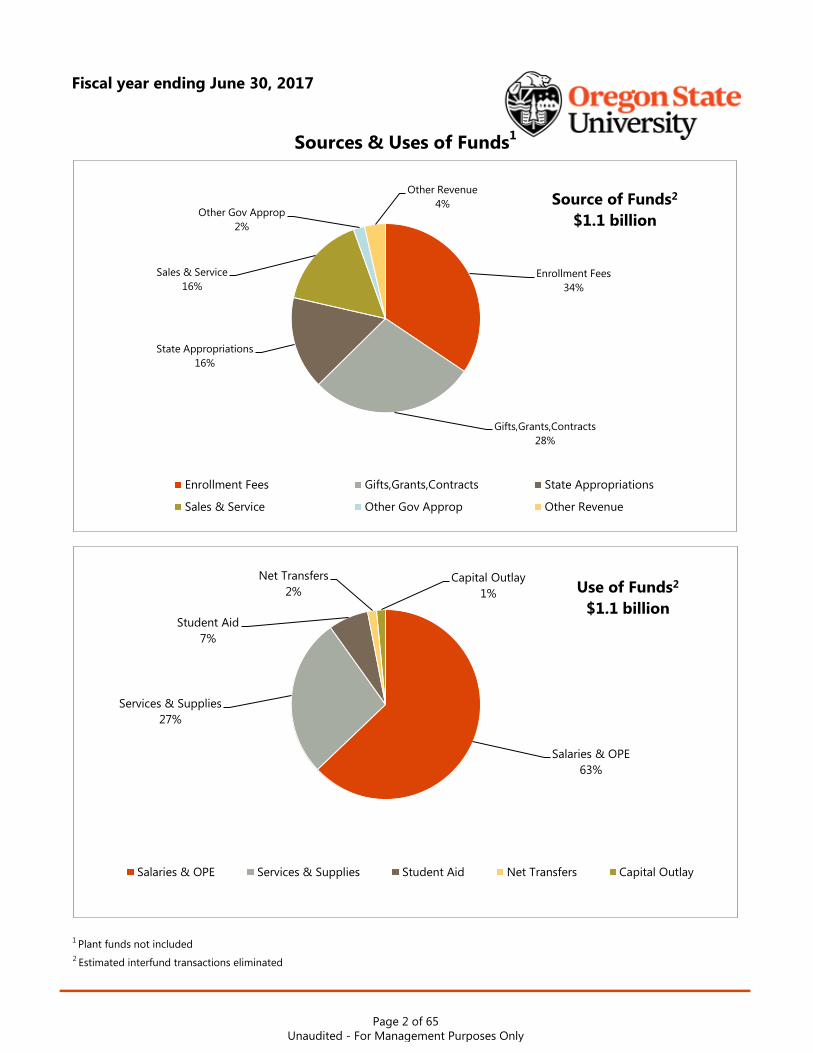
1 Plant funds not included2 Estimated interfund transactions eliminated
Sources & Uses of Funds1
Enrollment Fees34%
Gifts,Grants,Contracts28%
State Appropriations16%
Sales & Service16%
Other Gov Approp2%
Other Revenue4% Source of Funds2
$1.1 billion
Enrollment Fees Gifts,Grants,Contracts State Appropriations
Sales & Service Other Gov Approp Other Revenue
Salaries & OPE63%
Services & Supplies27%
Student Aid7%
Net Transfers2%
Capital Outlay1% Use of Funds2
$1.1 billion
Salaries & OPE Services & Supplies Student Aid Net Transfers Capital Outlay
Page 2 of 65 Unaudited - For Management Purposes Only

Fiscal year ending June 30, 2017
Education & Statewide Auxiliary Service Center Designated Royalty RestrictedFY2017 General Public Services Enterprises Departments Operations Funds Funds Total2
Current Assets 139,245$ 17,191$ 37,120$ 10,110$ 8,916$ 12,956$ 57,313$ 282,851$ Non Current Assets - - 444,940 4,847 94 - - 449,882
Total Assets 139,245 17,191 482,061 14,957 9,010 12,956 57,313 732,733
Current Liabilities 51,525 4,658 28,571 4,234 3,125 1,800 46,929 140,843 Non-Current Liabilities 4,388 1,336 314,511 167 1 321 - 320,724 Fund Balance 83,332 11,198 138,978 10,555 5,884 10,835 10,385 271,166
Total Liabilities & Fund Balance 139,245$ 17,191$ 482,061$ 14,957$ 9,010$ 12,956$ 57,313$ 732,733$
FY2016
Current Assets 118,940$ 16,833$ 38,825$ 7,151$ 6,854$ 12,461$ 61,682$ 262,747$ Non Current Assets - - 408,293 3,894 140 - - 412,327
Total Assets 118,940 16,833 447,118 11,045 6,994 12,461 61,682 675,074
Current Liabilities 50,377 5,388 26,764 1,127 1,908 2,151 51,134 138,848 Non-Current Liabilities - - 267,075 - - - - 267,075 Fund Balance 68,563 11,445 153,280 9,917 5,087 10,310 10,548 269,150
Total Liabilities & Fund Balance 118,940$ 16,833$ 447,118$ 11,045$ 6,994$ 12,461$ 61,682$ 675,074$
1 Plant Funds not included.2 Memorandum Only - Interfund eliminations have not been made for certain transactions which are counted in more than one fund, such as internal sales.
Operating Funds1
Fiscal Years 2017 and 2016(in thousands)
Summary Balance Sheet
Page 3 of 65 Unaudited - For Management Purposes Only

Fiscal year ending June 30, 2017
Page 4 of 65Unaudited - For Management Purposes Only
Education & Statewide Auxiliary Service Center Designated Royalty RestrictedFY2017 General Public Services Enterprises Departments Operations Funds Funds Total2
Revenues 533,454$ 89,724$ 180,892$ 22,679$ 22,951$ 6,121$ 334,348$ 1,190,168$ Expenses 506,425 93,560 186,406 22,626 23,223 4,022 331,432 1,167,696
Net Change from Operations 27,028 (3,836) (5,514) 53 (273) 2,099 2,915 22,472
Fixed Asset Disposal Gain/(Loss) - - (117) (7) - - - (124) Net Transfers (12,260) 3,589 (6,495) 594 1,070 (1,575) (3,079) (18,156)
Beginning Fund Balance 68,563 11,445 153,280 9,917 5,087 10,310 10,548 269,150 Fund Additions (Deductions) - - (2,175) (1) - - - (2,176)
Ending Fund Balance 83,332$ 11,198$ 138,978$ 10,555$ 5,884$ 10,835$ 10,385$ 271,166$
FY2016
Revenues 512,481$ 84,562$ 163,866$ 22,392$ 21,516$ 6,821$ 320,439$ 1,132,075$ Expenses 477,637 85,771 174,202 22,495 21,725 5,006 318,389 1,105,226
Net Change from Operations 34,843 (1,209) (10,336) (103) (209) 1,814 2,050 26,850
Fixed Asset Disposal Gain/(Loss) - - (357) (13) (1) - - 176,344 Net Transfers (11,440) 3,860 (19,569) 847 949 (6,819) (3,798) 176,344
Beginning Fund Balance 45,160 8,794 118,377 9,191 4,347 15,315 12,297 213,481 Fund Additions (Deductions) - - 65,165 (4) - - - 65,161
Ending Fund Balance 68,563$ 11,445$ 153,280$ 9,917$ 5,087$ 10,310$ 10,548$ 269,150$
1 Plant Funds not included.2 Memorandum Only - Interfund eliminations have not been made for certain transactions which are counted in more than one fund, such as internal sales.
Operating Funds1
Fiscal Year 2017 and 2016(in thousands)
Statement of Revenues and Expenses

Fiscal year ending June 30, 2017
Fund BalancesFiscal Years 2016 and 2017
Ag ExperimentStation
ExtensionService
Forest ResearchLab
FY16 Actual $ 4,712,667 $ 4,370,287 $ 2,362,233
FY17 Actual $ 4,525,508 $ 4,952,838 $ 1,719,294
$0.0
$1.0
$2.0
$3.0
$4.0
$5.0
$6.0
Mill
ions
Statewide Public Services
E & G Auxiliaries Service Centers
FY16 Actual $ 68,563,430 $ 153,279,638 $ 9,917,145
FY17 Actual $ 83,331,515 $ 138,978,264 $ 10,555,352
$0
$20
$40
$60
$80
$100
$120
$140
$160
$180
Mill
ions
E&G, Auxiliaries & Service Centers
Page 5 of 65 Unaudited - For Management Purposes Only

MANAGEMENT REPORTS
EDUCATION & GENERAL FUNDS Fiscal year ending June 30, 2017
Background: Education & General funds support the general operations of the University and its
primary missions of instruction, research, and public service. The major sources of revenue are
tuition, state appropriations, and indirect cost recovery from federal grants.
Revenues: Overall revenue is up $20.9 million or 4.1% higher than fiscal year 2016.
Revenues from tuition and fees exceed last year’s actual by $15.3 million or 4.1% due to enrollment
growth and rate increases. The two primary sources of revenue increases were undergraduate
non-residents and Ecampus.
Fee waivers, treated as negative revenue, increased 4.9% at $37.7 million over fiscal year 2016.
State appropriations were 5.2% higher than fiscal year 2016.
The F&A Rate recovery revenue is primarily from federal grants, and stayed relatively flat for fiscal
year 2017.
Expenses: Operating Expenses were higher by $28.8 million or 6.0% than fiscal year 2016. Salary
and other payroll expenses rose by 6.0% resulting from a 3% raise and some additional hiring.
Spending for services and supplies totaled $98.6 million, an increase of $5.7 million or 6.1% over
last year. Most increases were in maintenance and repairs, bad debt expense, interest expense
and consulting services. The primary sources of transfers in came from Royalties ($1.6 million)
and terminated plant funds ($0.5 million). Transfers out consisted of $4.0 million to Athletics, $4.5
million to Plant Funds and $2 million to various self-support funds.
The Education & General fund balance increased $14.8 million, resulting in a fund balance that is
15.6% of revenue.
Balance Sheet: The Balance Sheet represents institutional assets and liabilities on an accrual basis
as of June 30, 2017, including a comparison to June 30, 2016. Fund balance is an indicator of an
operation’s current financial condition. The fund balance changes over time, reflecting the
operating results for the reporting period and a surplus or a downturn in the organization’s
financial condition.
Assets: The cash balance for the Education and General funds increased by $18.5 million over
June 30 of the previous year due primarily to the cash inflow from operating activities and offset
by net transfers of $12.3 million.
Liabilities: The liabilities increased by $5.5 million due to an increase in liability for compensated
absences of $1.9 million, an increase in deferred revenues of $1.3 million, and an increase in
account payables of $1.4 million. Deferred revenues reflect monies receipted for Summer Session
and Summer Extended Campus revenue in fiscal year 2016 for fiscal year 2017.
Page 6 of 65 Unaudited - For Management Purposes Only

Fiscal year ending June 30, 2017
Increase2017 2016 (Decrease) % Change
AssetsCash 96,589,903$ 78,138,034$ 18,451,869$ 23.6%Accounts Receivable 41,651,887 37,660,415 3,991,472 10.6%Allowance for Doubtful Accounts (6,560,481) (6,453,376) 107,105 1.7%Inventories 877,814 945,406 (67,592) -7.1%Prepaid Expenses and Deferred Charges 4,222,451 3,955,081 267,370 6.8%Due from Other Funds 2,463,155 4,694,375 (2,231,220) -47.5%
Total Assets 139,244,729$ 118,939,935$ 20,519,004$ 17.3%
Liabilities and Fund Balance
Current LiabilitiesAccounts Payable 9,943,654$ 8,496,913$ 1,446,741$ 17.0%Salaries and Wages Payable 1,888,101 1,826,156 61,945 3.4%Compensated Absence Liability 12,359,531 11,343,515 1,016,016 9.0%Deposits 187,759 195,756 (7,997) -4.1%Deferred Revenues 27,062,763 24,311,628 2,751,135 11.3%Due to Other Funds 83,606 110,126 (26,520) -24.1%
Total Current Liabilities 51,525,414 46,284,094 5,241,320 11.3%
Non-Current LiabilitiesCompensated Absence Liability 4,387,800 4,092,411 295,389 7.2%
Total Liabilities 55,913,214 50,376,505 5,536,709 11.0%
Fund Balance 83,331,515 68,563,430 14,768,085 21.5%
Total Liabilities and Fund Balance 139,244,729$ 118,939,935$ 20,304,794$ 17.1%
Balance SheetEducation and General Funds
As of June 30,
Page 7 of 65 Unaudited - For Management Purposes Only

Fiscal year ending June 30, 2017
Increase %2017 2016 (Decrease) Change
RevenuesEnrollment Fees 387,963,322$ 372,615,527$ 15,347,795$ 4.1%Fee Remissions (37,680,269) (35,914,266) 1,766,003 4.9%State Appropriations 118,740,259 112,852,886 5,887,373 5.2%F&A Rate Recovery 38,943,993 39,347,789 (403,796) -1.0%Interest Revenues 6,257,928 3,522,287 2,735,641 77.7%Sales & Services 15,489,934 15,714,113 (224,179) -1.4%Other Revenues 3,738,568 4,342,215 (603,647) -13.9%
Total Revenues 533,453,735 512,480,551 24,505,190 4.8%
Expenses
Total Salaries and OPE 400,044,331 377,250,016 22,794,315 6.0%Service and Supplies 98,560,991 92,853,659 5,707,332 6.1%Capital Outlay 6,926,741 6,504,443 422,298 6.5%Student Aid 893,243 1,029,345 (136,102) -13.2%
Total Expenses 506,425,306 477,637,463 28,787,843 6.0%
Net Change From Operations 27,028,429 34,843,088 (7,814,659) -22.4%Transfers In 3,853,302 2,585,622 1,267,680 49.0%Transfers Out (16,113,646) (14,025,435) 2,088,211 14.9%
Net Increase (Decrease) in Fund Balance 14,768,085 23,403,275 (8,635,190) -36.9%
Beginning Fund Balance 68,563,430 45,160,155 23,403,275 51.8%Fund Deductions for Internal Loans - - - -
Ending Fund Balance 83,331,515$ 68,563,430$ 14,768,085$ 21.5%
For the Twelve Months Ending June 30, 2017 and 2016
Statement of Revenues, Expenses, and Other ChangesEducation and General Funds
Page 8 of 65 Unaudited - For Management Purposes Only

Fiscal year ending June 30, 2017
Beginning Cash as of July 1, 2016 78,138,034$
Net Cash provided (used) by Changes in Assets and Liabilities
June 2016 June 2017 ChangeAssets
Accounts Receivable (Net) 31,207,039$ 35,091,406$ (3,884,367)$ Inventories 945,406 877,814 67,592 Prepaid Expenses & Deferred Charges 3,955,081 4,222,451 (267,370) Due From Other Funds 4,694,375 2,463,155 2,231,220
LiabilitiesAccounts Payable 8,496,913 9,943,654 1,446,741 Salaries & Wages Payable 1,826,156 1,888,101 61,945 Compensated Absence Liab (Long/Short) 15,435,926 16,747,331 1,311,405 Deposits 195,756 187,759 (7,997) Due to Other Funds 110,126 83,606 (26,520) Deferred Revenues 24,311,628 27,062,763 2,751,135
Total Net Cash Provided (Used) by Changes in Assets and Liabilities 3,683,784
Cash Provided (Used) by Operating Activities
RevenueEnrollment Fees 387,963,322$ Fee Remissions (37,680,269) State Appropriations 118,740,259 F&A Rate Recovery 38,943,993 Interest Income 6,257,928 Sales & Services 15,489,934 Other Revenue 3,738,568
ExpenseTotal Salaries and OPE (400,044,331) Service and Supplies (98,560,991) Capital Outlay (6,926,741) Student Aid (893,243) Net Transfers (12,260,344)
Total Cash Provided (Used) by Operating Activities 14,768,085
Ending Cash as of June 30, 2017 96,589,903$
Statement of Cash FlowsEducation and General Funds
For the Twelve Months Ending June 30, 2017
Page 9 of 65 Unaudited - For Management Purposes Only

Fiscal year ending June 30, 2017
Increase2017 2016 (Decrease) % Change
AssetsCash 93,522,365$ 75,509,061$ 18,013,304$ 23.9%Accounts Receivable 41,015,304 36,405,061 4,610,243 12.7%Allowance for Doubtful Accounts (6,458,246) (5,659,942) 798,304 14.1%Inventories 877,814 945,406 (67,592) -7.1%Prepaid Expenses and Deferred Charges 4,222,451 3,954,326 268,125 6.8%Due from Other Funds 2,463,155 4,694,375 (2,231,220) -47.5%
Total Assets 135,642,843$ 115,848,287$ 21,391,164$ 18.5%
Liabilities and Fund Balance
Current LiabilitiesAccounts Payable 9,858,064 8,338,170 1,519,894 18.2%Salaries and Wages Payable 1,888,101 1,826,156 61,945 3.4%Compensated Absence Liability 12,359,531 11,339,004 1,020,527 9.0%Deposits 187,759 195,756 (7,997) -4.1%Deferred Revenues 26,219,434 23,420,136 2,799,298 12.0%Due to Other Funds 83,606 110,126 (26,520) -24.1%
Total Current Liabilities 50,596,495 45,229,348 5,367,147 11.9%
Non-Current LiabilitiesCompensated Absence Liability 4,387,800 4,092,411 295,389 7.2%
Total Liabilities 54,984,295 49,321,759 5,662,536 11.5%
Fund Balance 80,658,548 66,526,528 14,132,020 21.2%
Total Liabilities and Fund Balance 135,642,843$ 115,848,287$ 19,794,556$ 17.1%
Balance SheetEducation and General Funds - Corvallis
As of June 30,
Page 10 of 65 Unaudited - For Management Purposes Only

Fiscal year ending June 30, 2017
Increase %2017 2016 (Decrease) Change
RevenuesEnrollment Fees 379,967,339$ 365,462,355$ 14,504,984$ 4.0%Fee Remissions (37,439,801) (35,388,193) 2,051,608 5.8%State Appropriations 112,828,816 107,609,126 5,219,690 4.9%F&A Rate Recovery 38,943,993 39,347,789 (403,796) -1.0%Interest Revenues 6,259,323 3,519,598 2,739,725 77.8%Sales & Services 15,419,887 15,654,151 (234,264) -1.5%Other Revenues 3,720,986 4,335,415 (614,429) -14.2%
Total Revenues 519,700,543 500,540,241 23,263,518 4.6%
ExpensesTotal Salaries and OPE 389,213,854 368,290,982 20,922,872 5.7%Service and Supplies 95,510,738 90,110,425 5,400,313 6.0%Capital Outlay 6,706,053 6,502,562 203,491 3.1%Student Aid 893,193 1,029,295 (136,102) -13.2%
Total Expenses 492,323,838 465,933,264 26,390,574 5.7%
Net Change From Operations 27,376,705 34,606,977 (7,230,272) -20.9%Transfers In 2,868,961 2,501,759 367,202 14.7%Transfers Out (16,113,646) (15,739,102) 374,544 2.4%
Net Increase (Decrease) Fund Balance 14,132,020 21,369,634 (7,237,614) -33.9%
Beginning Fund Balance 66,526,528 45,156,894 21,369,634 47.3%
Ending Fund Balance 80,658,548$ 66,526,528$ 14,132,020$ 21.2%
Statement of Revenues, Expenses, and Other ChangesEducation and General Funds - CorvallisFor the Twelve Months Ending June 30, 2017 and 2016
Page 11 of 65 Unaudited - For Management Purposes Only

Fiscal year ending June 30, 2017
Beginning Cash as of July 1, 2016 75,509,061$
Net Cash provided (used) by Changes in Assets and Liabilities
June 2016 June 2017 ChangeAssets
Accounts Receivable (Net) 30,745,119$ 34,557,058$ (3,811,939)$ Inventories 945,406 877,814 67,592 Prepaid Expenses & Deferred Charges 3,954,326 4,222,451 (268,125) Due From Other Funds 4,694,375 2,463,155 2,231,220
LiabilitiesAccounts Payable 8,338,170 9,858,064 1,519,894 Salaries & Wages Payable 1,826,156 1,888,101 61,945 Compensated Absence Liab (Long/Short) 11,339,004 16,747,331 5,408,327 Deposits 195,756 187,759 (7,997) Due to Other Funds 23,420,136 83,606 (23,336,530) Deferred Revenues 110,126 26,219,434 26,109,308
Total Net Cash Provided (Used) by Changes in Assets and Liabilities 7,973,695
Cash Provided (Used) by Operating Activities
RevenueEnrollment Fees 379,967,339$ Fee Remissions (37,439,801) State Appropriations 112,828,816 F&A Rate Recovery 38,943,993 Interest Income 6,259,323 Sales & Services 15,419,887 Other Revenue 3,720,986
ExpenseTotal Salaries and OPE (389,213,854) Service and Supplies (95,510,738) Capital Outlay (6,706,053) Student Aid (893,193) Net Transfers (13,244,685)
Total Cash Provided (Used) by Operating Activities 14,132,020
Ending Cash as of June 30, 2017 97,614,776$
Statement of Cash FlowsEducation and General Funds - Corvallis
For the Twelve Months Ending June 30, 2017
Page 12 of 65 Unaudited - For Management Purposes Only

Fiscal year ending June 30, 2017
Increase2017 2016 (Decrease) % Change
AssetsCash 3,067,538$ 2,628,973$ 438,565$ 16.7%Accounts Receivable 636,583 561,195 75,388 13.4%Allowance for Doubtful Accounts (102,235) (99,275) 2,960 3.0%Inventories - - - -Prepaid Expenses and Deferred Charges - 755 (755) -Due from Other Funds - - - -
Total Assets 3,601,886$ 3,091,648$ 516,158$ 16.7%
Liabilities and Fund Balance
Current LiabilitiesAccounts Payable 85,590$ 158,744$ (73,154)$ -46.1%Salaries and Wages Payable - - - -Compensated Absence Liability - 4,510 (4,510) -Deposits - - - -Deferred Revenues 843,329 891,492 (48,163) -5.4%Due to Other Funds - - - -
Total Liabilities 928,919 1,054,746 (125,827) -11.9%
Fund Balance 2,672,967 2,036,902 636,065 31.2%
Total Liabilities and Fund Balance 3,601,886$ 3,091,648$ 510,238$ 16.5%
Balance SheetEducation and General Funds - Cascades
As of June 30,
Page 13 of 65Unaudited - For Managment Purposes Only

Fiscal year ending June 30, 2017
Increase %2017 2016 (Decrease) Change
RevenuesEnrollment Fees 7,995,983$ 7,153,172$ 842,811$ 11.8%Fee Remissions (240,468) (526,073) (285,605) -54.3%State Appropriations 5,911,443 5,243,760 667,683 12.7%Interest Revenues (1,395) 2,689 (4,084) -151.9%Sales & Services 70,047 59,962 10,085 16.8%Other Revenues 17,582 6,800 10,782 158.6%
Total Revenues 13,753,192 11,940,310 1,241,672 10.4%
ExpensesTotal Salaries and OPE 10,830,477 8,959,034 1,871,443 20.9%Service and Supplies 3,050,253 2,743,234 307,019 11.2%Capital Outlay 220,688 1,881 218,807 11632.5%Student Aid 50 50 - -
Total Expenses 14,101,468 11,704,199 2,397,269 20.5%Net Change From Operations (348,276) 236,111 (584,387) -247.5%Transfers In 984,341 83,606 900,735 1077.4%Transfers Out - 1,713,925 1,713,925 -100.0%
Net Increase (Decrease) in Fund Balance 636,065 2,033,642 (1,397,577) -68.7%
Beginning Fund Balance 2,036,902 3,260 2,033,642 62381.7%
Ending Fund Balance 2,672,967$ 2,036,902$ 636,065$ 31.2%
Statement of Revenues, Expenses, and Other ChangesEducation and General Funds - CascadesFor the Twelve Months Ending June 30, 2017 and 2016
Page 14 of 65Unaudited - For Managment Purposes Only

Fiscal year ending June 30, 2017
Beginning Cash as of July 1, 2016 2,628,973$
Net Cash provided (used) by Changes in Assets and Liabilities
June 2016 June 2017 ChangeAssets
Accounts Receivable (Net) 461,920$ 534,348$ (72,428)$ Inventories - - - Prepaid Expenses & Deferred Charges 755 - 755 Due From Other Funds - - -
LiabilitiesAccounts Payable 158,744 85,590 (73,154) Salaries & Wages Payable - - - Compensated Absence Liability 4,510 - (4,510) Deposits - - - Due to Other Funds - - - Deferred Revenues 891,492 843,329 (48,163)
Total Net Cash Provided (Used) by Changes in Assets and Liabilities (197,500)
Cash Provided (Used) by Operating Activities
RevenueEnrollment Fees 7,995,983$ Fee Remissions (240,468) State Appropriations 5,911,443 F&A Rate Recovery - Interest Income (1,395) Sales & Services 70,047 Other Revenue 17,582
ExpenseTotal Salaries and OPE (10,830,477) Service and Supplies (3,050,253) Capital Outlay (220,688) Student Aid (50) Net Transfers 984,341 Total Cash Provided (Used) by Operating Activities 636,065
Ending Cash as of June 30, 2017 3,067,538$
Statement of Cash FlowsEducation and General Funds - Cascades
For the Twelve Months Ending June 30, 2017
Page 15 of 65Unaudited - For Management Purposes Only

MANAGEMENT REPORTS
AGRICULTURAL EXPERIMENT STATION Fiscal year ending as of June 30, 2017
Background: The Agricultural Experiment Station (AES) is the principal agricultural research
agency of the State of Oregon. It conducts research in the agricultural, biological, social, and
environmental sciences for the social, economic, and environmental benefit of Oregonians. In
pursuing this mission, the Agricultural Experiment Station helps develop sustainable,
environmentally friendly and economically viable technologies and bio-based products from
renewable resources; enhances the capacity of managed landscapes and their biota to optimize
the production of ecosystem services such as biodiversity, carbon sequestration, bioremediation,
etc.; develops a wholesome, high value/high quality and safe food supply; provides enhanced
agricultural water resource management and watershed enhancement and sustainability;
sustainably addresses challenges facing Oregon’s agricultural producers of food, feed, fiber,
horticulture, and bio products; and develops opportunities and policies that improve the
economies, social vitality and quality of life of rural communities and individuals.
Revenues: Total revenues for AES increased by $1.6 million or 4.4% when compared to year
ending June 30, 2016. State appropriations increased $1.3 million or 4.3% from the previous fiscal
year. The year over year increase was mainly associated with the year over year allocation cycle.
Other government appropriations decreased $0.3 million, primarily due to decelerated spending
of Hatch funds offset by accelerated spending of county appropriations. Sales and services
revenue increased by $0.5 million primarily due to increased revenue from sales of fruit and
livestock, as well as revenue from a pollinator interagency agreement.
Expenses: Salary and OPE (Other Personnel Expenses) increased from $29.8 to $32.1 million, or
7.9%. Unclassified employee costs increased $2.1 million or 9%, reflecting hiring from the prior
year’s legislative package. Classified and student wage costs increased $0.2 million, or 5%.
Graduate student employee costs remained fairly level. The expense for services and supplies
increased $0.2 million or 2.9%, consistent with normal inflation. Capital outlay increased $0.1
million or 18.9% due to increased purchases of equipment such as agricultural machinery and
laboratory components (e.g., x-ray system and NMR spectrometer, etc.). Transfers remained fairly
flat.
Balance Sheet: The cash balance for AES decreased $0.4 million and the overall fund balance for
AES decreased $0.2 million to $4.5 million or 11.6% of revenue. The decrease in fund balance
equates well with the initial spending for start-up activities associated with new faculty hired from
the prior year’s legislative package.
Page 16 of 65 Unaudited - For Management Purposes Only

Fiscal year ending June 30, 2017
Increase2017 2016 (Decrease) % Change
AssetsCash 4,517,956$ 4,896,168$ (378,212)$ -7.7%Accounts Receivable 2,320,053 2,047,877 272,176 13.3%Prepaid Expenses and Deferred Charges 68,873 13,322 55,551 417.0%
Total Assets 6,906,882$ 6,957,367$ (50,485)$ -0.7%
Liabilities and Fund Balance
Current LiabilitiesAccounts Payable 313,788$ 247,325$ 66,463$ 26.9%Compensated Absence Liability 1,510,453 1,453,744 56,709 3.9%Due to Other Funds 20,902 27,532 (6,630) -24.1% Total Current Liabilities 1,845,143 1,728,601 116,542 6.7%
Non-Current LiabilitiesCompensated Absence Liability 536,231 516,099 20,132 3.9%
Total Liabilities 2,381,374 2,244,700 136,674 6.1%
Fund Balance 4,525,508 4,712,667 (187,159) -4.0%
Total Liabilities and Fund Balance 6,906,882$ 6,957,367$ (50,485)$ -0.7%
Balance SheetStatewide Operations
Agricultural Experiment Station
As of June 30,
Page 17 of 65 Unaudited - For Management Purposes Only

Fiscal year ending June 30, 2017
Increase %2017 2016 (Decrease) Change
RevenuesState Appropriations 32,271,744$ 30,949,322$ 1,322,422$ 4.3%Other Governmental Appropriations 4,322,708 4,605,037 (282,329) -6.1%Interest Revenues 256 206 50 24.3%Sales & Services 2,448,200 1,921,091 527,109 27.4%Other Revenues 70,540 5,254 65,286 1242.6%
Total Revenues 39,113,448$ 37,480,910$ 1,632,538$ 4.4%
ExpensesTotal Salaries and OPE 32,093,296$ 29,753,688$ 2,339,608$ 7.9%Service and Supplies 8,575,571 8,334,859 240,712 2.9%Capital Outlay 738,433 620,971 117,462 18.9%
Total Expenses 41,407,300 38,709,518 2,697,782 7.0%
Net Change From Operations (2,293,852) (1,228,608) (1,065,244) -86.7%Transfers In 2,417,475 2,550,973 (133,498) Transfers Out (310,782) (501,782) 191,000 38.1%
Net Increase (Decrease) in Fund Balance (187,159)$ 820,583$ (1,007,742)$ -122.8%
Beginning Fund Balance 4,712,667$ 3,892,084$ 820,583$ 21.1%
Ending Fund Balance 4,525,508$ 4,712,667$ (187,159)$ -4.0%
Statement of Revenues, Expenses, and Other ChangesStatewide Operations
Agricultural Experiment Station
For the twelve months ending June 30,
Page 18 of 65 Unaudited - For Management Purposes Only

Fiscal year ending June 30, 2017
Beginning Cash as of July 1, 2016 4,896,168$
Net Cash provided (used) by Changes in Assets and Liabilities
June 2016 June 2017 ChangeAssets
Accounts Receivable 2,047,877$ 2,320,053$ (272,176)$ Prepaid Expenses and Deferred Charges 13,322 68,873 (55,551)
LiabilitiesAccounts Payable 247,325 313,788 66,463 Liability for Compensated Absences 1,969,843 2,046,684 76,841 Due to Other Funds 27,532 20,902 (6,630)
Total Net Cash Provided (Used) by Changes in Assets and Liabilities (191,053)
Cash Provided (Used) by Operating Activities
RevenueState Appropriations 32,271,744$ Other Governmental Appropriations 4,322,708 Interest Income 256 Sales & Services 2,448,200 Other Revenue 70,540
ExpenseTotal Salaries and OPE (32,093,296) Service and Supplies (8,575,571) Capital Outlay (738,433) Net Transfers 2,106,693
Total Cash Provided (Used) by Operating Activities (187,159)
Cash as of June 30, 2017 4,517,956$
For the Twelve Months Ending June 30, 2017
Statement of Cash FlowsStatewide Operations
Agricultural Experiment Station
Page 19 of 65 Unaudited - For Management Purposes Only

MANAGEMENT REPORTS
EXTENSION SERVICE Fiscal year ending as of June 30, 2017
Background: OSU Extension Service provides education and information based on timely
research to help Oregonians solve problems and develop skills related to youth, family,
community, farm, forest, energy, and marine resources. Extension reaches across several colleges
and 37 county offices throughout the state. Funding sources include state appropriations, federal
formula revenues, county appropriations, and federal grants, as well as sales and service revenues.
Revenues: Total revenues were $40.9 million, up $2.6 million or 6.8% from the prior year.
Revenues from State Appropriations were increased 4.1% for fiscal year 2017 over fiscal year 2016.
Other Governmental Appropriations increased by $1.1 million or 7.5% due to increases in use of
Federal Funds and County Funds. As Extension base funding remains static or declining, other
sources of revenue are being developed. Sales and Services increased by $500 thousand, while
Other Revenue decreased by $110 thousand.
Expenses: Expenses increased by $3.6 million or 9.5% from the prior year. Salaries and Other
Payroll Expenses increased $3.2 million in fiscal year 2017 or 10.9%. Service and supplies expense
increased 3.9% or $295 thousand over the prior year. The main categories, which saw increases,
were the general administration overhead charge, Telecomm recurring charges, USSE
assessments, and other professional services. Capital Outlay expense increased by $16 thousand
over the prior year.
Balance Sheet: A decrease in Accounts Receivable of $782 thousand was attributable to receipt
of Federal Fund drawdowns and fiscal year 2017 fourth quarter County payments received before
to June 30, 2017, compared to delay in receipt for FY2016. An increase in cash of $1.6 million is
mainly due to receipt of Federal funding prior to June 30, when compared to delay in receipt for
FY2016.
Accounts Payable yearend balance decreased by $31 thousand due to timely receipt of invoices
and payment of fiscal year 2017 expenses.
Liability for Compensated Absences balance increased by $299 thousand, due to a combination
of increased salary and OPE rates and unused vacation leave.
A net increase in fund balance of $582 thousand brought the ending fund balance to $4.9 million,
or 13.3% of operating revenue.
Page 20 of 65 Unaudited - For Management Purposes Only

Fiscal year ending June 30, 2017
Increase2017 2016 (Decrease) % Change
AssetsCash 4,522,858$ 2,917,696$ 1,605,162$ 55.0%Accounts Receivable 3,210,935 3,993,578 (782,643) -19.6%Inventories 39,970 45,302 (5,332) -11.8%Prepaid Expenses and Deferred Charges 70,611 26,940 43,671 162.1%
Total Assets 7,844,374$ 6,983,516$ 860,858$ 12.3%
Liabilities and Fund Balance
Current LiabilitiesAccounts Payable 339,004$ 370,123$ (31,119)$ -8.4%Compensated Absence Liability 1,865,907 1,645,403 220,504 13.4%Deposits 14,528 13,128 1,400 10.7%Deferred Revenues 9,675 435 9,240 2124.1% Total Current Liabilities 2,229,114 2,029,089 200,025 9.9%
Non-Current Liabilities
Compensated Absence Liability 662,422 584,140 78,282 13.4%
Total Liabilities 2,891,536 2,613,229 278,307 10.6%
Fund Balance 4,952,838 4,370,287 582,551 13.3%
Total Liabilities and Fund Balance 7,844,374$ 6,983,516$ 78,282$ 1.1%
Balance SheetStatewide Operations Extension Service
As of June 30,
Page 21 of 65 Unaudited - For Management Purposes Only

Fiscal year ending June 30, 2017
Increase %2017 2016 (Decrease) Change
RevenueState Appropriations 23,256,785$ 22,344,755$ 912,030$ 4.1%Other Governmental Appropriations 15,527,283 14,438,094 1,089,189 7.5%Sales & Services 1,884,587 1,386,422 498,165 35.9%Other Revenues 254,224 143,661 110,563 77.0%
Total Revenues 40,922,879 38,312,932 2,609,947 6.8%
ExpensesTotal Salaries and OPE 33,141,408 29,891,906 3,249,502 10.9%Service and Supplies 7,770,779 7,475,573 295,206 3.9%Capital Outlay 201,430 185,268 16,162 8.7%
Total Expenses 41,113,617 37,552,747 3,560,870 9.5%
Net Change From Operations (190,738) 760,185 (950,923) -125.1%Transfers In 793,616 1,072,504 (278,888) -26.0%Transfers Out (20,327) - (20,327) -
Net Increase (Decrease) in Fund Balance 582,551$ 1,832,689$ (1,250,138)$ -68.2%
Beginning Fund Balance 4,370,287 2,537,598 1,832,689 72.2%
Ending Fund Balance 4,952,838$ 4,370,287$ 582,551$ 13.3%
Statement of Revenues, Expenses, and Other ChangesStatewide Operations Extension Service
For the twelve months ending June 30,
Page 22 of 65 Unaudited - For Management Purposes Only

Fiscal year ending June 30, 2017
Beginning Cash as of July 1, 2016 2,917,696$
Net Cash provided (used) by Changes in Assets and Liabilities
June 2016 June 2017 ChangeAssets
Accounts Receivable 3,993,578 3,210,935 782,643 Inventories 45,302 39,970 5,332 Prepaid Expenses and Deferred Charges 26,940 70,611 (43,671)
LiabilitiesAccounts Payable 370,123 339,004 (31,119) Liability for Compensated Absences 2,229,543 2,528,329 298,786 Deposits 13,128 14,528 1,400 Deferred Revenues 435 9,675 9,240
Total Net Cash Provided (Used) by Changes in Assets and Liabilities 1,022,611
Cash Provided (Used) by Operating Activities
RevenueState Appropriations 23,256,785 Other Governmental Appropriations 15,527,283 Sales & Services 1,884,587 Other Revenue 254,224
ExpenseTotal Salaries and OPE (33,141,408) Service and Supplies (7,770,779) Capital Outlay (201,430) Net Transfers 773,289
Total Cash Provided (Used) by Operating Activities 582,551
Cash as of June 30, 2017 4,522,858$
For the Twelve Months Ending June 30, 2017
Statement of Cash FlowsStatewide OperationsExtension Service
Page 23 of 65 Unaudited - For Management Purposes Only

MANAGEMENT REPORTS FOREST RESEARCH LABORATORY Fiscal year ending as of June 30, 2017
Background: The Forest Research Laboratory (FRL) is one of OSU’s top-tier strengths, with programs and faculty known globally for distinction in research, teaching and outreach. Over the past year, the FRL has supported the OSU strategic plan across all three thematic areas. The breadth of faculty and staff expertise, interests, and programs across the spectrum of natural resources science, management, and business is unmatched by any peer institution. This year the Center for World University Rankings scored OSU first in the nation and second in the world for Forestry, which is a testament to faculty efforts in all program areas.
The foundational sources of revenues for FRL are the state appropriation, federal formula funds and Oregon Harvest Tax. FRL research faculty and programs have been productive, and successfully leveraged state funds to obtain $11.6 million in new extramural funding through grants and cooperatives. Faculty and students continue to conduct research on maintaining productive forests and the quality of life they provide for Oregonians. Research is also addressing timely natural resources issues such as climate, carbon, water quality, ecosystem services, bioenergy, and sustainable green building practices. FRL research and outreach programs support the state’s economy by helping to maintain industry competitiveness, developing new products and markets, and providing jobs. The Tall Wood Design Institute, a collaboration with OSU College of Engineering and University of Oregon School of Architecture & Allied Arts, is utilizing FRL scientists to help open the U.S. market for advanced, structural wood products and construction.
Revenues: The large increase in Other Governmental Appropriations (McIntire-Stennis capacity funds) reflects outcomes from Federal budgeting and appropriating delays. The fiscal year 2016 appropriation was under-stated due to the three-month difference between Federal and OSU fiscal years.
Expenses: Overall, increase in expenses for FRL reflect new faculty hires, start-up activity for new faculty labs/programs, and increases in employee compensation packages. Additionally, the study of the Marbled Murrelet, part of the Institute for Working Forest Landscape, became fully engaged this year.
Balance Sheet: Decrease in Fund Balance is reflective of increased activities as explained above.
Page 24 of 65 Unaudited - For Management Purposes Only

Fiscal year ending June 30, 2017
Increase2017 2016 (Decrease) % Change
AssetsCash 2,397,572$ 2,858,257$ (460,685)$ -16.1%Accounts Receivable 33,673 29,923 3,750 12.5%Prepaid Expenses and Deferred Charges 8,982 4,400 4,582 104.1%
Total Assets 2,440,227$ 2,892,580$ (452,353)$ -15.6%
Liabilities and Fund Balance
Current LiabilitiesAccounts Payable 197,230$ 45,837$ 151,393$ 330.3%Compensated Absence Liability 386,493 357,568 28,925 8.1%
Total Current Liabilities 583,723 403,405 180,318 44.7%
Non-Current Liabilities
Compensated Absence Liability 137,210 126,942 10,268 8.1%
Total Liabilities 720,933 530,347 190,586 35.9%
Fund Balance 1,719,294 2,362,233 (642,939) -27.2%
Total Liabilities and Fund Balance 2,440,227$ 2,892,580$ (452,353)$ -15.6%
Balance SheetStatewide Operations
Forest Research Laboratory
As of June 30,
Page 25 of 65 Unaudited - For Management Purposes Only

Fiscal year ending June 30, 2017
Increase %2017 2016 (Decrease) Change
RevenueState Appropriations 4,983,265$ 4,787,842$ 195,423$ 4.1%Other Governmental Appropriations 1,098,228 573,417 524,811 91.5%Transfers From State Agencies 3,318,757 3,130,235 188,522 6.0%Sales & Services 292,281 271,859 20,422 7.5%Other Revenues (4,737) 4,788 (9,525) -198.9%
Total Revenue 9,687,794$ 8,768,141$ 919,653$ 10.5%
ExpensesTotal Salaries and OPE 8,429,621$ 7,958,428$ 471,193$ 5.9%Service and Supplies 2,473,095 1,454,754 1,018,341 70.0%Capital Outlay 136,861 95,466 41,395 43.4%
Total Expenses 11,039,577 9,508,648 1,530,929 16.1%
Net Change From Operations (1,351,783) (740,507) (611,276) -82.5%Transfers In 708,844 743,458 (34,614) -4.7%Transfers Out - (5,000) 5,000 -
Net Increase (Decrease) in Fund Balance (642,939)$ (2,049)$ (640,890)$ -31278.2%
Beginning Fund Balance 2,362,233 2,364,282 (2,049) -0.1%
Ending Fund Balance 1,719,294$ 2,362,233$ (642,939)$ -27.2%
Statement of Revenues, Expenses, and Other ChangesStatewide Operations
Forest Research Laboratory
For the twelve months ending June 30,
Page 26 of 65 Unaudited - For Management Purposes Only

Fiscal year ending June 30, 2017
Beginning Cash as of July 1, 2016 2,858,257$
Net Cash provided (used) by Changes in Assets and Liabilities
June 2016 June 2017 ChangeAssets
Accounts Receivable 29,923 33,673 (3,750) Prepaid Expenses and Deferred Charges 4,400 8,982 (4,582)
LiabilitiesAccounts Payable 45,837 197,230 151,393 Liability for Compensated Absences 484,510 523,703 39,193
Total Net Cash Provided (Used) by Changes in Assets and Liabilities 182,254
Cash Provided (Used) by Operating Activities
RevenueState Appropriations 4,983,265 Other Governmental Appropriations 1,098,228 Transfers From State Agencies 3,318,757 Sales & Services 292,281 Other Revenue (4,737)
ExpenseTotal Salaries and OPE (8,429,621) Service and Supplies (2,473,095) Capital Outlay (136,861) Net Transfers 708,844
Total Cash Provided (Used) by Operating Activities (642,939)
Cash as of June 30, 2017 2,397,572$
For the Twelve Months Ending June 30, 2017
Statement of Cash FlowsStatewide Operations
Forest Research Laboratory
Page 27 of 65 Unaudited - For Management Purposes Only

Fiscal year ending June 30, 2017
Increase2017 2016 (Decrease) % Change
Assets
Current AssetsCash 12,691,272$ 15,218,227$ (2,526,955)$ -16.6%Accounts Receivable 3,200,500 2,684,342 516,158 19.2%Allowance for Doubtful Accounts (438,180) (431,124) (7,056) 1.6%Inventories 330,215 300,203 30,012 10.0%Prepaid Expenses 30,066 7,667 22,399 292.1%
Total Current Assets 15,813,873 17,779,315 (1,965,442) -11.1%
Non-Current AssetsFixed Assets 200,258,880 196,195,018 4,063,862 2.1%Accumulated Depreciation (78,081,156) (74,617,158) (3,463,998) 4.6%
Total Non-Current Assets 122,177,724 121,577,860 599,864 0.5%
Total Assets 137,991,597$ 139,357,175$ (1,365,578)$ -1.0%
Liabilities and Fund Balance
Current LiabilitiesAccounts Payable 1,678,718$ 1,880,810$ (202,092)$ -10.7%Compensated Absence Liability 730,032 629,343 100,689 16.0%Deferred Revenues 1,385,093 894,664 490,429 54.8%Deposits 18,759 5,623 13,136 233.6%Current Portion of Prem/Disc 77,421 72,198 5,223 7.2%Current Portion of Long Term Liabilities 4,767,980 4,515,318 252,662 5.6%
Total Current Liabilities 8,658,003 7,997,956 660,047 8.3%
Non-Current LiabilitiesInternal Bank Loan 103,982,200 108,750,179 (4,767,979) -4.4%Compensated Absence Liability 259,171 223,425 35,746 - Premium/Discount 1,470,746 1,548,167 (77,421) -5.0%
Total Non-Current Liabilities 105,712,117 110,521,771 (4,809,654) -4.4%
Total Liabilities 114,370,120 118,519,727 (4,149,607) -3.5%
Fund Balance 23,621,477 20,837,448 2,784,029 13.4%
Total Liabilities and Fund Balance 137,991,597$ 139,357,175$ (1,365,578)$ -1.0%
Working CapitalCurrent Assets 15,813,873$ 17,779,315$ (1,965,442)$ -11.1%Less: Current Liabilities 8,658,003 7,997,956 (660,047) -8.3%
End of Period Working Capital 7,155,870$ 9,781,359$ (2,625,489)$ -26.8%
Balance SheetAuxiliary Funds - University Housing & Dining Services
As of June 30,
Page 28 of 65 Unaudited - For Management Purposes Only

Fiscal year ending June 30, 2017
Increase %2017 2016 (Decrease) Change
Revenue
Interest Revenue 84,290$ 113,225$ (28,935)$ -25.6%Sales & Services 53,531,109 49,379,489 4,151,620 8.4%Other Revenue 28,754 24,232 4,522 18.7%Internal Sales 1,929,061 1,943,122 (14,061) -0.7%
Total Revenue 55,573,214 51,460,068 4,113,146 8.0%
Expenses
Total Salaries and OPE 21,582,508 19,383,185 2,199,323 11.3%Service and Supplies 25,084,937 24,805,297 279,640 1.1%Depreciation 4,581,149 4,270,869 310,280 7.3%
Total Expenses 51,248,594 48,459,351 2,789,243 5.8%
Net Change From Operations 4,324,620 3,000,717 1,323,903 44.1%Fixed Asset Disposal Gain/(Loss) (2,142) (306,100) 303,958 99.3%Transfers In 1,042,738 309,293 733,445 237.1%Transfers Out (5,437,455) (8,640,500) 3,203,045 37.1%
Net Increase (Decrease) in Fund Balance (72,239) (5,636,590) 5,564,351 98.7%
Beginning Operations Fund Balance 17,035,736 14,365,861 2,669,875 18.6%NIP Change in Fixed Assets 5,051,496 5,944,220 (892,724) -15.0%Fund Additions/Deductions for Internal Loans - 2,362,245 (2,362,245) -Fund Additions for Bonded Debt - - - -
Ending Fund Balance From Operations 22,014,993$ 17,035,736$ 4,979,257$ 29.2%
Beginning Plant Fund Balance 3,801,712$ 1,810,714$ 1,990,998$ 110.0%Plant Revenue - Interest 38,890 6,504 32,386 497.9%Gift Revenue 311,366 1,212,954 (901,588) -74.3%Sales & Service Revenue (6,650) - (6,650) -Expenses (6,267,417) (7,594,595) 1,327,178 -17.5%Transfers In 5,435,000 8,040,000 (2,605,000) -32.4%Transfers Out (1,674,181) 293,900 (1,968,081) -669.6%Fund Additions/Deductions (32,236) 32,235 (64,471) -200.0%
Ending Plant Fund Balance 1,606,484$ 3,801,712$ (2,195,228)$ -57.7%
Statement of Revenues, Expenses, and Other ChangesAuxiliary Funds - University Housing & Dining Services
For the twelve months ending June 30,
Page 29 of 65 Unaudited - For Management Purposes Only

MANAGEMENT REPORTS
AUXILIARY OPERATIONS, STUDENT CENTERS
& ACTIVITIES Fiscal year ending June 30, 2017
Background: The auxiliary operations and associated reserve funds, record transactions relating primarily
to the operations of the Memorial Union, Memorial Union Retail Food Services, Student Recreation
Center, Student Leadership and Involvement, Diversity & Cultural Engagement and Cultural Centers,
Associated Students of Oregon State University (ASOSU), Student Sustainability Initiative, Human Services
Resource Center and Family Resource Center. The OSU Incidental Fees Clearing Funds are the originating
fund used for distribution of the Student Fees to appropriate auxiliaries.
Revenues: Overall total revenue for these operations increased by $923 thousand or 2.8%. The increase
in revenue was mainly attributed to an increase in enrollment fees. Student fee revenues increased by
$18.49 to $362.81 for fiscal year 2017 resulting in higher revenue. Gifts, Grants & Contracts decreased by
$16 thousand or 48.0% as fewer in-kind gift receipts were recognized. Interest income was $95.8
thousand more than the prior year due to higher percentage earnings from the Public University Fund
(PUF) and additional cash on hand within auxiliary funds. Sales and Services revenue decreased $273
thousand or 4.1% over prior year due to reduced rental income from external customers as facilities
underwent space renovations. Additional decreases were seen in membership sales and food sales. Other
revenue decreased 72.9% or $185 thousand over the previous year. Other revenue for fiscal year 2016
ending was higher due to a one-time transfer of cash balances which moved to the Recreational Sports
auxiliary fund where financial activity for the Sponsored Student Organizations now occurs. For fiscal year
2017, regular financial activity within the auxiliary fund resumed. Internal Sales increased slightly by $32
thousand due to increased rental income from OSU customers.
Expenses: Overall total expenses increased $324 thousand or 1.1% for fiscal year 2017. Salaries and Other
Payroll Expenses remained flat over fiscal year 2016 with an increase of $21.8 thousand or 0.2%. Service
and Supplies expense also saw a conservative increase $154 thousand or 1.1% over the prior year.
Depreciation expense increased $147 thousand or 4.3% as minimal asset additions were added to
inventory for fiscal year 2017. Transfers out to plant increased $2.3 million or 860% due to capital repair
project undertakings for the Memorial Union and Recreational Sports. Overall plant fund balances saw
minimal change decreasing $131.2 thousand or 2.8% for fiscal year 2017.
Balance Sheet: Total assets for all student centers decreased 1.1% over the prior fiscal year. Cash
decreased by $1.0 million. Fixed Assets decreased by $2.5 million or 1.9% as accounting records for Snell
Hall were updated and ownership transferred from the Student Centers to the General Fund. Total
Liabilities decreased by $2.5 million or 3.9% primarily due to a reduction in internal bank loan liability and
accounts payable. Total working capital for all Student Center funds ended at $20.3 million, a reduction
of 1.4% from prior fiscal year.
Page 30 of 65 Unaudited - For Management Purposes Only

Fiscal year ending June 30, 2017
Increase2017 2016 (Decrease) % Change
AssetsCurrent Assets
Cash 28,901,858$ 25,257,733$ 3,644,125$ 14.4%Accounts Receivable 1,534,753 1,407,513 127,240 9.0%Allowance for Doubtful Accounts (239,861) (245,496) 5,635 -2.3%Inventories - 16,528 (16,528) -Prepaid Expenses and Deferred Charges 16,719 12,575 4,144 33.0%Due From Other Funds 104,508 437,658 (333,150) -76.1%
Total Current Assets 30,317,977 26,886,511 3,431,466 12.8%
Non-Current AssetsCash - 3,866,011 (3,866,011) -Fixed Assets 130,004,180 132,512,488 (2,508,308) -1.9%Accumulated Depreciation (33,362,721) (34,880,562) 1,517,841 -4.4%
Total Non-Current Assets 96,641,459 101,497,937 (4,856,478) -4.8%
Total Assets 126,959,436$ 128,384,448$ (1,425,012)$ -1.1%
Liabilities and Fund BalanceCurrent Liabilities
Accounts Payable 1,515,154$ 2,608,840$ (1,093,686)$ -41.9%Compensated Absence Liability 405,241 398,039 7,202 1.8%Deposits 217,768 207,936 9,832 4.7%Deferred Revenues 1,604,537 1,576,306 28,231 1.8%Current Portion of Long Term Liabilities 1,456,657 1,383,092 73,565 5.3%Current Portion of Premium/Discount 39,755 41,555 (1,800) -4.3%
Total Current Liabilities 5,239,112 6,215,768 (976,656) -15.7%
Non-Current LiabilitiesInternal Bank Loan 55,487,579 56,944,237 (1,456,658) -2.6%Compensated Absence Liability 143,866 141,309 2,557 1.8%Premium/Discount 268,790 308,545 (39,755) -12.9%
Total Non-Current Liabilities 55,900,235 57,394,091 (1,493,856) -2.6%Total Liabilities 61,139,347 63,609,859 (2,470,512) -3.9%
Fund Balance 65,820,089 64,774,589 1,045,500 1.6%
Total Liabilities and Fund Balance 126,959,436$ 128,384,448$ (1,425,012)$ -1.1%
Working Capital
Current Assets 30,317,977$ 26,886,511$ 3,431,466$ 12.8%Current Liabilities 5,239,112 6,215,768 (976,656) -15.7%
End of Period Working Capital 25,078,865$ 20,670,743$ 4,408,122$ 21.3%
Balance SheetAuxiliary Funds - Student Centers & Activities/Fee Clearing
As of June 30,
Page 31 of 65 Unaudited - For Management Purposes Only

Fiscal year ending June 30, 2017
Increase2017 2016 (Decrease) % Change
Revenue
Enrollment Fees 26,152,292$ 24,883,028$ 1,269,264$ 5.1%Gifts, Grants & Contracts 17,399 33,465 (16,066) -48.0%Interest Income 488,530 392,723 95,807 24.4%Sales & Services 6,298,777 6,571,437 (272,660) -4.1%Other Revenue 68,885 254,255 (185,370) -72.9%Internal Sales 730,238 698,116 32,122 4.6%
Total Revenue 33,756,121$ 32,833,024$ 923,097$ 2.8%
Expenses
Total Salaries and OPE 13,490,546$ 13,468,730$ 21,816$ 0.2%Service and Supplies 13,815,826 13,661,023 154,803 1.1%Depreciation 3,600,458 3,453,037 147,421 4.3%
Total Expenses 30,906,830 30,582,790 324,040 1.1%
Net Change From Operations 2,849,291 2,250,234 599,057 26.6%Fixed Asset Disposal Gain/(Loss) - (729) 729 -Transfers In - From Education & General 248,383 212,738 35,645 16.8%Transfers In - Other 819,992 225,973 594,019 262.9%Transfers Out - Incidental Fee Resources (2,673,568) (2,659,142) (14,426) 0.5%Transfers Out - Other (2,061,899) 271,083 (2,332,982) -860.6%
Net Increase (Decrease) in Fund Balance (817,801) 300,157 (1,117,958) -372.5%
Beginning Operations Fund Balance 60,004,786 52,813,160 7,191,626 13.6%NIP Change in Fixed Assets 2,294,860 6,586,217 (4,291,357) -65.2%Fund Additions from Other Funds 1,528,805 1,605,085 (76,280) -4.8%Fund Additions/Deductions Internal Loan - 5,251 (5,251) -Fund Deductions to Other Funds (1,828,805) (1,305,084) (523,721) 40.1%
Ending Fund Balance From Operations 61,181,845$ 60,004,786$ 1,177,059$ 2.0%
Beginning Plant Fund Balance 4,769,803$ 9,577,127$ (4,807,324)$ -50.2%
Building Fee 3,194,728 3,236,770 (42,042) -1.3%Gift Revenue - 6,030 (6,030) -Interest Revenue 83,462 48,428 35,034 72.3%Expenses (4,935,048) (4,931,521) (3,527) 0.1%Transfers In 2,044,443 (392,530) 2,436,973 620.8%Transfers Out (519,144) (780,343) 261,199 -33.5%Fund Additions (Deductions) - (1,994,158) 1,994,158 -
Ending Plant Fund Balance 4,638,244$ 4,769,803$ (131,559)$ -2.8%
Statement of Revenues, Expenses, and Other ChangesAuxiliary Funds - Student Centers & Activities/Fee Clearing
For the twelve months ending June 30,
Page 32 of 65 Unaudited - For Management Purposes Only

MANAGEMENT REPORTS – Auxiliary Operations
ATHLETICS Fiscal year ending June 30, 2017
Background: This auxiliary operation, associated reserve and plant funds, record transactions related to
Athletics’ activities at OSU. These programs involve approximately 500 student athletes in a variety of
sports including: football, baseball, softball, men’s and women’s basketball, women’s volleyball, women’s
track and field, women’s cross country, men’s and women’s soccer, men’s and women’s rowing, men’s
wrestling, women’s swimming, and men’s and women’s golf, and additional students in a variety of
support roles such as band, cheer, student trainers, and managers. In addition to the Auxiliary funds,
Athletics received $4,000,000 in support from the Education and General Fund and $8.2 million in gifts
and donations in fiscal year 2017.
Revenues: Revenue for Athletics was higher than fiscal year 2016 by $9.2 million or 17.3% mainly due to
an increase in Sales and Services income as well as Other Revenue. The reason for the increase in Sales
and Services was due to improved ticket revenue, and increased NCAA/PAC-12 distributions. A
contractual buyout contributed to Other Revenue. The PAC-12 Conference has also had an increased
distribution due to the successes of the participation in Bowl games as well as increased distribution of
television channels.
Expenses: Total expenses increased $6.1 million or 8.8% with the changes coming from a number of
areas including services and supplies, salaries and OPE as well as depreciation. Services and supplies
increased $3M, which was in large part due to the addition to the Whyte Track and the hosting of the
PAC-12 Championships. There was a $2.1 million increase in Salaries and OPE due to contractual
obligations for many coaches and bonuses from successful seasons.
Balance Sheet: Total Assets increased approximately $6.2 million or 4.4% primarily due to the increase in
Fixed Assets. Total liabilities increased $6.2M or 4.4% largely due to the Valley Football Center projects
internal bank loan.
Page 33 of 65 Unaudited - For Management Purposes Only

Fiscal year ending June 30, 2017
Increase2017 2016 (Decrease) % Change
AssetsCurrent Assets
Cash (27,783,928)$ (12,839,323)$ (14,944,605)$ 116.4%Accounts Receivable 8,326,622 4,719,447 3,607,175 76.4%Allowance for Doubtful Accounts - (19) 19 -Inventories (3,873) (6,171) 2,298 37.2%Prepaid Expenses and Deferred Charges 178,453 96,151 82,302 85.6%
Total Current Assets (19,282,726) (8,029,915) (11,252,811) -140.1%Non-Current Assets
Cash - - - Fixed Assets 234,161,035 210,663,940 23,497,095 11.2%Accumulated Depreciation (66,386,986) (60,348,084) (6,038,902) 10.0%
Total Non-Current Assets 167,774,049 150,315,856 17,458,193 11.6%Total Assets 148,491,323$ 142,285,941$ 6,205,382$ 4.4%
Liabilities and Fund BalanceCurrent Liabilities
Accounts Payable 4,126,671$ 12,021,297$ (7,894,626)$ -65.7%Compensated Absence Liability 637,043 577,943 59,100 10.2%Employee Termination Liability - Current - 16,733 (16,733) -Deferred Revenues 8,220,032 6,207,169 2,012,863 32.4%Current Portion of Prem/Disc 220,807 233,393 (12,586) -5.4%Current Portion of Long Term Liabilities 3,525,861 4,314,902 (789,041) -18.3%
Total Current Liabilities 16,730,414 23,371,437 (6,641,023) -28.4%Non-Current Liabilities
Internal Bank Loan 101,692,344 89,982,379 11,709,965 13.0%Compensated Absence Liability 226,159 205,178 20,981 10.2%Premium/Discount 2,102,606 2,323,413 (220,807) -9.5%Employee Termination Liability - 1,405,505 (1,405,505) -
Total Non-Current Liabilities 104,021,109 93,916,475 10,104,634 10.8%
Total Liabilities 120,751,523 117,287,912 3,463,611 3.0%Fund Balance 27,739,800 24,998,029 2,741,771 11.0%Total Liabilities and Fund Balance 148,491,323$ 142,285,941$ 6,205,382$ 4.4%
Working CapitalCurrent Assets (19,282,726)$ (8,029,915)$ (11,252,811)$ 140.1%Less: Current Liabilities 16,730,414 23,371,437 (6,641,023) -28.4%
End of Period Working Capital (36,013,140)$ (31,401,352)$ (4,611,788)$ 14.7%
-See page for Gift Fund revenue and expense information.
Balance SheetAuxiliary Funds - Athletics
As of June 30,
Page 34 of 65 Unaudited - For Management Purposes Only

Fiscal year ending June 30, 2017
Increase %2017 2016 (Decrease) Change
RevenueGifts, Grants, and Contracts 192,967$ 99,110$ 93,857$ 94.7%Interest Income 738,814 767,831 (29,017) -3.8%Lottery Proceeds 453,200 453,200 - 0.0%Sales & Services 57,125,874 50,234,903 6,890,971 13.7%Other Revenue 3,923,795 1,679,256 2,244,539 133.7%Internal Sales 32,523 18,189 14,334 78.8%
Total Revenue 62,467,173 53,252,489 9,214,684 17.3%
ExpensesTotal Salaries and OPE 26,290,826 24,165,076 2,125,750 8.8%Service and Supplies 33,282,723 30,270,467 3,012,256 10.0%Student Aid 10,196,712 10,293,619 (96,907) -0.9%Depreciation 6,160,407 5,037,537 1,122,870 22.3%
Total Expenses 75,930,668 69,766,699 6,163,969 8.8%
Net Change From Operations (13,463,495) (16,514,210) 3,050,715 18.5%Fixed Asset Disposal Gain/(Loss) (89,171) (50,470) (38,701) -76.7%Transfers In - Incidental Fees 2,673,568 2,659,141 14,427 0.54%Transfers In - From Education & General 4,000,000 4,197,000 (197,000) -4.7%Transfers In - Other 661,173 977,671 (316,498) -32.4%Transfers Out (3,731,975) (16,742,237) 13,010,262 -77.7%
Net Increase (Decrease) in Fund Balance (9,949,900) (25,473,105) 15,523,205 60.9%
Beginning Operations Fund Balance 24,305,992 22,858,546 1,447,446 6.3%NIP Change in Fixed Assets 23,062,359 21,691,219 1,371,140 6.3%Fund Additions for Internal Loans 7,479,554 7,479,554 -Fund Deductions for Internal Loans (18,400,479) 5,229,332 (23,629,811) -451.9%
Ending Fund Balance From Operations 26,497,526$ 24,305,992$ 2,191,534$ 9.0%
Beginning Plant Fund Balance 692,604$ 371,192$ 321,412$ 86.6%Interest Revenues 34,538 10,253 24,285 236.9%Gift Revenues 6,767,581 7,240,076 (472,495) -6.5%Sales & Service Revenues - 150,000 (150,000) -Expenses (24,153,669) (22,724,573) (1,429,096) 6.3%Transfers In 21,868,500 16,602,237 5,266,263 31.7%Transfers Out (3,946,190) (977,671) (2,968,519) 303.6%Fund Additions for Bonded Debt (21,090) 21,090 (42,180) -200.0%
Ending Plant Fund Balance 1,242,274$ 692,604$ 549,670$ 79.4%
Statement of Revenues, Expenses, and Other ChangesAuxiliary Funds - Athletics
-See page for Gift Fund revenue and expense information.
For the twelve months ending June 30,
Page 35 of 65 Unaudited - For Management Purposes Only

MANAGEMENT REPORTS – Auxiliary Operations STUDENT HEALTH SERVICES & CAPS Fiscal year ending June 30, 2017
Background: Student health care services are comprised of two separate programs that work together to provide comprehensive care to the students of Oregon State University.
Student Health Services (SHS) provides comprehensive primary care medical services, psychiatry, health education, and a variety of ancillary medical services. The Health Services Fee provides the funding for primary care and psychiatry office visits and health promotion services. “Fees for services” (charges for services) fund ancillary services such as lab, x-rays, physical therapy, etc.
Counseling and Psychological Services (CAPS) provides a variety of services, both individual and group, to help students address psychological challenges and difficulties. The CAPS staff is dedicated to helping students by providing brief counseling sessions, or if there is a need for more intensive or specialized care, by helping students connect with an appropriate mental health service provider in the community. The Health Services Fees funds the general counseling visits provided by CAPS.
Revenue: Total operational revenue rose by $1.18 million or 6.7% from fiscal year 2016. The change was due to an increase in enrollment revenue of $355 thousand and an increase in Other Revenue of $721 thousand to the Student Health operating fund. This revenue is the administration fees related to the Graduate Health Insurance Plan, due to Student Health Services, from the Graduate Health Insurance agency fund. FY2017 sales and services revenue and internal sales remained relatively flat over fiscal year 2016. Expenses: Total Health Services operating expenses including reserves saw conservative increases over the previous fiscal year, increasing by $513 thousand or 2.8%. Salaries and OPE comprised the bulk of the increase up 5.0% from $10.2 million in fiscal year 2016 to $10.7 million ending fiscal year 2017. The increase was due to general pay increases for both unclassified and classified staff and the addition of FTE to vacant positions from fiscal year 2016 for Student Health Services. Services and supplies remained flat over the prior year. Plant expenses decreased $270 thousand over fiscal year 2016 as CAPS completed the renovation of space in Snell Hall (valued at $270 thousand), improving group rooms within the facility as well as adding additional space to accommodate students and staff in fiscal year 2016. The project spanned fiscal years 2015, 2016 and 2017.
Balance Sheet: Total assets for health services decreased 1.0% over the prior fiscal year. The cash balance increased by $867 thousand from the previous fiscal year due to additions to Student Health operating fund for administration fees related to the Graduate Health Insurance Plan. Accounts Receivable balances also increased 4.5% while current liabilities decreased as Accounts Payable and the Liability for Compensated Absence decreased. As a result, of these changes, the Working Capital for both Health units consolidated increased by 10.6% from the prior year from $9.2 million to $10.1 million.
Page 36 of 65 Unaudited - For Management Purposes Only

Fiscal year ending June 30, 2017
Increase2017 2016 (Decrease) % Change
Assets
Current AssetsCash 10,556,762$ 9,689,199$ 867,563$ 9.0%Accounts Receivable 1,261,704 1,207,454 54,250 4.5%Allowance for Doubtful Accounts (202,630) (213,599) 10,969 -5.1%Prepaid Expenses and Deferred Charges 20,751 31,308 (10,557) -33.7%
Total Current Assets 11,636,587 10,714,362 922,225 8.6%
Non-Current AssetsCash - 966,928 (966,928) -Fixed Assets 4,142,983 4,101,646 41,337 1.0%Accumulated Depreciation (2,200,900) (2,073,696) (127,204) 6.1%
Total Non-Current Assets 1,942,083 2,994,878 (1,052,795) -35.2%
Total Assets 13,578,670$ 13,709,240$ (130,570)$ -1.0%
Liabilities and Fund Balance
Current LiabilitiesAccounts Payable 196,414$ 255,521$ (59,107)$ -23.1%Compensated Absence Liability 323,924 326,913 (2,989) -0.9%Deferred Revenues 931,151 923,268 7,883 0.9%
Total Current Liabilities 1,451,489 1,505,702 (54,213) -3.6%
Non-Current Liabilities
Compensated Absence Liability 114,996 116,058 (1,062)
Fund Balance 12,012,185 12,087,480 (75,295) -0.6%
Total Liabilities and Fund Balance 13,578,670$ 13,709,240$ (130,570)$ -1.0%
Working CapitalCurrent Assets 11,636,587$ 10,714,362$ 922,225$ 8.6%Less: Current Liabilities 1,451,489 1,505,702 (54,213) -3.6%
End of Period Working Capital 10,185,098$ 9,208,660$ 976,438$ 10.6%
Balance SheetAuxiliary Funds - Health Services
As of June 30,
Page 37 of 65 Unaudited - For Management Purposes Only

Fiscal year ending June 30, 2017
Increase %2017 2016 (Decrease) Change
RevenueEnrollment Fees 10,584,838$ 10,229,675$ 355,163$ 3.5%Interest Income 201,449 173,916 27,533 15.8%Sales & Services 7,015,225 6,957,836 57,389 0.8%Other Revenue 951,749 209,231 742,518 354.9%Internal Sales 32,856 30,465 2,391 7.8%
Total Revenue 18,786,117$ 17,601,123$ 1,184,994$ 6.7%
ExpensesTotal Salaries and OPE 10,683,092$ 10,178,487$ 504,605$ 5.0%Service and Supplies 8,081,021 8,067,931 13,090 0.2%Depreciation 127,203 131,396 (4,193) -3.2%
Total Expenses 18,891,316 18,377,814 513,502 2.8%
Net Change From Operations (105,199) (776,691) 671,492 86.5%Transfers In - From Education & General 24,000 101,000 (77,000) -76.2%Transfers In - Other 5,991 57,758 (51,767) -89.6%
Net Increase (Decrease) in Fund Balance (75,208) (617,933) 542,725 87.8%
Beginning Operations Fund Balance 12,084,159 12,702,092 (617,933) -4.9%
Ending Fund Balance From Operations 12,008,951$ 12,084,159$ (75,208)$ -0.6%
Beginning Plant Fund Balance 3,321$ 317,006$ (313,685)$ -99.0%Plant Revenue - Interest 44 2,290 (2,246) -98.1%Expenses 3,490 (267,341) 270,831 101.3%Transfers Out - (52,255) 52,255 -Fund Additions/Deductions (3,621) 3,621 (7,242) -200.0%
Ending Plant Fund Balance 3,234$ 3,321$ (87)$ -2.6%
Statement of Revenues, Expenses, and Other ChangesAuxiliary Funds - Health Services
For the twelve months ending June 30,
Page 38 of 65 Unaudited - For Management Purposes Only

MANAGEMENT REPORTS
AUXILIARY OPERATIONS, Parking Services
Fiscal year ending June 30, 2017
Background: Parking Services is an auxiliary operation within Transportation Services and records
transactions related to the operation of parking infrastructure, Beaver Bus (campus) shuttle, and bicycle
rentals on the OSU Corvallis campus through operating, reserve and plant funds. The primary revenue
source is vehicle parking fees paid by OSU commuters, residents, and visitors. Parking revenue is used
for the construction, maintenance, and management of all parking facilities on the OSU Corvallis campus.
Parking revenue also funds the operating and capital expenses of the Beaver Bus shuttle, as well as the
department’s transportation options program, which provides education, facilities, and programs to
reduce parking demand by helping people get to campus without driving alone.
Revenues: In fiscal year 2017, total revenue for the auxiliary operation decreased 3.5% from fiscal year
2016. While the operation experienced an increase in sales and services revenue, due to a greater number
of parking permit sales, there was a large reduction in gift revenue that led to the overall decrease in
revenue. This gift revenue does not reflect any cash transactions; it is the category used to record the
transfer of new parking lot assets from a contruction project fund to the Transportation Services auxiliary
fund for ongoing maintenance and management.
Expenses: Total Expenses increased 3.2% in fiscal year 2017 from the previous fiscal year. Within the total,
there was an increase in Salary and Other Payroll Expenses of 16.5% over fiscal year 2016 largely due to
filling vacant positions . In addition, there was a decrease in total Service and Supplies expenses of 12.5%
from fiscal year 2016, partly due to capital project expenses spanning the 2017 fiscal year end. Lastly,
depreciation expenses increased 24.4% from the previous fiscal year due to the newly acquired parking
lot and vehicle assets.
Balance Sheet: Total Current Assets increased by 15.4% from fiscal year 2016 due to an increase in cash
from Sales and Services as well as the reversal of a plant fund from a cancelled construction project.
Total Current Liabilities increased from fiscal year 2016 by 33.7%, largely due to an increase in accounts
payable for capital renewal projects.
Page 39 of 65 Unaudited - For Management Purposes Only

Fiscal year ending June 30, 2017
Increase2017 2016 (Decrease) % Change
Assets
Current AssetsCash 5,769,104$ 4,995,685$ 773,419$ 15.5%Accounts Receivable 60,406 57,025 3,381 5.9%Allowance for Doubtful Accounts (9,490) (9,745) 255 -2.6%
Total Current Assets 5,820,020 5,042,965 777,055 15.4%
Non-Current AssetsFixed Assets 26,826,346 25,714,583 1,111,763 4.3%Accumulated Depreciation (10,459,165) (9,888,201) (570,964) 5.8%
Total Non-Current Assets 16,367,181 15,826,382 540,799 3.4%
Total Assets 22,187,201$ 20,869,347$ 1,317,854$ 6.3%
Liabilities and Fund BalanceCurrent Liabilities
Accounts Payable 352,453$ 192,771$ 159,682$ 82.8%Compensated Absence Liability 27,442 24,834 2,608 10.5%Current Portion of Prem/Disc 27,440 28,544 (1,104) -3.9%Current Portion of Long Term Liabilities 290,117 275,465 14,652 5.3%
Total Current Liabilities 697,452 521,614 175,838 33.7%
Non-Current Liabilities
Internal Bank Loan 6,657,907 6,948,024 (290,117) -4.2%Premium/Discount 242,841 270,281 (27,440) -10.2%Compensated Absence Liability 9,742 8,816 926 10.5%
Total Non-Current Liabilities 6,910,490 7,227,121 (316,631) -4.4%
Total Liabilities 7,607,942 7,748,735 (140,793) -1.8%
Fund Balance 14,579,259 13,120,612 1,458,647 11.1%
Total Liabilities and Fund Balance 22,187,201$ 20,869,347$ 1,317,854$ 6.3%
Working CapitalCurrent Assets 5,820,020$ 5,042,965$ 777,055$ 15.4%Less: Current Liabilities 697,452 521,614 175,838 33.7%
End of Period Working Capital 5,122,568$ 4,521,351$ 601,217$ 13.3%
Balance SheetAuxiliary Funds - Parking Services
As of June 30,
Page 40 of 65 Unaudited - For Management Purposes Only

Fiscal year ending June 30, 2017
Increase %2017 2016 (Decrease) Change
Revenue
Gifts 14,487$ 593,018$ (578,531)$ -97.6%Interest Revenue 41,841 22,983 18,858 82.1%Sales & Services 3,833,543 3,412,776 420,767 12.3%Other Revenue 9,029 3,419 5,610 164.1%Internal Sales 272,080 290,214 (18,134) -6.2%
Total Revenue 4,170,980 4,322,410 (151,430) -3.5%
ExpensesTotal Salaries and OPE 974,497 836,162 138,335 16.5%Service and Supplies 1,255,490 1,435,269 (179,779) -12.5%Depreciation 666,833 535,933 130,900 24.4%
Total Expenses 2,896,820 2,807,364 89,456 3.2%
Net Change From Operations 1,274,160 1,515,046 (240,886) -15.9%Fixed Asset Disposal Gain/(Loss) (25,378) - (25,378) - Transfers In 388,159 865 387,294 44773.9%Transfers Out (2,468,200) (49,000) (2,419,200) 4937.1%
Net Increase (Decrease) in Fund Balance (831,259) 1,466,911 (2,298,170) -156.7%
Beginning Operations Fund Balance 13,120,612 8,986,651 4,133,961 46.0%NIP Change in Fixed Assets 773,038 2,667,050 (1,894,012) -71.0%
Ending Fund Balance From Operations 13,062,391$ 13,120,612$ (58,221)$ -0.4%
Beginning Plant Fund Balance -$ -$ -$ -Plant Revenue - Interest 13,318 - 13,318 -Expenses (467,490) - (467,490) -Transfers In 2,359,200 - 2,359,200 -Transfers Out (388,160) - (388,160) -
Ending Plant Fund Balance 1,516,868$ -$ 1,516,868$ -
Statement of Revenues, Expenses, and Other ChangesAuxiliary Funds - Parking Services
For the twelve months ending June 30,
Page 41 of 65 Unaudited - For Management Purposes Only

Fiscal year ending June 30, 2017
Increase2017 2016 (Decrease) % Change
Assets
Current AssetsCash 2,854,095$ 5,725,849$ (2,871,754)$ -50.2%Accounts Receivable 115,036 3,086,141 (2,971,105) -96.3%Allowance for Doubtful Accounts (12,057) (4,115) (7,942) 193.0%Inventories 12,016 - 12,016 - Prepaid Expense - 15,294 (15,294) 0.0%
Total Current Assets 2,969,090 8,823,169 (5,854,079) -66.3%
Non-Current AssetsFixed Assets 40,091,959 20,384,501 19,707,458 96.7%Accumulated Depreciation (602,234) (2,669) (599,565) 22464.0%
Total Non-Current Assets 39,489,725 20,381,832 19,107,893 93.7%
Total Assets 42,458,815$ 29,205,001$ 13,253,814$ 45.4%
Liabilities and Fund BalanceCurrent Liabilities
Accounts Payable 2,021,862$ 7,412,923$ (5,391,061)$ -72.7%Compensated Absence Liability 25,705 3,649 22,056 604.4%Deferred Income 71,588 36,739 34,849 94.9%
Total Current Liabilities 2,119,155 7,453,311 (5,334,156) -71.6%
Non-Current LiabilitiesInternal Bank Loan 41,827,323 - 41,827,323 - Compensated Absence Liability 9,125 1,295 7,830 604.6%
Total Non-Current Liabilities 41,836,448 1,295 41,835,153
Total Liabilities 43,955,603 7,454,606 36,500,997 489.6%
Fund Balance (1,496,788) 21,750,395 (23,247,183) -106.9%
Total Liabilities and Fund Balance 42,458,815$ 29,205,001$ 13,253,814$ 45.4%
Working CapitalCurrent Assets 2,969,090$ 8,823,169$ (5,854,079)$ -66.3%Less: Current Liabilities 2,119,155 7,453,311 (5,334,156) -71.6%
End of Period Working Capital 849,935$ 1,369,858$ (519,923)$ -38.0%
Balance SheetAuxiliary Funds - OSU-Cascades
As of June 30,
Page 42 of 65 Unaudited - For Management Purposes Only

Fiscal year ending June 30, 2017
Increase %2017 2016 (Decrease) Change
Revenue
Enrollment Fees 551,627$ 451,198$ 100,429$ 22.3%Interest Revenue 12,916 11,482 1,434 12.5%Sales & Services 571,719 3,994 567,725 14214.4%Other Revenue 3,605 7,095 (3,490) -49.2%Internal Sales 304,642 1,245 303,397 24369.2%
Total Revenue 1,444,509 475,014 969,495 204.1%
ExpensesTotal Salaries and OPE 654,228 189,513 464,715 245.2%Service and Supplies 901,882 217,858 684,024 314.0%Student Aid 3,370 8,674 (5,304) -61.1%Depreciation 599,565 654 598,911 91576.6%
Total Expenses 2,159,045 416,699 1,742,346 418.1%
Net Change From Operations (714,536) 58,315 (772,851) -1325.3%Transfers Out - (500,000) (500,000) -
Net Increase (Decrease) in Fund Balance (714,536) (441,685) (1,272,851) -288.2%
Beginning Operations Fund Balance 20,798,261 860,674 19,937,587 2316.5%NIP Change in Fixed Assets 19,691,613 20,379,272 (687,659) -3.4%Fund Deductions for Internal Loans (41,827,323) - (41,827,323) -
Ending Fund Balance From Operations (2,051,985)$ 20,798,261$ 17,977,077$ 86.4%
Beginning Plant Fund Balance 952,134$ (1,088,774)$ 2,040,908$ 187.5%Building Fee 122,538 118,114 4,424 3.7%Gift Revenue 2,144,736 19,252,072 (17,107,336) -88.9%Interest Revenues 9,880 35,672 (25,792) -72.3%Other Revenue 84,981 16 84,965 531034.2%Expenses (22,467,995) (41,295,008) 18,827,014 -45.6%Transfers In 59,763,745 26,642,799 33,120,947 124.3%Transfers Out (39,767,580) - (39,767,580) - Fund Additions (Deductions) (287,244) (2,712,756) 2,425,512 -89.4%
Ending Plant Fund Balance 555,197$ 952,134$ (396,937)$ -41.7%
Statement of Revenues, Expenses, and Other ChangesAuxiliary Funds - OSU-Cascades
For the twelve months ending June 30,
Page 43 of 65 Unaudited - For Management Purposes Only

MANAGEMENT REPORTS
AUXILIARY OPERATIONS, MISCELLANEOUS Fiscal year ending June 30, 2017
Background: Funds in this group of miscellaneous auxiliary operations includes Forestry’s
and Agriculture’s Experiment Station dwelling rentals, LaSells Stewart Center, Conference
Services, Food Innovation Center, Student Health Center Pharmacy, Library Document
Services, Health & Human Sciences Locker Room Service, Faculty/Staff Fitness Programs,
Wireless Instructional Network and Program, Physics Equipment Deposits, Foundation
Center Building, student fee clearing funds, and building rentals.
Revenues: Total revenue was $772K more than fiscal year 2016, due to an increase in
Conference Services income.
Expenses: Total expenses were $581 thousand more than fiscal year 2016 primarily due
to Conference Services and Pharmacy. For Conference Services, the increase was due to
associated expenses related to the previously mentioned increase in revenues.
Pharmacy’s additional expense was due to an increase in vaccination clinics.
Page 44 of 65 Unaudited - For Management Purposes Only

Fiscal year ending June 30, 2017
Page 45 of 65Unaudited - For Management Purposes Only
Increase2017 2016 (Decrease) % Change
Assets
Current AssetsCash 6,292,219$ 5,207,497$ 1,084,722$ 20.8%Accounts Receivable 105,953 104,379 1,574 1.5%Allowance for Doubtful Accounts (15,827) (17,363) 1,536 -8.8%Inventories 94,934 99,346 (4,412) -4.4%Prepaid Expenses and Deferred Charges 152,609 18,966 133,643 704.6%
Total Current Assets 6,629,888 5,412,825 1,217,063 22.5%
Non-Current AssetsFixed Assets 3,352,931 3,286,957 65,974 2.0%Accumulated Depreciation (2,804,763) (2,755,447) (49,316) 1.8%
Total Non-Current Assets 548,168 531,510 16,658 3.1%
Total Assets 7,178,056$ 5,944,335$ 1,233,721$ 20.8%
Liabilities and Fund Balance
Current LiabilitiesAccounts Payable 78,481$ 47,039$ 31,442$ 66.8%Compensated Absence Liability 43,897 40,181 3,716 9.2%Deposits 4,431 4,431 - 0.0%Deferred Revenues 885,582 (91,674) 977,256 1066.0%
Total Current Liabilities 1,012,391 (23) 1,012,414 4401800.0%
Non-Current Liabilities
Compensated Absence Liability 15,584 14,265 1,319 9.2%
Fund Balance 6,150,081 5,930,093 219,988 3.7%
Total Liabilities and Fund Balance 7,178,056$ 5,944,335$ 1,233,721$ 20.8%
Working CapitalCurrent Assets 6,629,888$ 5,412,825$ 1,217,063$ 22.5%Less: Current Liabilities 1,012,391 (23) 1,012,414 4401800.0%
End of Period Working Capital 5,617,497$ 5,412,848$ 204,649$ 3.8%
Balance SheetAuxiliary Funds - Miscellaneous
As of June 30,

Fiscal year ending June 30, 2017
Page 46 of 65Unaudited - For Management Purposes Only
Increase %2017 2016 (Decrease) Change
RevenueEnrollment Fees (154,320)$ 119,442$ (273,762)$ -229.2%Interest Income 49,798 36,284 13,514 37.2%Sales & Services 4,223,139 3,273,697 949,442 29.0%Other Revenue 3,208 1,075 2,133 198.4%Internal Sales 457,243 490,902 (33,659) -6.9%
Total Revenue 4,579,068$ 3,921,400$ 657,668$ 16.8%
ExpenseTotal Salaries and OPE 1,601,569$ 1,447,220$ 154,349$ 10.7%Service and Supplies 2,721,821 2,301,383 420,438 18.3%Depreciation 49,316 42,665 6,651 15.6%
Total Expense 4,372,706 3,791,268 581,438 15.3%
Net Change From Operations 206,362 130,132 76,230 58.6%Fixed Asset Disposal Gain/(Loss) - - - -Transfers In 13,626 11,359 2,267 20.0%Transfers Out - (1,782) 1,782 -
Net Increase (Decrease) in Fund Balance 219,988 139,709 80,279 57.5%
Beginning Operations Fund Balance 5,930,093 5,790,384 139,709 2.4%
Ending Fund Balance From Operations 6,150,081$ 5,930,093$ 219,988$ 3.7%
Beginning Plant Fund Balance -$ 915$ (915)$ -Expenses - (915) 915 -Transfers In - - - -
Ending Plant Fund Balance -$ -$ -$ -
Statement of Revenues, Expenses, and Other ChangesAuxiliary Funds - Miscellaneous
For the twelve month ending June 30,

MANAGEMENT REPORTS
SERVICE CENTER, INFRASTRUCTURE SERVICES Fiscal Year Ending June 30, 2017
Background: These funds record transactions related to on- and off-campus network and enterprise
systems support. These Network/Telecom support services provided are for non-OSU locations (prior-
OUS entities & Capital Center) as well as the OSU community. Telecom provides and maintains a host
of local and long distance phone services and equipment including cellular phones, pagers, voicemail,
data network connections, wireless network, maintenance of the physical wire plant on campus, and
audio and video conference capabilities.
Revenues: Total revenues for fiscal year 2017 increased by $506 thousand or 6.7% from the previous
year. The net change is the result of an increase in internal sales revenue of $679 thousand and a
decrease in sales & services revenue of $173 thousand. The significant increase was primarily due to a
2016 billing model change that better captures operational costs of network infrastructure provisions
and supports planned infrastructure upgrades. The decrease in sales and service revenue is due to the
winding down of the Inter-Institution Telecomm Network consortium (INOC), which ends 12/31/17,
coupled with OHSU pulling out of the consortium.
Expenses: Total expenses decreased by $537 thousand or 7.2% from the previous year due to a decrease
of $362 thousand in supplies and services resulting from delays in infrastructure enhancements for the
new data center. Depreciation expenses also decreased by a $198 thousand. These reductions were
slightly offset by a $23 thousand increase in salaries and OPE.
Balance Sheet: Current Assets increased by $1.24 million or 173.2% between fiscal year 2016 and fiscal
year 2017. This change was primarily due to increases in cash of $1.4 million, brought on by the
increased revenues noted above coupled with delayed expenses in the 4th quarter for the data center.
Accounts Receivable increased by $6 thousand. These increases were marginally offset by a decrease of
pre-paid expenses of $185 thousand and a reduction of the Telecom storeroom inventory of $15
thousand.
Total Liabilities decreased by 13.9% between fiscal years 2016 and 2017. This change was due primarily
to a decrease in Deferred Income of $45 thousand and recognition of ODOT revenue for Managed
Communications conference services. Compensated Absence Liability also decreased by $12 thousand.
Page 47 of 65 Unaudited - For Management Purposes Only

Fiscal year ending June 30, 2017
Increase2017 2016 (Decrease) % Change
AssetsCurrent Assets
Cash 1,784,608$ 352,335$ 1,432,273$ 406.5%Accounts Receivable 52,548 46,590 5,958 12.8%Inventories 35,170 49,850 (14,680) -29.4%Prepaid Expenses 81,072 266,281 (185,209) -69.6%
Total Current Assets 1,953,398 715,056 1,238,342 173.2%
Non-Current AssetsFixed Assets 8,482,865 8,710,090 (227,225) -2.6%Accumulated Depreciation (8,111,159) (8,196,741) 85,582 1.0%
Total Non-Current Assets 371,706 513,349 (141,643) -27.6%
Total Assets 2,325,104$ 1,228,405$ 1,096,699$ 89.3%
Liabilities and Fund Balance
Current LiabilitiesAccounts Payable 124,796 124,942 (146) -0.1%Compensated Absence Liability 129,557 138,466 (8,909) -6.4%Deferred Income 55,922 101,226 (45,304) -44.8%
Total Current Liabilities 310,275 364,634 (54,359) -14.9%
Non-Current Liabilities
Compensated Absence Liability 45,995 49,157 (3,162) -6.4%
Fund Balance 1,968,834 814,614 1,154,220 141.7%
Total Liabilities and Fund Balance 2,325,104$ 1,228,405$ 1,096,699$ 89.3%
Working CapitalCurrent Assets 1,953,398$ 715,056$ 1,238,342$ 173.2%Less: Current Liabilities 310,275 364,634 (54,359) -14.9%
End of Period Working Capital 1,643,123$ 350,422$ 1,292,701$ 368.9%
Balance SheetService Center Funds - Infrastructure Services
For the twelve months ending June 30,
Page 48 of 65 Unaudited - For Management Purposes Only

Fiscal year ending June 30, 2017
Increase %2017 2016 (Decrease) Change
RevenueSales & Services 799,580$ 972,476$ (172,896)$ -17.8%Internal Sales 7,251,664 6,572,754 678,910 10.3%
Total Revenue 8,051,244$ 7,545,230$ 506,014$ 6.7%
ExpenseTotal Salaries and OPE 3,030,390 3,007,728 22,662 0.8%Service and Supplies 3,666,494 4,028,180 (361,686) -9.0%Depreciation 220,347 418,793 (198,446) -47.4%
Total Expense 6,917,231 7,454,701 (537,470) -7.2%
Net Change From Operations 1,134,013 90,529 1,043,484 1152.7%Fixed Asset Disposal Gain/(Loss) (3,912) (1,633) (2,279) 139.6%Transfers In 25,137 94,578 (69,441) -73.4%
Net Increase (Decrease) in Fund Balance 1,155,238 183,474 971,764 529.6%
Beginning Operations Fund Balance 814,614 633,557 181,057 28.6%NIP Change in Fixed Assets (1,018) (2,417) 1,399 -57.9%
Ending Fund Balance From Operations 1,968,834$ 814,614$ 1,154,220$ 141.7%
Statement of Revenues, Expenses, and Other ChangesService Center Funds - Infrastructure Services
For the twelve months ending June 30,
Page 49 of 65 Unaudited - For Management Purposes Only
MANAGEMENT REPORTS SERVICE CENTERS
Printing & Mailing ~ Motor Pool Fiscal year ending June 30, 2017
PRINTING & MAILING SERVICES
Background: This fund records financial transactions related to printing and mailing services provided primarily to OSU departments. Printing and Mailing (P&M) does provide some services to customers outside of the University.
Revenues: Printing and Mailing generated revenues of $5.4 million in fiscal year 2017 or $79 thousand (1.5%) less than the prior fiscal year. The decrease to revenue is partly from the increased effort by both P&M and Admissions to better track the print inventory needs of Admissions. The majority of the order quantities reduced in FY2017 were due to the change in the format of the commencement program this year. Additional revenue reductions come from a few large projects not printed in FY2017.
Expenses: In fiscal year 2017, Printing & Mailing’s total expenses were $6.2 million or $750 thousand (13.7%) more than fiscal year 2016. The increase in expenses was due to purchasing a new fleet of copiers.
Balance Sheet: Printing & Mailing’s assets increased by $2.4 million (133.9%) between fiscal years 2016 and 2017 due to the copiers purchase. Liabilities increased by $3.3 million primarily due to an increase in accounts payable for the fleet copiers expense and an increase due to Other Funds for the loan to purchase the machines.
Transportation Services – MOTOR POOL
Background: This service center fund records financial transactions related to vehicle rental and repair services provided by Motor Pool. OSU departments are the primary users of this service. Other public agencies, including the University of Oregon, also rent vehicles from OSU’s Motor Pool.
Revenues: Total revenues for fiscal year 2017 decreased by $4,996 or 0.2%.
Expenses: Expenses for Motor Pool increased $28,935 (1.1%) due to the fluctuations in fuel prices in FY2017.
Balance Sheet: Motor Pool’s working capital at the end of fiscal year 2017, totaled $1.808 million, a 0.1% increase. Total non-current assets increased $104 thousand, or 3.3%. Total current liabilities increased $13, 037 or 11.7% due largely to a 40.5% increase in accounts payable.
Page 50 of 65 Unaudited - For Management Purposes Only

Fiscal year ending June 30, 2017
Increase2017 2016 (Decrease) % Change
Assets
Current AssetsCash 2,839,809$ 1,391,602$ 1,448,207$ 104.1%Accounts Receivable 84,930 132,756 (47,826) -36.0%Inventories 174,005 226,862 (52,857) -23.3%Prepaid Expense 74,655 - 74,655
Total Current Assets 3,173,399 1,751,220 1,422,179 81.2%
Non-Current AssetsFixed Assets 1,818,848 711,033 1,107,815 155.8%Accumulated Depreciation (745,376) (646,819) (98,557) 15.2%
Total Non-Current Assets 1,073,472 64,214 1,009,258 1571.7%
Total Assets 4,246,871$ 1,815,434$ 2,431,437$ 133.9%
Liabilities and Fund Balance
Current LiabilitiesAccounts Payable 1,509,393$ 127,344$ 1,382,049$ 1085.3%Compensated Absence Liability 74,210 53,905 20,305 37.7%Due to Other Funds 88,881 - 88,881 -
Total Current Liabilities 1,672,484 181,249 1,491,235 822.8%
Non-Current Liabilities
Compensated Absence Liability 26,345 19,137 7,208 37.7%
Due to Other Funds 1,772,811 - 1,772,811 -
Fund Balance 775,231 1,615,048 (839,817) -52.0%
Total Liabilities and Fund Balance 4,246,871$ 1,815,434$ 2,431,437$ 133.9%
Working CapitalCurrent Assets 3,173,399$ 1,751,220$ 1,422,179$ 81.2%Less: Current Liabilities 1,672,484 181,249 1,491,235 822.8%
End of Period Working Capital 1,500,915$ 1,569,971$ (69,056)$ -4.4%
Balance SheetService Center Funds - Printing & Mailing
For the twelve months ending June 30,
Page 51 of 65 Unaudited - For Management Purposes Only

Fiscal year ending June 30, 2017
Increase %2017 2016 (Decrease) Change
RevenueSales & Service Revenue 659,249$ 719,498$ (60,249)$ -8.4%Other Revenue 310 376 (66) -17.6%Internal Sales 4,725,325 4,744,348 (19,023) -0.4%
Total Revenue 5,384,884$ 5,464,222$ (79,338)$ -1.5%
ExpenseTotal Salaries and OPE 1,771,035 1,547,096 223,939$ 14.5%Service and Supplies 4,355,108 3,909,017 446,091 11.4%Depreciation 98,558 16,515 82,043 496.8%
Total Expense 6,224,701 5,472,628 752,073 13.7%
Net Change From Operations (839,817) (8,406) (831,411) -9890.7%Transfers In - - - -
Net Increase (Decrease) in Fund Balance (839,817) (8,406) (831,411) -9890.7%
Beginning Operations Fund Balance 1,615,048 1,623,454 (8,406) -0.5%Fund Additions/Deductions - - - -
Ending Fund Balance From Operations 775,231$ 1,615,048$ (839,817)$ -52.0%
Statement of Revenues, Expenses, and Other ChangesService Center Funds - Printing & Mailing
For the twelve months ending June 30,
Page 52 of 65 Unaudited - For Management Purposes Only

Fiscal year ending June 30, 2017
Increase2017 2016 (Decrease) % Change
Assets
Current AssetsCash 1,841,026$ 1,834,514$ 6,512$ 0.4%Accounts Receivable 92,463 97,598 (5,135) -5.3%Inventories (19,575) (13,656) (5,919) -43.3%Prepaid Expense 18,872 - 18,872 -
Total Current Assets 1,932,786 1,918,456 14,330 0.7%
Non-Current AssetsFixed Assets 9,073,840 9,184,997 (111,157) -1.2%Accumulated Depreciation (5,820,470) (6,036,376) 215,906 3.6%
Total Non-Current Assets 3,253,370 3,148,621 104,749 3.3%
Total Assets 5,186,156$ 5,067,077$ 119,079$ 2.4%
Liabilities and Fund Balance
Current LiabilitiesAccounts Payable 88,947$ 63,327$ 25,620$ 40.5%Compensated Absence Liability 35,422 48,005 (12,583) -26.2%
Total Current Liabilities 124,369 111,332 13,037 11.7%
Non-Current Liabilities
Compensated Absence Liability 12,575
Fund Balance 5,049,212 4,955,745 93,467 1.9%
Total Liabilities and Fund Balance 5,186,156$ 5,067,077$ 119,079$ 2.4%
Working CapitalCurrent Assets 1,932,786$ 1,918,456$ 14,330$ 0.7%Less: Current Liabilities 124,369 111,332 13,037 11.7%
End of Period Working Capital 1,808,417$ 1,807,124$ 1,293$ 0.1%
Balance SheetService Center Funds - Motor Pool
For the twelve months ending June 30,
Page 53 of 65 Unaudited - For Management Purposes Only

Fiscal year ending June 30, 2017
Increase %2017 2016 (Decrease) Change
RevenueSales & Service Revenue 594,939$ 624,915$ (29,976)$ -4.8%Other Revenue 75,091 8,670 66,421 766.1%Revenue from OUS Depts 2,011,292 2,052,733 (41,441) -2.0%
Total Revenue 2,681,322$ 2,686,318$ (4,996)$ -0.2%
ExpenseTotal Salaries and OPE 732,246 745,700 (13,454)$ -1.8%Service and Supplies 1,242,804 1,276,768 (33,964) -2.7%Depreciation 612,360 536,007 76,353 14.2%
Total Expense 2,587,410 2,558,475 28,935 1.1%
Net Change From Operations 93,912 127,843 (33,931) -26.5%Transfers In - - - -
Net Increase (Decrease) in Fund Balance 93,912 127,843 (33,931) -26.5%
Beginning Operations Fund Balance 4,955,745 4,827,902 127,843 2.6%NIP Change in Fixed Assets (445) - (445) -Fund Additions/Deductions - - - -
Ending Fund Balance From Operations 5,049,212$ 4,955,745$ 93,467$ 1.9%
Statement of Revenues, Expenses, and Other ChangesService Center Funds - Motor Pool
For the twelve months ending June 30,
Page 54 of 65 Unaudited - For Management Purposes Only

MANAGEMENT REPORTS
SERVICE CENTERS, CLIENT SERVICES Fiscal year ending June 30, 2017
Background: This fund records the transactions related to desktop and tablet management
expenses incurred by OSU operations. Client Services provides and maintains OSU-owned
computing desktops, including Community Network customer devices, shared computer lab
workstations, and laptops and tablets available via our equipment checkout. Client Services
facilitates and supports the ways our communities interface with OSU technologies.
Revenues: Overall revenues decreased by $54 thousand or 2.8% compared to fiscal year 2016.
This decline is reflected by the decreases in external sales of $7 thousand and in internal sales of
$47 thousand. The small reduction in revenue was due to expense reductions passed on to
customers.
Expenses: Overall expenses decreased by $57 thousand or 3.0% compared to fiscal year 2016,
with a $65 thousand decrease in Salaries and OPE due to a management vacancy, offset by an
increase in Supplies and Services costs of $12 thousand. Depreciation also decreased by $4
thousand.
Balance Sheet: Current Assets increased by $11 thousand or 4.9% between fiscal year 2016 and
fiscal year 2017. This change reflects a decrease in accounts receivable of $9 thousand and a
decrease in expenditures in fiscal year 2017.
Total Liabilities increased by nearly $2 thousand or 1.73% between fiscal year 2016 and fiscal year
2017 due to an increase in Accounts Payable of $10 thousand and decreases in Compensated
Absences Liability of $9 thousand.
Page 55 of 65 Unaudited - For Management Purposes Only

Fiscal year ending June 30, 2017
Increase2017 2016 (Decrease) % Change
Assets
Current AssetsCash 226,674$ 206,929$ 19,745$ 9.5%Accounts Receivable - 9,080 (9,080) -100.0%Prepaid Expense - - - -
Total Current Assets 226,674 216,009 10,665 4.9%
Non-Current AssetsFixed Assets 8,477 30,141 (21,664) -71.9%Accumulated Depreciation (5,652) (22,370) 16,718 74.7%
Total Non-Current Assets 2,825 7,771 (4,946) -63.6%
Total Assets 229,499$ 223,780$ 5,719$ 2.6%
Liabilities and Fund Balance
Current LiabilitiesAccounts Payable 10,945$ 539$ 10,406$ 1930.6%Compensated Absence Liability 67,926 74,287 (6,361) -8.6%
Total Current Liabilities 78,871 74,826 4,045 5.4%Non-Current Liabilities
Compensated Absence Liability 24,114 26,373 (2,259)$ -8.6%
Fund Balance 126,514 122,581 3,933 3.2%
Total Liabilities and Fund Balance 229,499$ 223,780$ 5,719$ 2.6%
Working CapitalCurrent Assets 226,674$ 216,009$ 10,665$ 4.9%Less: Current Liabilities 78,871 74,826 4,045 5.4%
End of Period Working Capital 147,803$ 141,183$ 6,620$ 4.7%
Balance SheetService Center Funds - Client Services
For the twelve months ending June 30,
Page 56 of 65 Unaudited - For Management Purposes Only

Fiscal year ending June 30, 2017
Increase %2017 2016 (Decrease) Change
Revenue
Sales & Service Revenue 10,427$ 17,786$ (7,359)$ -41.4%
Other Revenue 1,051 Internal Sales 1,845,557 1,892,236 (46,679) -2.5%
Total Revenue 1,857,035 1,910,022 (54,038) -2.8%
Expense
Total Salaries and OPE 1,738,805 1,804,217 (65,412)$ -3.6%Service and Supplies 89,729 77,378 12,351 16.0%Depreciation 2,418 6,028 (3,610) -59.9%
Total Expense 1,830,952 1,887,623 (56,671) -3.0%
Net Change From Operations 26,083 22,399 3,684 16.4%Fixed Asset Disposal Gain/(Loss) (2,528) - - -Transfers Out (19,622) - (19,622) -
Net Increase (Decrease) in Fund Balance 3,933 22,399 (15,938) -71.2%
Beginning Operations Fund Balance 122,581$ 100,182$ 22,399$ 22.4%Fund Additions/Deductions - - - -
Ending Fund Balance From Operations 126,514$ 122,581$ 6,461$ 5.3%
Statement of Revenues, Expenses, and Other ChangesService Center Funds - Client Services
For the twelve months ending June 30,
Page 57 of 65 Unaudited - For Management Purposes Only

MANAGEMENT REPORTS SERVICE CENTERS, Miscellaneous Fiscal year ending June 30, 2017
Background: These funds include the following operations: Campus ID System, Animal Isolation Lab, Lab Animal Services, Chemistry Stores, Forestry Quantitative LAN, Surplus Property, Advertising Media Presentation Services, Software Licensing, Statistical Services, Mass Spectrometry, Electron Microscopy and the Insurance Clearing Fund.
Revenues: Revenues decreased $82k or -1.7% from fiscal year 2016. Campus ID is showing significant decreases, which is in line with the overall expense decreases identified below. As well as Information Services, which restructured their fee this past year. Additionally, Lab Animal Resource Operations had an increase in revenue over FY2016.
Expenses: Overall Expenses decreased $55k or -1.1%. Salaries and OPE increased $224k from fiscal year 2016. Services and Supplies expenses decreased $267k when compared to the prior fiscal year. Primary reasons for the decrease related to the insurance replacement reserve fund not expending as much in FY2017, and Campus ID expenses were significantly less than FY2016.
Net Transfers: Overall transfers decreased by $189k or -46.8% when compared to FY2016. Lab Animal Resource Operations overall had less transfers-in when compared to FY2016 as well as the Insurance replacement reserve fund reporting less transfers.
Balance Sheet: Working capital had an overall increase of $253k to end the year higher than the previous fiscal year.
Page 58 of 65 Unaudited - For Management Purposes Only
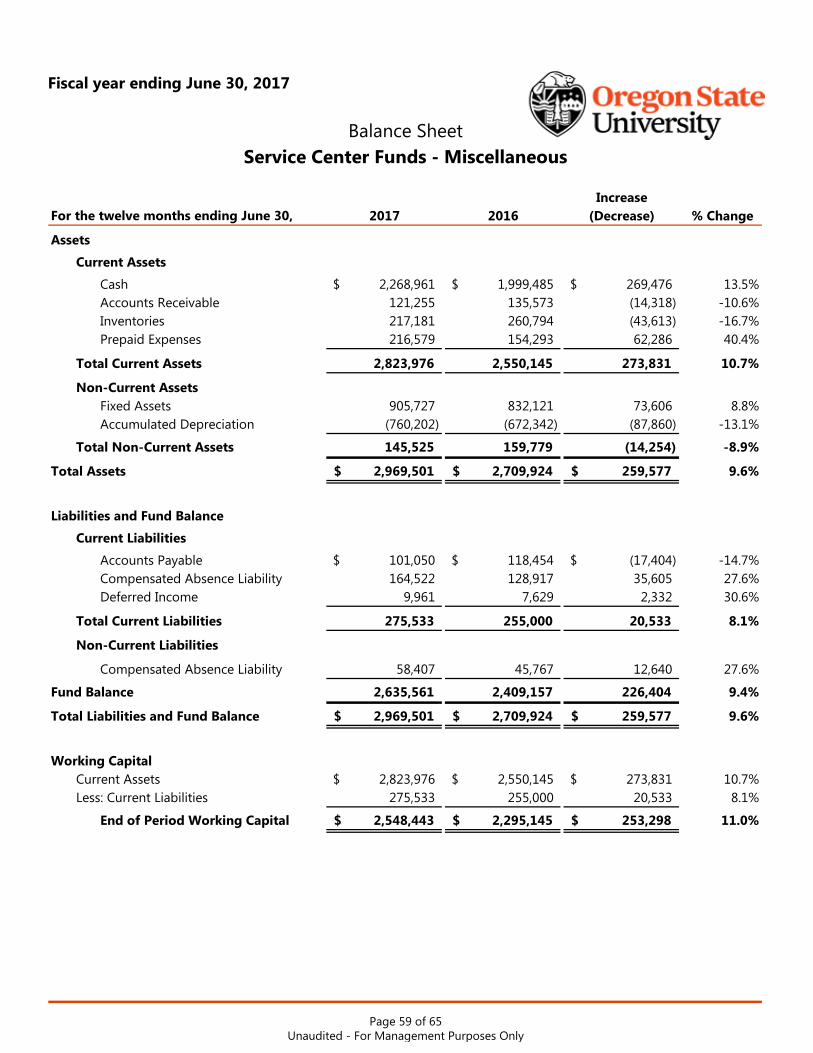
Fiscal year ending June 30, 2017
Increase2017 2016 (Decrease) % Change
Assets
Current Assets
Cash 2,268,961$ 1,999,485$ 269,476$ 13.5%Accounts Receivable 121,255 135,573 (14,318) -10.6%Inventories 217,181 260,794 (43,613) -16.7%Prepaid Expenses 216,579 154,293 62,286 40.4%
Total Current Assets 2,823,976 2,550,145 273,831 10.7%
Non-Current AssetsFixed Assets 905,727 832,121 73,606 8.8%Accumulated Depreciation (760,202) (672,342) (87,860) -13.1%
Total Non-Current Assets 145,525 159,779 (14,254) -8.9%
Total Assets 2,969,501$ 2,709,924$ 259,577$ 9.6%
Liabilities and Fund Balance
Current Liabilities
Accounts Payable 101,050$ 118,454$ (17,404)$ -14.7%Compensated Absence Liability 164,522 128,917 35,605 27.6%Deferred Income 9,961 7,629 2,332 30.6%
Total Current Liabilities 275,533 255,000 20,533 8.1%
Non-Current Liabilities
Compensated Absence Liability 58,407 45,767 12,640 27.6%
Fund Balance 2,635,561 2,409,157 226,404 9.4%
Total Liabilities and Fund Balance 2,969,501$ 2,709,924$ 259,577$ 9.6%
Working CapitalCurrent Assets 2,823,976$ 2,550,145$ 273,831$ 10.7%Less: Current Liabilities 275,533 255,000 20,533 8.1%
End of Period Working Capital 2,548,443$ 2,295,145$ 253,298$ 11.0%
Balance SheetService Center Funds - Miscellaneous
For the twelve months ending June 30,
Page 59 of 65 Unaudited - For Management Purposes Only

Fiscal year ending June 30, 2017
Increase %2017 2016 (Decrease) Change
Revenue
Enrollment Fees (1,732)$ (981)$ (751)$ -76.6%Interest Revenue 6,097 4,803 1,294 26.9%Sales & Service Revenue 1,298,478 1,318,973 (20,495) -1.6%Other Revenue 112,064 - 112,064 -Internal Sales 3,289,666 3,463,304 (173,638) -5.0%
Total Revenue 4,704,573 4,786,099 (81,526) -1.7%
Expense
Total Salaries and OPE 2,941,631 2,717,495 224,136 8.2%Service and Supplies 2,084,922 2,352,014 (267,092) -11.4%Depreciation 39,566 51,906 (12,340) -23.8%
Total Expense 5,066,119 5,121,415 (55,296) -1.1%
Net Change From Operations (361,546) (335,316) (26,230) -7.8%
Fixed Asset Disposal Gain/(Loss) (793) (11,611) 10,818 93.2%Transfers In 1,023,544 1,321,430 (297,886) -22.5%Transfers Out (434,801) (569,358) 134,557 23.6%
Net Increase (Decrease) in Fund Balance 226,404 405,145 (178,741) -44.1%
Beginning Operations Fund Balance 2,409,157 2,005,797 403,360 20.1%
NIP Change in Fixed Assets - (1,785) 1,785 -
Ending Fund Balance From Operations 2,635,561$ 2,409,157$ 226,404$ 9.4%
Statement of Revenues, Expenses, and Other ChangesService Center Funds - Miscellaneous
For the twelve months ending June 30,
Page 60 of 65 Unaudited - For Management Purposes Only
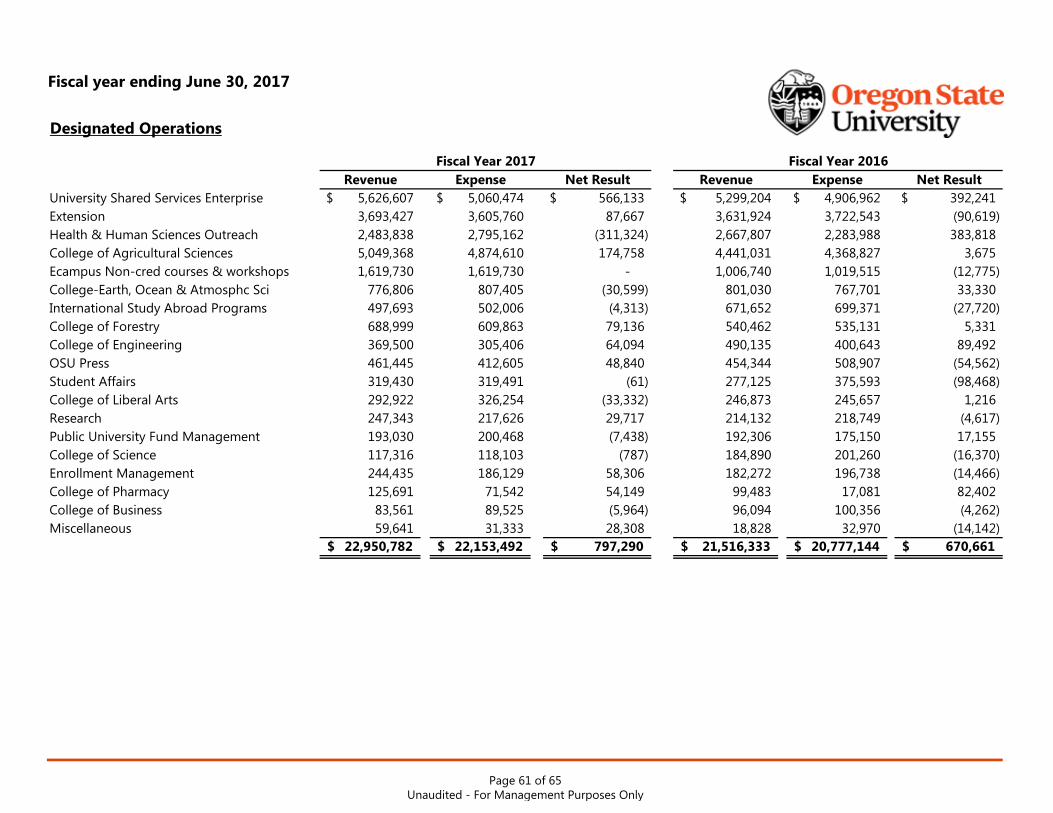
Fiscal year ending June 30, 2017
Revenue Expense Net Result Revenue Expense Net ResultUniversity Shared Services Enterprise 5,626,607$ 5,060,474$ 566,133$ 5,299,204$ 4,906,962$ 392,241$ Extension 3,693,427 3,605,760 87,667 3,631,924 3,722,543 (90,619) Health & Human Sciences Outreach 2,483,838 2,795,162 (311,324) 2,667,807 2,283,988 383,818 College of Agricultural Sciences 5,049,368 4,874,610 174,758 4,441,031 4,368,827 3,675 Ecampus Non-cred courses & workshops 1,619,730 1,619,730 - 1,006,740 1,019,515 (12,775) College-Earth, Ocean & Atmosphc Sci 776,806 807,405 (30,599) 801,030 767,701 33,330 International Study Abroad Programs 497,693 502,006 (4,313) 671,652 699,371 (27,720) College of Forestry 688,999 609,863 79,136 540,462 535,131 5,331 College of Engineering 369,500 305,406 64,094 490,135 400,643 89,492 OSU Press 461,445 412,605 48,840 454,344 508,907 (54,562) Student Affairs 319,430 319,491 (61) 277,125 375,593 (98,468) College of Liberal Arts 292,922 326,254 (33,332) 246,873 245,657 1,216 Research 247,343 217,626 29,717 214,132 218,749 (4,617) Public University Fund Management 193,030 200,468 (7,438) 192,306 175,150 17,155 College of Science 117,316 118,103 (787) 184,890 201,260 (16,370) Enrollment Management 244,435 186,129 58,306 182,272 196,738 (14,466) College of Pharmacy 125,691 71,542 54,149 99,483 17,081 82,402 College of Business 83,561 89,525 (5,964) 96,094 100,356 (4,262) Miscellaneous 59,641 31,333 28,308 18,828 32,970 (14,142)
22,950,782$ 22,153,492$ 797,290$ 21,516,333$ 20,777,144$ 670,661$
Designated Operations
Fiscal Year 2017 Fiscal Year 2016
Page 61 of 65 Unaudited - For Management Purposes Only

Fiscal year ending June 30, 2017
Fiscal Year2017
Fiscal Year2016
Fiscal Year2017
Fiscal Year2016
Scholarships (varous units) 18,250,818$ 17,980,942$ College of Engineering 45,778,213$ 38,513,735$ College of Forestry 10,427,725 7,602,569 College-Ocean, Earth & Atmosph Sci 40,975,123 40,601,764 Athletics 9,592,144 8,709,088 College of Agricultural Sciences 40,820,968 42,356,294 College of Engineering 6,569,542 7,658,578 Federal & State Financial Aid 39,919,723 42,341,205 College of Agricultural Sciences 4,331,525 5,067,908 Research Centers & Institutes 24,145,094 19,422,335 Research Centers & Institutes 1,810,930 2,916,524 College of Health & Human Sciences 18,119,329 18,790,869 Undergraduate Studies 1,594,509 683,088 College of Science 15,595,138 16,227,765 College of Business 1,495,814 1,330,668 College of Forestry 11,845,592 13,639,413 College of Health & Human Sciences 1,463,751 913,212 Agriculture Experiment Stations 7,126,023 7,164,301 College of Science 1,123,906 1,277,506 Scholarships/Fellowships/Work Study 6,777,938 5,995,581 College-Ocean, Earth & Atmosphc Sci 1,100,565 699,112 College of Pharmacy 5,001,828 4,278,401 College of Liberal Arts 1,081,832 1,164,594 Enrollment Management 3,416,787 2,850,502 College of Veterinary Medicine 819,060 1,123,497 College of Veterinary Medicine 2,838,556 2,101,977 Executive Office 697,189 699,569 College of Liberal Arts 1,909,914 1,301,237 University Libraries 529,544 588,000 Undergraduate Studies 1,502,672 396,295 Cascades 401,752 290,568 Finance & Administration 1,209,562 939,168 Miscellaneous 353,678 (105,000) Cascades Campus 1,208,433 1,161,311 Extension 325,561 456,201 Extension 1,097,102 1,080,575 Student Affairs 305,047 202,039 College of Education 383,901 751,236 University Relations & Marketing 244,048 368,861 Graduate School 324,945 386,428 Academic Affairs 141,553 150,403 Student Centers & Activities 321,954 175,401 College of Pharmacy 86,862 234,210 Academic Affairs 296,326 425,763
62,747,355$ 60,012,136$ Executive Office 280,698 274,933 College of Business 153,404 199,430 University Libraries 109,672 312,341 Institutional Management (1,130,262) 407,650 Miscellaneous 86,712 80,297
270,115,345$ 262,176,206$
Gift Fund Expenditures by Unit Externally Funded Expenditures
Page 62 of 65 Unaudited - For Management Purposes Only

Fiscal year ending June 30, 2017
Page 63 of 65Unaudited - For Management Purposes Only
Revenue Expense Net Result Revenue Expense Net ResultExecutive Office -$ -$ -$ 41,931$ -$ 41,931$ University Relations & Marketing 809,944 863,101 (53,157) 889,547 809,857 79,690 Research Centers & Institutes 3,842,088 3,197,762 644,326 3,968,434 9,387,966 (5,419,532) 1
College of Agricultural Sciences 688,856 992,884 (304,028) 1,203,448 720,879 482,569 Information Services 373,837 46,142 327,696 173,899 62,033 111,866 College of Forestry 80,838 208,043 (127,205) 216,983 241,810 (24,827) College of Science 40,274 39,910 364 42,572 134,875 (92,303) College of Engineering 149,128 219,525 (70,397) 207,596 158,960 48,636 College of Pharmacy 66,693 79,041 (12,348) 69,748 76,601 (6,853) Institutional Management 5,079 (74,227) 79,306 4,338 218,123 (213,785) Miscellaneous 64,419 24,525 39,893 2,166 14,017 (11,851)
6,121,157$ 5,596,707$ 524,450$ 6,820,662$ 11,825,121$ (5,004,459)$
1Research Centers & Institutes' expenses include a transfer of $6.3 million to the OSU Foundation for the Office for Commercialization and Corporate Development Endowment and College of Engineering Endowment.
Fiscal Year 2017 Fiscal Year 2016
Royalties FundsFiscal Years 2017-2016

Fiscal year ending June 30, 2017
Date XI-F Bonds SELP COPS XI-Q Bonds Revenue Bonds
6/30/17 305,635$ 12,761$ 2,251$ 4,803$ 98,375$
6/30/18 292,700 11,966 1,111 4,443 98,375
6/30/19 278,952 11,229 662 4,064 98,375
6/30/20 166,655 10,539 432 3,665 98,375
6/30/21 154,092 9,816 293 3,157 98,375
6/30/22 141,354 9,060 150 2,622 98,375
Fiscal Year XI-F Bonds SELP COPS XI-Q Bonds Revenue Bonds
2017-2018 27,978$ 1,360$ 1,221$ 597$ 4,326$
2018-2019 28,108 1,266 493 598 4,326
2019-2020 26,260 1,186 257 599 4,326
2020-2021 25,621 1,186 159 687 4,326
2021-2022 25,090 1,186 155 689 4,326
Thereafter 347,608 11,157 162 3,022 199,588 Total 480,665$ 17,341$ 2,447$ 6,192$ 221,218$
Pay off Date 08/01/2045 06/30/2032 11/01/2024 05/01/2027 04/30/2047
SELP - State Energy Loan Program - A low interest loan program for projects that save energy. Administered through the State of Oregon, Office of Energy.
Report of Obligations and Debt Service (000's)
Debt Service (Principal & Interest)
Debt Obligation (Principal)
XI-F(1) Bonds - Used to finance self-liquidating and self supporting projects.
Page 64 of 65 Unaudited - For Management Purposes Only

Office of Budget & Fiscal Planning
Oregon State University
510 Kerr Administration Building
Corvallis, OR 97331
fa.oregonstate.edu/budget