fiscal year 2016 - united states environmental protection · pdf file ·...
TRANSCRIPT
United StatesEnvironmental Protection Agency
Fiscal Year 2016
Justification of AppropriationEstimates for the Committee
on Appropriations
EPA-190-R-15-001 February 2015www.epa.gov/ocfo
Recycled/Recyclable Printed on paper that contains at least 50% recycled fiber
For Official Use Only

1069
Environmental Protection Agency 2015 Annual Performance Plan and Congressional Justification
Table of Contents – Appendix B
______________________________________________________________________________
Performance Management in FY 2014 ..................................................................................... 1073
Program Evaluations ................................................................................................................. 1075
Summary of FY 2014 Performance Results ............................................................................. 1078
Strategic Goal 1: ....................................................................................................................... 1081
Summary of Progress ................................................................................................................ 1084
Key FY 2014 Performance Results........................................................................................... 1085
FY 2014–2015 Agency Priority Goal ....................................................................................... 1085
Clean Power Plan Proposal ................................................................................................... 1085
New Source Performance Standards and Emission Guidelines for Municipal Solid Waste
Landfills ................................................................................................................................ 1086
Oil and Gas White Papers ..................................................................................................... 1087
Greenhouse Gas Reporting Program .................................................................................... 1087
Performance Challenges ........................................................................................................... 1087
Delivering the Clean Power Plan .......................................................................................... 1087
Summary of Progress ................................................................................................................ 1089
Key FY 2014 Performance Results........................................................................................... 1090
Tier 3 Vehicle Emission and Fuel Standards Program ......................................................... 1090
Near-Road Monitoring Network ........................................................................................... 1090
New Source Performance Standard for Residential Wood Heaters...................................... 1090
Rules for the Refinery Sector ................................................................................................ 1091
Reducing Risk from Diesel Emissions in Communities ....................................................... 1091
Childhood Asthma Risk Reduction ...................................................................................... 1092
Performance Challenges ........................................................................................................... 1093
Impact of Legal Challenges .................................................................................................. 1093
Summary of Progress ................................................................................................................ 1094
Key FY 2014 Performance Results........................................................................................... 1094
Phaseout of ODSs ................................................................................................................. 1094
Performance Challenges ........................................................................................................... 1095
Challenges in the Phaseout of ODSs .................................................................................... 1095
Summary of Progress ................................................................................................................ 1096
1070
Key FY 2014 Performance Results........................................................................................... 1096
EPA Regulatory Oversight at the Department of Energy’s Waste Isolation Pilot Plant ...... 1096
Performance Challenges ........................................................................................................... 1097
Maintaining EPA’s Radiation Emergency Response Program Readiness ........................... 1097
Strategic Goal 2: ....................................................................................................................... 1098
Summary of Progress ................................................................................................................ 1101
FY 2014 Performance Accomplishments ................................................................................. 1102
FY 2014 Performance Challenge .............................................................................................. 1103
Summary of Progress ................................................................................................................ 1105
FY 2014 Performance Accomplishments ................................................................................. 1106
................................................................................................................................................... 1109
FY 2014 Performance Challenges ............................................................................................ 1109
Nonpoint Source Nutrient Runoff ......................................................................................... 1109
Strategic Goal 3: ....................................................................................................................... 1111
Summary of Progress ................................................................................................................ 1114
FY 2014 Performance Accomplishments ................................................................................. 1115
Brownfield Properties Assessed ........................................................................................... 1115
Performance Challenges ........................................................................................................... 1117
Implementation of Executive Order on Improving Chemical Facility Safety and Security . 1117
Summary of Progress ................................................................................................................ 1118
FY 2014 Performance Accomplishments ................................................................................. 1119
Use of Virgin Resources Offset Through SMM ................................................................... 1119
More Hazardous Waste Facilities with New or Updated Controls ....................................... 1120
Summary of Progress ................................................................................................................ 1122
FY 2014 Performance Accomplishments ................................................................................. 1123
FY 2014 Performance Challenges ............................................................................................ 1124
Superfund Remedial Program ............................................................................................... 1124
Summary of Progress ................................................................................................................ 1126
FY 2014 Performance Accomplishments ................................................................................. 1127
Tribal Capacity Building....................................................................................................... 1127
Tribal Consultation ............................................................................................................... 1127
Tribal ecoAmbassadors Program .......................................................................................... 1128
Implementing Federal Regulatory Environmental Programs in Indian Country .................. 1128
Tribal Program Needs Assessment ....................................................................................... 1129

1071
Strategic Goal 4: ....................................................................................................................... 1130
Key FY 2014 Performance Accomplishments ......................................................................... 1134
Lead RRP Active Certified Firms ......................................................................................... 1135
Ensuring Online Public Access to TSCA Chemical Information ......................................... 1135
Annual Number of Pesticide Registration Review Dockets and Workplans Opened .......... 1136
Assessment of TSCA Work Plan Chemicals ........................................................................ 1137
Performance Challenges ........................................................................................................... 1138
EDSP’s WoE Determinations ............................................................................................... 1138
Chemical Safety Work Hampered by TSCA Limitations..................................................... 1139
Persistent Income-Related Disparities in Reducing Children’s Blood Lead Levels ............ 1139
EDSP’s Environmental Justice Activities ............................................................................. 1140
Implementation of Endangered Species Act During Registration Review ........................... 1140
Summary of Progress ................................................................................................................ 1141
Key FY 2014 Performance Results........................................................................................... 1142
Environmentally Preferable Purchasing ............................................................................... 1142
Expanding the DfE Safer Product Labeling Program and Safer Chemical Ingredients List 1143
Strategic Goal 5: ....................................................................................................................... 1144
Summary of Progress ................................................................................................................ 1147
Key FY 2014 Performance Results........................................................................................... 1149
Moving Next Generation Compliance from Design to Implementation .............................. 1150
National Enforcement Initiatives .......................................................................................... 1151
Performance Challenges ........................................................................................................... 1153
Electronic Reporting ............................................................................................................. 1153
Introduction ............................................................................................................................... 1154
Summary of Progress ................................................................................................................ 1155
Key FY 2014 Performance Results........................................................................................... 1156
Agency-Wide Staff Engagement via GreenSpark ................................................................ 1156
Green Infrastructure Collaborative ....................................................................................... 1156
Performance Challenges ........................................................................................................... 1157
Encouraging Knowledge Management in the New Community of Practice ........................ 1157
Summary of Progress ................................................................................................................ 1158
Key FY 2014 Performance Results........................................................................................... 1159
GeoPlatform .......................................................................................................................... 1159
Community SharePoint Site .................................................................................................. 1159

1072
Leveraging of Federal Resources .......................................................................................... 1160
Performance Challenges ........................................................................................................... 1160
Coordinating Actions Needed for Development and Installation of New Agency IT Systems
............................................................................................................................................... 1160
Culture Change ..................................................................................................................... 1160
Internal vs. External Communication ................................................................................... 1160
Summary of Progress ................................................................................................................ 1161
Key FY 2014 Performance Results........................................................................................... 1162
Consultations with State and Local Elected Officials on EPA Rulemakings, Guidance, and
Policies .................................................................................................................................. 1162
National Environmental Performance Partnership System................................................... 1162
Oversight of State-Delegated Programs................................................................................ 1162
Government-Wide Collaboration with Tribal Partners......................................................... 1163
Provide EPA Leadership and Support to Strengthen International Collaborations .............. 1163
Performance Challenges ........................................................................................................... 1163
Oversight of State-Delegated Programs................................................................................ 1163
International—Addressing Black Carbon in Arctic Countries ............................................. 1164
Key FY 2014 Performance Results........................................................................................... 1165
1073
INTRODUCTION
EPA’s FY 2014 Annual Performance Report (APR) is integrated throughout EPA’s FY 2016
Annual Performance Plan and the Congressional Justification. The APR reports environmental
and program performance results achieved in FY 2014 against the performance measures and
targets established in the Agency’s FY 2014 Annual Performance Plan and the Congressional
Justification and discusses progress for the first time under the five goals, thirteen strategic
objectives, and four cross-agency strategies established in EPA’s FY 2014–2018 Strategic Plan
EPA’s FY 2014 APR complies with requirements of the Government Performance and Results
Modernization Act of 2010 and Office of Management and Budget implementing guidance. In
compliance with this law and implementing guidance, in FY 2014 EPA conducted its first round
of strategic reviews as an integral part of its performance management practices. Results from
these reviews are discussed in the Summary of Progress section under each of EPA’s thirteen
strategic objectives.
This “Overview of FY 2014 Performance” highlights key FY 2014 program and performance
accomplishments and challenges, illustrating how annual progress impacts longer term goals.
EPA's FY 2014 performance results are also incorporated in the following sections of the FY 2016
Annual Performance Plan and the Congressional Justification:
The “Introduction and Overview” section presents EPA’s mission statement and
organizational structure.
The “Goal and Objective Overview” section discusses FY 2014 performance results to help
explain future directions.
Appropriation Program/Project Fact Sheets include FY 2014 performance results and trend
data to provide context for budget decisions.
The “Program Performance and Assessment” section presents a detailed 8-year table of
performance data—displayed by strategic goal and objective—which provides results for
each measure established in the Agency’s FY 2014 Annual Performance Plan and includes
explanations for missed or exceeded targets.
To supplement the FY 2014 APR, please refer to EPA’s FY 2014 Agency Financial Report (AFR),
which discusses EPA’s FY 2014 financial performance, and its web-based FY 2014 Highlights,
which presents key financial and performance information from both the AFR and APR and
provides links to additional information.
Performance Management in FY 2014
To promote achievement of its goals and objectives, EPA establishes a suite of annual performance
measures in its Annual Performance Plan and Budget. The Agency reports its results against these
annual performance measures and discusses progress toward longer-term objectives and measures
in its APR. EPA assesses performance results as the basis for formulating and justifying its resource
requests. Below is an overview of EPA's Performance Management Framework:

1074
FY 2014 Advances in Performance Management
During FY 2014, EPA designed and implemented a number of key initiatives to further strengthen
its performance management.
The FY 2014-2018 EPA Strategic Plan: EPA’s FY 2014-2018 Strategic Plan, transmitted to the
President and the Congress and released to the public on April 10, 2014, updated our five strategic
goals and thirteen objectives and established four cross-agency strategies. During the development
of the Plan, EPA engaged with partners and stakeholders, regularly briefed the Local Government
Advisory Committee and the Environmental Council of the States, formally consulted with Native
American tribes, and held information sessions during the public comment period.
Strategic Reviews: EPA conducted its first round of strategic reviews as an integral part of its
performance management practices. The strategic reviews considered a wide array of data and
evidence to assess longer-term progress toward each of EPA’s thirteen strategic objectives and
four cross-agency strategies. Senior leaders met in spring 2014 to assess the agency’s long-term
progress and to discuss the most important successes and challenges to inform planning, budgeting,
and program management decisions. The Agency summarized strategic review findings for each
objective and discussed them with the Deputy Administrator, the Acting Chief Financial Officer,
and the Office of Management and Budget. The results of the Agency’s strategic reviews are
reflected in EPA’s FY 2014 Annual Performance Report and FY 2016 Congressional Budget
Justification and Annual Performance Plan.

1075
Agency Priority Goals: In FY 2014, EPA established six FY 2014–2015 Agency Priority Goals
(APGs) as part of the FY 2014–2018 Strategic Plan and made steady progress implementing the
APG action plans. EPA also contributed to Cross-Agency Priority (CAP) Goals across the federal
government, notably for Cybersecurity, Benchmarking, and Infrastructure Permitting. In addition
to quarterly internal discussions, EPA reported APG/CAP progress on
http://www.performance.gov and discusses end-of-year progress for APGs in its FY 2014 Annual
Performance Report.
Agency Performance Reviews: EPA’s Deputy Administrator and Chief Financial Officer meet
quarterly with senior leadership to discuss progress on APGs and twice a year (mid-year and end-
of-year) to discuss progress toward the Agency’s five goals and four cross-agency strategies. EPA
officials use this forum to discuss performance information, policy/programmatic issues, and the
impact of resource levels on Agency priorities and strategies. The reviews also help inform
program strategy and budget initiatives moving forward. During the FY 2014 mid-year review,
EPA focused on its new strategic reviews and how mid-year results inform and complement the
longer view.
Transition to Two-Year National Program Manager (NPM) Guidance: In FY 2014, the
Agency convened a workgroup of state, regional, and national program representatives to
strengthen and make more meaningful state and tribal engagement in Agency programs; increase
flexibility for states and tribes; streamline the workload associated with planning activities; and
where possible, align the Agency’s NPM and grant guidances. A key part of this effort has been
transitioning to two-year NPM guidances. NPM guidances identify program priorities, strategies,
and operational measures consistent with EPA’s Strategic Plan and Annual Plan and Budget and
serve as a national framework for regions to use as they negotiate work plans and develop work-
sharing strategies with states and tribes. The new cycle for the NPM Guidance process began with
implementation of the new exceptions-based FY 2015 Addendums to the FY 2014 NPM
Guidances. The FY 2016-2017 NPM Guidances will reflect earlier engagement with EPA partners,
identify the most important environmental and human health work, and outline opportunities for
state and tribal flexibilities during work planning.
Enhanced Stewardship: To increase attention to the Agency’s stewardship responsibilities for
managing programs and resources effectively and efficiently, EPA institutionalized Management
Accountability Reviews. In FY 2014, EPA conducted reviews in the Office of the Administrator,
Office of Solid Waste and Emergency Response, and EPA Regions 9 and 10. Onsite visits,
conducted each year in selected program and regional offices, focus attention on the Agency’s
responsibilities for audit management and implementation of the Federal Managers’ Financial
Integrity Act, helping to ensure that EPA programs and activities are managed to prevent waste,
fraud, and abuse.
Program Evaluations
Program evaluations help provide the evidence EPA needs to ensure that its programs are meeting
their intended outcomes and allow the Agency to support more effective and efficient operations.
By assessing how well a program is working and why, a program evaluation can help EPA identify

1076
activities that benefit human health and the environment, provide the roadmap needed to replicate
successes, and identify areas needing improvement. This is particularly important for fostering
transparency and accountability. Summaries of program evaluations completed during FY 2014
are available at http://www2.epa.gov/planandbudget/fy-2014-program-evaluations.

1077
1078
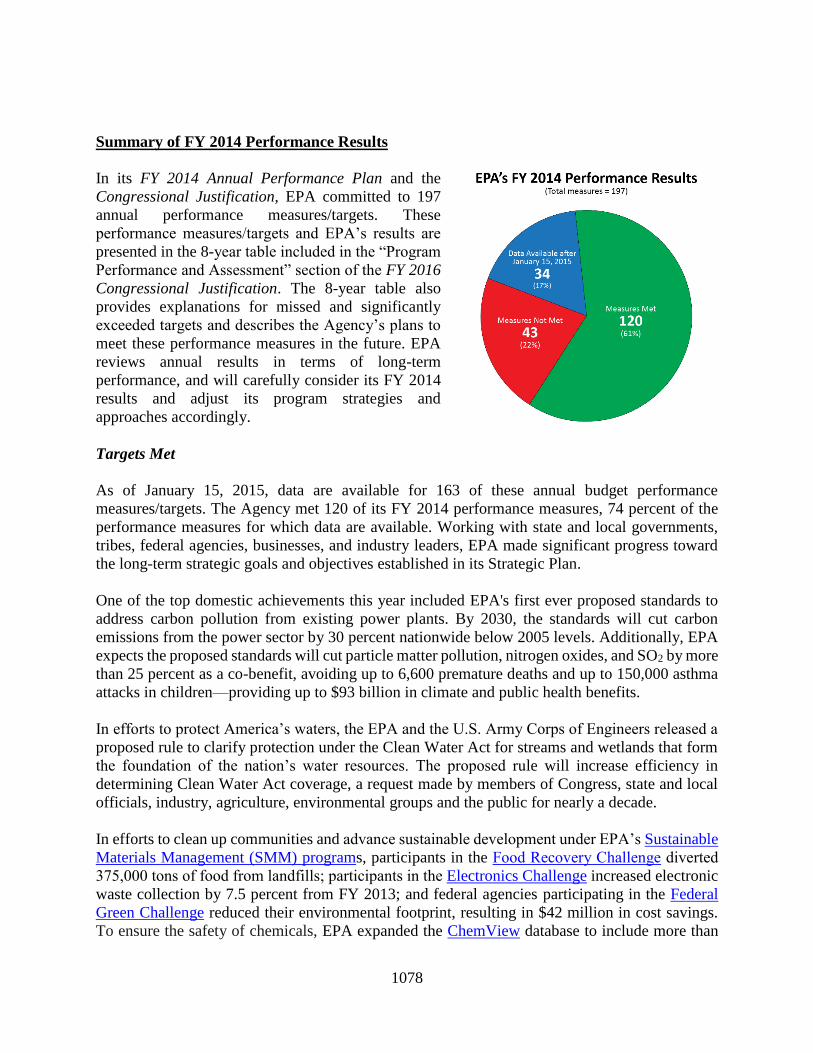
Summary of FY 2014 Performance Results
In its FY 2014 Annual Performance Plan and the
Congressional Justification, EPA committed to 197
annual performance measures/targets. These
performance measures/targets and EPA’s results are
presented in the 8-year table included in the “Program
Performance and Assessment” section of the FY 2016
Congressional Justification. The 8-year table also
provides explanations for missed and significantly
exceeded targets and describes the Agency’s plans to
meet these performance measures in the future. EPA
reviews annual results in terms of long-term
performance, and will carefully consider its FY 2014
results and adjust its program strategies and
approaches accordingly.
Targets Met
As of January 15, 2015, data are available for 163 of these annual budget performance
measures/targets. The Agency met 120 of its FY 2014 performance measures, 74 percent of the
performance measures for which data are available. Working with state and local governments,
tribes, federal agencies, businesses, and industry leaders, EPA made significant progress toward
the long-term strategic goals and objectives established in its Strategic Plan.
One of the top domestic achievements this year included EPA's first ever proposed standards to
address carbon pollution from existing power plants. By 2030, the standards will cut carbon
emissions from the power sector by 30 percent nationwide below 2005 levels. Additionally, EPA
expects the proposed standards will cut particle matter pollution, nitrogen oxides, and SO2 by more
than 25 percent as a co-benefit, avoiding up to 6,600 premature deaths and up to 150,000 asthma
attacks in children—providing up to $93 billion in climate and public health benefits.
In efforts to protect America’s waters, the EPA and the U.S. Army Corps of Engineers released a
proposed rule to clarify protection under the Clean Water Act for streams and wetlands that form
the foundation of the nation’s water resources. The proposed rule will increase efficiency in
determining Clean Water Act coverage, a request made by members of Congress, state and local
officials, industry, agriculture, environmental groups and the public for nearly a decade.
In efforts to clean up communities and advance sustainable development under EPA’s Sustainable
Materials Management (SMM) programs, participants in the Food Recovery Challenge diverted
375,000 tons of food from landfills; participants in the Electronics Challenge increased electronic
waste collection by 7.5 percent from FY 2013; and federal agencies participating in the Federal
Green Challenge reduced their environmental footprint, resulting in $42 million in cost savings.
To ensure the safety of chemicals, EPA expanded the ChemView database to include more than

1079
8,300 chemicals, including 298 Consent Orders, 73 test rule chemicals, and an additional 1,000
New Chemical Significant New Use Rules.
Achieving goals for safe drinking water, swimmable and fishable streams, cleaner air, and
healthier communities and neighborhoods requires not only new strategies and compliance, but
also vigorous enforcement. Under its national enforcement initiatives, EPA addressed pollution
problems that make a difference in communities, including overburdened communities. For
example, Minnesota Power agreed to install pollution control technology and meet stringent
emission rates to reduce harmful air pollution from three coal-fired power plants. The settlement
requires the company to pay a civil penalty of $1.4 million to resolve Clean Air Act violations and
spend more than $500 million on required measures to reduce harmful air emissions by over 13,350
tons annually and at least $4.2 million on environmental projects to benefit local communities,
including a large-scale solar installation system to benefit a local tribe known as the Fond du Lac
Band and $200,000 to the National Park Service to restore wetlands at Voyageurs National Park.
Targets Missed
Despite its best efforts, the Agency missed 43 of its FY 2014 performance measures/targets. There
are a number of reasons for missed targets, including an unexpected demand for resources or
competing priorities; the impact of sequestration and a changing workforce; the effect of budget
cuts on the Agency’s state, tribal, and local government partners; and other factors. As an integral
part of its performance management process, EPA will continue to regularly review its
performance, analyze results, and adjust FY 2015 and FY 2016 programmatic approaches and
targets as necessary.
Data Not Available
Because final end-of-year data for some measures were not available when this report went to
press, EPA is not able to report on 34 of its 197 performance measures. Often environmental results
do not become apparent within a fiscal year, and assessment is a longer-term effort requiring
information over time.
Data lags may also result when reporting cycles do not correspond with the federal fiscal year on
which this report is based. For example, data reported biennially are not available for this report,
though they will be available in the Agency’s FY 2015 and FY 2016 APRs.
Extensive quality assurance/quality control processes can also delay the reporting of performance
data. EPA relies heavily on performance data obtained from state, tribal, and local agencies, all of
which require time to collect and review for quality. Where EPA cannot obtain complete end-of-
year information from all sources in time for this report, additional FY 2014 results will be
available in the Agency’s FY 2015 APR, which will be included in the FY 2017 Annual
Performance Plan and the “Program Performance and Assessment” section of the Congressional
Justification published in 2016.

1080
Previous Fiscal Year Data Now Available
EPA can now report data from FY 2013 that became available in FY 2014. In summary, final
performance results became available for 29 of the 37 FY 2013 performance measures (out of a
total 196 FY 2013 performance measures) for which data were unavailable at the end of FY 2013.
Of these 37 performance measures, EPA met 23 and did not meet seven. Data remain unavailable
for seven 1 measures and EPA, in agreement with the Office of Management and Budget
retroactively deleted one measure.2
1 Performance Measure A01: Annual emissions of sulfur dioxide (SO2) from electric power generation sources;
Performance Measure G16: Million metric tons of carbon equivalent (MMTCO2E) of greenhouse gas reductions in
the industry sector; Performance Measure R51: Percentage of all new single-family homes (SFH) in high radon
potential areas built with radon reducing features; Performance Measure 630: Five-year average annual loadings of
soluble reactive phosphorus (metric tons per year) from tributaries draining targeted watersheds; Performance
Measure Mw2: Increase in percentage of coal combustion ash that is beneficially used instead of disposed;
Performance Measures SM1: Tons of materials and products offsetting use of virgin resources through sustainable
materials management; Performance Measure 143: Percentage of agricultural acres treated with reduced-risk
pesticides. 2 Performance Measure R22: Estimated annual number of schools establishing indoor air quality management plans
consistent with EPA guidance.

1081
Strategic Goal 1:
ADDRESSING CLIMATE CHANGE AND IMPROVING AIR QUALITY

1082
1083
EPA CONTRIBUTING PROGRAMS
Acid Rain Program
Air Toxics
Clean Air Allowance Trading Programs
Clean Air Research
Indoor Air Quality and Radon Programs
National Ambient Air Quality Standards Development and Implementation
Mobile Sources
New Source Performance Standards
New Source Review
Regional Haze
Stratospheric Ozone Layer Protection Program
Radiation Protection and Emergency Response Programs
Climate Partnership Programs
1084
STRATEGIC OBJECTIVE 1:
ADDRESS CLIMATE CHANGE.
Minimize the threats posed by climate change by reducing greenhouse gas emissions and
taking actions that help to protect human health and help communities and ecosystems
become more sustainable and resilient to the effects of climate change.
EPA implements both partnership and regulatory programs to reduce greenhouse gases (GHGs)
that contribute to the warming of the planet’s climate. Businesses and other organizations have
partnered with EPA through voluntary climate protection programs to pursue common-sense
approaches to reducing GHGs. In conjunction with its partnership programs, EPA pursues
regulatory approaches to reduce emissions from mobile and stationary sources. EPA’s strategies
to address climate change reflect the President’s Climate Action Plan (June 2013), which, among
other initiatives, tasks EPA with setting carbon dioxide (CO2) standards for power plants and
applying its authorities and other tools to address hydrofluorocarbons (HFCs) and methane through
the Interagency Methane Strategy.
Summary of Progress
EPA continues to address the challenges of a changing climate and is on track to meet its strategic
measures supporting this objective. EPA is developing common-sense GHG regulatory programs
to curb emissions, working with state and local agencies to address sources of GHG emissions;
building on its successful partnerships in such areas as the buildings, industry, and transportation
sectors; and developing climate adaptation strategies.
At the macro level, environmental indicators show an overall increase in GHG emissions since
1990.3 At the program level, EPA’s efforts are achieving real emission reductions; in 2012, EPA
worked with the building, industry, and transportation sectors to avoid 638.9 million metric tons
of CO2 equivalents. In June 2013, the President released the Climate Action Plan, which outlined
various actions the United States will undertake to cut carbon pollution, prepare the country for
the impacts of climate change, and lead international efforts to address climate change. As part of
the President’s Climate Action Plan, EPA is actively developing and implementing regulations in
a number of areas, including the electricity generation and transportation sectors—the two largest
sources of carbon pollution in the United States.4 Also as part of the Climate Action Plan, the
President released the Interagency Methane Strategy in March 2014. This comprehensive strategy
tasks EPA to cut methane emissions from key sectors—landfills, coalmines, agriculture, and oil
and gas.
3 Despite increases in U.S. GHG emissions from 1990 to 2012 overall, emissions decreased between 2007 and 2011.
This decline was seen for nearly all gases and sectors. The decrease in emissions can largely be attributed to lowered
energy use due to slower economic growth and to fuel switching from coal to natural gas—a less carbon-intensive
fuel—as the cost of natural gas decreased compared with the cost of coal. For more details, see EPA. 2014.
Inventory of U.S. Greenhouse Gas Emissions and Sinks: 1990–2012.
http://epa.gov/climatechange/ghgemissions/usinventoryreport.html 4Executive Office of the President. 2013. The President’s Climate Action Plan.
http://www.whitehouse.gov/sites/default/files/image/president27sclimateactionplan.pdf
White House. 2013. “Presidential Memorandum—Power Sector Carbon Pollution Standards.”
http://www.whitehouse.gov/the-press-office/2013/06/25/presidential-memorandum-power-sector-carbon-pollution-
standards
1085
EPA continues to make significant progress integrating
climate adaptation planning into its programs, policies,
rules, and operations in support of executive order
13653. The goal of these efforts is to ensure that EPA
continues to fulfill its mission to protect human health
and the environment even as the climate changes, and to
empower states, tribes, and local communities to increase
their resilience and prepare for and respond to the
impacts of climate change. EPA supports climate-
resilient investments in communities across the country,
and provides data, other information, and tools
communities need to integrate climate adaptation into the
work they do.5
Key FY 2014 Performance Results
FY 2014–2015 Agency Priority Goal
Through September 30, 2015, EPA, in coordination with the Department of Transportation’s fuel
economy standards program, will be implementing vehicle and truck GHG standards that are
projected to reduce GHG emissions by 6 billion metric tons and reduce oil consumption by about
12 billion barrels over the lifetime of the affected vehicles and trucks.
This Agency priority goal focuses on implementing EPA’s light-duty (model year 2012–2016) and
heavy duty (model year 2014–2018) vehicle GHG standards. The primary strategy for
implementation consists of certifying new vehicles as meeting the standards, receiving and
reviewing manufacturer final GHG reports to ensure that manufacturers meet their vehicle fleet
requirements, and ensuring that the certified GHG results are achieved under actual in-use
operation.
As of September 30, 2014, EPA issued a total of 843 certificates for both light-duty and heavy-
duty vehicles and conducted a total of 177 confirmatory tests and 20 surveillance tests of both
light-duty and heavy-duty vehicles at the Ann Arbor Laboratory test track, fully achieving its FY
2014 annual performance targets. For more information, see
http://www.performance.gov/content/reduce-greenhouse-gas-emissions-cars-and-trucks.
Clean Power Plan Proposal
States, cities, and businesses across the country are taking action to address the risks of climate
change. In June 2014, EPA proposed a common-sense plan to cut carbon pollution from power
plants. EPA’s proposal builds on those actions and is flexible—reflecting the important role of
states as full partners with the federal government in cutting pollution and acknowledging that
5 See http://www.epa.gov/climatechange/impacts-adaptation/ for EPA adaptation actions that fulfill commitments
made in the President’s Climate Action Plan.
GROUNDBREAKING CLEAN POWER
PLAN OUTREACH
EPA Regions 4 and 10 served as regional
leads partnering with the National
Program for unprecedented outreach on
the President’s Clean Power Plan, a
groundbreaking plan to reduce greenhouse
gases from existing electric generation
facilities for the first time on a national
level. EPA regions met with groups of
stakeholders across the U.S. to explain the
proposed rule that incorporates energy
efficiency, renewable energy, and
flexibility.

1086
states have different mixes of sources and opportunities. This proposal will maintain an affordable,
reliable energy system, while cutting pollution and protecting human health and the environment
now and for future generations.
Power plants account for roughly one-third of all
domestic GHG emissions in the United States. While
there are limits in place for the levels of arsenic, mercury,
sulfur dioxide, nitrogen oxides, and particle pollution
that power plants can emit, there are currently no national
limits on carbon pollution levels. Full implementation of
the Clean Power Plan will lead to climate and health
benefits worth an estimated $55 billion to $93 billion in
2030, including avoiding 2,700 to 6,600 premature
deaths and 140,000 to 150,000 asthma attacks in
children. The Plan will put Americans to work while
cutting emissions from the U.S. electricity system and
making our homes and businesses more efficient,
shrinking electricity bills by roughly 8 percent in 2030
relative to the projected baseline.
New Source Performance Standards and Emission Guidelines for Municipal Solid Waste
Landfills
In July 2014, the Agency proposed updates to its new source performance standards for municipal
solid waste landfills to reduce emissions of methane-rich gas from landfills constructed, modified,
or reconstructed in the future. The proposal is part of EPA’s methane strategy under the President’s
Climate Action Plan. In addition, the Agency issued an advance notice of proposed rulemaking
seeking public feedback on options for further reducing methane emissions from existing landfills.
Under the proposal, landfills subject to the rule would capture two-thirds of their methane and air
toxics emissions by 2023—13 percent more than they must capture under current regulations.
Methane, in addition to its significant global warming potential, is also a precursor to ground-level
ozone, a health-harmful air pollutant associated with health effects including premature mortality,
lung damage, asthma aggravation and other respiratory symptoms. Nearly 30 organic hazardous
air pollutants have been identified in uncontrolled landfill gas, including benzene, toluene, ethyl
benzene and vinyl chloride.
Regulatory and partnership programs have helped reduce methane emissions from landfills by 30
percent from 1990 to 2012; however, landfill methane emissions remain a concern and are the
third-largest source of human-related methane emissions in the United States, accounting for 18
percent of methane emissions in 2012.6
6 Total U.S. methane emissions were just below 600 MMTCO2E in 2012. See EPA. 2014. Inventory of U.S.
Greenhouse Gas Emissions and Sinks: 1990–2012.
http://www.epa.gov/climatechange/ghgemissions/gases/ch4.html.
FIRST-EVER PERMITS TO SEQUESTER
CARBON FROM COAL-FIRED POWER
PLANTS
Region 5 issued the nation’s first permits
to sequester carbon from a coal-fired
power plant. Four Underground Injection
Control Program (UIC) Class VI permits
were issued to allow the FutureGen
project— an oxy-combustion coal plant in
Illinois—to inject over 25 million metric
tons of carbon dioxide into a deep
geologic formation. Additionally, Region
5 issued a Class VI permit to sequester
carbon dioxide at an Illinois ethanol plant.

1087
Oil and Gas White Papers
In April 2014, the Agency released five technical white papers for external peer review on
potentially significant sources of emissions in the oil and gas sector. The white papers focus on
technical issues covering emissions and mitigation techniques that target methane and volatile
organic compounds (VOCs).
As noted in EPA’s Methane Strategy under the President’s Climate Action Plan, the Agency will
use the papers, along with the input we receive from the peer reviewers and the public, to determine
how to best pursue additional reductions from the oil and gas sector. The five white papers cover:
compressors, emissions from completions and ongoing production of hydraulically fractured oil
wells, leaks, liquids unloading, and pneumatic devices. The white papers and the comments
received are posted at http://www.epa.gov/airquality/oilandgas/whitepapers.html.
Greenhouse Gas Reporting Program
Established in October 2009, the Greenhouse Gas Reporting Program (GHGRP) covers 41
industry sectors, with approximately 8,000 reporters. This program includes data on direct
emissions from large stationary sources (which account for about half of total U.S. GHG
emissions) and also data from suppliers of materials that would emit GHGs when burned or
released.
In September 2014, EPA released new GHG data for 2013. According to these data, GHG
emissions declined by 3.9 percent for those sources covered by GHGRP in the past three reporting
years (2011–2013). However, they increased by 0.62 percent from 2012 to 2013. The increase was
driven by an increase in power plant emissions. Power plants are the largest source of U.S. GHG
emissions, with over 1,550 facilities emitting over 2 billion metric tons of CO2—roughly 32
percent of total U.S. GHG pollution. Power plant emissions have declined by 9.8 percent since
2010, but an increased use of coal caused an uptick in emissions of 13 million metric tons in 2013.
Petroleum and natural gas systems were the second largest stationary source in 2013, reporting
224 million metric tons of GHG emissions, a decrease of 1 percent from the previous year.
Reported methane emissions from petroleum and natural gas systems have decreased by 12 percent
since 2011; the largest reductions came from hydraulically fractured natural gas wells, which
decreased by 73 percent during that period. EPA expects to see further emission reductions as its
2012 standards for the oil and gas industry are implemented.
Performance Challenges
Delivering the Clean Power Plan
EPA is striving to meet the demands of delivering the Clean Power Plan, President Obama’s top
priority for EPA and the central element of the U.S. domestic climate mitigation agenda. In the
latter part of 2015, the Agency will finalize standards for new power plants under §111(b),
standards for existing power plants under §111(d), and a supplemental proposal covering tribes
and territories. This is a huge undertaking involving multiple complex regulatory processes and

1088
extensive and unprecedented work with states, tribes, and territories to ensure successful
implementation. In addition, EPA must respond to an extraordinary number of public comments
on rules and continue to work through an increasing number of court-ordered deadlines, often with
the same at-capacity staff.

1089
STRATEGIC OBJECTIVE 1.2:
IMPROVE AIR QUALITY.
Achieve and maintain health- and welfare-based air pollution standards and reduce risk from
toxic air pollutants and indoor air contaminants.
EPA’s clean air programs, including those addressing indoor air and outdoor air (six common
criteria pollutants, acid rain, and air toxics) focus on some of the highest risks to human health and
environment faced by the country. EPA estimates that federal, state, local, and tribal indoor and
outdoor air quality programs established under the Clean Air Act (CAA) are responsible every
year for preventing many thousands of premature mortalities, millions of incidences of chronic
and acute illness, tens of thousands of hospitalizations and emergency room visits, and millions of
lost work and school days.
Summary of Progress
EPA is on track to meet its strategic targets supporting this objective. By way of context, between
1980 and 2013, gross domestic product increased 145 percent, vehicle miles traveled increased 95
percent, energy consumption increased 25 percent, and the U.S. population grew by 39 percent.
During the same period, total emissions of the six principal air pollutants dropped by 62 percent.
Environmental indicators related to air toxics show improving outdoor air quality trends,7 and
continued progress in preventing lung cancer deaths from radon exposure and reducing adverse
asthma health outcomes. Despite significant progress in improving air quality, in 2013
approximately 75.4 million people nationwide lived in counties with pollution levels above the
primary National Ambient Air Quality Standard (NAAQS) and emissions of air pollutants
continued to impact air quality and human health.
In recent years, EPA has acted to dramatically improve America’s air quality by designing and
developing national programs that, when fully implemented, will achieve significant gains in
human health. These actions include finalizing standards that will improve air quality and save
money at the gas pump, implementing health-based ambient air quality standards grounded in the
best available scientific research, proposing regulations to ensure that all new wood heaters will
emit significantly less particulate matter into communities, and proposing for the first time that
refineries monitor emission in such a way that neighboring communities are not being exposed to
unintended emissions. EPA also helped reduce risks of indoor air pollution by characterizing the
risks to human health, developing techniques for reducing those risks, and educating the public
and key sectors about actions they can take to reduce risks from indoor air.
7 See EPA’s 2014 Report on the Environment for data related to: “Ambient Concentrations of Particulate Matter,”
“Ambient Concentrations of Ozone,” and “Air Toxics Emissions.”

1090
Key FY 2014 Performance Results
Tier 3 Vehicle Emission and Fuel Standards Program In March 2014, EPA finalized Tier 3 Motor Vehicle Emissions and Fuel Standards for cars and
gasoline that will significantly reduce harmful pollution, preventing thousands of premature deaths
and illnesses, while also enabling efficiency improvements in cars and trucks. The Tier 3 program
is part of a comprehensive approach to reducing the impacts of motor vehicles on air quality and
public health. The vehicle standards will reduce both tailpipe and evaporative emissions from
passenger cars, light-duty trucks, medium-duty passenger vehicles, and some heavy-duty vehicles. The final fuel standards reduce gasoline sulfur levels by more than 60 percent—down from 30 to
10 parts per million in 2017. By 2018, EPA estimates the cleaner fuels and cars will annually
prevent between 225 and 610 premature deaths, significantly reduce ambient concentrations of
ozone, and reduce nitrogen oxide emissions by about 260,000 tons. By 2030, EPA estimates the
standards will help avoid up to 2,000 premature deaths; 50,000 cases of respiratory ailments in
children; 2,200 hospital admissions and asthma-related emergency room visits; and 1.4 million
lost school days, work days, and days when activities would be restricted due to air pollution. The
final standards, when fully implemented, are expected to provide more than 13 dollars in health
benefits for every dollar spent to meet the standards. Near-Road Monitoring Network As part of the revised 2010 nitrogen dioxide (NO2) NAAQS, states are required to establish a near-
road monitoring network to determine their attainment status for NO2. In January 2014, the first
phase of the Near-Road Monitoring Network became operational. EPA has been working with its
state partners to bring the second phase of the network online in January 2015. In addition to establishing this network, EPA required that 40 monitoring sites be located in areas
near susceptible and vulnerable populations. Moving forward, states will also monitor other
pollutants at these sites, including carbon monoxide and fine particles. This will expand our
understanding of air quality issues in these
heavily populated areas where people live,
work, and play. New Source Performance Standard for
Residential Wood Heaters On January 3, 2014, EPA proposed updates
to Clean Air Act standards for residential
wood heaters to make new wood heaters
significantly cleaner than current models.
The proposed updates strengthen the
emissions standards for new wood stoves,
while establishing federal air standards for

1091
other new wood heaters, including outdoor and indoor wood-fired boilers (also known as hydronic
heaters).
Smoke from residential wood heaters, which are used around the clock in some areas, can increase
particle pollution to levels that pose serious health concerns. The proposed standards for residential
wood heaters are expected to reduce emissions of fine particle pollution from new manufactured
woodstoves, pellet stoves, hydronic heaters, and forced air furnaces by an estimated 4,825 tons per
year—an 80 percent reduction over estimated emissions
without the rule.
Rules for the Refinery Sector On May 15, 2014, EPA issued a proposed rule that would
further control toxic air emissions from petroleum
refineries as well as set emission control requirements for
storage tanks, flares, and coking units at petroleum
refineries. When fully implemented, the provisions in this rule will
result in a reduction of 5,600 tons per year of toxic air
pollutants and 52,000 tons per year of VOCs. Also, as a
co-benefit of these proposed standards, EPA projects that
emissions of approximately 700,000 metric tons of CO2
equivalents will be eliminated. Reducing Risk from Diesel Emissions in Communities
Between 10 and 11 million older diesel engines in use
today emit large amounts of nitrogen oxides and
particulate matter. Health impacts from these pollutants are most acute in populations that are near
these engines in use. The Diesel Emissions Reduction Act Grant Program supports immediate,
cost-effective emission reductions to communities overburdened by poor air quality and
disproportionate diesel exhaust. In 2014, EPA targeted special grant opportunities for tribes and
communities near ports. Fenceline communities near ports suffer disproportionately from exhaust
emitted from diesel vehicles, equipment, and vessels used in the movement of goods. In 2014,
EPA addressed these emissions through a ports-only grant opportunity to upgrade or replace
equipment that will generate thousands of tons of criteria pollutant reductions, along with fuel
savings and GHG reductions. In 2014, EPA responded to requests from tribes by implementing a tribes-only grant program.
Tribal applications more than doubled from the previous year, and four tribal grants went forward
for award. These grants will lower diesel exhaust by repowering older diesel engines on tribal
fishing vessels and upgrading school buses used to transport children on tribal lands. The estimated
lifetime health benefits for these ports and tribal projects are up to $140 million.
CLEARING THE HAZE
EPA Region 9 developed three federal
implementation plans for air quality that
will reduce emissions of sulfur dioxide
(SO2) by 29,300 tons per year and
nitrogen oxides (NOx) by 22,100 tons per
year. The plans will improve visibility in
18 protected national parks in the Pacific
Southwest, protect public health, and help
transition the region to cleaner power. The
two Arizona federal plans reduce
pollution from seven facilities, and the
Navajo Nation plan will reduce emissions
of NOx from the Navajo Generating
Station by 80%. In developing the plans,
Region 9 conducted extensive outreach
with the State and Tribe, the public, and
the impacted facilities; held five public
hearings and over 50 consultation
meetings with tribes; and, responded to
77,000 public comments.

1092
Childhood Asthma Risk Reduction
In 2014, EPA successfully completed a 10-
year initiative to train health care
professionals to address environmental
asthma management as part of
comprehensive asthma care and launched a
new initiative to address the next important
gap in comprehensive asthma care:
equipping housing, environmental, and
health insurance programs to effectively
support delivery, infrastructure and
sustainable financing of environmental
asthma interventions at home and school.
Over the last decade, EPA has worked to build health care providers’ capacity to deliver
guidelines-based asthma care that includes a focus on environmental asthma trigger management.
As a result of EPA’s investment, approximately 45,700 healthcare professionals—8,000 in FY
2014—have now been directly trained to address environmental asthma management as part of
comprehensive asthma care; national clinical practice guidelines now include indoor
environmental interventions; and sustainable systems are now in place to support ongoing training,
including accredited online continuing education courses.
Cleaner Cookstoves Research
Cookstove smoke is a major contributor to indoor air pollution in developing countries, causing
approximately 4 million premature deaths annually and a wide range of illnesses according to the
World Health Organization. Still, nearly half of the people in the world depend on burning coal
and biomass (wood, charcoal, crop residues, and dung) in rudimentary cookstoves or open fires to
cook their food. EPA is an international leader in research efforts to develop and encourage
adoption of cleaner-burning stoves and fuels and in FY 2014 supported over $15 million worth of
research on the environmental and health implications of cookstoves. The outcome of the research
will be healthier air for millions, and a more stable climate.
EPA/STATE IMPLEMENTATION PLAN EFFORT
EPA Region 7 led the development of a national framework for coordinating SIP planning with states, including
development, submittal, and EPA final action. This framework, or 4-Year Plan, provides a planning tool for the
reduction of SIP backlogs and supports EPA in meeting Clean Air Act timeframes. Region 7 manages AirTrax, a
national database that populates the National SIP Tracking Report, an integral tool the air program uses to manage
SIPs.

1093
Performance Challenges
Impact of Legal Challenges
EPA faces ongoing legal challenges as it strives to meet its responsibilities under the CAA. For
example, 12 rulemakings representing 18 stationary source categories are currently under court-
ordered deadlines, and the Agency is in negotiation with litigants regarding a notice of intent to
sue on 46 additional standards.
Due to resource constraints, EPA is precluded from addressing all regulatory reviews statutorily
mandated by the CAA. Work is prioritized to meet court-ordered deadlines. There are over 80
stationary source (air toxics) rules due for review under Section 112 of the CAA, and the Agency
is expecting litigation over already-missed deadlines. The Agency also faces a heavy workload
related to implementation of the NAAQS, including citizen petitions opposing state-issued
operating permits, designating areas not attaining the NAAQS, and challenges approving State
Implementation Plans.

1094
STRATEGIC OBJECTIVE 1.3:
RESTORE AND PROTECT THE OZONE LAYER.
Restore and protect the earth’s stratospheric ozone layer and protect the public from the
harmful effects of ultraviolet (UV) radiation.
EPA’s Stratospheric Ozone Protection Program implements the provisions of the CAA and the
Montreal Protocol on Substances That Deplete the Ozone Layer that reduce and control ozone-
depleting substances (ODS) and facilitate the transition to substitutes that reduce GHG emissions
and save energy.
Summary of Progress
The EPA, in consultation with the Office of Management and Budge, has determined that
performance toward this objective is making noteworthy progress. EPA continues to lead progress
domestically and internationally in efforts to restore and protect the ozone layer. Domestically, the
Agency is making progress as anticipated in the FY 2014–2018 EPA Strategic Plan, which states
that by 2015, U.S. consumption of hydrochlorofluorocarbons (HCFCs)—chemicals that deplete
the earth’s protective ozone layer—will be less than 1,520 tons per year of ozone depletion
potential (ODP) from the 2009 baseline of 9,900 tons per year. Final FY 2013 data indicate that
the United States has reduced HCFC consumption to 1,640 tons. EPA expects that, as a result of
worldwide reduction in ODSs, the level of “equivalent effective stratospheric chlorine” in the
atmosphere will have peaked at 3.185 parts per billion (ppb) of air by volume by 2015, and begun
its gradual decline to less than 1.800 ppb (the 1980 level). Key FY 2014 Performance Results
Phaseout of ODSs
As a party to the Montreal Protocol, the United States must incrementally decrease HCFC
consumption and production, culminating in a complete HCFC phaseout in 2030. The major
milestones for the United States and other developed countries are a reduction in 2015 to at least
90 percent below the HCFC ODP weighted baseline and in 2020 to at least 99.5 percent below that
baseline. Working with industry, NGOs, and public sector stakeholders, the Agency is making
more progress than originally anticipated in
the performance measures associated with
the strategic plan, which states that by
2013, U.S. consumption of HCFCs will be
less than 3,700 tons per year of ODP.
Final 2013 data indicate that the United
States has reduced HCFC consumption to
1,641 tons—a level that is over 50 percent
lower than the performance measure level.
In FY 2014, the program ensured
compliance with CAA and Montreal
Protocol requirements restricting U.S.

1095
consumption of HCFCs through regulations established in 2013 that allocated HCFCs through
2014. EPA ensured compliance with these regulations through data reporting requirements that
monitor the availability of consumption and production allowances. In partnership with Customs
and Border Protection, EPA validated regulatory compliance of HCFC imports and worked to stop
illegal shipments.
EPA must ensure that ODS production and import caps under the Montreal Protocol are met by
continuing to implement the domestic rulemaking agenda for reduction and control of ODS.
During 2014, actions toward this end included developing a final rule that sharply reduced HCFC
allocations for 2015–2019 and in 2020 phases out HCFC-22, the most common HCFC.
As the allowed amount of ODSs continues to decline, the demands for flexibility and specific,
tailored solutions to key problems grow. For example, EPA manages ongoing exemption programs
to allow low-quantity continued production of ODS in areas of critical need. In FY 2014, EPA
developed a proposed rule to continue to allow for small quantities of ODSs for essential laboratory
and analytical uses. In 2014, EPA also developed critical-use nominations for methyl bromide; in
July, EPA published a final rule that allocated critical-use methyl bromide for 2014 and 2015.
Performance Challenges
Challenges in the Phaseout of ODSs
HCFC-225 is a solvent used in aerospace and limited national defense applications by the
Department of Defense (DoD) and the National Aeronautics and Space Administration (NASA).
HCFC-225 was slated for a use ban beginning in 2015 under the CAA. However, development of,
and transition to, HCFC-225 alternatives has proceeded slowly, due to the highly demanding
technical requirements of the defense and aerospace applications at issue. In 2014, in order to
support the needs of NASA and DoD, EPA worked to establish a de minimis exemption within
HCFC phaseout regulations that would allow for the continued use of existing stocks of HCFC-
225 by NASA and DoD.
By allowing the continued use of existing stocks of HCFC-225 beyond December 31, 2014, EPA
helped avoid significant decommissioning of otherwise useful aerospace and national defense
assets. This provides significant savings and mission support. Existing regulations do not allow
for additional production of HCFC-225, so EPA does not expect a negative environmental
outcome of the exemption.

1096
STRATEGIC OBJECTIVE 1.4:
MINIMIZE EXPOSURE TO RADIATION.
Minimize releases of radioactive material and be prepared to minimize exposure through
response and recovery actions should unavoidable releases occur.
EPA works with local, national, and international stakeholders to develop and use voluntary and
regulatory programs, public information, and training to reduce public exposure to radiation. EPA
conducts radiation risk assessments, including updating its scientific methodology, modeling, and
technical tools for generating radionuclide-specific cancer risk coefficients to address sensitive
population groups. Risk managers across the country use this information to assess health risks
from radiation exposure and determine appropriate levels for cleanup of radioactively
contaminated sites.
Summary of Progress
EPA is on track to meet its strategic objective of minimizing exposure to radiation by maintaining
readiness, both in personnel and assets, to support federal radiological emergency response and
recovery operations. EPA’s regulatory and non-regulatory activities support its mission to protect
human health and the environment by minimizing unnecessary exposures to radiation, including
operating and maintaining RadNet, providing oversight at the Waste Isolation Pilot Plant (WIPP),
and developing important rules and guidance. Key FY 2014 Performance Results
EPA Regulatory Oversight at the Department of Energy’s Waste Isolation Pilot Plant In February 2014, a small amount of radioactive material was released into the air from the
Department of Energy’s (DOE’s) Waste Isolation Pilot Plant (WIPP) in Carlsbad, New Mexico.
WIPP is a deep geologic repository for transuranic waste: equipment, debris, soil, and other items
contaminated with radioactive elements from the nation’s nuclear defense program. EPA provided
critical oversight in the response and recovery at WIPP, verifying that there were no significant
offsite releases, that there was no threat to public health, and that the facility remains in compliance
with EPA regulations. Additional investigation into the cause of the release, along with other
oversight actions, need to be completed before WIPP will resume normal operations. EPA continues to coordinate closely with the New Mexico Environment Department and other
affected stakeholders to share information and facilitate communications with DOE. As follow-up to the incident, DOE must provide to EPA a written plan for addressing the areas for
improvement identified in EPA’s summary report. In response, DOE has issued a general recovery
plan for WIPP outlining what it will do to re-open the facility and resume normal operations, and
has begun developing a more detailed recovery plan. In its lead role in response to this radiation release incident, EPA successfully demonstrated its
ability to respond quickly, assess the situation, reach out to federal and state partners, and

1097
coordinate with stakeholders to ensure and to verify that the radiation release to the environment
was minimal and posed no threat to public health and the environment. Completed reports related
to the release are posted at http://www.epa.gov/radiation/wipp.
Performance Challenges
Maintaining EPA’s Radiation Emergency Response Program Readiness
Recent events, including the WIPP incident and Fukushima, emphasize the importance of
maintaining our radiation emergency response preparedness. Radiation incidents are unexpected
and could represent a significant public health threat. Through its personnel and assets, EPA plays
an important role in emergency response. Maintaining a high level of readiness requires a steady
level of funding to support both personnel and assets, which can be a challenge in a time of fiscal
constraint.
In particular, EPA’s RadNet monitors the nation’s air, drinking water, and precipitation to
determine levels of radiation in the environment. In a radiological incident, RadNet provides
important baseline data on background levels of radiation in the environment as a point of
comparison to detect increased radiation. It is critical that EPA maintain its emergency response
readiness, including updating the RadNet monitor technology and associated communications
capability, to ensure provision of timely, quality-assured data. Responding to radiation incidents is complex
and requires coordination across all levels of
government. EPA continues to cultivate
existing relationships and establish new ones
in support of the Agency’s role in the
National Response Framework, which
provides context for how the response
community works together and how federal
response efforts should be coordinated.

1098
Strategic Goal 2:
PROTECTING AMERICA’S WATERS

1099

1100
EPA CONTRIBUTING PROGRAMS
Analytical Methods
Beach Program
Coastal and Ocean Programs
Chesapeake Bay
Children’s Health Protection
Clean Water State Revolving Fund
Columbia River Estuary Partnership
Commission for Environmental Cooperation
Cooling Water Intakes
Drinking Water and Ground Water Protection Programs
Drinking Water Research
Drinking Water State Revolving Fund
Effluent Guidelines
Fish Consumption Advisories
Great Lakes
Gulf of Mexico
Human Health and Ecosystem Protection Research
Human Health Risk Assessment
Long Island Sound
Mercury Research
National Environmental Monitoring Initiative
National Estuary Program/Coastal Waterways
National Pollutant Discharge Elimination System
Nonpoint Source Pollution Control
Other Geographic Programs (including Lake Pontchartrain and Northwest Forest),
Lake Champlain, San Francisco Bay Delta Estuary, South Florida
Persistent Organic Pollutants
Pollutant Load Allocation
Puget Sound
Surface Water Protection Program
Sustainable Infrastructure Program
Total Maximum Daily Loads
Trade and Governance
Underground Injection Control Program
U.S.-Mexico Border
Wastewater Management
Water Efficiency
Water Monitoring
Water Quality Research
Water Quality Standards and Criteria
Watershed Management
Wetlands Marine Pollution

1101
STRATEGIC OBJECTIVE 1:
PROTECT HUMAN HEALTH.
Achieve and maintain standards and guidelines protective of human health in drinking water
supplies, fish, shellfish, and recreational waters, and protect and sustainably manage drinking
water resources.
A key component of this objective is to protect public health by ensuring that public water systems
deliver safe drinking water to their customers. To achieve this objective, EPA must work to
maintain previous gains: drinking water systems of all types and sizes that are currently in
compliance will work to remain in compliance. The Agency will make efforts to bring non-
complying systems into compliance and to ensure that all systems will be prepared to comply with
the new regulations.
Summary of Progress
EPA has made progress addressing the safety of our nation’s drinking water, with over 93 percent
of the nation’s population served by community water systems (CWSs) receiving drinking water
that meets all applicable health-based drinking water standards in FY 2014. The following four
examples highlight how EPA is making progress toward its drinking water objective in
collaboration with states, tribes and local utilities:
1) Through the DWSRF, EPA helps ensure reliable delivery of safe water to people served
by small water systems by funding infrastructure improvements, with 70 percent of
assistance agreements going to drinking water systems serving fewer than 10,000 people.
This funding supports EPA’s cross-agency strategy of making a visible difference in
communities, especially in rural and disadvantaged areas.
2) EPA is achieving its priority goal of working closely with states through capacity
development and optimization programs to enhance small system sustainability,
principally through optimization trainings and state-EPA workgroups and products. These
activities improve the states’ capability to help small systems, including drinking water
systems on tribal lands, address their technical, managerial, and financial needs.
3) If adopted by states, EPA’s 2012 recreational water quality criteria recommendations8 will
protect the public from exposure to harmful levels of fecal pathogens.
4) More than 2,000 public water systems participating in the Unregulated Contaminant
Monitoring Rule9 survey provided drinking water monitoring data for 30 unregulated
contaminants; these data support decisions on whether to establish health-based standards
to protect drinking water.
8 For more information on recreational water quality criteria, see
http://water.epa.gov/scitech/swguidance/standards/criteria/health/recreation/
9 For more information on UCMR, see http://water.epa.gov/lawsregs/rulesregs/sdwa/ucmr/

1102
FY 2014 Performance Accomplishments
FY 2014–2015 Agency Priority Goal
By September 30, 2015, EPA will engage with an additional ten states (for a total of 30 states) and
three tribes to improve small drinking water system capability to provide safe drinking water, an
invaluable resource.
As of September 30, 2014, eight states have substantially increased their participation in capacity
development program activities beyond previous levels or begun to participate in the treatment
optimization program.
In August, EPA launched a state-EPA workgroup to re-energize the operator certification
program. Sixteen states volunteered to participate, indicating much enthusiasm for sharing
best practices and identifying opportunities for program improvements.
The tribal component of this Agency priority goal, intended to pilot state optimization
program elements with several tribes in Region 4, has garnered tribal interest beyond the
target group. Tribes outside Region 4—specifically Mandan, Hidatsa, and Arikara Nation
affiliated tribes in North Dakota—have agreed to participate in water sector emergency
readiness exercises.
States continued to be challenged by limited resources, which makes it difficult to engage with
EPA through this goal. Meanwhile, staff limitations make it challenging for EPA to develop
projects with states or hold webinars on state best practices and small system sustainability
activities.
Challenges to small drinking water system compliance include aging infrastructure, increased
regulatory requirements, workforce shortages/high turnover, increasing operational costs,
declining rate bases, and extreme natural disasters/weather events.
Community Water Systems Performance
A primary gauge of community water
system performance is the person-months
measure. For this measure, person-months
for each CWS are calculated as the
number of months in the most recent four-
quarter period in which health-based
violations overlap, multiplied by the retail
population served. The measure includes
maximum contaminant level (MCL),
maximum residual disinfection limit
(MRDL), and treatment technique
violations; it covers any violations from
currently open and closed CWSs that
overlap any part of the most recent four

1103
quarters. The EPA Office of Ground Water and Drinking Water (OGWDW) calculates the measure
using data reported in the Safe Drinking Water Information System-Federal (SDWIS-FED).
The person-month measure achieved the 2014 target of 95 percent: during 96.7 percent of the
person-months over a 12-month period, CWSs provided drinking water that met all applicable
health-based drinking water standards. The success of the measure is attributed to a national
decrease in treatment technique violations that occur at the largest water systems, as well as how
states are addressing background drinking water contaminants (e.g., arsenic) that chronically
challenge water systems. This performance also reflects the long-term efforts of the states and EPA
to minimize any health-based violations, while building appropriate technical, managerial and
financial system capability.
Drinking Water in Indian Country
EPA calculates this measure using data
reported in EPA’s Safe Drinking Water
Information System/FED. This measure
includes federally regulated MCL,
MRDL, and treatment technique
violations; it covers any violations from
currently open and closed CWSs in Indian
Country that happened during any of the
most recent four quarters.
The tribal population measure met the
2014 goal of 87 percent, with a FY 2014
end of year performance result of 88.6 percent. This is the first time since 2010 that this measure
has met its annual target. EPA’s success this year is
attributed to the regional programs’ diligence in
completing sanitary surveys, which offered an
opportunity to identify potential issues and provide
technical assistance to tribal utilities. In addition,
regional programs and HQ continued extensive
coordination through our federal partnerships
specifically with the Indian Health Service to assist
tribally owned and operated public water systems
deliver safe drinking water that meets all health-based
standards to their customers.
FY 2014 Performance Challenge
Tribal Water Systems
Tribal systems continue to face obstacles in achieving
and maintaining managerial and financial capacity.
Limited resources for direct implementation programs
DROUGHT RESPONSE STRATEGY
EPA Region 9 developed and began
implementing a first-ever Drought Response
Strategy to: (1) provide emergency relief for
vulnerable tribes and small communities; (2)
collaborate with water agencies to find and
fix leaks in their water distribution systems
through audits and infrastructure repairs; (3)
partner with HUD and other federal agencies
to encourage the installation of WaterSense
fixtures in federal buildings and federally
financed public housing; and, (4) expand
water recycling and groundwater
replenishment to increase resilience to the
impacts of climate change. Region 9 will use
the Strategy to drive transformational change
in the way water is managed across the
Pacific Southwest Region.

1104
restricts the Agency’s ability to provide sufficient training and technical assistance for tribal
utilities. EPA continues to work with our federal partners to target infrastructure assistance,
conduct sanitary surveys at tribal systems to identify deficiencies, and fund circuit riders to work
directly with tribal operators.

1105
STRATEGIC OBJECTIVE 2.2:
PROTECT AND RESTORE WATERSHEDS AND AQUATIC ECOSYSTEMS.
Protect, restore, and sustain the quality of rivers, lakes, streams, and wetlands on a watershed
basis, and sustainably manage and protect coastal and ocean resources and ecosystems.
This objective captures EPA’s efforts to protect and improve water quality in the nation’s
watersheds as well as ocean, coastal, and estuarine waters. It includes all of the major activities
EPA undertakes to implement the Clean Water Act—for example, updating water quality
standards, implementing the National Pollutant Discharge Elimination System (NPDES) permit
program, conducting monitoring and assessment, implementing practices to reduce pollution from
agricultural and urban runoff (e.g., nonpoint sources), protecting wetlands and habitat, and
developing total maximum daily loads (TMDLs) to reduce pollutants. These activities have
contributed to the steady progress EPA is making to protect and restore the nation’s waters, despite
challenges from population growth, aging infrastructure, and climate change.
Summary of Progress
EPA made significant progress in FY 2014 in protecting
and restoring watersheds and aquatic ecosystems. A
cumulative total of 3,866 waterbodies that were listed as
impaired in 2002 were attaining water quality standards
at the end of the year. EPA met its programmatic goals in
FY 2014 by achieving its annual targets for sustaining a
Clean Water State Revolving Fund utilization rate of
over 97 percent, establishing or approving TMDLs, and
maintaining 90 percent of non-tribal NPDES permits in
current status. EPA and its partners also increased
wetland acres restored and improved to a cumulative
total of 221,000 acres.
EPA’s geographic programs largely achieved their end of
year goals. Key accomplishments include completing
management actions at three areas of concern in the Great
Lakes for a cumulative total of seven (the target was
five), restoring over 41,000 acres of estuarine wetlands
in Puget Sound, and restoring or protecting over 93,000
acres of habitat in National Estuary Program (NEP) study
areas (just short of the target of 100,000 acres).
EPA also supported States and local water utilities in responding to the water related challenges
posed by a changing climate. EPA deployed new tools to develop climate change adaptation plans
on a watershed or estuary basis, to help water utilities improve preparedness for coastal and inland
flooding, and to help local developers design stormwater practices that account for changing
rainfall patterns. The National Water Program also released a final Climate Change Adaptation
Implementation Plan (http://www.epa.gov/climatechange/Dounloads/OW-climate-change-
adaptation-plan.pdf).
PUGET SOUND BASIN TREATY RIGHTS
AT RISK
EPA Region 10’s Puget Sound Program
(State of Washington) addressed several
issues related to Treaty Rights at Risk.
EPA directed $2.8 million in 2014
funding and $3.0 million planned in 2015
to kick-start coordinated investments for
riparian buffer restoration and permanent
protection. In addition, EPA directed $1
million for culvert removal projects in the
Puget Sound Basin and worked with
federal and state partners to develop
strategies to address fish passage barriers
and reduce shoreline armoring. EPA, the
National Oceanic and Atmospheric
Administration, and the Natural
Resources Conservation Service led the
Puget Sound Federal Caucus in the early
development of a coordinated investment
strategy to accelerate the pace of salmon
and shellfish recovery.

1106
EPA awarded Urban Waters Small Grants of $40,000 to $60,000 each to 37 organizations,
providing approximately $2.1 million to support projects helping communities in their efforts to
access, improve, and benefit from their urban waters and the surrounding land. These local projects
showcase how EPA is making a visible difference in underserved communities on the ground by
helping to restore urban waters, improve water quality and support community revitalization and
other local priorities.
FY 2014 Performance Accomplishments
FY 2014–2015 Agency Priority Goal
By September 30, 2015, 100 percent of the states will have updated nonpoint source management
programs that comport with the new Section 319 grant guidelines. This will result in better
targeting of resources through prioritization and increased coordination with the U.S. Department
of Agriculture (USDA).
As of September 30, 2014, all of the states and Washington, D.C. are on track for meeting EPA’s
priority goal to update their nonpoint source management programs by September 30, 2015. Six
state programs were already up to date when EPA established this goal. Of the other 45 (counting
Washington, D.C.):
84 percent of states and Washington, D.C. with outdated NPS management programs have
either an EPA-approved management program or submitted a draft to the EPA for review.
o Twenty-three now have EPA-approved programs.
o Fifteen have submitted drafts to EPA for review.
Seven have made progress and expect to provide draft updates to EPA by December 2014.
EPA and State Development of TDMLs
National policy is to complete TMDLs
for Section 303(d)–listed, impaired
waters within eight to 13 years of their
date of initial listing, on average, and
to complete all consent decree TMDL
commitments. 10 This measure tracks
development of annual pace of TMDL
completion in line with national policy
on a state-by-state basis.
Although the results of this measure
include state and EPA TMDLs, states
developed all of the TMDLs in FY
2014. In particular, Florida developed
10 A TMDL is a technical plan for reducing pollutants in order to attain water quality standards. The terms
“approved” and “established” refer to the completion and approval of the TMDL itself.

1107
over 1,200 TMDLs; Montana continued to work hard to complete its consent decree requirements;
and Utah, Wyoming, New York, and California exceeded their commitments. To date, EPA and
states have developed 71,390 TMDLs, of which 62,539 were developed by states.
FY 2014 will be the last year that the Clean Water Act 303(d) Listing and TMDL Program reports
on this measure; the Agency has engaged with states to implement a new 10-year vision for the
program.11 As part of this effort, EPA will continue to work with states to identify priority waters
for assessment, development of TMDLs and other restoration plans for impaired segments, and
pursuit of protection approaches for unimpaired waters. In FY 2015, the program will transition
from reporting on the number of TMDLs developed to the number of priority areas where TMDLs,
alternative restoration, or protection plans have been completed. Development of these new
measures was driven by the desire of both EPA and the states to more accurately report on the
success of the program in line with the new 303(d) vision.
Meeting Water Quality Standards
This measure is designed to demonstrate cumulative successes of the surface water program in
achieving water quality standards in waters formerly assessed as not meeting water quality
standards.
EPA exceeded its FY 2014 commitment
for this measure. By attaining water
quality standards, waters become safer for
drinking, fishing, and swimming. EPA
and state managers have given high
attention and priority to this measure,
contributing to its continued success.
However, some challenges affect the
ability of the states and EPA to sustain this
level of progress: reduced state budgets
are slowing the implementation activities
needed to restore impaired waterbodies; it
is more difficult to address pollutants for a waterbody segment with multiple pollutants than for
just one or a few impairing pollutants; and many of the remaining impairments will take years
before the water segment is fully recovered.
Great Lakes Areas of Concern
During the first five years of the Great Lakes Restoration Initiative (GLRI), federal agencies and
their partners, led by EPA, completed all of the management actions required to remove five Areas
of Concern (AOCs) from the list of areas designated as the most contaminated sites on the Great
Lakes. Management actions were completed at four of those AOCs in FY 2014: Ashtabula River
(Ohio), Deer Lake (Michigan), Waukegan Harbor (Illinois), and White Lake (Michigan). Since
11 For more information, see:
http://water.epa.gov/lawsregs/lawsguidance/cwa/tmdl/upload/vision_303d_program_dec_2013.pdf

1108
then, the Deer Lake and White Lake AOCs have been formally delisted. (Delisting is an
international process to remove an AOC from the list of AOCs in the Great Lakes Water Quality
Agreement.)
After decades during which only one
U.S. AOC was delisted, federal
agencies have accelerated cleanup
actions during the past five years by
strategically targeting GLRI activities
at management actions identified by
state partners and removal of beneficial
use impairments (BUIs). For delisting,
the management actions must be
completed and the BUIs (indicators of
poor environmental health such as
restrictions on fish and wildlife
consumption, fish tumors, restrictions
on dredging, and loss of habitat) at the
AOC must first be restored. AOC restoration will ultimately be measured by the removal of all
BUIs at the contaminated site.
In FY 2014, the cumulative BUI removal total was 52, exceeding targets in the Government
Performance and Results Act and the GLRI Action Plans. EPA prioritized restoration of AOCs
within the GLRI. Prioritization included:
A focus of multi-agency activities and funding to advance the pace and amount of work
performed at AOCs, including, but not limited to, remediation of contaminated sediments.
Enhanced project management related to the planning, coordination, and implementation
of remediation and restoration actions in AOCs.
Stormwater Calculator
EPA researchers developed the National Stormwater Calculator to provide decision-makers and
others with an online tool to assess the impact of incorporating green infrastructure features, such
as rain gardens, rain barrels, cisterns, and open parks, into their projects. The free tool is designed
to be used by anyone interested in reducing runoff from a property, including site developers,
landscape architects, urban planners, and homeowners. The calculator provides estimates of the
annual amount and frequency of runoff from any location in the United States (including Puerto
Rico), based on information collected about the selected site, such as local soil conditions, slope,
land cover, and historical rainfall records. In 2014, as part of President Barack Obama’s Climate
Change Action Plan, EPA researchers enhanced the Calculator with climate assessment
capabilities.

1109
FY 2014 Performance Challenges
Nonpoint Source Nutrient Runoff
Nutrient runoff from nonpoint sources (e.g., agricultural
lands and urban landscapes) is widespread. EPA must
continue to work with state and federal partners to develop
and implement effective solutions.
Nonpoint source pollution has been recognized as the
largest remaining impediment to improving national water
quality. Nutrient pollution is a national problem. National
monitoring efforts, such as U.S. Geological Survey reports
on surface water quality12 and EPA’s National Aquatic
Resource Surveys,13 document the widespread impacts of
nutrients on our nation’s waters.
Nutrient pollution is one of the most widespread, costly,
and challenging environmental problems. It contributes to
hypoxic areas in the Great Lakes, Gulf of Mexico,
Chesapeake Bay, and the Long Island Sound. 14 It
significantly affects drinking water supplies, aquatic life,
and recreational water quality around the country, and
these impacts occur in all categories of waters—rivers,
streams, lakes, reservoirs, estuaries, and coastal areas.
Every U.S. state has nutrient-impaired waters,
making it a national issue, for both surface water
and groundwater. Over 15,000 waterways are listed
for nutrient-related pollution (counting waters
listed for nutrients specifically, as well as waters
listed for organic enrichment and oxygen depletion
or algal growth).15 Awareness is also growing of
the impacts of nutrient enrichment on drinking
water and source waters.
Population growth is expected to exacerbate the nutrients problem. EPA needs continued near-
term action and demonstrable progress in reducing nutrients—while states continue to develop and
adopt numeric criteria for nutrient pollution, so they have clear metrics to guide their efforts to
protect and restore waters from nutrient pollution.
12 USGS Circular 1350: Nutrients in the Nation's Streams and Groundwater. 13 National Aquatic Resource Surveys 14 For trend data on Gulf of Mexico and Long Island Sound hypoxia, see
http://cfpub.epa.gov/roe/indicator.cfm?i=41 15 http://iaspub.epa.gov/waters10/attains_nation_cy.control?p_report_type=T
PROTECTING WATER QUALITY WITH
STORMWATER MANAGEMENT
In response to Clean Water Act
requirements and to protect water
quality, EPA released for public
comment a draft general permit for
small “Municipal Separate Storm Sewer
Systems” located in the Commonwealth
of Massachusetts. To assist both first-
time regulated municipalities and those
already subject to stormwater
regulations, EPA conducted outreach to
help Massachusetts municipalities learn
about the terms of the new draft permit,
the use of green infrastructure and other
sustainable best management practices
for curbing stormwater pollutant
discharges and runoff, and available
financing options. When finalized, this
permit will establish requirements for
about 260 cities and towns and another
30 state- and/or federally-owned
properties in Massachusetts to help
develop, implement and enforce
stormwater management programs thus
reducing stormwater discharges across
the state.

1110
EPA is working diligently with its
partners across the country to combat the
nitrogen and phosphorus pollution
problems, including protecting and
restoring surface and ground waters
already degraded by nutrient pollution
through:
Working with states to develop
and implement nitrogen and
phosphorus pollution reduction
frameworks that address all
sources of nutrient pollution to
achieve near-term reductions in
nitrogen and phosphorus pollution.
Helping develop states’ numeric nutrient standards.
Providing example approaches to states for assessing whether waters are attaining nutrient-
related narrative criteria and/or supporting designated uses.
Providing funding:
Awarding grants to states for operating nonpoint source management programs.
For building and upgrading municipal wastewater facilities and implementing both
nonpoint source pollution control and estuary protection projects.
Coordinating with EPA-USDA:
Example: the National Water Quality Initiative, with landowners in 174 small
watersheds across the country. The agencies coordinate in voluntary private land
conservation investments and support state-led water quality monitoring.
Committing to science:
Assessing national and regional progress using National Aquatic Resource Surveys.
Conducting and/or supporting research on topics related to nitrogen and phosphorus
pollution.
Promoting innovation toward cost-effective and practical solutions.
Broadening outreach to stakeholders and the public on nutrient pollution and related issues
as well as on the effects of nutrient pollution on human health, the environment, and the
economy.
1111
Strategic Goal 3:
CLEANING UP COMMUNITIES AND ADVANCING SUSTAINABLE
DEVELOPMENT

1112

1113
EPA CONTRIBUTING PROGRAMS
RCRA Waste Management
RCRA Corrective Action
RCRA Waste Minimization and Recycling
Superfund Emergency Preparedness
Superfund Remedial
Superfund Enforcement
Superfund Emergency Response and Removal
Environmental Response Laboratory Network
Federal Facilities Restoration and Reuse
Oil Spill Prevention Preparedness and Response
Leaking USTs
UST Prevention and Compliance
Homeland Security
Brownfields and Land Revitalization
Commission for Environmental Cooperation
Community Action for a Renewed Environment
Global Change Research
Homeland Security Research
Human Health and Ecosystem Protection Research
Human Health Risk Assessment
National Environmental Monitoring Initiative
Smart Growth
Research Fellowships
State and Local Prevention and Preparedness
U.S.–Mexico Border
Sector Grant Program
State and Tribal Pollution Prevention Grants
Tribal Capacity-Building
Tribal General Assistance Program
Risk Management Program

1114
STRATEGIC OBJECTIVE 1:
PROMOTE SUSTAINABLE AND LIVABLE COMMUNITIES.
Support sustainable, resilient, and livable communities by working with local, state, tribal, and
federal partners to promote smart growth, emergency preparedness and recovery planning,
redevelopment and reuse of contaminated and formerly contaminated sites, and the equitable
distribution of environmental benefits.
Since its inception in 1995, EPA’s Brownfields Program has grown into a proven, results-oriented
program that has changed the way contaminated property is perceived, addressed, and managed.
It is designed to empower states, communities, and other stakeholders in economic redevelopment
to work together in a timely manner to prevent, assess, safely clean up, and sustainably reuse
brownfields; this supports the Agency’s cross-agency strategy for “Working to Make a Visible
Difference in Communities.”
A brownfield is a property whose expansion, redevelopment, or reuse may be complicated by the
presence or potential presence of a hazardous substance, pollutant, or contaminant. It is estimated
that there are more than 450,000 brownfields in the United States. Cleaning up and reinvesting in
these properties increases local tax bases, facilitates job growth, puts existing infrastructure to use,
takes development pressures off undeveloped open land, and both improves and protects the
environment.
Also as part of this objective, EPA promotes accident prevention and preparedness activity under
Section 112(r) of the Clean Air Act Amendments by publishing regulations and guidance for
chemical accident prevention at facilities that use extremely hazardous substances. These
regulations and guidance are contained in the Risk Management Plan (RMP) rule. The information
required from facilities under RMP helps local fire, police, and emergency response personnel
prepare for and respond to chemical facility emergencies and fosters communication and
awareness to improve accident prevention and emergency response practices at the local level. The
RMP rule was built upon existing industry codes and standards. It requires companies that use
certain flammable and toxic substance to develop RMPs in order to assess risks, improve
operations, and prepare response plans.
Summary of Progress
Throughout 2014, EPA continued to make progress toward the strategic targets in its FY 2014–
2018 Strategic Plan for the Brownfields and Risk Management Programs. Specifically, in FY
2014, the Agency continued funding for brownfields cleanup activities by providing grants and
technical assistance to communities, states, and tribes for the assessment, cleanup, and
redevelopment of formerly contaminated properties, as well as leveraging thousands of jobs. To
date, Brownfields funding has resulted in 22,336 brownfields properties assessed, 102,740 jobs
leveraged, and more than 47,000 acres made ready for anticipated reuse. EPA worked closely with
both existing and new Brownfields Area-Wide Planning (AWP) grantees across the country to
help them involve the community, prepare their plans, and leverage investments toward site
cleanup and reuse. The initial 23 Brownfields AWP pilots have leveraged over $400 million in
federal, state, and private investments.
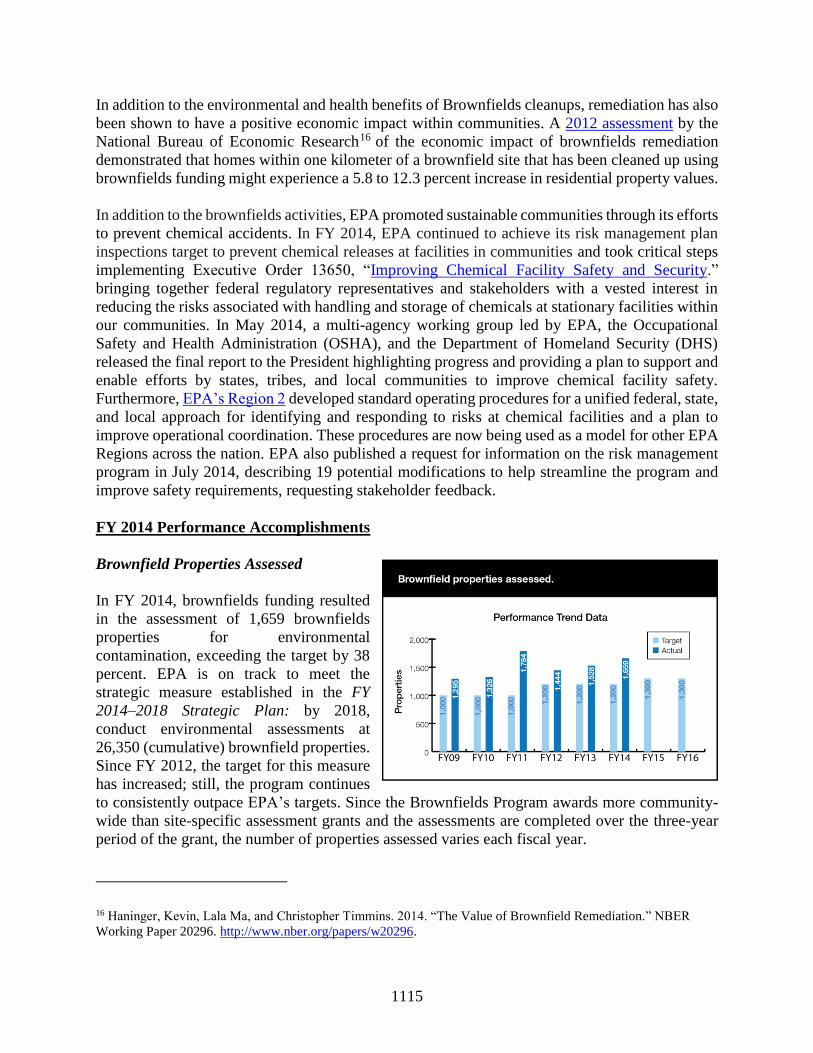
1115
In addition to the environmental and health benefits of Brownfields cleanups, remediation has also
been shown to have a positive economic impact within communities. A 2012 assessment by the
National Bureau of Economic Research16 of the economic impact of brownfields remediation
demonstrated that homes within one kilometer of a brownfield site that has been cleaned up using
brownfields funding might experience a 5.8 to 12.3 percent increase in residential property values.
In addition to the brownfields activities, EPA promoted sustainable communities through its efforts
to prevent chemical accidents. In FY 2014, EPA continued to achieve its risk management plan
inspections target to prevent chemical releases at facilities in communities and took critical steps
implementing Executive Order 13650, “Improving Chemical Facility Safety and Security.”
bringing together federal regulatory representatives and stakeholders with a vested interest in
reducing the risks associated with handling and storage of chemicals at stationary facilities within
our communities. In May 2014, a multi-agency working group led by EPA, the Occupational
Safety and Health Administration (OSHA), and the Department of Homeland Security (DHS)
released the final report to the President highlighting progress and providing a plan to support and
enable efforts by states, tribes, and local communities to improve chemical facility safety.
Furthermore, EPA’s Region 2 developed standard operating procedures for a unified federal, state,
and local approach for identifying and responding to risks at chemical facilities and a plan to
improve operational coordination. These procedures are now being used as a model for other EPA
Regions across the nation. EPA also published a request for information on the risk management
program in July 2014, describing 19 potential modifications to help streamline the program and
improve safety requirements, requesting stakeholder feedback.
FY 2014 Performance Accomplishments
Brownfield Properties Assessed
In FY 2014, brownfields funding resulted
in the assessment of 1,659 brownfields
properties for environmental
contamination, exceeding the target by 38
percent. EPA is on track to meet the
strategic measure established in the FY
2014–2018 Strategic Plan: by 2018,
conduct environmental assessments at
26,350 (cumulative) brownfield properties.
Since FY 2012, the target for this measure
has increased; still, the program continues
to consistently outpace EPA’s targets. Since the Brownfields Program awards more community-
wide than site-specific assessment grants and the assessments are completed over the three-year
period of the grant, the number of properties assessed varies each fiscal year.
16 Haninger, Kevin, Lala Ma, and Christopher Timmins. 2014. “The Value of Brownfield Remediation.” NBER
Working Paper 20296. http://www.nber.org/papers/w20296.

1116
As of the end of FY 2014, EPA assessed 22,336 brownfields properties. Phase I funding for
property assessments helps communities examine historical records to identify properties likely to
be contaminated based on past uses, and indicates the need for additional environmental work,
such as a Phase II assessment to characterize suspected contamination. This measure represents an
important milestone in the overall cleanup process and can lead to a reuse/redevelopment outcome
that would leverage local development sources to drive employment and enhance the livability of
the community containing the property. Equally important, assessments can indicate that
brownfield sites may not be contaminated and can therefore be safely reused without cleanup.
Brownfield Properties Cleaned Up
A fundamental purpose of EPA’s
Brownfields Program is to provide funding
and resources to clean up properties with
contamination that pose health or
environmental risks, impeding property
reuse and economic redevelopment. EPA’s
Brownfields Program provides
communities with grants to help fund the
cleanup of contaminated sites.
In FY 2014, EPA completed 132 brownfields cleanups, an
increase of 10 cleanups from FY 2013; this puts EPA on track
to meet the strategic target established for the following
measure in the FY 2014–2018 Strategic Plan: by 2018, make
an additional 16,800 acres of brownfield properties ready for
reuse from the 2012 baseline Since FY 2009, the Brownfields
Program has averaged 118 cleanups per year and has funded
705 completed cleanups. There has also been an increased
effort to ensure that grant recipients actively report cleanup
activities and progress in ACRES (EPA’s brownfields
database).
Developing Interactive Tools for the Public
In May 2014, EPA released EnviroAtlas, a multi-scale
(national to community), Web-based, interactive mapping,
visualization, and analysis tool that provides the first-ever
picture of the distribution of ecosystem services for the
mainland United States. EnviroAtlas integrates over 300
separate data layers developed through collaboration between
EPA; the U.S. Geological Survey; the U.S. Forest Service;
other federal, state, and nonprofit organizations; and several
universities. The tool was designed to help decision-makers understand the implications of
planning and policy decisions on our fragile ecosystems and the communities who depend on
goods and services from these ecosystems.
PUBLIC, PRIVATE, AND
INTERGOVERNMENTAL
ROUNDTABLE: REVITALIZING
FOUR OHIO RIVER
COMMUNITIES
Region 3 facilitated a
Manufacturing Community
Roundtable in Beaver County, PA,
focusing on public-private and
intergovernmental partnerships to
revitalize four communities along
the Ohio River: Monaca, Midland,
Alquippa, and Coraopolis. As part
of the White House initiative to
promote manufacturing, the
Roundtable addressed brownfields
reuse, infrastructure, workforce
development, job training, job
creation, and riverfront and
community revitalization.

1117
Users can investigate land cover patterns, see how ecosystem services reduce pollution, and view
closer to true scale data to compare them across selected communities. EnviroAtlas helps
communities better understand the potential benefits and drawbacks of their decisions by providing
tools to analyze relationships between nature, health and well-being, and the economy.
Performance Challenges
Implementation of Executive Order on
Improving Chemical Facility Safety and
Security
Implementing activities related to the
“Improving Chemical Facility Safety and
Security” Executive Order includes
addressing the capacity and resources for
state, tribal, and local preparedness
organizations. Assisting these
organizations with chemical incident
preparedness involves addressing
thousands of facilities of many types with
hundreds of different chemicals. These
facilities are often located in communities
where funding is scarce and organizational
structure of local emergency management
organizations is often in a state of flux.
EPA will focus on leveraging these
resources by working with State
Emergency Response Commissions and
Tribal Emergency Response Commissions
to develop online training on key
requirements under the Emergency
Planning and Community Right-to-Know
Act. EPA will also develop guidance and
training for Local Emergency Planning
Committees and Tribal Emergency
Planning Committees to reinforce their
authorities, roles, and responsibilities and
identify barriers to meet their requirements
for development and implementation of
local emergency response plans.
CHEMICAL FACILITY SAFETY OUTREACH
Region 7 conducted extensive chemical facility safety
outreach in FY14, reaching thousands of agricultural
community members and emergency responders. These
efforts included:
Posting a video on Region 7’s Facebook page on the need
to enhance communications between emergency
responders and owners/operators of hazardous chemical
storage facilities.
Partnering with the Missouri Emergency Response
Commission, OSHA, and DHS to conduct workshops on
safely handling ammonium nitrate and other potentially
hazardous agricultural chemicals.
Designing and presenting two-day long webinars on the
Chemical Accident Prevention Provisions (also known as
the Risk Management Program).
Partnering with the Fertilizer Institute and other non-
profit organizations to help agricultural retailers with
their risk management plans, required under the chemical
accident provisions of the Clean Air Act.
Addressed participants at the 2014 Kansas Local
Emergency Planning Committee Conference on the
requirements of Executive Order 13650, Improving
Chemical Facility Safety and Security, and building
capacity for increasing chemical facility safety locally.
Conducted information sessions with eight state
Emergency Response Commissions and 24 Local
Emergency Planning Commissions on potential changes
in chemical facility safety regulations and requirements.

1118
STRATEGIC OBJECTIVE 2:
PRESERVE LAND.
Conserve resources and prevent land contamination by reducing waste generation and
toxicity, promoting proper management of waste and petroleum products, and increasing
sustainable materials management.
Preventing contamination and preserving critical resources is vital to creating healthy and vibrant
communities and ecosystems. EPA, in partnership with states, currently oversees and manages a
variety of programs that manage hazardous waste, prevent potentially dangerous releases, and
promote approaches to change the way our society protects the environment and conserves our
resources for future generations in a sustainable manner. These efforts support the Agency’s cross-
agency strategy for “Working Toward a Sustainable Future.”
Summary of Progress
The long-term vision of this objective is to prevent accidental releases that contaminate land, air,
and water and can adversely affect human health, and to change the way our society thinks about
materials and their associated environmental impacts. Through a Sustainable Materials
Management (SMM) approach, EPA is helping to change the way our society protects the
environment and conserves resources for future generations. Building on the familiar “Reduce,
Reuse, Recycle,” concept, SMM aims to reduce negative environmental impacts across the life
cycle of materials, from resource extraction and manufacturing to use, reuse, recycling, and
disposal. SMM approaches can result in lower energy use; more efficient use of materials; more
efficient movement of goods and services; water conservation; and reduced volume and toxicity
of waste. While EPA is striving for SMM, EPA works to ensure that when materials reach the true
end of life, they are disposed of properly and safely.
In FY 2014, EPA continued to make progress toward the strategic goals that advance this vision.
Specifically, EPA continued to make significant progress developing and implementing a targeted
SMM program centered on three challenge areas: responsible management of used electronics,
sustainable food management, and reducing the environmental footprint of the federal government.
Furthermore, the Agency completed a methodology to evaluate the potential uses of coal
combustion residues (CCR), commonly known as coal ash, and applied this methodology to the
two most common beneficial uses of CCRs—uses in concrete and wallboard. Reusing coal ash in
a product replaces virgin raw materials removed from the earth, thus conserving natural resources.
Not only were these products useful to ensure that reuse of CCRs is appropriate but they can be
valuable tools for EPA, states, and other stakeholders in evaluating future beneficial uses of
industrial materials moving the science and practice of beneficial use forward.
In FY 2014, EPA also issued the E-Manifest One-Year Rule to authorize the use of electronic
hazardous waste manifests. This allows the current process (which requires paper forms) to be
streamlined, greatly reducing the millions of paper manifests produced each year. EPA also
completed an Agency-wide plan to provide solid waste management capacity assistance to Tribes
that promotes the development and implementation of integrated waste management plans and
describes how EPA will prioritize its resources to maximize environmental benefits. The Plan

1119
implements the recommendations made by a March
2011 EPA Office of Inspector General Evaluation
Report, EPA Needs an Agency-Wide Plan to Provide
Tribal Solid Waste Management Capacity Assistance.
Finally, given that preventing underground storage tank
(UST) releases is the best way to ensure that our
communities are clean and safe, and also prevent sites
from being abandoned, the Agency also engaged in
rigorous UST release prevention efforts—as shown by
the 2014 performance results for the two UST
prevention measures. States have successfully
implemented the new tools from the Energy Policy Act
of 2005: requiring all new tank systems have secondary
containment; using the new delivery prohibition
enforcement tool; providing an annual “public record”
for their tanks programs; and ensuring all operators are
trained. Since the increase in frequency of tank
inspections, compliance rates have increased to 71.6
percent—a 5.6 percent increase since FY 2009—and the
number of new releases is generally trending downward.
FY 2014 Performance Accomplishments
Use of Virgin Resources Offset Through SMM
EPA continues to make significant progress developing and implementing a targeted SMM
program centered on the three challenge areas. Achievements in FY 2014 include preventing food
waste through the Food Recovery Challenge, with participants diverting 375,000 tons of food from
landfills; diverting more than 220,000
metric tons of end-of-life electronics
through EPA’s Electronics Challenge; and
reducing the environmental footprint of
more than 400 federal facilities through
the Federal Green Challenge by diverting
523,000 tons of waste from landfills,
saving taxpayers an estimated $42 million.
These efforts support the associated
strategic measure: by 2018, increase by
500,000 tons the amount of virgin
materials that were offset by the reuse or
recycling of waste products through the
use of SMM.
EPA WELCOMES NCAA FINAL FOUR
AND SUSTAINABILITY TO TEXAS
EPA organized Educational Outreach and
Food Recovery for the National Collegiate
Athletic Association (NCAA) Final Four
in Texas. During the events, EPA worked
with two nonprofit organizations—Rock
and Wrap It Up! and Food Source DFW—
to facilitate food recovery at AT&T
Stadium and the Kay Bailey Hutchison
Convention Center. The partnership
resulted in 2,800 pounds of leftover food
delivered to homeless shelters. As a result,
the Kay Bailey Hutchison Convention
Center has established a program to
provide leftover edible food from catered
events to the nearby Dallas Life Shelter
and has enrolled in the Food Recovery
Challenge. Reducing, recovering, and
recycling food at sporting events decreases
environmental impacts by reducing the
waste generated by large-scale food
disposal and saving the energy required to
dispose of that food.

1120
In FY 2014, EPA reported the actual FY 2012
results—over 9.0 million tons of virgin
materials offset. Given this success from the
first round of reporting, EPA increased FY
2015 and FY 2016 targets to 9.347 million and
9.450 million tons respectively. The results for
FY 2013 will be available in the spring of FY
2015; EPA anticipates exceeding the existing
target of 8.5 million tons.
More Hazardous Waste Facilities with New or
Updated Controls
The Resource Conservation and Recovery Act
(RCRA) permitting program is a core
programmatic effort for protecting human
health and the environment in communities that
host RCRA facilities, and for ensuring
compliance with waste management standards
consistent with the proper handling and
disposal of hazardous wastes. Preventing
releases from RCRA facilities by issuing and maintaining permits also provides cost savings, as a
typical RCRA corrective action to address
a release into the environment from
mismanaged wastes can easily cost
$100,000 or more. EPA measures program
progress by reporting the number of RCRA
hazardous waste facilities with new or
updated controls completed each fiscal
year, as seen in the graph below. This
annual measure contributes to the long-
term goal of 500 additional facilities
described in the Agency’s FY 2014–2018
Strategic Plan. In FY 2014, EPA
completed 129 accomplishments,
surpassing the target by 20 percent. Since
FY 2009, due to EPA’s work, 745 facilities received new or updated controls.
To prevent future environmental contamination and to protect the health of the estimated 20
million people living within a mile of a hazardous waste management facility,17 EPA and its
partners issue, update, or maintain RCRA permits for approximately 20,000 hazardous waste units.
17 Estimate drawn from the Office of Solid Waste and Emergency Response’s Near Site Population Database, an
internal EPA database that merges facility size and location information from RCRAInfo with population data, at the
block and block group levels, from the U.S. Census Bureau’s 2000 Census. The demographics were captured around
PACIFIC SOUTHWEST
FEDERAL GREEN CHALLENGE
EPA’s Pacific Southwest Region recruited and
retained 63 Federal Green Challenge participants.
The Green Challenge program encourages and
recognizes participants for outstanding efforts in
conservation and resource recovery in the target areas
of waste, electronics, purchasing, water, energy, and
transportation. Collectively, the area participants:
Conserved 1.65 billion cubic feet of natural gas.
Diverted 53,000 tons of materials from landfills
to reduce greenhouse gas equivalents by 169,505
metric tons of carbon equivalent—equal to
conserving 6.43 million gallons of gasoline.
Purchased over 24 million sheets of 100%
recycled paper to conserve over 1,800 40-foot
trees.
Saved $15.2 million in reduced waste disposal
and utility costs.

1121
More UST Facilities in Compliance
In FY 2014, EPA increased to 72.5 percent the
number of UST facilities that were in
significant operational compliance, exceeding
its goal of 70 percent. Since the enactment of
the Energy Policy Act and the implementation
of the requirement that USTs be inspected at
least once every three years, EPA continues to
see a steady increase in the number of UST
facilities that comply with leak prevention and
detection requirements. Since FY 2009,
compliance rates have increased by 6.5 percent;
the backlog of sites needing to be cleaned up is
the lowest since 1990. The collaboration
between EPA and states and tribes contributes to this success and supports the Agency’s A New
Era of State, Local, Tribal, and International Partnerships cross-agency strategy.
Performance Challenge
As noted in the accomplishment above, states report significant improvement in both compliance
and release reduction since they began inspecting every tank at least once every three years.
However, states have raised concerns that there might not be sufficient resources to enable them
to meet the Energy Policy Act mandate to inspect tanks at least once every three years. In recent
years, several states have been unable to maintain the three-year inspection rate, and in FY 2015
more are falling behind due to funding shortfalls.
the total number of facilities that have approved controls in place that result in the protection of this population (20
million people).

1122
STRATEGIC OBJECTIVE 3:
RESTORE LAND.
Prepare for, respond to accidental or intentional releases of contaminants, clean up, and
restore polluted sites for reuse.
These programs reduce risks to human health and the environment by assessing contaminated sites,
cleaning them up, and returning them to the community for economic or recreational use. In
addition, EPA’s Emergency Response and Removal program deploys resources to contain and
respond to emergencies and stabilize hundreds of sites across the country per year. EPA’s land
cleanup programs track over 540,000 sites that cover slightly more than 23 million acres—slightly
over 17 percent of all developed land in the United States.
Summary of Progress
Contaminated land can threaten human health and the environment, and potentially hamper economic growth and the vitality of local communities. Academic research has demonstrated that investment in Superfund cleanups reduces the incidence of congenital abnormalities by roughly 20–25 percent for those living within 2,000 meters (1.2 miles) of a site.18 The long-term vision of this objective is to prepare and respond to emergencies and to clean up contaminated land so it can be safely reused or continue to be used, creating more resilient, healthy, and vibrant communities. EPA’s land cleanup programs track over 541,000 sites and almost 23 million acres, many of which are located in economically distressed communities that suffer from disproportionate and adverse environmental exposures. Approximately 125 million people live within 3 miles of a Superfund or a RCRA Corrective Action site. Analyzing census data, EPA found that the population within three miles of these sites is more likely to be minority, low income, and linguistically isolated, and less likely to have a high school education than the U.S. population as a whole.19 EPA and its partners have made over 453,000 contaminated sites Ready for Anticipated Use (RAU). Making sites RAU is one of the Agency’s FY 2014–2015 priority goal. Once a property is remediated and redeveloped, the reuse or continued use,
18 Currie, Janet, Michael Greenstone, and Enrico Moretti 2012. “Superfund Cleanups and Infant Health.” American
Economic Review, 101 (3):435–441. 19 U.S EPA, Office of Solid Waste and Emergency Response Estimate. 2014. Data collected include: (1) site
information as of the end of FY 2011 from CERCLIS and RCRAInfo; and (2) census data from 2007–2011
American Community Survey.
COLORADO FLOOD RECOVERY
Immediately following the September 2013 Colorado flood,
Region 8’s first task was to address the hazardous materials
releases. Response crews recovered 35 cars, 329 propane tanks,
259 refrigerators and freezers, 47 batteries, 198 drums, more
than 9,000 containers, and many other items. Region 8 also
stabilized and rebuilt the eroded slope of the tailings pile
underlying Elysian Park, removed stream debris, and stabilized
the stream channel through the town of Jamestown. A second
cleanup site required Region 8 to stabilize and restore creek
banks, saving Jamestown from being inundated by an estimated
25,000 cubic yards of mine remnants. Region 8’s repair of these
old cleanup sites and its response to the dangerous flooding
provided critical support that the counties needed to recover
from the storm.

1123
may result in new income to the community in the form of taxes, jobs to local residents or provides recreational or other services to make the community a better place to live. A study found that property values within three miles of sites where Superfund cleanups were completed increased approximately 20 percent.20
Overall in FY 2014, EPA achieved 14 of the 20 measures in this objective, with significant challenges for the Superfund program measures. The various reasons for missing the targets are described below. EPA expects continued challenges for the Superfund Remedial Program in the next few years and will continue to implement the Superfund Program Review, leverage special accounts, and pursue other strategies to drive performance.
FY 2014 Performance Accomplishments
FY 2014–2015 Agency Priority Goal
Clean up contaminated sites to enhance the livability and economic vitality of communities. By
2015, an additional 18,970 sites will be made ready for anticipated use protecting Americans and
the environment one community at a time.
In FY 2014, 11,161 sites were made RAU, exceeding the FY 2014 interim milestone of 9,685
sites. To meet the overall priority goal of 18,970 sites RAU for the two-year time period, EPA will
need to report 7,808 sites in 2015, which is less than the FY 2015 target of 9,285. EPA’s Superfund,
RCRA corrective action, leaking UST, and Brownfields cleanup programs all contribute to this
priority goal. This measure is met when the responsible local, state, or federal agency determines
that cleanup goals and engineering and institutional controls have been implemented for the media
that affects current and reasonably anticipated future use and human exposure is under control. It
is an internal performance measure, not an indicator of site-specific risk. The RAU measure is
20 Gamper-Rabidron, Shanti, and Christopher Timmins. 2012. “Does the Cleanup of Hazardous Sites Raise Housing
Values? Evidence of Spatially Localized Benefits.” Duke Environmental Economics, Working Paper EE1203.
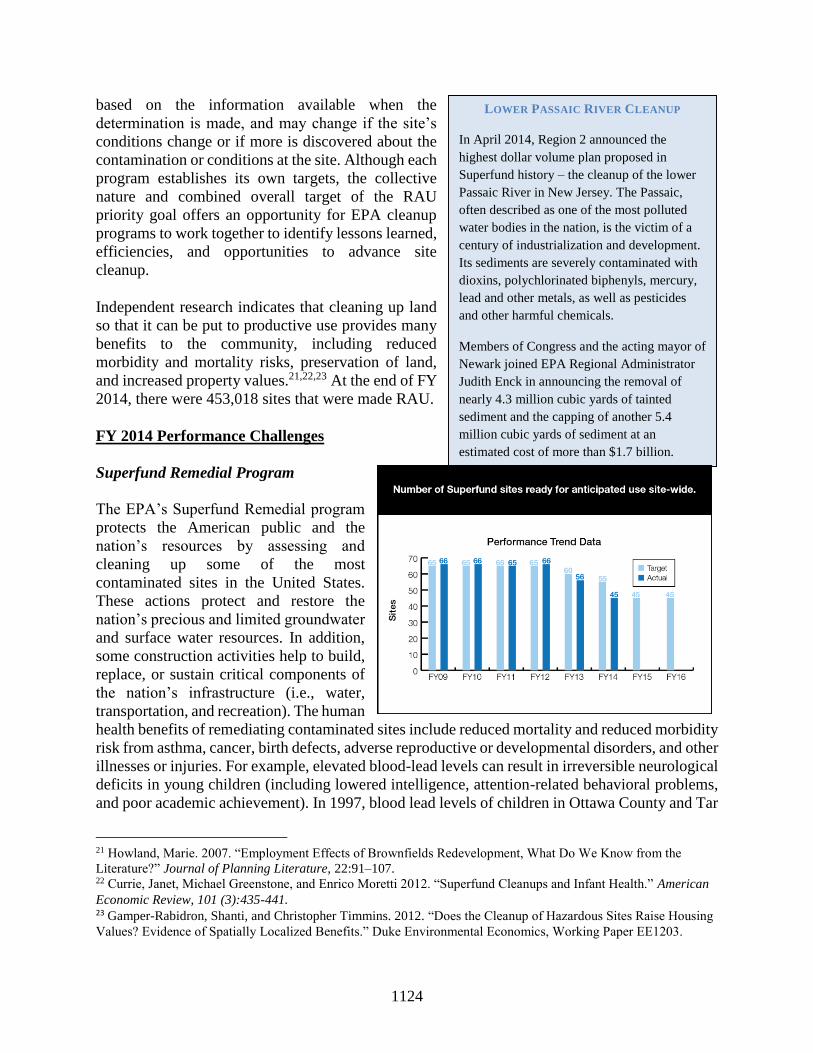
1124
based on the information available when the
determination is made, and may change if the site’s
conditions change or if more is discovered about the
contamination or conditions at the site. Although each
program establishes its own targets, the collective
nature and combined overall target of the RAU
priority goal offers an opportunity for EPA cleanup
programs to work together to identify lessons learned,
efficiencies, and opportunities to advance site
cleanup.
Independent research indicates that cleaning up land
so that it can be put to productive use provides many
benefits to the community, including reduced
morbidity and mortality risks, preservation of land,
and increased property values.21,22,23 At the end of FY
2014, there were 453,018 sites that were made RAU.
FY 2014 Performance Challenges
Superfund Remedial Program
The EPA’s Superfund Remedial program
protects the American public and the
nation’s resources by assessing and
cleaning up some of the most
contaminated sites in the United States.
These actions protect and restore the
nation’s precious and limited groundwater
and surface water resources. In addition,
some construction activities help to build,
replace, or sustain critical components of
the nation’s infrastructure (i.e., water,
transportation, and recreation). The human
health benefits of remediating contaminated sites include reduced mortality and reduced morbidity
risk from asthma, cancer, birth defects, adverse reproductive or developmental disorders, and other
illnesses or injuries. For example, elevated blood-lead levels can result in irreversible neurological
deficits in young children (including lowered intelligence, attention-related behavioral problems,
and poor academic achievement). In 1997, blood lead levels of children in Ottawa County and Tar
21 Howland, Marie. 2007. “Employment Effects of Brownfields Redevelopment, What Do We Know from the
Literature?” Journal of Planning Literature, 22:91–107. 22 Currie, Janet, Michael Greenstone, and Enrico Moretti 2012. “Superfund Cleanups and Infant Health.” American
Economic Review, 101 (3):435-441. 23 Gamper-Rabidron, Shanti, and Christopher Timmins. 2012. “Does the Cleanup of Hazardous Sites Raise Housing
Values? Evidence of Spatially Localized Benefits.” Duke Environmental Economics, Working Paper EE1203.
LOWER PASSAIC RIVER CLEANUP
In April 2014, Region 2 announced the
highest dollar volume plan proposed in
Superfund history – the cleanup of the lower
Passaic River in New Jersey. The Passaic,
often described as one of the most polluted
water bodies in the nation, is the victim of a
century of industrialization and development.
Its sediments are severely contaminated with
dioxins, polychlorinated biphenyls, mercury,
lead and other metals, as well as pesticides
and other harmful chemicals.
Members of Congress and the acting mayor of
Newark joined EPA Regional Administrator
Judith Enck in announcing the removal of
nearly 4.3 million cubic yards of tainted
sediment and the capping of another 5.4
million cubic yards of sediment at an
estimated cost of more than $1.7 billion.

1125
Creek, Oklahoma, were estimated to be 21.5 percent and 12.61 respectively. Following Superfund
cleanup and education activities, 0 percent of children in these areas were showing elevated levels
by 2013. Site cleanup can also be a significant economic driver. For 450 sites with available data,
those sites now have approximately 3,470 operating businesses that generate annual sales over
$65.1 billion and employ over 89,000 people, who earn a combined income of $6.0 billion.24
The Superfund Remedial program reports its activities and progress toward long-term human
health and environmental protection via six performance measures that encompass the entire
cleanup process. In FY 2014, the Superfund Remedial Program missed its national targets for four
of its measures: Net number of sites with human exposures under control (achieved nine of its
target of 10); number of sites with remedy construction completed (achieved eight of its target of
15); net number of sites with contaminated groundwater migration under control (achieved 11 of
its target of 15); and net number of sites ready for anticipated use site-wide (site-wide RAU)
(achieved 45 of its target of 55). In FY 2015, the program is reducing its targets for all four of
these measures.
There are various factors contributing to missing the FY 2014 targets. The discovery of new
exposure pathways during cleanup efforts (such as, vapor intrusion) moved sites to “Not Under
Control” and posed challenges for site completion. The implementation of updated cleanup
standards and/or improvements in sampling techniques increased the number of sites with
unacceptable exposure pathways. Many of the remaining sites are large, complex, and technically
challenging and require many years to bring them “Under Control” and achieve Construction
Completion and Site-wide RAU. Finally, resource constraints have slowed some construction
projects and prevented initiation of other projects impacting both the Construction Completion and
Site-wide RAU measures.
The Superfund Remedial Program has undertaken a comprehensive review of its operations to
identify ways to continue effectively protecting human health and the environment in the face of
diminishing resources. The Remedial Program will continue to implement the technical and
program management improvements recommended in this review so they are incorporated into the
normal business practices of the program.
24 For more information on Redevelopment Economics and in depth case studies please use the link below.
http://www.epa.gov/superfund/programs/recycle/economicimpacts.html.
1126
STRATEGIC OBJECTIVE 4:
STRENGTHEN HUMAN HEALTH AND ENVIRONMENTAL PROTECTION IN INDIAN
COUNTRY.
Support federally recognized tribes to build environmental management capacity, assess
environmental conditions and measure results, and implement environmental programs in
Indian Country.
Under federal environmental statutes, EPA is responsible for protecting human health and the
environment in Indian Country. The relationship between the U.S. government and federally
recognized tribes is unique: we work closely with tribes on a government-to-government basis to
ensure that environmental protection is being achieved across the country and that we work in true
partnership with tribal leaders to fulfill our mission. EPA’s 1984 Indian Policy provides the
framework for EPA’s relationship with federally recognized tribes and identifies the mechanisms
EPA and tribes use to implement federal environmental laws in Indian Country. Building on the
long-standing Indian Policy principles, EPA carries out the work under this objective through the
implementation of federal environmental programs in Indian Country, building tribal capacity
through the Indian Environmental General Assistance Program (GAP), and considers tribal
interests in carrying out its programs through its Policy on Consultation and Coordination with
Indian Tribes.
Summary of Progress
The EPA, in consultation with the Office of Management and Budget, has highlighted this
objective as a focus area for improvement. Overall, progress is being made in discrete areas to
protect human health and the environment in Indian Country; however, we continue to face internal
and external challenges to protecting environmental and human health on tribal lands. For
example, many tribal environmental departments lack capacity to regulate pollution, are often
understaffed, and face unique jurisdictional and institutional challenges. Although core tribal
capacities are being maintained (i.e., environmental presence), needs in Indian Country continue
to grow in number and diversity. The majority of tribes are not implementing EPA-authorized
regulatory programs and EPA’s ability to fully implement programs on behalf of tribes remains a
challenge.
EPA’s national tribal programs and regional offices report insufficient staff resources for EPA to
conduct the type of environmental technical assistance, oversight, and program implementation
likely needed in Indian Country. There is general recognition that tribal governments’ requests for
grant dollars to implement programs far exceed the resources available.
In FY 2014, after internal discussions about the challenges associated with this objective, EPA
determined that it should conduct a comprehensive needs assessment to better understand the scope
and breadth of EPA’s work in Indian country. Upon completion of such an assessment, EPA can
determine resource needs to ensure compliance and environmental protection in Indian country.
Such an assessment is a multi-year effort, requiring cross-agency participation. In FY 2015, EPA
will develop some foundational information to inform what resources and level of effort will be
needed to conduct such an assessment. Examples of information being developed include

1127
identifying the scope of database changes that would be needed to fully integrate Indian country
into key environmental data systems managed by EPA; and developing national guidelines for
EPA’s regulatory responsibilities in Indian country.
FY 2014 Performance Accomplishments
Tribal Capacity Building
EPA provides resources through grant funds and technical assistance for federally recognized
tribes to create and maintain effective environmental program capacity. In FY 2014, EPA began
to implement the revised Indian General Assistance Program “Guidance on the Award and
Management of General Assistance Agreements for Tribes and Intertribal Consortia” (GAP
Guidance), which will strengthen tribal capacity building in FY 2015 and beyond.
Much of EPA’s tribal programs work in FY 2014 focused on partnering with tribes to develop
joint EPA-Tribal Environmental Plans (ETEPs) to reflect intermediate and long-term goals for
planning, developing, establishing, and implementing environmental protection programs.
Approved GAP work plans will contain capacity indictors that relate to goals identified in the
ETEPs. The ETEPs help tribes and EPA identify mutual roles and responsibilities for addressing
particular environmental priorities and issues, focusing on joint planning and priority-setting,
increasing flexibility to direct resources to the most pressing environmental problems and
measuring results. Long-term plans also provide a foundation for the shorter-term work plans for
the Tribal GAP grants. In FY 2014, 39 tribes had developed ETEPs with EPA regional offices.
Tribal Consultation
In FY 2014, EPA continued to focus on implementation of its Consultation and Coordination
Policy with Indian Tribes. Consultation is a process of meaningful communication and
coordination between EPA and tribal officials prior to EPA taking actions or implementing
decisions that may affect tribes. EPA’s Tribal Consultation Policy has provided nationally
consistent guidance for when consultation should be considered and an overall consistent process
for early and meaningful tribal consultation.
In FY 2014, EPA completed 65 tribal consultations and initiated the tribal consultation process for
53 actions. Since 2011, the EPA has consulted with tribes on 245 actions. The majority of these
actions pertain to EPA regulations and guidances (30 percent and 32 percent of consultation
actions respectively). Another large part of consultation efforts focuses on EPA permitting (27
percent of consultation actions), as well as EPA response actions (6 percent) and tribal delegation
(5 percent). EPA uses a Web-based database called the Tribal Consultation Opportunities Tracking
System (TCOTS) to make information about upcoming and current EPA consultation
opportunities publically available to tribal governments. The system also provides management,
oversight, and a reporting structure to ensure accountability and transparency on EPA
consultations with tribal governments.
FY 2014 was the second year that all EPA employees were required to take an online training to
learn how the agency works effectively with Tribal governments. To support the Administrator’s

1128
theme of a new era of tribal partnerships, the agency continues to provide internal trainings to EPA
employees to increase personnel awareness and understanding of EPA’s Consultation Policy;
including how and when it applies to their work within the Agency to ensure consistency in
application of the policy.
Tribal ecoAmbassadors Program
Piloted in 2011, the Tribal ecoAmbassadors Program is the first program of its kind at EPA. The
Office of International and Tribal Affairs is committed to strengthening relationships with our
tribal partners, and to making a visible difference in tribal communities, and this program helps
fulfill both priorities. Tribal college and university (TCU) professors serve as the principal
investigators and work with a group of their TCU students, who earn college credit and a small
stipend. Each Tribal ecoAmbassador was paired with an EPA scientist knowledgeable in the area
of their proposal. The American Indian Higher Education Consortium, composed of the presidents
of all 37 TCUs, serves as our partner and contractor.
Through FY 2014, this program has given over 125 TCU students the opportunity to work with
their professors and EPA scientists while solving environmental problems in their communities.
Additionally, two transferable online courses, two lab courses, and two living laboratories are
ready to share with other TCUs. In FY 2014, one of our Tribal ecoAmbassadors leveraged an
additional grant from NASA using their work with solar energy analysis.
Over the past three years, EPA scientists have worked directly with the Tribal ecoAmbassadors
and their students, resulting in 16 projects, including the creation of indoor air monitoring
programs, curriculum on the collection of climate change data, and the creation of a recycled-
material construction business. Within EPA, senior-level managers are using this program as a
model for their work with TCUs; other external agencies and NGOs, including CDC, SBA,
NOAA, U.S. Fish and Wildlife Service, the University of Colorado, Johns Hopkins University,
and the University of Arizona have reached out to partner with the program.
FY 2014 Performance Challenges
Implementing Federal Regulatory Environmental Programs in Indian Country
The Percent of Tribes Implementing
Federal Regulatory Environmental
Programs in Indian Country performance
measure represents federally recognized
tribes that have the capacity to
implement federal programs in a manner
similar to a state (TAS) and/or receive
funding to support EPA program
implementation activities through
“Direct Implementation Tribal
Cooperative Agreements” (DITCAs).
Tribes differ broadly in population,

1129
culture, income, geography, economic development, environmental program management
expertise, and priorities, making it increasingly difficult to assess how many more tribes will
implement federal programs in the future. Many tribes also face legal barriers to federal approval
for program implementation, and, as federal resources decline or remain stagnant and the cost of
living continues to increase, the real dollars available to support capacity development and
implementation shrink. Another challenge to this measure is that results do not reflect individual
tribes’ increasing capacities (e.g., when a tribe takes over more than one TAS approval, or is
implementing program activities under a TAS approval and a DITCA).
To better measure progress in Indian Country, in FY 2014 EPA convened a workgroup to focus
on tribal performance measurement. The group developed a framework for new performance
measures, when applied across all media programs, will report on the status of tribes’ capacity
development and whether they are implementing federal environmental regulatory programs.
These measures will be directly linked to the work funded under GAP and include a separate
indicator to report on the number of regulatory TAS established by tribes. These new measures
will demonstrate progress over time, along the continuum of program capacity development and
implementation, recognizing that not all tribes will implement all federal programs. Ultimately,
these results and efforts will help inform EPA as to where it needs to prioritize its direct
implementation resources in Indian Country. In FY 2015, EPA is developing these new
performance measures, consistent with the framework, issuing them as part of the FY 2017 budget.
Tribal Program Needs Assessment
Drawing from the FY 2014 strategic review, it is evident that EPA should conduct a comprehensive
needs assessment of the work in Indian Country to ensure that protection of human health and the
environment there is equal to elsewhere in the United States. Part of a larger planning process, a
needs assessment will identify and measure current conditions—for example, the regulated entities
in Indian Country, the regulated media in Indian Country (e.g., waterbodies), current and planned
TAS for regulatory programs that have been provided to tribes, and current EPA direct
implementation activities in Indian Country. Additionally, EPA plans to assess major data
systems’ capacity to track relevant information about regulated entities and activities (e.g.,
monitoring, permitting) in Indian Country and use these data to find current program
implementation gaps. The goal of this multi-phased approach is to clearly identify problems,
prioritize issues, and address the gaps in environmental protection in Indian Country.
Conducting a program evaluation to quantify the unaddressed environmental regulatory issues in
Indian Country, including identifying these gaps in environmental protection, will be a tremendous
undertaking. Results from the evaluation may require EPA to consider options for realigning its
resources to prioritize and address the highest environmental needs in Indian Country.

1130
Strategic Goal 4:
ENSURING THE SAFETY OF CHEMICALS AND PREVENTING
POLLUTION

1131

1132
EPA CONTRIBUTING PROGRAMS
Chemical Risk Review and Reduction
Chemical Risk Management
Endocrine Disruptor Program
Science Policy Biotechnology
Protect Human Health from Pesticide Risk
Protect the Environment from Pesticide Risk
Realize the Value of Pesticide Availability
Lead Risk Reduction and Lead Categorical Grant Programs
Pesticides Program Implementation Categorical Grant Program
Pollution Prevention
Pollution Prevention Categorical Grant Programs

1133
STRATEGIC OBJECTIVE 1:
ENSURE CHEMICAL SAFETY
Reduce the risk and increase the safety of chemicals that enter our products, our environment,
and our bodies.
EPA’s chemical safety programs are at the forefront of its efforts to advance a sustainable future.
Chemicals are often released into the environment as a result of their manufacture, processing, use,
and disposal, and people are exposed to chemicals in their homes, where they work and play, and
in their use of products. The Agency uses a variety of approaches to ensure chemical safety,
including review of new chemicals before they enter commerce and, for the tens of thousands of
existing chemicals already in commerce, obtaining and making public chemical health and safety
information, using that information to screen and assess chemical risks and chemical alternatives,
and taking risk management action to eliminate or reduce identified risks.
Summary of Progress
EPA is making significant achievements in chemical assessment and online public access, along
with progress in additional areas such as new chemical review, chemical risk management and
review of existing Confidential Business Information (CBI) cases. Challenges include statutory
constraints affecting chemical assessment and the sheer number of chemicals in commerce for
which data are lacking.
The Endocrine Disruptor Screening Program (EDSP) activities include the preparation and sending
of test orders, review of responses to test orders and other scientifically relevant information,
analysis of Tier 1 data, and creation of Data Evaluation Records. Some activities address
challenges associated with reaching Weight of Evidence (WoE) determinations for chemical,
including the importance of having standard evaluation procedures, data evaluation templates, and
data entry spreadsheet templates; requesting copies of cited literature as part of 90-day test order
responses; collecting and organizing all relevant Part 158 data during the 90-day responses; and
staff experience.
In FY 2014, EPA’s pesticides program exceeded its FY 2014 goals for docket openings and work
plan completions, demonstrating its commitment to meeting the October 1, 2022 mandated
completion date for the first 15-year cycle of registration review. The pesticides program also
identified some challenges such as compliance with the Endangered Species Act (ESA), National
Academies of Science (NAS) recommendations implementation, and the challenges posed by
lawsuits and petitions. By identifying these challenges, the agency can better focus on achieving
established goals while working to resolve them. The NAS recommendations concerning ESA
consultation between EPA, Fish and Wildlife Service, and National Marine Fisheries Service are
being piloted on select chemicals. Any unexpected issues will be evaluated with our partners with
the goal of fully incorporating the NAS report 25 recommendations in FY 2015Likewise, we
continue to work to resolve concerns raised in lawsuits and petitions.
25 http://www.epa.gov/oppfead1/endanger/2014/esa-reporttocongress.pdf.

1134
Meeting established goals and targets is a program priority; to that end, program management
holds regular planning meetings to assess progress, discuss issues and their resolutions, and plan
for more difficult/involved chemicals and how to deploy available resources to best meet the tasks
at hand, while considering the additional resources that may be needed. Senior management and
the appropriate program staff meet quarterly to review progress toward the strategic goals, the
priority goal, key performance indicators, and annual measures issues that may affect goals and
targets are raised at these meetings. Resolutions for these issues have included adopting workflow
efficiencies, planning ahead to handle more challenging chemicals, and brainstorming measures
that could best capture the accomplishments of the program.
Key FY 2014 Performance Accomplishments
FY 2014–FY 2015 Agency Priority Goal
By September 30, 2015, EPA will have completed more than 250 assessments of pesticides and
other commercially available chemicals to evaluate risks they may pose to human health and the
environment, including the potential for some of these chemicals to disrupt endocrine systems.
These assessments are essential in determining whether products containing these chemicals can
be used safely for commercial, agricultural, and/or industrial uses.
During FY 2014, EPA made progress in assessing the risks for pesticides and other commercially
available chemicals. The agency continues to assess the safety of all active pesticide ingredients
and ensure that pesticide products used across the country are safe for human health and the
environment. The program has dedicated resources to ensure a robust pipeline of dockets and work
plans, so that the agency can continue to keep pace to meet the FY 2015 risk assessment target and
show its commitment and progress toward its statutory mandate to complete the first 15-year cycle
of registration review by October 1, 2022.
The TSCA Work Plan was created in FY 2012; its implementation has evolved with the first set
of draft risk assessments in 2013 and with problem formulation experience on individual chemicals
and chemical clusters. In FY 2014 EPA focused on finalizing the first set of TSCA risk assessments
in 28 years, with a better understanding of the landscape of data available or needed, and continued
assessments begun in 2013 for several challenging flame retardant clusters involving interagency
consultation and further cancer analysis.
WoE determinations and EDSP program decisions for additional chemicals are in progress, but
not yet completed. WoE determinations have proven to be more complex than originally
anticipated. EDSP decisions for another 52 chemicals on the first list for screening are now targeted
for completion in FY 2015.

1135
Selected Key Performance Results
Reduction in Children’s Exposure to Rodenticides
EPA aims to reduce rodenticide incidents
involving younger children and infants by
requiring that new rodenticide products be
placed in tamper-resistant bait stations. In
support of this effort, the Office of
Pesticide Programs initiated regulatory
action to cancel and remove non-
compliant rodenticide products from the
consumer market. These planned actions
were met with a legal challenge, which
concluded with the Agency achieving
voluntary cancellation of the products in
question. EPA expects to see continued
reduction in incidents involving children under six.
Lead RRP Active Certified Firms
EPA’s strategy to reduce risks from lead-based paint in homes and child-occupied facilities has,
as a major focus, the implementation of the Agency’s RRP rule, which went into effect in April
2010. This regulation requires that firms performing RRP activities that disturb lead-based paint
in homes or child-occupied facilities built before 1978 be certified by EPA (or an EPA-authorized
state) to conduct RRP work, use certified renovators trained by EPA-approved training providers,
and follow lead-safe work practices. These work practices are designed to protect children and
others from harmful exposure to lead-based paint that may be disturbed in the course of RRP work.
As of the close of FY 2014, EPA has determined that 139,702 firms had active certification in
place to perform lead-safe RRP work under the RRP rule, meeting the FY 2014 annual
performance target for this measure. The total number of firms certified to conduct RRP work
using lead-safe methods continues to increase steadily. Available information suggests that there
are enough certified firms to meet current consumer demand.
Ensuring Online Public Access to TSCA Chemical Information
EPA’s online ChemView database is designed to enhance public access to health and safety data
on chemicals regulated under TSCA. This system is a key element of the Agency’s efforts to
address concerns about the lack of basic information on the exposure, hazards, and risks of
chemicals. ChemView allows users to view information EPA receives and develops in both
summary form and in detail, and includes links to documents submitted to EPA and regulatory
documents and scientific assessments developed by EPA, significantly enhancing access to
chemical information in a one-stop shop.
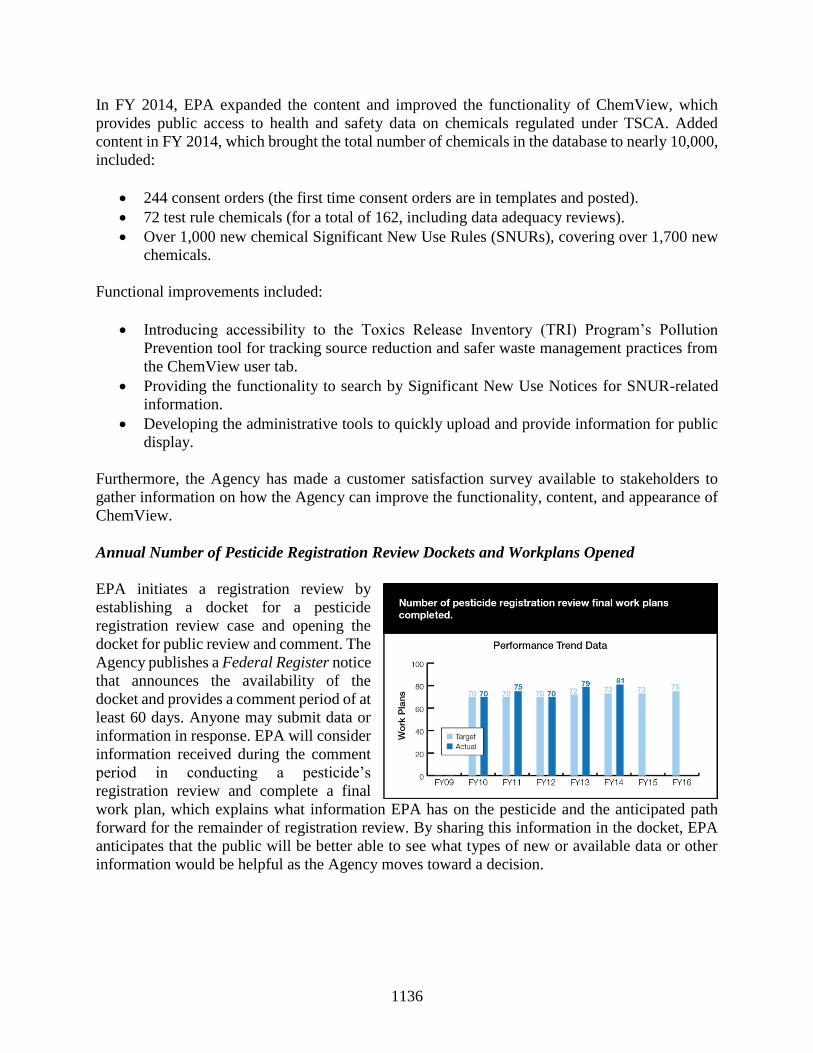
1136
In FY 2014, EPA expanded the content and improved the functionality of ChemView, which
provides public access to health and safety data on chemicals regulated under TSCA. Added
content in FY 2014, which brought the total number of chemicals in the database to nearly 10,000,
included:
244 consent orders (the first time consent orders are in templates and posted).
72 test rule chemicals (for a total of 162, including data adequacy reviews).
Over 1,000 new chemical Significant New Use Rules (SNURs), covering over 1,700 new
chemicals.
Functional improvements included:
Introducing accessibility to the Toxics Release Inventory (TRI) Program’s Pollution
Prevention tool for tracking source reduction and safer waste management practices from
the ChemView user tab.
Providing the functionality to search by Significant New Use Notices for SNUR-related
information.
Developing the administrative tools to quickly upload and provide information for public
display.
Furthermore, the Agency has made a customer satisfaction survey available to stakeholders to
gather information on how the Agency can improve the functionality, content, and appearance of
ChemView.
Annual Number of Pesticide Registration Review Dockets and Workplans Opened
EPA initiates a registration review by
establishing a docket for a pesticide
registration review case and opening the
docket for public review and comment. The
Agency publishes a Federal Register notice
that announces the availability of the
docket and provides a comment period of at
least 60 days. Anyone may submit data or
information in response. EPA will consider
information received during the comment
period in conducting a pesticide’s
registration review and complete a final
work plan, which explains what information EPA has on the pesticide and the anticipated path
forward for the remainder of registration review. By sharing this information in the docket, EPA
anticipates that the public will be better able to see what types of new or available data or other
information would be helpful as the Agency moves toward a decision.
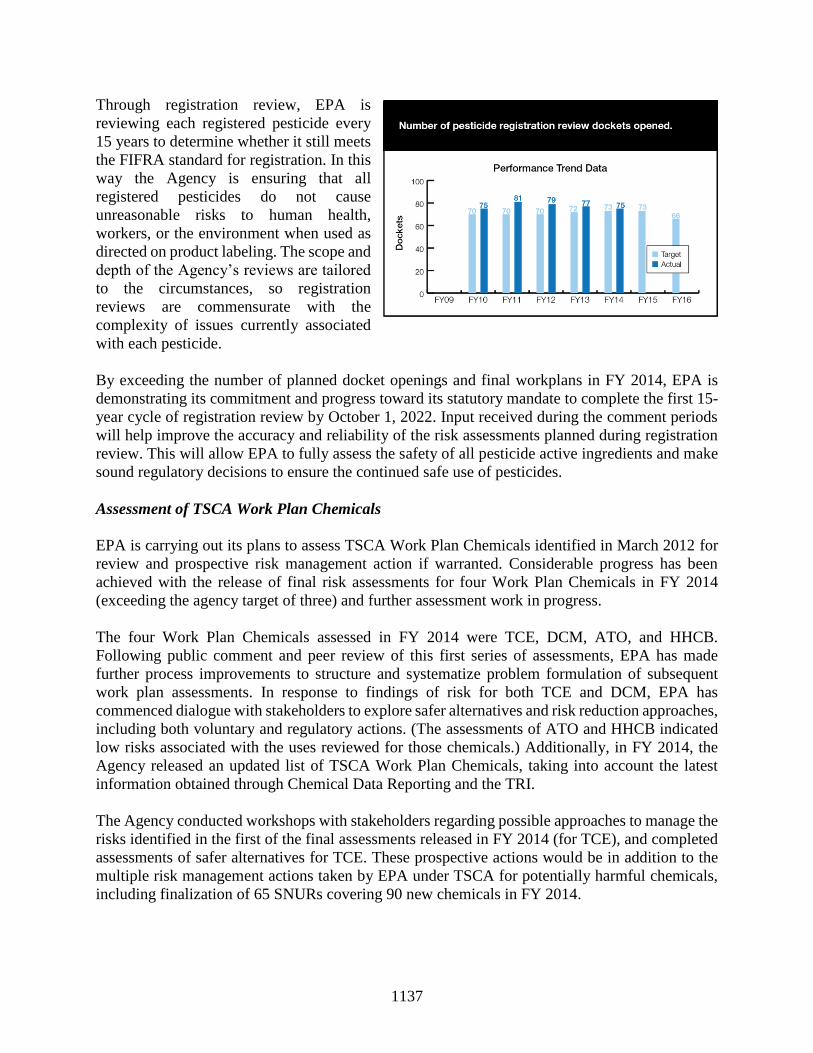
1137
Through registration review, EPA is
reviewing each registered pesticide every
15 years to determine whether it still meets
the FIFRA standard for registration. In this
way the Agency is ensuring that all
registered pesticides do not cause
unreasonable risks to human health,
workers, or the environment when used as
directed on product labeling. The scope and
depth of the Agency’s reviews are tailored
to the circumstances, so registration
reviews are commensurate with the
complexity of issues currently associated
with each pesticide.
By exceeding the number of planned docket openings and final workplans in FY 2014, EPA is
demonstrating its commitment and progress toward its statutory mandate to complete the first 15-
year cycle of registration review by October 1, 2022. Input received during the comment periods
will help improve the accuracy and reliability of the risk assessments planned during registration
review. This will allow EPA to fully assess the safety of all pesticide active ingredients and make
sound regulatory decisions to ensure the continued safe use of pesticides.
Assessment of TSCA Work Plan Chemicals
EPA is carrying out its plans to assess TSCA Work Plan Chemicals identified in March 2012 for
review and prospective risk management action if warranted. Considerable progress has been
achieved with the release of final risk assessments for four Work Plan Chemicals in FY 2014
(exceeding the agency target of three) and further assessment work in progress.
The four Work Plan Chemicals assessed in FY 2014 were TCE, DCM, ATO, and HHCB.
Following public comment and peer review of this first series of assessments, EPA has made
further process improvements to structure and systematize problem formulation of subsequent
work plan assessments. In response to findings of risk for both TCE and DCM, EPA has
commenced dialogue with stakeholders to explore safer alternatives and risk reduction approaches,
including both voluntary and regulatory actions. (The assessments of ATO and HHCB indicated
low risks associated with the uses reviewed for those chemicals.) Additionally, in FY 2014, the
Agency released an updated list of TSCA Work Plan Chemicals, taking into account the latest
information obtained through Chemical Data Reporting and the TRI.
The Agency conducted workshops with stakeholders regarding possible approaches to manage the
risks identified in the first of the final assessments released in FY 2014 (for TCE), and completed
assessments of safer alternatives for TCE. These prospective actions would be in addition to the
multiple risk management actions taken by EPA under TSCA for potentially harmful chemicals,
including finalization of 65 SNURs covering 90 new chemicals in FY 2014.
1138
Chemical Safety for Sustainability Dashboards
EPA’s chemical safety researchers used rapid, automated (high-throughput) chemical screening
technology to evaluate over 1,800 high priority chemicals for potential toxicity. The innovative
chemical screening technology tests for different types of toxicity such as reproductive and
developmental effects, and cancer. In FY 2014, EPA launched a beta version of the interactive
Chemical Safety for Sustainability Dashboards to improve user experience in accessing chemical
data. Having rapid, automated predictions for toxicity and exposure provides EPA with the means
for efficient risk-based prioritization of chemicals. This research is taking the steps to implement
the National Academies of Science recommendations in the Exposure Science in the 21st Century:
A Vision and a Strategy report and the Toxicity Testing in the 21st Century report and is the first
regulatory application of the technology.
BOTE release
As the lead federal entity for responding to biological, chemical, and radiological contamination
events, EPA plays a major role in preparing the nation to respond to acts of bio-terrorism. In
February 2014, EPA announced the results of a multi-year project called Bio-Response
Operational Testing and Evaluation (BOTE), a two-phase demonstration project to test and
advance decontamination methods that can be used after anthrax spores have been released into a
building. The results of this research will help provide state and local leaders, on-scene
coordinators, waste managers and others with a guideline for effective decontamination in the
event of a biological threat. Because BOTE included partnerships among several government
agencies, the methods developed and lessons learned have been shared throughout the homeland
security community, continuing to expand the impact of EPA research efforts.
Release of PARIS III
In 2014, EPA released PARIS III, or “Program for Assisting the Replacement of Industrial
Solvents, version 3.0,” designed to help any environmentally-conscious individual effectively and
efficiently find better and greener solvent mixtures for many different common industrial
processes. Aiming to reduce that practice, EPA researchers developed this free software tool to
help companies find alternate chemical mixtures or solvents that still improve their industrial
processes but are not as harmful to our environment.
Performance Challenges
EDSP’s WoE Determinations
EPA’s performance measure, Number of Chemicals for which Scientific Weight of Evidence
Determinations have been completed, represents an intermediate step leading to EDSP decisions.
It accounts for the number of scientific WoE and hazard characterizations completed; these hazard
characterizations are based on the integrated scientific reviews of the Tier 1 data, in combination
with other scientifically relevant information and existing toxicity information (e.g., 40 CFR part
158). Integrating these streams of data to ascertain a chemical’s potential to interact with endocrine
systems has proven more complex than originally anticipated. Therefore, the agency will complete

1139
preliminary WoE determinations for 52 chemicals on the first list for screening and conduct a
retrospective analysis and consistency check before finalizing the decisions. These decisions are
now anticipated for completion in FY 2015.
Chemical Safety Work Hampered by TSCA Limitations
EPA’s chemical safety work has been hampered for many years by widely recognized limitations
in the extent of authority granted under TSCA. Both the General Accountability Office and EPA’s
Office of Inspector General have identified TSCA regulatory constraints as a key management
challenge affecting the Agency’s ability to regulate chemicals found to pose unreasonable risk to
human health or the environment. Perhaps most significantly, TSCA limitations increase the
difficulty of obtaining information needed to assess chemical hazard, exposure, and risk. EPA
believes that statutory reform is needed to strengthen the tools available to increase confidence in
the safety of chemicals in commerce. Until legislative action takes place, EPA is proceeding to the
extent of its ability under current law to secure needed chemical data, implement chemical
assessment work and, where indicated, take action to manage chemical risk.
Persistent Income-Related Disparities in Reducing Children’s Blood Lead Levels
The NHANES survey data for 2009–2012 show that geometric mean BLLs decreased from the
2005–2008 value at a faster rate (31 percent) for non-low-income children than for low-income
children (26 percent), increasing the income-related disparity. The EPA is assessing these data to
determine if the underlying factors influencing these changes can be identified.
The NHANES
data do indicate
that BLLs among
lower-income
children have
decreased
substantially over
time, nearly 50
percent
cumulatively
from the 1999–
2002 geometric
mean value (2.6
µg/dL down to
1.33 µg/dL).
Thus, the
persistent income
disparity does not
mean that lower-income children are failing to derive significant benefit from lead reduction
efforts.
0.0%
-8.2%
-18.6%
-31.1%
-38.4%
-48.9%
0.0%
-11.5%
-14.3%
-18.1%
-27.7%
-43.5%
-60.0%
-50.0%
-40.0%
-30.0%
-20.0%
-10.0%
0.0%
1999-2002 2001-2004 2003-2006 2005-2008 2007-2010 2009-2012
NHANES 4 Year Data Set
Cumulative % Change in Childhood Blood Lead Levels
Below Poverty Level At or Above Poverty Level

1140
EDSP’s Environmental Justice Activities
This activity was intended to broaden participation in environmental justice (EJ) awareness.
During the July Scientific Advisory Panel (SAP), public comments from a well-recognized EJ
scientist were entered into the pubic docket and other interested advocates in the EJ community
provided suggestions/comments.
EPA identified several activities in FY 2014 to increase the incorporation of EJ or disproportionate
impact considerations into EDSP and SAP activities. Public comments and scientific information
reflecting EJ interests will help EPA decrease uncertainties and increase confidence in the
scientific models that assess impacts on various demographic groups. Within the SAP, efforts are
underway to expand outreach efforts within the EJ community to increase participation of
scientists with EJ interests on FIFRA SAPs as ad hoc panel member experts, as well as to involve
individuals and groups within the EJ community in the SAP evaluation process via public
awareness of the Agency’s activities.
Implementation of Endangered Species Act During Registration Review
EPA, the U.S. Fish and Wildlife Service (USFWS), the National Marine Fisheries Service
(NMFS), and the U.S. Department of Agriculture (USDA) are continuing to develop—and work
toward implementation of—interim scientific approaches for assessing the risks of pesticides to
listed endangered species. Given this fact, and based on the recommendations from the April 2013
NAS report, current Registration Review preliminary risk assessments typically do not contain
complete endangered species analysis that includes effects determinations for specific listed
species or designated critical habitat.
Once the agencies have fully developed and implemented the scientific methods necessary to
complete risk assessments for listed species and their critical habitats, these methods will be
applied to subsequent analyses as part of completing Registration Review. In the meantime, EPA
will conduct screening-level assessments for all taxa of non-target wildlife and plants that assume
that listed species and designated critical habitats may be present in the vicinity of pesticide use.
These screening-level assessments will allow EPA to focus its future evaluations on the types of
species where the potential for effects exists once the scientific methods being developed by the
agencies have been fully vetted.
1141
STRATEGIC OBJECTIVE 2:
PROMOTE POLLUTION PREVENTION.
Conserve and protect natural resources by promoting pollution prevention and the adoption of
other sustainability practices by companies, communities, governmental organizations, and
individuals.
To advance pollution prevention (P2), EPA focuses on two key strategies: fostering the
development of P2 solutions (greener/leaner/safer chemicals, technologies, and practices) and
promoting increased use of those solutions (e.g., increased institutional and consumer purchasing
of greener products; increased industrial application of greener technologies and practices). These
strategies have demonstrated success in reducing the use of hazardous materials, energy, and water
and reducing the generation of greenhouse gases (GHGs), while significantly increasing the use of
safer chemicals and products and enabling businesses and governments to reduce their costs. These
P2 strategies are key elements of EPA’s approach to achieving a sustainable future.
Summary of Progress
With respect to fostering the development of new P2 solutions, significant accomplishments in FY
2014 included:
Recognizing the FY 2014 Presidential Green Chemistry Award winners, including an
award-winning display and lighting technology that could significantly reduce cadmium
and toxic solvents and save the equivalent electricity consumption of 50,000 average
American homes a year (over 600 million kilowatt-hours).
Continuing to provide agency technical input for developing and promoting greener
electronics and voluntary consensus standards for imaging equipment, televisions,
computers, and servers, which will generate significant P2 results in future years as these
products are purchased.
With respect to promoting increased use of P2 solutions, significant accomplishments in FY 2014
included:
Convening the Green Chemistry Roundtable with Presidential Green Chemistry Award
winners and other stakeholders, intended to increase the market penetration of green
chemistry solutions.
Engaging with stakeholders and the public on possible label options for a redesigned Design for
the Environment (DfE) logo intended to increase consumer awareness of the benefits of labeled
products as well as consumer purchasing of such products. Expanding to a total of 27 states the
Economy, Energy, and Environment (E3) program, through which EPA collaborates with five
other federal agencies, states, and local communities to connect respective programs to deliver
responsive, coordinated solutions in a manufacturing environment. The E3 program focuses on
strengthening small to medium-sized American manufacturers, which represent the largest
proportion of the manufacturing sector, and helps boost local economies to achieve sustainability
goals. Nearly 200 additional E3 assessments were conducted in FY 2014.

1142
The P2 program produced significant environmental benefits in FY 2013, indicating that the
program will be able to achieve the strategic targets for reducing water use, GHG emissions, and
hazardous materials and for increasing cost savings through pollution prevention. Due to regular
lags in the data needed determine performance results, the P2 program’s most currently available
accomplishments associated with GPRA outcome measures are those achieved in FY 2013.
Key FY 2014 Performance Results
Environmentally Preferable Purchasing
The Environmentally Preferable Purchasing (EPP) program achieves significant environmental
outcome results for the P2 program through its contribution to the development and promotion of
voluntary consensus standards for environmentally preferable products. Recent efforts have
focused on standards for greener electronics products such as computers, imaging equipment,
televisions, and servers. By encouraging the purchase of these products by federal agencies, the
EPP program reduces emissions of hazardous and non-hazardous materials from the manufacture,
sale, and disposal of products. These products also deliver environmental benefits of reduced GHG
emissions, especially through increased energy efficiency, which provides additional cost savings
to manufacturers and consumers. Additionally, by promoting products with longer replacement
cycles, the EPP program achieves lifecycle environmental benefits and promotes sustainability by
avoiding the manufacture of replacement products.
In FY 2014, the EPP program provided technical input to efforts to update the Federal Acquisition
Regulation (FAR) to require federal agencies to procure greener imaging equipment and
televisions, in addition to computers. EPP program staff coordinated EPA technical input on the
IEEE 1680.2 Standard for the Environmental Assessment of Imaging Equipment and the IEEE
1690.3 Standard for the Environmental Assessment of Televisions. EPP program staff also co-
chaired the standard development working groups, and co-funded facilitation of these working
groups. The addition of imaging equipment and televisions in 2013, and the amended FAR
(updated June 2014) requiring federal agencies to procure greener imaging equipment and
televisions, will lead to increased environmental results in FY 2015 and beyond. The EPP program
is currently expanding its Electronics Environmental Benefits Calculator to quantify these results.
The program also continued in FY 2014 to bring the Agency’s technical input to the development
of new environmental performance standards for electronics. The program has been instrumental
in developing a new standard for servers (expected to be finalized in 2015) and in the revision of
the standard for computers. Program staff have also been involved with the development of a
standard for mobile devices. In FY 2014, slates/tablets were added to the inventory of greener
electronic products, which is expected to increase environmental results in FY 2015 and beyond.
The EPP program has also led the development of draft guidelines for assessing ecolabels and
environmental performance standards. These standards were published as draft for public
comment in FY 2014 and pilots will be conducted in FY 2015. These guidelines, once
implemented, are expected to greatly enhance federal green purchasing by meeting the needs for
clear guidance to purchasers for additional categories of products commonly purchased in the
federal community.

1143
Expanding the DfE Safer Product Labeling Program and Safer Chemical Ingredients List
The DfE program is continuing to make significant progress toward its FY 2018 strategic targets
to recognize an additional 1,500 products under the Safer Products Labeling Program and list
another 400 chemicals on the Safer Chemical Ingredients List. In FY 2014, the program recognized
another 220 products and chemicals. The program is evaluating additional product categories for
inclusion under the Safer Products Labeling Program, including personal care products and
industrial/institutional categories, and adding new chemical categories for the Safer Chemical
Ingredients List.
Additionally, in FY 2014 the program worked to develop a new logo for labeled products that will
help consumers, businesses, and institutional buyers more easily recognize products that have
earned the EPA Safer Product Label by meeting stringent health and environmental criteria. The
program engaged with stakeholders in the chemical and product manufacturing industry, retailers,
and environmental organizations in the development of the logo, and has sought public opinion on
four draft logo proposals. EPA plans to launch the redesigned logo in FY 2015 in conjunction with
an assessment of its effectiveness in influencing consumer knowledge and purchasing behavior.
Performance Challenges
Aggregating P2 Results
The P2 Program is currently experiencing a significant challenge in enhancing the transparency of
and aggregating P2 results across the entire program, complicating the program’s efforts to trace
results back to their sources for purposes of validation. To address this, the program is developing
the P2 GrantsPlus Database – a system that will allow regional offices to enter their grant and non-
grant P2 projects, methodologies and results. It will also accommodate supporting documentation,
and track when disaggregate results are updated in response to quality checking in headquarters.
Aggregating results data will be much more efficient and transparent.
1144
Strategic Goal 5:
PROTECTING HUMAN HEALTH AND THE ENVIRONMENT
BY ENFORCING LAWS AND ASSURING COMPLIANCE

1145

1146
EPA CONTRIBUTING PROGRAMS
Environmental Justice
Compliance Assistance Program
Environmental Technology Verification Program, Monitoring and Enforcement Program
National Center for Environmental Innovation
National Partnership for Environmental Priorities
Economic Decision Sciences Research
Pesticide Enforcement Grant Program
Sector Grant Program
Sustainable Materials Management
Toxic Substances Compliance Grant Program
Sustainability Research
Superfund Enforcement
RCRA Corrective Action
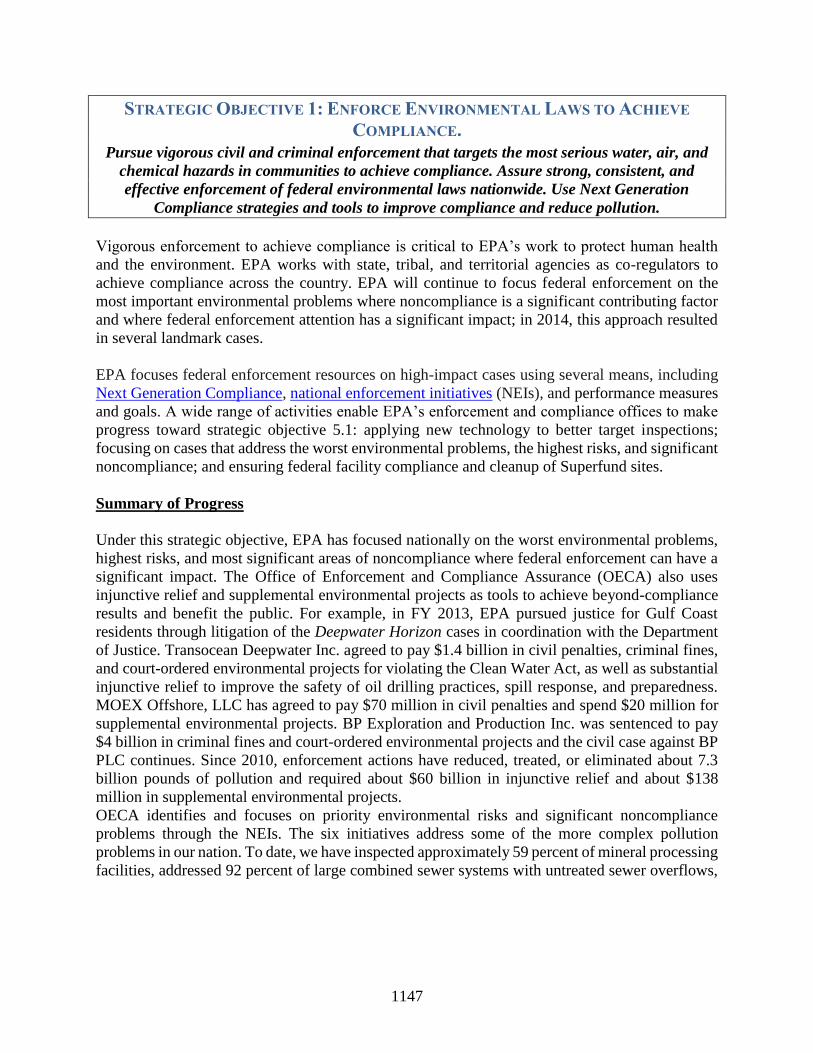
1147
STRATEGIC OBJECTIVE 1: ENFORCE ENVIRONMENTAL LAWS TO ACHIEVE
COMPLIANCE.
Pursue vigorous civil and criminal enforcement that targets the most serious water, air, and
chemical hazards in communities to achieve compliance. Assure strong, consistent, and
effective enforcement of federal environmental laws nationwide. Use Next Generation
Compliance strategies and tools to improve compliance and reduce pollution.
Vigorous enforcement to achieve compliance is critical to EPA’s work to protect human health
and the environment. EPA works with state, tribal, and territorial agencies as co-regulators to
achieve compliance across the country. EPA will continue to focus federal enforcement on the
most important environmental problems where noncompliance is a significant contributing factor
and where federal enforcement attention has a significant impact; in 2014, this approach resulted
in several landmark cases.
EPA focuses federal enforcement resources on high-impact cases using several means, including
Next Generation Compliance, national enforcement initiatives (NEIs), and performance measures
and goals. A wide range of activities enable EPA’s enforcement and compliance offices to make
progress toward strategic objective 5.1: applying new technology to better target inspections;
focusing on cases that address the worst environmental problems, the highest risks, and significant
noncompliance; and ensuring federal facility compliance and cleanup of Superfund sites.
Summary of Progress
Under this strategic objective, EPA has focused nationally on the worst environmental problems,
highest risks, and most significant areas of noncompliance where federal enforcement can have a
significant impact. The Office of Enforcement and Compliance Assurance (OECA) also uses
injunctive relief and supplemental environmental projects as tools to achieve beyond-compliance
results and benefit the public. For example, in FY 2013, EPA pursued justice for Gulf Coast
residents through litigation of the Deepwater Horizon cases in coordination with the Department
of Justice. Transocean Deepwater Inc. agreed to pay $1.4 billion in civil penalties, criminal fines,
and court-ordered environmental projects for violating the Clean Water Act, as well as substantial
injunctive relief to improve the safety of oil drilling practices, spill response, and preparedness.
MOEX Offshore, LLC has agreed to pay $70 million in civil penalties and spend $20 million for
supplemental environmental projects. BP Exploration and Production Inc. was sentenced to pay
$4 billion in criminal fines and court-ordered environmental projects and the civil case against BP
PLC continues. Since 2010, enforcement actions have reduced, treated, or eliminated about 7.3
billion pounds of pollution and required about $60 billion in injunctive relief and about $138
million in supplemental environmental projects.
OECA identifies and focuses on priority environmental risks and significant noncompliance
problems through the NEIs. The six initiatives address some of the more complex pollution
problems in our nation. To date, we have inspected approximately 59 percent of mineral processing
facilities, addressed 92 percent of large combined sewer systems with untreated sewer overflows,

1148
inspected over 1,700 concentrated animal
feeding operations, conducted over 2,600
energy extraction evaluations, evaluated
over 1,700 air-toxic-emitting facilities, and
controlled over 600 coal-fired electric
utility units.
EPA has designed and is now implementing
Next Generation Compliance efforts, which
should yield: 1) regulations and permits
with built-in compliance drivers; 2) more
use of advanced emissions/pollutant
detection technology; 3) a shift toward
electronic reporting; 4) expanded
transparency, which drives compliance; and
5) innovative enforcement approaches,
such as fenceline monitoring and third-
party certification/verification tools. As
part of this work, EPA has trained hundreds
of its staff and managers to design effective
rules with built-in compliance drivers;
developed rules that would require
fenceline monitoring to provide emissions
data; incorporated advanced monitoring
technology into enforcement settlements;
and proposed an electronic reporting rule
for the National Pollutant Discharge Elimination System that would modernize environmental data
reporting for thousands of facilities. To increase transparency, EPA has enhanced its Enforcement
and Compliance History Online (ECHO) website, which allows the public to get information about
the compliance record of over 800,000 facilities. EPA is also advancing other innovative projects
in partnership with the states as part of the E-Enterprise for the Environment initiative.
To help municipalities meet their Clean Water Act obligations, EPA developed an integrated
planning process that allows municipalities to optimize the benefits of their infrastructure
improvement investments through the appropriate sequencing of work. This approach can also
lead to more sustainable and comprehensive solutions, such as green infrastructure, that improve
water quality and enhance community vitality. EPA has also developed tools to better target
facilities for inspections and enforcement actions. For example, the Safe Drinking Water
Enforcement Targeting Tool has helped to reduce by over 70 percent the number of public water
systems with serious violations.
HIGH-IMPACT CIVIL AND
CRIMINAL ENFORCEMENT CASES
Tonawanda Coke Corporation was ordered to pay a $12.5
million penalty and make $12.2 million in community
service payments for criminal violations of the Clean Air
Act and the Resource Conservation and Recovery Act.
P&W Waste Oil Services Inc. of Leland, North Carolina;
CITGO Petroleum; and CITGO Refining and Chemicals
Company LLP were sentenced to pay more than $2
million for illegal and dangerous chemical emissions from
a refinery in Corpus Christi, Texas.
The Kerr-McGee Corporation and related subsidiaries of
Anadarko Petroleum Corporation settlement has gone into
effect (in FY 2015) and will provide more than $4.4
billion for cleanup at over 2,700 sites in 47 states, making
it the largest recovery for the cleanup of environmental
contamination in history.
Eastman Kodak Company committed to fund a trust with
$49 million for cleanup at the Eastman Business Park site
and the Genesee River.
SPT, Inc., agreed to put $3 million in a trust fund to clean
up offshore contamination at Sparrows Point, Maryland.

1149
Key FY 2014 Performance Results
During FY 2014, federal enforcement
focused on the most important
environmental problems where
noncompliance is a significant contributing
factor, where federal civil or criminal
enforcement actions can have a significant
impact. Some important FY 2014
achievements that resulted from this focus
are:
Commitments in EPA enforcement
cases to reduce, treat, or eliminate
an estimated 1.2 billion pounds of
pollution of air, water, pesticides,
toxics, and hazardous waste
pollution.
Company investments of more than
$9.7 billion in required actions and
equipment to control pollution and
redress harm from pollution,
directly benefiting nearby
communities.
Agreements from companies to
spend more than $17 million on
supplemental environmental
projects, which are projects that
complement traditional fines and
penalties to address harm to
adjacent communities and the environment from illegal pollution.
FY 2014 commitments from potentially responsible parties to spend more than $600
million cleaning up contamination at Superfund sites.
Commitments to clean up 870 million cubic yards of contaminated soil and groundwater
media as a result of concluded Comprehensive Environmental Response, Compensation,
and Liability Act (CERCLA) and Resource Conservation and Recovery Act (RCRA)
corrective action enforcement actions.
$163 million in criminal fines and restitution and civil penalties (administrative and
judicial), and another $16 million in court-ordered environmental projects.
A 95 percent conviction rate for criminal defendants and a combined total incarceration of
over 155 years.
EPA reviewed and commented on more than 300 draft and final Environmental Impact
Statements as required by law, including several high-profile proposed federal actions.
In FY 2014, EPA conducted more than 15,600 federal inspections and evaluations. EPA initiated
approximately 2,300 civil judicial and administrative cases and concluded approximately 2,300
HIGH-IMPACT CIVIL AND CRIMINAL ENFORCEMENT
CASES
Lowe’s Home Centers agreed to implement a corporation-
wide compliance program at 1,700 stores nationwide and
will pay a $500,000 civil penalty due to violations of the
Lead Renovation, Repair, and Painting Rule.
DuPont will pay a $1.275 million penalty and
spend about $2.3 million as injunctive relief to
complete required improvements to its safety and
emergency response processes and pay a
$1,853,000 penalty for violations of pesticide
reporting and distribution laws. Harrell’s LLC agreed to pay a $1,736,560 penalty for
pesticides production and distribution violations.
Elementis Chromium, Inc., was ordered to pay a $2,571,800
penalty for failing to disclose information about substantial
risk of injury to human health from a known carcinogen
used at the plant, as required by the Toxic Substances
Control Act.
Newfield Production Company settled violations of the Safe
Drinking Water Act in the Monument Butte Well Field in
Duchesne County, Utah on the Uintah and Ouray
Reservation.
The Omaha Tribe of Nebraska resolved longstanding
violations of the Resource Conservation and Recovery Act,
the Safe Drinking Water Act, and the Clean Water Act.

1150
cases. The case initiation and conclusion numbers were lower than the targets (3,200 and 2,800
respectively) as a result of focusing on the largest most complex cases. This approach best protects
public health not only by addressing the most serious pollution problems, but also by directing
EPA resources to cases that may not be addressed by states because the noncompliance is of such
a large scale that EPA is best suited to take action. The number of cases was also impacted by the
federal government shutdown in 2014, the employee furloughs in 2013, and the need to devote
resources to the monitoring of ongoing consent decrees.
In the pursuit of public health protection, in FY 2014, EPA civil enforcement actions resulted in a
total of $100 million in civil penalties (administrative and judicial) to achieve compliance, punish
misconduct, and deter other violators. Maintaining the strong backbone of enforcement while
advancing and implementing Next Generation Compliance approaches was a focus in FY 2014 as
illustrated by the examples in this report.
Moving Next Generation Compliance from Design to Implementation
During FY 2014, EPA made progress implementing each of the five components of Next
Generation Compliance.
1. Regulation and permits design:
In FY 2014, EPA proposed Petroleum Refinery Risk and Technology Review and New
Source Performance Standards, which would require additional toxic air emission
control requirements for storage tanks, flares, and coking units at petroleum refineries.
The proposed rule includes fenceline monitoring to ensure that applicable air standards
are being met and neighboring communities are not being exposed to unintended
emissions.
During FY 2014, OECA trained more than 400 EPA and state staff and managers on
the roles of EPA staff in improving rule effectiveness, and issued both guidance and a
workbook on how to design more effective rules to maximize compliance and
environmental benefits.
2. Advanced monitoring:
Beyond infrared cameras, EPA is using other advanced technologies such as Geospatial
Measurements of Air Pollution (i.e., use of vehicles with measurement systems) to find
emission leaks that would otherwise be difficult to detect.
Advanced monitoring requirements were incorporated into several enforcement
settlements (AL Solutions Inc., and Calumet Shreveport Lubricants and Waxes, LLC).
EPA hosted a “Next Generation Compliance Advanced Monitoring Tech Demo Day”
that convened some of these latest advances in pollution monitoring across the country.
EPA, academia, industry, and nonprofit organizations presented many solutions, each
with a unique approach to solve complex pollution challenges.
3. Electronic reporting:
During FY 2014, EPA drafted a Supplemental Notice in support of the NPDES
Electronic Reporting Rule to provide additional clarity, describe other options under

1151
consideration, and give the public another opportunity to comment after publication in
the Federal Register.
EPA developed new capabilities for the Electronic Notice of Intent tool, called the
NPDES eReporting Tool (NeT), which supports reporting of NPDES data by applicants
for general NPDES permits.
EPA completed work necessary to move EPA’s NPDES Multi-Sector General Permit
to electronic reporting and integrate it with another EPA system, ATTAINS, which is
used for receiving impaired waters information and data transfer to the Integrated
Compliance Information System.
In FY 2014, EPA Region 1 reissued the city of Chelsea’s NPDES permit with
requirements for electronic reporting of discharge monitoring reports (DMRs) using
NPDES NeT DMR. As well, the final Vessel General Permit became effective, with
several electronic reporting requirements.
During FY 2014, EPA completed the modernization of the Air Facility System to a
new air component of the Integrated Compliance Information System (ICIS-Air) and
conducted training sessions with more than 150 state and local agency users.
4. Expanded transparency:
During FY 2014, EPA added functionality to ECHO—enhanced searches for data
related to compliance, violations, enforcement cases, specific facilities, and/or
pollutants for the Clean Water Act, Clean Air Act, RCRA, CERCLA, and multi-media
enforcement programs.
5. Innovative enforcement:
The Next Generation Compliance components listed above are being incorporated into
civil and criminal case resolution, making it easier to know if facilities are complying
and providing more information to the communities affected.
Examples of innovative enforcement cases with Next Generation components are
discussed throughout this report, including, for example, Alpha Natural Resources,
Titanium Metals Corporation, Lowe’s Home Centers, AL Solutions Inc., and Calumet
Shreveport Lubricants and Waxes, LLC.
EPA has developed a Sharepoint site that identifies EPA settlements with Next
Generation components.
EPA also evaluated the use of new data analytics technology and completed the
enhanced analytic pilot for integrating OSHA and EPA data as another tool for
targeting compliance monitoring.
National Enforcement Initiatives
EPA’s six NEIs address some of the more complex pollution problems in our nation:
1. Keeping raw sewage and contaminated storm water out of our nation’s waters. To
date, EPA has addressed 196 large combined sewer overflow systems (19 in FY 2014) and
883 large sanitary sewer overflow systems (55 in FY 2014). Notable FY 2014 cases for
this NEI include the East Bay Municipal Utility District, the city of Mishawaka, the

1152
Metropolitan Water Reclamation District of Greater Chicago, the city of Shreveport,
Miami–Dade County, and the San Antonio water system.
2. Preventing animal waste from contaminating surface and ground water. To date, EPA
has concluded 387 enforcement actions for violations associated with concentrated animal
feeding operations, as illustrated by County Edge Dairy Inc. This includes 26 concluded
enforcement actions in FY 2014.
3. Cutting toxic air pollution that affects communities’ health. To date, EPA has evaluated
over 1,700 air toxic emitting facilities, as illustrated by DuPont. EPA also issued an
industry-wide Flaring Efficiency Enforcement Alert and individual-facility flaring notice
letters to the full universe of petroleum refineries and petrochemical and organic chemical
manufacturers operating steam-assisted flares.
4. Reducing widespread air pollution from the largest sources (especially the coal-fired
plant, cement kiln, glass, and acid manufacturing sectors). To date, the New Source
Review/Prevention of Significant Deterioration initiative has begun investigations for 103
cement plant facilities, 127 glass
facilities, 109 acid manufacturing
facilities, and 863 coal-fired electric
utility units. Notable cases in FY
2014 for this NEI include
Minnesota Power, Cabot
Corporation, and Consumers
Energy.
5. Reducing pollution from mineral
processing operations. EPA has
inspected 107 mineral processors
and addressed 61 to date. Notable
FY 2014 cases for this NEI include
Titanium Metals Corporation, the
court decision in the Tronox
bankruptcy, the EPA Region 9
settlement with Nevada Gold
Mining Company Veris Gold USA,
Inc., and the EPA Region 10
settlement with the Oregon
Metallurgical of Albany and TDY
Industries of Millersburg.
6. Ensuring energy extraction
sector compliance with
environmental laws. EPA has
conducted 2,627
inspections/evaluations to date (723
ENFORCING ENVIRONMENTAL LAWS AT FEDERAL
FACILITIES TO ENSURE COMPLIANCE
EPA’s FY 2014 federal facilities enforcement program
included a record number of formal disputes with federal
agencies at National Priorities List sites and emergency
actions at other major cleanups nationwide. These cleanup
disputes and actions, at nearly a dozen federal facilities,
will help restore contaminated ground water, reinforce
necessary cleanup remedies, address abandoned munitions
and emerging contaminants of concern, promote public
involvement, and enforce proper land use controls for any
contamination left behind. Notable FY 2014 agreements
include Camp Minden, Louisiana and Fort Gillem,
Georgia. In addition, EPA commenced formal enforcement
proceedings with respect to the Department of Energy’s
Hanford site for failure to meet remedial action milestones.
These and other forceful EPA actions at federal facility
cleanup sites affirmed the federal government’s obligation
to meet the same standards as others.
Also in FY 2014, EPA released a new updated and
electronic version of “Yellow Book,” which is a guide to
environmental enforcement and compliance at federal
facilities. The Yellow Book serves as the primary
information source on environmental compliance to
thousands of federal environmental professionals and
others across the nation, and is now available on the EPA
website or through FedCenter.

1153
in FY 2014) to ensure compliance with environmental laws in the burgeoning natural gas
extraction sector across the United States. Notable FY 2014 cases under this NEI include
Chesapeake Appalachia, LLC, and Gasco Energy Inc.
Performance Challenges
Electronic Reporting
To improve reporting efficiency, improve compliance, and increase publicly available compliance
information, EPA is working to convert to electronic reporting as described above. This effort will
require some short-term budget investments but is expected to provide substantial long-term
benefits for industry, states, EPA, and the public. However, reductions of federal and state
resources for environmental work over the past several years has slowed down the transition to
electronic reporting and other aspects of Next Generation Compliance, thereby delaying the
expected benefits.
The federal government shutdown in FY 2014 and employee furloughs in FY 2013 resulted in
fewer federal cases overall due to disruptions in case work. In addition, the necessary focus on
high-impact cases has contributed to a reduction in the total number of cases.

1154
CROSS-AGENCY STRATEGIES
Introduction
This is the first year of the FY 2014-2018 EPA Strategic Plan’s cross-agency strategies. Stemming
from agency and Administrator priorities, these strategies outline how EPA plans to fundamentally
change how it works, both within and outside the Agency, to achieve its mission results. The strategies are national, multi-year, cross-program priorities that require collaborative
engagement beyond traditional organizational boundaries. Agency efforts to advance the strategies
are taking hold, buoyed by our experience over the last few years, as we implement a new set of
strategies and a reconfigured governance structure. EPA establishes annual action plans to implement these multi-year strategies to ensure meaningful
and specific efforts each year. The FY 2015 action plans can be found at
http://www2.epa.gov/planandbudget/strategicplan.

1155
WORKING TOWARD A SUSTAINABLE FUTURE.
Advance sustainable environmental outcomes and optimize economic and social outcomes
through Agency decisions and actions, which include expanding the conversation on
environmentalism and engaging a broad range of stakeholders.
This cross-agency strategy advances the national goal of achieving “conditions under which
humans and nature can exist in productive harmony and fulfill the social, economic, and other
requirements of present and future generations,” as established in the National Environmental
Policy Act of 1969. EPA will consider and apply sustainability principles to its work on a regular
basis, collaborating closely with stakeholders. Our traditional approaches to risk reduction and
pollution control cannot always fully achieve our long-term and broad environmental quality goals.
The interplay between different environmental statutes and programs also requires renewed
attention to improve “synergy” and long-term solutions. Activities that support this work include
technology-based innovation, regulatory processes, incentive-based efforts to complement those
regulations, and external outreach.
Summary of Progress
The Agency has made progress on the three major actions in the cross-agency strategy: identifying
cross-program priority areas to advance sustainability objectives, engaging and empowering staff,
and working to expand the conversation on environmentalism with stakeholders. Next steps in the
FY 2015 Action Plan are to: 1) tell success stories of EPA sustainability work through videos to
educate and empower all EPA staff to incorporate sustainability principles into their work; 2)
continue improvement of sustainability considerations in facilities management; 3) Enhance use
of sustainability indicators, metrics and tools.
Beginning in February and continuing to the present, the Agency has made significant progress
identifying cross-program priority areas and leveraging opportunities, goals, lessons learned, and
activities key to integrating sustainability in four priority areas. The four areas are identified
priorities that each have a number of specific projects managed by several EPA program offices
and are used to communicate sustainability principles.
For green products: multi-stakeholder systems for defining and rating green products and
sustainable purchasing.
For green infrastructure: stormwater management.
For sustainable materials management: food systems and projects.
For energy efficiency: measures to enhance electric system efficiency that can support the
President’s Climate Action Plan.
To engage and empower EPA staff, the Agency has planned and implemented internal
communications and knowledge management projects to help employees share knowledge and
develop ideas that can lead to innovative programs. An internal EPA SharePoint site for
community of practice work has been developed and is in use. EPA users can share a broad array
of projects, information, case studies, and tools, thus reducing stovepiped communications and
expanding the opportunities for ideas to flourish.

1156
The EPA Regional Offices continue to collaborate and innovate in partnership with Headquarters
program offices, and the Agency is investigating new opportunities for partnership to expand the
conversation on environmentalism with stakeholders and identify more sustainable management
of resources and the built environment. As one example, the Green Infrastructure Collaborative
will build capacity for implementing green infrastructure through partnership between federal
agencies, nonprofits, and the private sector.
Key FY 2014 Performance Results
Agency-Wide Staff Engagement via GreenSpark
Via an online ideation platform, staff from across the Agency shared 463 ideas on ways to conserve
resources; reduce energy, water, and waste; and otherwise reduce the environmental footprint of
EPA facilities, including actions to reduce their own environmental impact at work. Employees
also “liked” their colleagues’ ideas 5,024 times and commented on those ideas 417 times.
The ideas submitted by staff were evaluated for cost, feasibility, and popularity. The previous
Deputy Administrator announced follow-up activities for the selected ideas, which are being
implemented at Headquarters and across the Agency:
To increase paperless correspondence, the Office of the Executive Secretariat developed
an electronic letterhead and is exploring a more toner-efficient font. They are also
exploring how to improve the use of the agency’s Correspondence Management System
for electronic document concurrence to increase paperless correspondence. The Office of
Environmental Information is working to reduce the number of fax machines and install e-
fax where needed.
A composting program has been launched throughout the Headquarters William Jefferson
Clinton (WJC) buildings to collect paper towel and food waste in pantries and restrooms.
Filtered water dispensers will be installed throughout the WJC buildings in FY 2015 to
encourage the use of reusable water bottles and decrease waste from disposable water
bottles.
Improvements have been made to WJC building bike facilities.
Regional submissions were also reviewed and are being implemented by staff in those locations.
Green Infrastructure Collaborative
The Green Infrastructure Collaborative consists of more than 20 organizations committed to
advancing the adoption of green infrastructure as a means of supporting water quality and
community development goals. This broad group of signatories includes academia, non-
governmental organizations, and the private sector.
On October 8, 2014, EPA joined the Green Infrastructure Collaborative, along with six other
federal agencies. These agencies signed a Federal Letter of Support committing to specific actions
to promote green infrastructure. The cooperating agencies are EPA, the Department of Housing
and Urban Development, the Department of Transportation, the Department of Agriculture, the

1157
Department of the Interior, the Department of Defense, and the Department of Energy. Over the
coming year, Collaborative members will work closely together to align public and private
knowledge and resources to promote green infrastructure.
In the letter of support, each of the seven participating federal agencies identified specific actions
that each agency can take to help local communities more fully realize their green infrastructure
objectives. Example actions include:
Providing technical assistance to provide on-the-ground support aimed at creating
integrated green stormwater management and hazard mitigation plans.
Recognizing innovative green infrastructure projects.
Working with states to integrate ecosystems and transportation planning.
Incorporating green infrastructure practices into agency facilities or lands.
Emphasizing connections to green infrastructure in existing grant programs.
Distilling and broadly disseminating the best ideas and lessons learned from existing grant
programs.
Performance Challenges
Encouraging Knowledge Management in the New Community of Practice
Coordinating agencywide actions through the development and installation of the community of
practice SharePoint site is challenging in that populating the site with the appropriate information
from the vast set of EPA sustainability information takes time. The new community of practice
site for EPA management and staff working on sustainability activities will require continued
“championing” and “upstart” time to broadcast internally its existence before full benefits and
regular use are achieved.
EPA is working to get more employees visiting, learning, and discussing in the SharePoint site by
populating the site with useful information and encouraging regular users to tag topics and mention
their colleagues to draw them to the site.

1158
WORKING TO MAKE A VISIBLE DIFFERENCE IN COMMUNITIES.
Align community-based activities to provide seamless assistance to communities, both urban
and rural, while maximizing efficiency and results. Expand support of community efforts to
build healthy, sustainable, green neighborhoods and reduce and prevent harmful exposures
and health risks to children and underserved, overburdened communities.
While EPA efforts have a direct, positive impact on the health and environmental quality of
communities, EPA will place additional focus on changing the way we work so that communities
can easily identify and achieve their full potential. EPA promotes the idea that environmental
progress can be better supported, demonstrated, and measured in communities—especially those
with environmental justice (EJ) concerns—so that all equally receive the benefits of human health
and environmental protection standards. Millions of minority, low-income, tribal, and indigenous
individuals are at risk of having poor health outcomes because they live in underserved,
overburdened communities. EPA can make a greater and more visible difference by embracing
strategies that incorporate an Agency-wide focus on communities. Specifically, EPA will rely on
a variety of approaches, including improved meaningful outreach to communities, better internal
alignment and coordination of resources across community-based programs, increased
incorporation of EPA community-focused approaches and analyses within regulatory and
enforcement actions, and expanded technical assistance and research to improve public health and
the environmental performance of communities. Partnering with federal, state, and local
governments, as well as other entities, is key to cultivating healthy and sustainable neighborhood
solutions that reflect effective land use, green development, and social and economic growth.
Summary of Progress
In FY 2014, EPA made significant progress under the community cross-agency strategy to make
a visible difference in communities. A key component of the FY 2014 success was the ability of
its newly created Agency-wide executive-level body (the Community Facilitation Team) to
harmonize various Agency community-based efforts under one umbrella. Through the team, EPA
was able to strengthen its “community of practice” through improvements to online tools such as
EPA’s Agency-wide project mapping platform called GeoPlatform and the Agency’s internal
community practitioner collaboration software tool using SharePoint. The GeoPlatform
improvements have contributed to increased cross-office use of GeoPlatform for coordination and
strategic planning purposes. The SharePoint site is now actively being used by staff implementing
the Administrator’s FY 2015 community cross-cutting strategy action plan.
EPA made significant progress toward a public release of its online EJSCREEN environmental
justice mapping and screening tool. In 2015, EPA will launch a single Internet landing page for
community stakeholders, including local governments, and make progress toward making EPA
resources more easily accessible and navigable for community stakeholders.
EPA now actively seeks to leverage the presence of resources from other Federal agencies for
work in communities: coordination with the Department of Housing and Urban Development
(HUD), the Department of Transportation (DOT), the Department of Agriculture (USDA), and
other agencies increased in FY 2014. EPA provided comments to HUD on its most recent
community block grants evaluation criteria; EPA participated directly in HUD and DOT grant

1159
application reviews; EPA worked in partnership with USDA, the Appalachian Regional
Commission, and CDC to launch the Local Food/Local Places initiative.
Key FY 2015 goals:
EPA will seek to work in partnership with other federal agencies in 3-5 communities in
each of EPA’s 10 regions. The specific agency involved will depend on the nature of the
problems each community is seeking to address.
EPA will launch a single internet landing page for community stakeholders, including local
governments.
EPA will seek to incorporate the use of monitoring tools (e.g., air or water monitors) into
negotiated enforcement settlements or EPA-issued permits in 1-2 environmentally
overburdened communities per region.
Key FY 2014 Performance Results
The action plan developed for the first year of this five-year strategy has helped EPA identify key
activities that promote a more complete and coordinated way to provide information, financial and
technical resources, and services to communities; more effectively educate and inform Agency
staff; and assist disadvantaged and EJ communities. EPA is learning and understanding what its
programs and offices do to help communities and how their work and activities can contribute to
coordinated community-based approaches needed to address environmental challenges.
GeoPlatform
GeoPlatform provides a common platform for mapping EPA investments and activities; it supports
rapid deployment of public map views, as well as advanced applications such as EPA’s
EJSCREEN and NEPAssist. Many EPA program offices are using GeoPlatform, including to map
community-level grants and technical assistance projects. The program has made minor
improvements to improve end-user access and usability. Additional training has been made
available to project-level staff on GeoPlatform.
EPA improved staff usability of GeoPlatform, resulting in an increase in users of over 1,300 (a 50
percent increase in overall usage). It now hosts 48 programmatic geospatial tools. The Agency
conducted outreach and training on GeoGrants, an advanced application that is supported by
GeoPlatform, to improve project officer utilization of the tool to map place of performance.
Community SharePoint Site
In July, 2014, EPA transitioned to SharePoint as the Agency-wide collaboration tool for all EPA
staff. Concurrently, the OSWER community SharePoint pilot site has been scaled up for Agency-
wide use supporting regional and program office staff implementing Task 1 of the community
cross-agency strategy. Those staff now have access to the SharePoint site and are receiving
SharePoint training.
The OSWER Community SharePoint site was expanded into an interactive platform for all EPA
staff to connect with each other across programs and Regions—to exchange information, discuss
issues in real time, and quickly identify community experts, training, and other useful resources.

1160
Leveraging of Federal Resources
EPA has been working closely with its federal partners to better coordinate community work:
EPA is providing significant input to HUD’s Notice of Funding Availability for the
Community Development Block Grant Disaster Recovery Funds.
HUD/DOT/USDA are participating in EPA high-level strategy meetings to support
implementation of Task 1.
Performance Challenges
Coordinating Actions Needed for Development and Installation of New Agency IT Systems
EPA is implementing several IT systems such as SharePoint, GeoPlatform, and broader internal
use of EJSCREEN. Each of these systems poses technical challenges, end-user training needs, and
a need to update Agency-wide policies for program and Regional Offices.
While implementation of new IT systems has its share of challenges, EPA has successfully
addressed many implementation challenges, with SharePoint now being actively and increasingly
used by EPA staff, GeoPlatform already widely used, and an improved version of EJSCREEN
soon to be available publicly. The Agency continues to provide for staff training, technical support,
and peer sharing groups to help end users integrate these tools into their programmatic operations.
Culture Change
A significant challenge for making “community” a framework for how EPA delivers its services
is overcoming traditional stovepipe operations that do not necessarily promote more coordinated
approaches, though they make more sense from the community perspective. To help overcome
bureaucratic inertia, EPA is using key tools such as improved peer sharing through SharePoint,
innovation discussions through EPA’s GreenSpark, more cross-office community-based focus at
the executive-management-level meetings, and geographically-focused efforts in which programs
try out integrated approaches that leverage each other’s presence in communities.
Internal vs. External Communication
Improving both internal and external communications is key to improving coordination and more
effectively working with communities. Internally, EPA is placing heavy emphasis on the use of
SharePoint to promote staff peer sharing of best practices, and help staff link with resources and
knowledge experts on issues relevant to their projects or communities. Externally, EPA is
developing a “community” site or “landing page” that lets community activists and local officials
navigate quickly to a variety of information on resources, technical assistance, and other subjects
that can empower them in addressing issues affecting their overburdened, underserved
communities. EPA is working to reconcile these competing demands—internally teaching
employees how to more effectively serve communities and externally educating the public about
EPA services and ensuring that the work makes a visible difference in their lives.
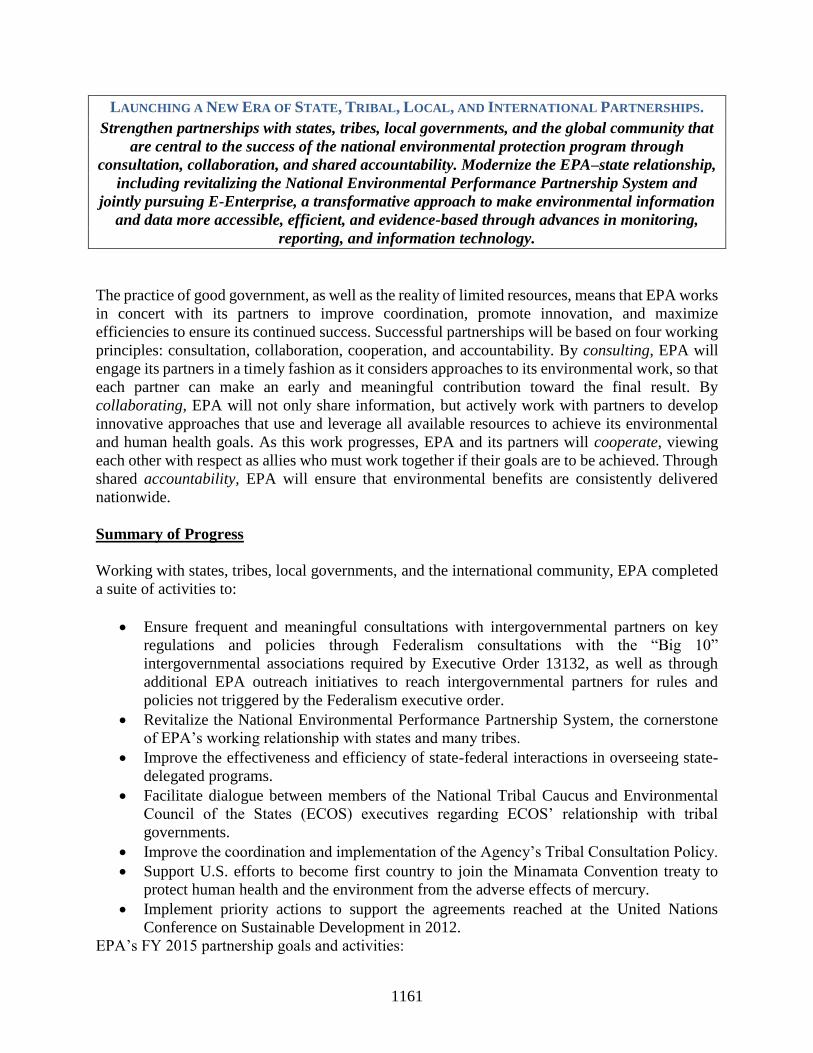
1161
LAUNCHING A NEW ERA OF STATE, TRIBAL, LOCAL, AND INTERNATIONAL PARTNERSHIPS.
Strengthen partnerships with states, tribes, local governments, and the global community that
are central to the success of the national environmental protection program through
consultation, collaboration, and shared accountability. Modernize the EPA–state relationship,
including revitalizing the National Environmental Performance Partnership System and
jointly pursuing E-Enterprise, a transformative approach to make environmental information
and data more accessible, efficient, and evidence-based through advances in monitoring,
reporting, and information technology.
The practice of good government, as well as the reality of limited resources, means that EPA works
in concert with its partners to improve coordination, promote innovation, and maximize
efficiencies to ensure its continued success. Successful partnerships will be based on four working
principles: consultation, collaboration, cooperation, and accountability. By consulting, EPA will
engage its partners in a timely fashion as it considers approaches to its environmental work, so that
each partner can make an early and meaningful contribution toward the final result. By
collaborating, EPA will not only share information, but actively work with partners to develop
innovative approaches that use and leverage all available resources to achieve its environmental
and human health goals. As this work progresses, EPA and its partners will cooperate, viewing
each other with respect as allies who must work together if their goals are to be achieved. Through
shared accountability, EPA will ensure that environmental benefits are consistently delivered
nationwide.
Summary of Progress
Working with states, tribes, local governments, and the international community, EPA completed
a suite of activities to:
Ensure frequent and meaningful consultations with intergovernmental partners on key
regulations and policies through Federalism consultations with the “Big 10”
intergovernmental associations required by Executive Order 13132, as well as through
additional EPA outreach initiatives to reach intergovernmental partners for rules and
policies not triggered by the Federalism executive order.
Revitalize the National Environmental Performance Partnership System, the cornerstone
of EPA’s working relationship with states and many tribes.
Improve the effectiveness and efficiency of state-federal interactions in overseeing state-
delegated programs.
Facilitate dialogue between members of the National Tribal Caucus and Environmental
Council of the States (ECOS) executives regarding ECOS’ relationship with tribal
governments.
Improve the coordination and implementation of the Agency’s Tribal Consultation Policy.
Support U.S. efforts to become first country to join the Minamata Convention treaty to
protect human health and the environment from the adverse effects of mercury.
Implement priority actions to support the agreements reached at the United Nations
Conference on Sustainable Development in 2012.
EPA’s FY 2015 partnership goals and activities:

1162
Continue consultation and outreach to state and local partners on regulations for the New
Source Performance Standards for Greenhouse Gases, Waters of the U.S., and chemical
facility safety; and improve the implementation of the Agency’s tribal consultation policy
through enhanced communication tools, training, and outreach.
Implement additional improvements and recognize the 20th anniversary of the National
Environmental Performance Partnership System and its role as a platform to revitalize
EPA’s working relationship with states.
Advance E-Enterprise by taking steps to embed E-Enterprise principles in EPA-state work
processes.
Implement EPA’s tribal identification data standard to help ensure the quality and
consistency of EPA data and enhance our ability to exchange tribal information across the
federal government.
Strengthen EPA partnerships with the Canadian and Mexican governments to improve
policies and implement cooperative projects that address climate change.
Key FY 2014 Performance Results
Consultations with State and Local Elected Officials on EPA Rulemakings, Guidance, and
Policies
The Agency broadened federalism consultations to include other intergovernmental organizations
and state and local officials - such as the Local Government Advisory Committee, the National
Association of State Departments of Agriculture, the National Association of State Conservation
Agencies, and the Association of State and Territorial Health Officials. National Program
Managers (NPMs) and Regional Offices conducted additional outreach with intergovernmental
partners on the New Source Performance Standards for Greenhouse Gases from existing
Electricity Generating Units, Waters of the U.S., climate resilience, sustainability, and chemical
facility safety. For example, EPA Region 7 provided chemical facility safety outreach to
agriculture associations and emergency planners in 24 venues, reaching over 5,000 in the regulated
community. In addition EPA continued collaborations with ECOS (begun in FY 2013) to ensure
strong EPA-state engagement around Civil Rights Act Title VI grant management programs.
National Environmental Performance Partnership System
EPA collaborated with states and tribes to design a new NPM guidance process to shift from an
annual to a two-year cycle that focuses on 1) establishing earlier and more meaningful engagement
with states and tribes in the development of national priorities and 2) enhancing the flexibility
provided to EPA Regions, states, and tribes.
Oversight of State-Delegated Programs
EPA assessed ongoing initiatives and near- and long-term ideas for improving the oversight
process for NPDES, Title V, and RCRA Subtitle C permitting programs. Through discussions on
advances and innovations in program management and oversight, EPA identified draft principles
for effective oversight that will inform FY 2015 discussions with states. To continue improving its

1163
ongoing oversight of state enforcement programs, EPA, in partnership with states, implemented
the State Review Framework Round 3 efficiencies identified in FY 2013 and began a dialogue
about the future direction of environmental enforcement oversight.
Government-Wide Collaboration with Tribal Partners
EPA established and Co-Chairs the Climate Change Subgroup of the White House Council on
Native American Affairs. The Subgroup identified proposed pilots to further federal interagency
cooperation and support working with tribal partners.
EPA also improved implementation of the Policy on Consultation and Coordination with Indian
Tribes by conducting training across all NPMs and EPA Regions about how to implement the
policy.
Provide EPA Leadership and Support to Strengthen International Collaborations
EPA finalized the U.S. position for the contents of a voluntary agreement on black carbon under
the Arctic Council, which will be implemented during the U.S. Chairmanship of the Council in
2015; EPA also implemented a project on black carbon best practices with other Arctic Council
countries.
EPA continued to build on the agreements reached at the United Nations Conference on
Sustainable Development (Rio+20) in 2012 by implementing priority actions in support of the
Ten-Year Framework of Programs on Sustainable Consumption and Production. Key
accomplishments included hosting the first global practitioners’ workshop on building an
international partnership to improve life-cycle assessment and helping complete the Global
Sustainable and Production Clearinghouse.
EPA worked with the Office of the U.S. Trade Representative on environmental aspects of trade
policy, and with the Department of Treasury on the environmental impacts of multilateral
development bank investments.
Performance Challenges
Oversight of State-Delegated Programs
Realizing the benefits of streamlining the State Review Framework. Because of
variability in regional organizational structures and in regional-state approaches to
Framework review implementation, efficiency gains from Framework streamlining may
not be fully realized in some instances.
Balancing consistency with flexibility. An ongoing challenge is defining the appropriate
balance between a nationally consistent baseline for state performance and the flexible
approach needed to achieve environmental protection.
State Resources and Data Quality. Resources are an increasing challenge for states
seeking to attain program objectives and for EPA seeking to conduct appropriate oversight.

1164
The completeness/quality of required state performance data is a challenge for conducting
oversight and for using data to conduct oversight more efficiently.
International—Addressing Black Carbon in Arctic Countries
Methods for measuring black carbon emissions are evolving and may delay agreement on how to
characterize project outcomes.

1165
EMBRACING EPA AS A HIGH-PERFORMING ORGANIZATION.
Maintain and attract EPA’s diverse and engaged workforce of the future with a more
collaborative work environment. Modernize our business practices, including through E-
Enterprise, and take advantage of new tools and technologies. Improve the way we work as a
high-performing Agency by ensuring we add value in every transaction with our workforce,
our co-regulators, our partners, industry, and the people we serve.
As today’s environmental challenges and solutions continue to increase in complexity, EPA’s
ability to respond creatively, flexibly, and effectively will demand that we embrace the latest
approaches to problem-solving and the use of new tools and technologies. Toward this end, EPA
is striving to be a high-performing organization (HPO) characterized by business practices that are
modern, efficient, and cost effective, as well as a work environment that supports employee growth
and development, is collaborative and is results driven. Becoming a high-performing organization
will require that we actively engage and consult with external partners, as well as EPA employees,
as we advance new tools and streamline approaches.
Summary of Progress
In FY 2014, EPA focused on fostering employee development and streamlining business practices.
EPA is making steady progress to become a High- Performing Organization (HPO), as evidenced
by key accomplishments in FY 2014: successfully launching Skills Marketplace, GreenSpark, and
SharePoint to increase employee engagement and collaboration; piloting new workplace designs
and reducing our environmental footprint; applying Lean techniques to streamline our business
processes; and implementing new strategic sourcing approaches to achieve efficiencies and
economies in our acquisition programs.
In FY 2015, the agency will continue to focus efforts on developing employees and streamlining
and modernizing business processes as described in EPA’s HPO FY 2015 Cross-Agency
Strategies Action Plan, available at http://workplace.epa.gov/realizingoneepa/pdf/hpo-action-
plan-fy15.pdf. New efforts in FY 2015 include: launching a succession management pilot to ensure
a pool of talent for critical positions to advance EPA’s mission; identifying best practices and
establishing processes for assessing agency efforts to enhance employee inclusion and
engagement; and, developing a training catalogue focused on enhance the supervisory
development curriculum for new and aspiring leaders.
Key FY 2014 Performance Results
Launched One EPA Skills Marketplace Program
In FY 2014, EPA successfully launched the One EPA Skills Marketplace Program, a voluntary
program that expands employee professional development and provides a nimble, innovative way
to get our work done by enabling employees to participate in projects or tasks outside of their
office unit for up to 20 percent of their time. The program bolsters career development
opportunities for the workforce and increases employee knowledge and experience.

1166
Prior to launching this program, EPA completed a pilot phase of the program in FY 2014 during
which 60 projects were completed and 92 employees participated. Following the pilot, the agency
offered 40 opportunities to support high-priority activities under the FY 2014 Action Plans for
EPA’s Cross-Agency Strategies; employees embraced this opportunity – over 100 applications for
these limited assignments were submitted. Since the launch of the full-scale program, 155 projects
have been posted, 199 applications have been submitted, and 30 employees have already started
working on projects.
Redesigned, Sustainable Workplace
EPA is committed to managing its facilities with a focus on sustainability. In FY 2014, the agency
redesigned and consolidated office space, particularly within buildings where leases were expiring,
to reduce our environmental footprint.
Over 1,000 employees moved to new working spaces, which required focused, fast-paced
collaboration within the agency to effectively plan, design, and implement the move. EPA released
all its space at one of its Washington, D.C.-based facilities, 1310 L Street, and relocated 450
employees to the nearby Federal Triangle Complex (FTC). Through consolidation, EPA reduced
its office space by 135,901 square feet, saving the agency an estimated $7 million in annual rent
expenditures and additional savings of $1.5 million associated with costs for security, parking,
shuttle service, fitness center, and the health unit. As the Agency reduces its physical footprint, it
also reduces its environmental footprint, achieving on-going reductions in energy use, water use,
waste generation, and greenhouse gas emissions.
Strategic Sourcing
EPA has made noteworthy progress on finding and maximizing efficiencies and economies in the
Agency’s acquisition programs. In FY 2014, EPA applied the lessons learned from a collaborative,
structured process of critically analyzing EPA’s spending on an agency-wide basis and used this
information to make business decisions about acquiring commodities and services more effectively
and efficiently. The Agency began to track and measure savings and efficiencies from
implementing strategic sourcing for cellular service and print management. These efforts led to
cost savings of $1.7 million and laid the groundwork for additional savings through upcoming
negotiations with service providers.
Performance Challenges
Implementation Delays
There have been implementation delays of some of the key tools and technologies used to enhance
communication, transparency, and cooperative problem solving. For example, Microsoft
SharePoint, a collaborative software tool, was launched later in the year than expected, causing a
ripple effect on projects depending on its availability, such as GreenSpark, a tool designed to give
the EPA workforce a platform for sharing innovative activities, best practices, insights, and ideas
to help make EPA stronger, more effective, and a great place to work.

A
Acquisition Management ....................................... 202, 431, 432, 589, 651, 652, 699, 707, 1040, 1042, 1043, 1056
Administrative Law ................................................................................................................ 201, 392, 393, 640, 1039
Administrative Provisions ....................................................................................................................................... 1055
Air Toxics .................................................................................................................................................................. 261
Air Toxics Monitoring ...................................................................................................................................... 233, 798
Alaska Native Villages .............................................................................................................................................. 822
Alternative Dispute Resolution .......................................................... 201, 393, 394, 397, 398, 589, 639, 1039, 1042
American Recovery and Reinvestment Act ....................................................................................................... 1018
Analytical Methods............................................................................................................................................ 128, 622
Annual Performance Report .................................................................................................................................. 896
Audits, Evaluations, and Investigations ..................................................................... 567, 569, 588, 595, 598, 1041
B
Base Realignment and Closure (BRAC) ..................................................................................................... 681, 976
Beach / Fish Programs ......................................................................................................................... 203, 516, 1040
BRAC ................................................................................................................................................................ 681, 976
Brownfields ..... ii, 44, 46, 47, 48, 53, 200, 243, 244, 245, 246, 247, 248, 249, 265, 271, 309, 404, 505, 572, 670, 754,
759, 760, 761, 830, 831, 832, 833, 834, 835, 891, 892, 970, 974, 1001, 1002, 1018, 1022, 1029, 1038, 1044,
1055, 1056
Brownfields Projects ........................................................................................... 248, 754, 760, 830, 834, 1044, 1055
C
CA Emission Reduction Project Grants ............................................................................................................... 836
CASTNET ..................................................................................................................................................... 90, 92, 207
Categorical Grant Beaches Protection .......................................................................................................................... 755, 757, 1045
Brownfields ........................................................................................................................................ 755, 759, 1045
Environmental Information .............................................................................................................. 755, 764, 1045
Hazardous Waste Financial Assistance ....................................................................................... 755, 768, 1044
Lead ................................................................................................................................................... 755, 762, 1044
Nonpoint Source (Sec. 319) ........................................................................................................... 754, 773, 1044
Pesticides Enforcement................................................................................................................... 755, 777, 1044
Pesticides Program Implementation .............................................................................................. 755, 779, 1044
Pollution Control (Sec. 106) ............................................................................................................ 755, 783, 1044
Pollution Prevention ......................................................................................................................... 755, 788, 1044
Public Water System Supervision .................................................................................................. 755, 790, 1044
Radon ................................................................................................................................................ 755, 794, 1044
State and Local Air Quality Management ..................................................................................... 755, 796, 1044
Toxics Substances Compliance ..................................................................................................... 755, 800, 1044
Tribal Air Quality Management ....................................................................................................... 755, 802, 1045
Tribal General Assistance Program .............................................................................................. 755, 804, 1045
Underground Injection Control ....................................................................................................... 755, 807, 1044
Underground Storage Tanks .......................................................................................................... 755, 810, 1045
Wetlands Program Development ................................................................................................... 755, 813, 1044
Categorical Grants .. 491, 754, 755, 756, 757, 759, 762, 763, 764, 768, 773, 777, 779, 783, 788, 790, 794, 796, 800,
802, 804, 807, 810, 813, 1044, 1045
Central Planning, Budgeting, and Finance .......................... 202, 428, 589, 656, 699, 708, 1040, 1042, 1043, 1058
Chemical and Pesticide Risks ............................................................................................................................... 980
Chesapeake Bay ................ 27, 37, 38, 76, 80, 262, 288, 289, 290, 291, 572, 870, 884, 963, 964, 965, 966, 1000, 1062
Children/Other Sensitive Populations Agency Coordination ............................................................................................................. 201, 334, 1039, 1056
Civil Enforcement.. 79, 80, 116, 200, 251, 259, 261, 263, 264, 268, 601, 616, 699, 702, 703, 730, 732, 735, 736, 987,
1038, 1043, 1056
Civil Rights / Title VI Compliance ............................................................................................. 201, 396, 1039, 1056
Clean Air ............................................................................................................................. 63, 236, 240, 261, 276, 422
Clean Air Allowance Trading Programs ................................................................. 85, 89, 199, 205, 1036, 1037, 1056
Clean Air and Climate ................................ 85, 88, 89, 94, 96, 98, 199, 204, 205, 210, 220, 225, 236, 240, 1036, 1037
Clean Water ................................................................................. 35, 261, 509, 536, 537, 540, 546, 623, 783, 816, 958
Cleaning Up Communities and Advancing Sustainable Development . 7, 9, 42, 43, 169, 176, 244, 270, 318, 338, 356,
365, 370, 403, 408, 413, 465, 471, 476, 502, 604, 619, 642, 660, 669, 674, 677, 683, 711, 716, 720, 727, 739,
748, 759, 768, 804, 810, 830, 846, 925
Climate Protection Program ...................................................................... 85, 94, 95, 199, 210, 213, 1036, 1037, 1056
Commission for Environmental Cooperation ............................................................................ 147, 379, 947, 948, 988
Communities . vi, 19, 28, 29, 42, 46, 47, 49, 50, 75, 76, 78, 97, 143, 168, 169, 176, 244, 270, 271, 272, 274, 308, 318,
336, 338, 356, 370, 387, 413, 414, 415, 416, 417, 536, 537, 547, 589, 604, 642, 659, 660, 700, 726, 727, 730,
747, 748, 759, 830, 891, 892, 954, 970, 971, 992, 1022, 1042, 1043, 1044
Compliance 8, 10, 71, 72, 73, 74, 75, 77, 78, 82, 94, 116, 200, 231, 250, 251, 252, 253, 254, 256, 259, 260, 261, 263,
265, 266, 278, 290, 329, 351, 363, 396, 398, 422, 435, 588, 600, 601, 602, 606, 610, 611, 613, 616, 649, 677,
678, 702, 730, 731, 732, 733, 735, 765, 777, 786, 800, 801, 921, 954, 987, 988, 989, 1014, 1022, 1023, 1029,
1032, 1038, 1041, 1043, 1056
Compliance Monitoring .. 77, 78, 200, 251, 588, 601, 602, 730, 732, 733, 777, 786, 800, 801, 1038, 1041, 1043, 1056
Computational Toxicology ........................................................................................................ 86, 177, 482, 915, 1037
Congressional Priorities ................................................................................. 87, 193, 203, 565, 755, 1037, 1041, 1045
Congressionally Mandated Projects........................................................................................................... 755, 1045
Consolidations, Realignments, or Other Transfers of Resources.................................................................. 1058
Corrective Action .............................................................................................................................................. 474, 977
Criminal Enforcement ....................................81, 200, 266, 267, 268, 589, 613, 614, 615, 927, 987, 1038, 1041, 1056
D
Decontamination ................................................................................................................................ 124, 127, 128, 621
Diesel Emissions Reduction Grant Program .................................................................................... 754, 836, 1044
Discontinued Progams ............................................................................................................................................. 1046
Drinking Water .................................................................................................. 190, 518, 519, 521, 609, 790, 807, 820
Drinking Water Programs ............................................................ 87, 189, 203, 518, 817, 823, 1037, 1041, 1056, 1058
E
Ecosystem Protection ............................................................................................................................................. 962
Ecosystems 26, 33, 35, 90, 160, 170, 193, 203, 207, 280, 288, 293, 295, 296, 302, 306, 309, 313, 316, 318, 323, 401,
507, 510, 531, 536, 552, 565, 683, 773, 783, 813, 816, 826, 838, 866, 915, 956, 966, 1040
E-Enterprise ...... iii, viii, 51, 74, 75, 76, 78, 80, 231, 232, 235, 252, 253, 256, 261, 345, 346, 349, 386, 389, 419, 487,
520, 764, 765, 766, 767, 846, 847, 1033
El Paso ..................................................................................................................................................................... 371
Electronic Reporting .............................................................................. 73, 77, 231, 253, 261, 263, 346, 349, 362, 766
eManifest .................................................................................................................................................. 572, 574, 598
E-Manifest ........................................................................................................................................... 51, 843, 844, 846
Endocrine Disruptors ............................................................................................................... 86, 202, 482, 1037, 1040
Enforcement .. 74, 75, 76, 77, 78, 79, 80, 81, 82, 86, 115, 116, 117, 200, 251, 252, 253, 254, 255, 256, 258, 259, 260,
261, 262, 263, 264, 266, 267, 268, 270, 276, 292, 350, 351, 352, 363, 418, 572, 589, 601, 602, 603, 604, 606,
607, 608, 609, 610, 611, 613, 614, 616, 617, 678, 686, 699, 701, 702, 713, 730, 732, 734, 735, 749, 777, 786,
801, 921, 981, 987, 988, 989, 992, 1022, 1032, 1036, 1038, 1041, 1042, 1043
Enforcement Training ............................................................................................................. 255, 266, 613, 988, 992
Enforcing Environmental Laws ..................................................................................................... 403, 408, 642, 987
Ensuring the Safety of Chemicals and Preventing Pollution ...... 7, 10, 61, 62, 126, 142, 145, 149, 276, 334, 350, 362,
373, 377, 403, 408, 441, 448, 457, 462, 482, 485, 491, 497, 619, 642, 665, 762, 779, 788, 927, 980, 1047
Environmental Education ........................................................ 174, 193, 201, 301, 307, 338, 339, 340, 341, 343, 1039
Environmental Information ....................................................................................................................................... 993
Environmental Justice .... 14, 46, 49, 62, 72, 80, 200, 264, 270, 271, 273, 275, 276, 394, 572, 589, 597, 604, 605, 639,
971, 1038, 1042, 1056
EPA User Fee Program ............................................................................................................................................ 1013

Exchange Network 201, 345, 346, 348, 349, 389, 589, 627, 628, 629, 636, 764, 765, 766, 767, 994, 995, 996, 1033,
1039, 1042, 1056, 1058
F
Facilities Infrastructure and Operations .......86, 139, 140, 202, 332, 425, 577, 582, 585, 589, 645, 646, 699, 705, 730,
745, 1016, 1036, 1040, 1041, 1042, 1043, 1044
Federal Stationary Source Regulations .................................................................................. 104, 199, 220, 1037, 1056
Federal Support for Air Quality Management ................. 85, 96, 97, 199, 225, 226, 803, 837, 1036, 1037, 1056, 1057
Federal Vehicle and Fuels Standards and Certification ......................................................................... 85, 94, 98, 1036
Forensics Support ...................................................................................................... 81, 86, 116, 589, 616, 1036, 1042
G
General Counsel 132, 135, 139, 326, 331, 341, 345, 353, 382, 385, 392, 394, 396, 401, 403, 407, 410, 418, 422, 425,
428, 431, 434, 437, 569, 579, 582, 595, 624, 627, 631, 634, 639, 640, 641, 645, 648, 651, 654, 656, 705, 707,
708, 745, 764
Geographic Program Chesapeake Bay .............................................................................................................................. 200, 288, 1038
Gulf of Mexico ................................................................................................................................... 200, 306, 1038
Lake Champlain................................................................................................................................ 200, 313, 1038
Long Island Sound ........................................................................................................................... 200, 302, 1038
Geographic Programs .......................................... 200, 279, 280, 288, 293, 296, 302, 306, 309, 313, 318, 963, 1038
Goal 1 ................................................. 13, 17, 19, 403, 404, 408, 642, 851, 856, 857, 859, 918, 943, 1023, 1024, 1025
Goal 2 ................................................................................ 27, 28, 29, 403, 404, 408, 642, 863, 952, 1026, 1027, 1028
Goal 3 ................................... 43, 45, 46, 47, 403, 404, 405, 408, 642, 676, 681, 692, 847, 891, 970, 1028, 1029, 1035
Goal 4 ...................................................................................... 62, 63, 403, 405, 408, 642, 905, 980, 1030, 1031, 1034
Goal 5 ............................................................................................................ 72, 75, 77, 403, 408, 642, 921, 987, 1032
Great Lakes ..................................................................................................................................................... 509, 963
Great Lakes Legacy Act ......................................................................................................................................... 282
H
Hazardous Waste Electronic Manifest System Fund ............................................. 3, 4, 7, 10, 465, 844, 846, 847, 1045
Hazardous Waste Financial Assistance ............................................................................................................. 768, 769
Homeland Security ...... 40, 56, 69, 70, 86, 114, 118, 119, 120, 121, 126, 128, 129, 130, 132, 200, 201, 239, 325, 326,
327, 328, 329, 331, 332, 348, 357, 383, 562, 563, 577, 578, 579, 580, 585, 589, 618, 619, 620, 621, 622, 624,
632, 670, 674, 706, 931, 950, 952, 955, 965, 967, 972, 977, 982, 985, 988, 995, 1036, 1038, 1039, 1041, 1042
Communication and Information .................................................................................................... 200, 326, 1038
Critical Infrastructure Protection ................................................................................ 86, 119, 201, 329, 1036, 1038
Preparedness, Response, and Recovery .............................................................. 86, 126, 589, 619, 622, 1036, 1042
Protection of EPA Personnel and Infrastructure ..... 86, 132, 201, 331, 577, 579, 589, 624, 1036, 1038, 1041, 1042
Human Health .. 8, 10, 42, 47, 57, 69, 70, 71, 72, 86, 116, 153, 177, 182, 186, 251, 259, 266, 329, 365, 538, 590, 601,
606, 610, 613, 616, 665, 684, 702, 732, 735, 777, 800, 804, 902, 932, 978, 1037, 1042
Human Health Risk Assessment .......................................... 69, 70, 86, 153, 177, 182, 186, 590, 665, 932, 1037, 1042
Human Resources Management ............................................................ 202, 437, 438, 589, 654, 1040, 1042, 1056
I
Improve Human Health and the Environment in Indian Country ...................................................................... 902
Indoor Air ...... 22, 85, 106, 107, 108, 109, 111, 113, 200, 554, 555, 556, 557, 558, 560, 562, 588, 591, 592, 794, 795,
859, 948, 949, 1036, 1037, 1038, 1041
Radon Program ........................................................................................................... 85, 107, 200, 555, 1036, 1037
Indoor Air and Radiation ......... 85, 106, 107, 109, 111, 113, 200, 554, 555, 557, 560, 562, 588, 591, 592, 1036, 1037,
1038, 1041
Information Exchange / Outreach .......201, 333, 334, 338, 341, 345, 350, 353, 356, 362, 365, 589, 626, 627, 1039,
1042
Information Security .. 136, 201, 326, 349, 382, 383, 384, 390, 569, 570, 571, 572, 574, 589, 598, 628, 631, 632, 633,
637, 1010, 1020, 1039, 1042
Infrastructure Assistance ..................................................................................... 371, 754, 816, 820, 826, 838, 1044

Alaska Native Villages ..................................................................................................................... 754, 826, 1044
Clean Water SRF ............................................................................................................................. 754, 816, 1044
Drinking Water SRF ......................................................................................................................... 754, 820, 1044
Mexico Border ................................................................................................................................... 754, 838, 1044
Inspector General ....... 3, 4, 7, 8, 9, 10, 11, 132, 135, 139, 299, 326, 331, 341, 345, 353, 382, 385, 392, 394, 396, 401,
407, 409, 410, 418, 422, 425, 428, 430, 431, 434, 437, 566, 567, 569, 570, 574, 575, 579, 582, 595, 596, 598,
599, 609, 624, 627, 631, 634, 639, 641, 645, 648, 651, 654, 656, 658, 705, 707, 708, 745, 764, 805, 992, 996,
998, 1021, 1041
Integrated Environmental Strategies ........................................................................................ 201, 413, 1039, 1056
International Programs ................................................................................................. 201, 369, 370, 373, 377, 1039
International Sources of Pollution ............................................................................................. 201, 373, 1039, 1056
IT / Data Management .......................... 86, 134, 135, 201, 381, 382, 385, 589, 630, 631, 634, 1036, 1039, 1042, 1056
IT / Data Management / Security ....................86, 134, 135, 201, 381, 382, 385, 589, 630, 631, 634, 1036, 1039, 1042
L
Lake Champlain ...................................................................................................................................................... 509
Lake Pontchartrain ........................................................................................................ 200, 319, 320, 322, 324, 1038
Lead ................................................................................................................................................................... 269, 984
Legal / Science / Regulatory / Economic Review ...... 201, 202, 391, 392, 394, 396, 401, 407, 410, 413, 418, 422,
589, 638, 639, 641, 1039, 1042
Legal Advice Environmental Program............................................................................... 201, 401, 589, 641, 1039, 1042, 1056
Support Program .................................................................................................................... 201, 407, 1039, 1056
Libraries .................................................................................................................................................................... 635
Long Island Sound .................................................................................................................................. 302, 305, 969
LUST / UST ........................................................................................................ 203, 502, 699, 711, 1040, 1043, 1056
LUST Cooperative Agreements ................................................................................................ 53, 699, 714, 716, 1043
LUST Prevention ............................................................................................... 52, 505, 699, 712, 717, 720, 812, 1043
M
Major Management Challenges ................................................................................................................................. 998
Marine Pollution .................................................................................................................. 203, 531, 960, 1041, 1056
Mercury and Air Toxics Standards ...................................................................................................................... 91, 403
Mexico Border ........................................ 257, 265, 344, 371, 439, 469, 547, 602, 838, 839, 840, 889, 972, 973, 1021
Mississippi River Basin ............................................................................................................... 40, 308, 508, 885, 886
Monitoring Grants ......................................................................................................................................... 755, 1044
N
Nanotechnology ......................................................................................................................................... 179, 181, 985
National Estuary Program / Coastal Waterways .............................................................................. 203, 507, 1040
NEPA Implementation ................................................................................................................ 200, 276, 1038, 1057
O
OECA .................................................................................................................... 73, 77, 253, 261, 263, 732, 924, 925
Office of Administration and Resource Management ...... 132, 135, 139, 326, 331, 341, 345, 353, 382, 385, 392, 394,
396, 401, 407, 410, 418, 422, 425, 428, 431, 434, 437, 569, 579, 582, 595, 624, 627, 631, 634, 639, 641, 645,
648, 651, 654, 656, 705, 707, 708, 745, 764, 936, 992, 993
Office of Air and Radiation ................................................................................................................................... 1008
Office of Environmental Information 132, 135, 139, 326, 331, 341, 345, 353, 382, 385, 392, 394, 396, 401, 407, 410,
418, 422, 425, 428, 431, 434, 437, 569, 579, 582, 595, 624, 627, 631, 634, 639, 641, 645, 648, 651, 654, 656,
705, 707, 708, 745, 764, 993, 996, 1016
Office of General Counsel . 132, 135, 139, 326, 331, 341, 345, 353, 382, 385, 392, 394, 396, 401, 403, 407, 408, 410,
418, 422, 425, 428, 431, 434, 437, 569, 579, 582, 595, 624, 627, 631, 634, 639, 641, 642, 645, 648, 651, 654,
656, 705, 707, 708, 745, 764
Office of Research and Development ........................ 164, 172, 177, 186, 571, 662, 667, 929, 930, 931, 932, 933, 935
Office of Solid Waste and Emergency Response .......................................................... 46, 52, 477, 661, 678, 732, 749

Office of the Chief Financial Officer . 132, 135, 139, 326, 331, 341, 345, 353, 382, 385, 392, 394, 396, 401, 407, 410,
418, 422, 425, 428, 431, 434, 437, 524, 546, 569, 579, 582, 595, 624, 627, 631, 634, 639, 641, 645, 648, 651,
654, 656, 705, 707, 708, 745, 764, 991, 1016, 1053
Oil .... 3, 4, 7, 8, 10, 17, 24, 41, 56, 73, 91, 112, 113, 114, 126, 139, 162, 163, 166, 169, 170, 208, 251, 259, 306, 328,
401, 406, 409, 425, 427, 562, 563, 582, 585, 601, 623, 645, 647, 660, 670, 674, 702, 705, 727, 729, 730, 732,
733, 735, 736, 737, 738, 739, 740, 742, 743, 745, 748, 750, 925, 978, 1021, 1043, 1044
Oil Spill Prevention, Preparedness and Response .................................................................................... 730, 739, 1043
OP ..................................................................................................................................................................... 990, 991
Operations and Administration .... 86, 138, 139, 202, 424, 425, 428, 431, 434, 437, 577, 581, 582, 589, 644, 645, 648,
651, 654, 656, 699, 704, 705, 707, 708, 730, 744, 745, 1036, 1039, 1040, 1041, 1042, 1043, 1044
P
Performance Eight-Year Array ................................................................................................................................................. 851
Pesticides
Realize the Value of Pesticide Availability ...................................................... 86, 149, 202, 457, 1036, 1040, 1057
Pesticides Licensing .......................................86, 141, 142, 145, 149, 202, 440, 441, 448, 457, 462, 1036, 1037, 1040
Pollution Prevention .................................................................................................................................................. 743
Pollution Prevention Program ................................................................... 202, 491, 851, 918, 919, 920, 1040, 1057
Preserve Land ........................................... 42, 47, 50, 465, 476, 502, 669, 683, 711, 720, 768, 810, 846, 847, 893, 975
Program Projects by Program Area ................................................................................................................... 1036
Protect Human Health ..... 26, 30, 86, 119, 124, 142, 160, 189, 202, 329, 441, 516, 518, 565, 757, 781, 790, 807, 820,
863, 905, 952, 1036, 1040, 1057
Protect the Ozone Layer ................................................................................................................ 12, 23, 236, 240, 861
Protecting America’s Waters ................................................................................................. 27, 75, 403, 408, 642, 952
Puerto Rico .............................................................................................................................................................. 819
Puget Sound ......................................................... 37, 38, 200, 296, 297, 298, 299, 300, 301, 887, 888, 967, 968, 1038
R
Radiation.. 12, 24, 85, 107, 111, 112, 113, 114, 126, 129, 131, 200, 265, 560, 561, 562, 584, 588, 592, 593, 609, 703,
862, 951, 952, 1008, 1014, 1023, 1036, 1038, 1041, 1053
Protection .......................................................................................... 85, 111, 200, 560, 588, 592, 1036, 1038, 1041
Response Preparedness ............................................................................................... 85, 113, 200, 562, 1036, 1038
RCRA Corrective Action .................................................................................................................... 202, 471, 1040, 1057
Waste Management ..................................................................................... 202, 465, 844, 846, 1040, 1045, 1057
Waste Minimization & Recycling .......................................................................................... 202, 476, 1040, 1057
Recovery Act ..... 116, 117, 249, 255, 257, 262, 265, 269, 275, 290, 301, 410, 411, 412, 421, 430, 470, 475, 480, 493,
570, 602, 612, 658, 682, 703, 709, 728, 768, 772, 848, 965, 977, 1022
Reduce Greenhouse Gas Emissions ................................................................................................................... 477
Reduce Risks from Indoor Air ............................................................................... 85, 109, 200, 557, 1036, 1038, 1057
Regional Science and Technology ..................................................................................................... 201, 410, 1039
Regions ................... 126, 170, 426, 444, 525, 661, 672, 749, 870, 892, 894, 897, 898, 901, 933, 969, 976, 1000, 1001
Regulatory/Economic-Management and Analysis ................................................................. 202, 418, 1039, 1057
Research
Air, Climate and Energy ....................................................................................................................... 86, 153, 1037
Chemical Safety and Sustainability .............................................................. 86, 87, 176, 182, 590, 665, 1037, 1042
Safe and Sustainable Water Resources ................................................................................................. 86, 160, 1037
Sustainable Communities...................................................................................................................... 86, 169, 1037
Resource Conservation and Recovery Act (RCRA) ..... 44, 79, 136, 202, 262, 328, 349, 390, 393, 401, 406, 464, 465,
470, 471, 475, 476, 480, 628, 637, 768, 844, 845, 846, 848, 899, 988, 1015, 1040, 1045
Restore Land ............................................. 42, 47, 53, 471, 502, 619, 669, 674, 677, 683, 711, 716, 739, 768, 895, 976
Return on Investment ............................................................................................................................................. 608

S
Safe and Sustainable Water Resources ........................................................................ 40, 86, 159, 160, 165, 934, 1037
San Francisco Bay ........................................................................................................ 200, 293, 294, 295, 967, 1038
Sandy Supplemental .............................................................................................................................. 3, 4, 8, 11, 1045
Science Advisory Board .. 41, 130, 161, 162, 166, 172, 179, 182, 186, 202, 405, 419, 422, 522, 662, 990, 1007, 1039,
1057
Science Policy and Biotechnology ............................................................................................. 202, 462, 463, 1040
Security .... 20, 48, 95, 100, 119, 121, 123, 125, 126, 128, 140, 216, 239, 326, 327, 328, 330, 331, 332, 334, 337, 349,
356, 361, 382, 383, 405, 430, 570, 572, 579, 580, 582, 585, 619, 629, 631, 632, 658, 674, 706, 709, 946, 949,
950, 951, 972, 973, 975, 981, 985, 987, 991, 1009, 1010, 1019, 1020
Small Business Ombudsman ...................................................................................................... 201, 350, 351, 1039
Small Minority Business Assistance ................................................................................................... 201, 353, 1039
Smart Growth ................................................................................................................................ 47, 49, 413, 414, 543
Special Accounts..................................................................................................................................................... 607
Standards for Uranium and Thorium Mill Tailings ............................................................................................. 24, 561
State and Local Prevention and Preparedness ......................................................................... 48, 201, 356, 1039, 1057
State and Tribal Assistance Grants (STAG) ........ x, 371, 491, 498, 754, 815, 816, 820, 826, 830, 836, 838, 842, 1044
Stratospheric Ozone Domestic Programs ......................................................................................................................... 199, 236, 1037
Multilateral Fund ............................................................................................................................... 199, 240, 1037
Superfund Emergency Response and Removal ............................................................................................. 590, 669, 1043
Enforcement ...................................................................................................................................... 589, 606, 1042
EPA Emergency Preparedness ..................................................................................................... 590, 674, 1043
Federal Facilities .............................................................................................................................. 590, 677, 1043
Federal Facilities Enforcement ............................................................................................... 589, 610, 989, 1042
Remedial ........................................................................................................................................... 590, 683, 1043
Superfund Cleanup .................................................................................... 53, 590, 668, 669, 674, 677, 683, 684, 1043
Surface Water Protection .......... 203, 429, 508, 518, 524, 528, 536, 546, 550, 553, 787, 817, 823, 1041, 1057, 1058
Sustainable and Healthy Communities .. 58, 86, 153, 169, 172, 177, 589, 660, 662, 665, 700, 727, 730, 748, 749, 930,
1037, 1042, 1043, 1044
T
Taking Action on Climate Change and Improving Air Quality .................................................. 403, 408, 642, 943
Targeted Airshed Grants ...................................................................................................................... 754, 842, 1044
Toxic Substances Chemical Risk Management ................................................................................................................... 202, 1040
Chemical Risk Review and Reduction ................................................................................ 202, 485, 1040, 1057
Lead Risk Reduction Program ............................................................................................. 202, 497, 1040, 1057
Toxics Risk Review and Prevention ......................................................... 202, 481, 482, 485, 491, 497, 1040, 1047
Trade and Governance ........................................................................................................................ 201, 377, 1039
TRI / Right to Know ..................................................................................................................... 201, 362, 1039, 1057
Tribal - Capacity Building ........................................................................................................... 201, 365, 1039, 1057
U
Underground Storage Tanks ...................................................................................................................................... 702
Underground Storage Tanks (LUST / UST) .................... 203, 501, 502, 699, 700, 710, 711, 716, 720, 1040, 1043
US Mexico Border ........ 201, 257, 265, 344, 370, 371, 439, 469, 547, 602, 838, 839, 840, 889, 972, 973, 1021, 1039
Utilities ................................................................................................................................ 37, 120, 125, 823, 953, 955
W
Waste Management ................................................................................................................................................... 975
Water
Ecosystems ......................................................................................................................................................... 506
Human Health Protection .......................................................... 87, 188, 189, 203, 515, 516, 518, 1037, 1040, 1041

Water Quality ........................................................................................................................... 309, 310, 956, 963, 964
Water Quality Monitoring ....................................................................................................................... 309, 310, 959
Water Quality Protection .............................................................. 203, 309, 310, 311, 530, 531, 536, 541, 552, 1041
Water Quality Research and Support Grants ................................................................... 87, 193, 203, 565, 1037, 1041
Wetlands 28, 35, 161, 203, 287, 293, 309, 311, 317, 509, 510, 512, 513, 784, 814, 876, 877, 962, 1019, 1021, 1026,
1040, 1057
Working Capital Fund ........................................................................................................... 218, 234, 428, 708, 1016