fiscal transfers a curse or blessing? evidence of their...
TRANSCRIPT

International Studies Program
Working Paper 10-30
October 2010
Fiscal Transfers a Curse or Blessing?
Evidence of Their Effect on Tax Effort
for Municipalities in Sinaloa, Mexico
Gustavo Canavire-Bacarreza
Nicolás Guadalupe Zúñiga Espinoza


International Studies Program
Andrew Young School of Policy Studies
Georgia State University
Atlanta, Georgia 30303
United States of America
Phone: (404) 651-1144
Fax: (404) 651-4449
Email: [email protected]
Internet: http://isp-aysps.gsu.edu
Copyright 2006, the Andrew Young School of Policy Studies, Georgia State University. No part
of the material protected by this copyright notice may be reproduced or utilized in any form or by
any means without prior written permission from the copyright owner.
International Studies Program Working Paper 10-30
Fiscal Transfers a Curse or Blessing? Evidence of Their Effect on Tax Effort for Municipalities in Sinaloa, Mexico Gustavo Canavire-Bacarreza Nicolás Guadalupe Zúñiga Espinoza October 2010

International Studies Program Andrew Young School of Policy Studies The Andrew Young School of Policy Studies was established at Georgia State University with the objective of promoting excellence in the design, implementation, and evaluation of public policy. In addition to two academic departments (economics and public administration), the Andrew Young School houses seven leading research centers and policy programs, including the International Studies Program. The mission of the International Studies Program is to provide academic and professional training, applied research, and technical assistance in support of sound public policy and sustainable economic growth in developing and transitional economies. The International Studies Program at the Andrew Young School of Policy Studies is recognized worldwide for its efforts in support of economic and public policy reforms through technical assistance and training around the world. This reputation has been built serving a diverse client base, including the World Bank, the U.S. Agency for International Development (USAID), the United Nations Development Programme (UNDP), finance ministries, government organizations, legislative bodies and private sector institutions. The success of the International Studies Program reflects the breadth and depth of the in-house technical expertise that the International Studies Program can draw upon. The Andrew Young School's faculty are leading experts in economics and public policy and have authored books, published in major academic and technical journals, and have extensive experience in designing and implementing technical assistance and training programs. Andrew Young School faculty have been active in policy reform in over 40countries around the world. Our technical assistance strategy is not to merely provide technical prescriptions for policy reform, but to engage in a collaborative effort with the host government and donor agency to identify and analyze the issues at hand, arrive at policy solutions and implement reforms. The International Studies Program specializes in four broad policy areas: Fiscal policy, including tax reforms, public expenditure reviews, tax administration reform Fiscal decentralization, including fiscal decentralization reforms, design of intergovernmental
transfer systems, urban government finance Budgeting and fiscal management, including local government budgeting, performance-
based budgeting, capital budgeting, multi-year budgeting Economic analysis and revenue forecasting, including micro-simulation, time series
forecasting, For more information about our technical assistance activities and training programs, please visit our website at http://isp-aysps.gsu.edu or contact us by email at [email protected].

Fiscal Transfers a Curse or Blessing? Evidence of Their Effect on Tax Effort for Municipalities in Sinaloa, Mexico *
Gustavo Canavire-Bacarreza Georgia State University and IZA
Nicolás Guadalupe Zúñiga Espinoza
Universidad Autónoma de Sinaloa
Abstract
This article studies the impact of vertical fiscal transfers on local tax effort in Mexico,
considering evidence for municipalities in Sinaloa between 1993 and 2008. Based on
cadastral information, gross added value and property taxes we create a ―pure‖ indicator of
fiscal effort which is used to analyze the effect of conditional and unconditional transfers on
this indicator. We employ econometric techniques such as panel data and the Arellano Bond
method to correct endogeneity. The results show that conditional transfers, which began in
1998, have generated laziness towards property tax collection, negatively affecting the fiscal
effort, even after controlling for demographic factors, population and the index of exclusion.
JEL Code: H71, H77, O16
Key words: transfers, fiscal equality, tax effort, property taxes, Mexico, Sinaloa.
* We thank Jorge Martinez-Vazquez and Marcela Astudillo for their comments; as well as the excellent collaboration of Fernando Rios-Avila. Usual disclaimer applies.

1
1. Introduction.
Mexico has been one of the countries with the lowest tax collection, in the last eight years it has represented only 9.4 percent of the
gross domestic product, while the average in Latin America has been the 15% percent. (Astudillo. 2009:4).
Fiscal imbalances are a fundamental topic for Latin American countries due to the existing asymmetries not
only in the local revenues, but also in the expenditure side. In this sense, vertical transfers are one of the
principal instruments governments use to correct these imbalances. Despite the positive influence that
transfers have, naturally, they also have a moral hazard component, given that they can generate ―negative‖
reactions from the sub-national governments in terms of fiscal laziness, which in case can be translated in
lower fiscal effort.
We examine the effects of transfers on the tax effort of local tax collection, specifically for the case of
property tax and total local tax revenue of municipalities in Sinaloa, a state located in the northwest of
Mexico.
This article provides an important contribution to the literature, given the new evidence for the worldwide
debate regarding fiscal decentralization.1 In particular, we attempt to answer the following questions: What is
the impact of conditional and unconditional federal transfers2 on municipalities’ tax efforts? Are federal
transfers responsible for the negative impact on the tax efforts of Sinaloa’s municipalities?
In México, the literature regarding local fiscal efforts is limited and has different problems, particularly with
respect to its estimation and information availability. The most important studies were those regarding the
state of Puebla by Raich (2002), who used descriptive statistics, or those by Sour (2007) and Moreno (2003),
who used econometric tools to measure the performance Mexican municipalities. This study tries to fill the
existing gap in the literature by using unique official information for the state of Sinaloa and the
implementation of robust and consistent econometric techniques.
To study the impact of federal transfers on the tax effort in Sinaloa municipalities, we use information for 18
municipalities in Sinaloa between 1993 and 2008. To evaluate our research questions, we apply econometric
techniques for static and dynamic data panel. We correct for potential endogeneity problems by using
generalized method of moments (GMM) estimation (Arellano and Bond, 1991). The results show that the
conditional transfers implemented since 1998 have generated laziness in collecting property taxes, negatively
1 The concept of local or sub-national governments in this article refers to municipalities. 2 The conditional transfers in this country are also known as federal contribution or branch 33, while the unconditional transfers are called federal participations or branch 28.

2
affecting the fiscal effort. We also find evidence that fiscal effort is also negatively affected for demographic
factors such as population and the exclusion index.
The rest of this paper is structured as follows: Section 2 presents a review of the literature regarding fiscal
imbalances, tax effort and transfers. Section 3 describes the transfer systems and fiscal efforts in México and
Sinaloa. Section 4 describes the empirical strategy and the information used in it, Section 5 presents the main
results and Section 6 is the conclusion.
2. - Fiscal imbalances, tax effort and transfers: A short review of literature.
The concepts of tax effort, fiscal imbalances and transfers are subjects that have been analyzed by classic
authors as well as contemporaneous ones. In this section each one of these concepts is discussed.
The tax effort or fiscal effort3 is one of the main instruments used by central governments to distribute
transfers in order to correct fiscal imbalances (verticals and horizontals). Although the theoretical concept is
relatively clear, the empirical definition of fiscal effort is not completely uniform. The definition of tax effort
goes back to authors such as Frank (1959), who defines it as the tax burden (ratio of public revenue in
relation to gross domestic product) on a proxy for a territory’s ability to pay (ratio of the gross domestic
product in relation to population). Bhal (1971) defines it as the degree to which a country uses its tax capacity
(the quotient of the ratio of collected public revenue on fiscal capacity4).
Perhaps one of the most used concepts in the literature is the one presented by the "Advisory Commission of
Intergovernmental Relationship" (ACIR) (1986), who estimate tax effort based on the implementation of the
national tax burden on the gross domestic product of the state or local level.5
The measurement of tax effort in Mexico is not a new topic6. Sobarzo (2003) calculates the effective tax rate
for each state for each tax; in other words, the ratio between the tax collection and the value of the tax base.
While this methodology is quite attractive, it is not necessarily correct if one wants to measure tax effort as
defined in Frank (1959) or Bahl (1971). Other documents such as those presented by Sour (2007), Moreno
3 In this investigation the terms tax effort and fiscal effort mean the same thing, because there is no literature on the topic to the municipality government in Mexico, it was necessary to do an empirical study for the local governments of Sinaloa. 4 The fiscal capacity definition is not uniform either; Boex and Martinez-Vasquez (1997) establish six ways to define fiscal capacity: fiscal collection in a base year; income per capita, gross regional product, total sources subject to taxes, representative tax system, and representative tax system using a regression analysis. 5 Vaillancourt and Bird (2007) explain that the tax capacity of sub-national governments depends on the tax base and the geographical distribution of that base. 6 Sobarzo (2003) and e Ibarra (2005) estimate the federal entity level of Mexican states.
3
(2003), Raich (2004) and Aguilar (2009) examine the tax effort of municipalities, using different
methodologies.
However, they have struggled finding some variables, such as the municipal gross domestic product, and
have decided to use other alternatives, which are in some cases theoretically incorrect.
It should also be noted that several authors have studied the determinants of tax effort7, taking into account
such factors as the economic, cultural and institutional aspects, among others.
Fiscal imbalances8 are problems that arise within intergovernmental fiscal systems of countries. Because of
this, it is necessary to promote fiscal equalization through transfers. The mechanisms of fiscal equalization
transfers are essential to encourage reforms related to the finances of local governments around the world.
Tax imbalances are generated by two main reasons: i) regional or local governments have different fiscal
capacities and abilities to increase revenues, and thus make different efforts to manage them, and ii) local
governments can have different spending needs (Boex and Martinez-Vazquez (2007)).
While there are different types of transfers, there is agreement in the literature to classify them as conditional
and unconditional. As noted by Rosen (2008), in the case of conditional transfers, it is the central government
who specifies the purposes for which the recipient government must use these funds, while in the case of
unconditional public funds, also called revenue sharing funds, local governments have the freedom to decide
how the funds are used. As suggested by Searle and Martinez-Vazquez (2007), the difference between
conditional and unconditional transfers is that for the former, local governments have the obligation to
employ it to perform the work or service to which it is intended, while in the case of unconditional transfers,
the local government can spend it regardless of local revenues or collected taxes from the residents of their
jurisdiction.
Prud 'Homme (2007) argues that the transfers are necessary to correct vertical imbalances and some
horizontal imbalances.
7 Gupta (2007) uses variables on agriculture, debts and juridical security, openness, international aid, political and economic stability; Piancastelli (2001) considers cultural factors, institutional and legal restrictions, imports and exports; Eltony (2002) collects information about the political system, government attitudes, quality or laziness of taxes administration, culture and traditions of population; while Bird, Martinez-Vasquez and Torgler (2004) use term information on tax collection, gross domestic product per capita, population grow rate, openness, government quality, political stability, good regulation; indicator on the rule of law. In México Sobarzo (2003); Ibarra (2005); Sour (2007); Raich (2004); Moreno (2003); and Aguilar (2009) presents similar determinants. 8 According to Bird and Vaillancourt (2007) there exist vertical and horizontal fiscal imbalances; the first happens when there is a limited capacity of sub national governments respect to their expenditure responsibilities; the second is observed when there is a wide difference on the economic structure between the local governments. Thus, the differences in their fiscal capacity.

4
He also adds that this should not be the main function of these resources, but that their main objective is to
promote local economic development and income distribution between jurisdictions, and not merely the
provision of public services.
Given that the objective of transfers is fiscal equalization, it is necessary to determine what the distribution
criteria are9. In this sense, Figure 1 shows the different criteria generally used, which are: spending needs and
the tax effort that local governments make to improve tax collection or fiscal capacity of a region. There are
other subjective criteria, which would be harder not to have a reference to distribute these public funds.
Diagram 1 Criterion to distribute equality transfers.
Expenditure Needs
Tax Effort
Equalization Transfers
Fiscal Capacity
Subjective Criterion
Source : Authors
3. The transfer system and fiscal effort in Mexico
Fiscal centralization of revenue collection by the federal government started in Mexico since 1980 and has
prompted states and municipalities to be more dependent on conditional and unconditional transfers. Three
decades after the beginning of the National System of Fiscal Coordination10, the need to strengthen fiscal
decentralization for various purposes has been raised, but it is most fundamental to reduce the vertical
imbalance between own-revenue and public expenditure of municipalities. Like other nations around the
world, there are two types of transfers, conditional and unconditional, also known as branch 33 and branch
28, respectively.
The main objective of unconditional transfers is to return to states and municipalities a portion of revenues
from taxes and duties that were not received. This function is the responsibility of the federal government.
9 We follow Bird and Vaillancourt (2007) classification. 10 The National System of Fiscal Coordination is an agreement that started in Mexico in 1980 between the three government levels in order to assign the tax burden charge. This tributary charge was mostly concentrated in the federal government of Mexico.
5
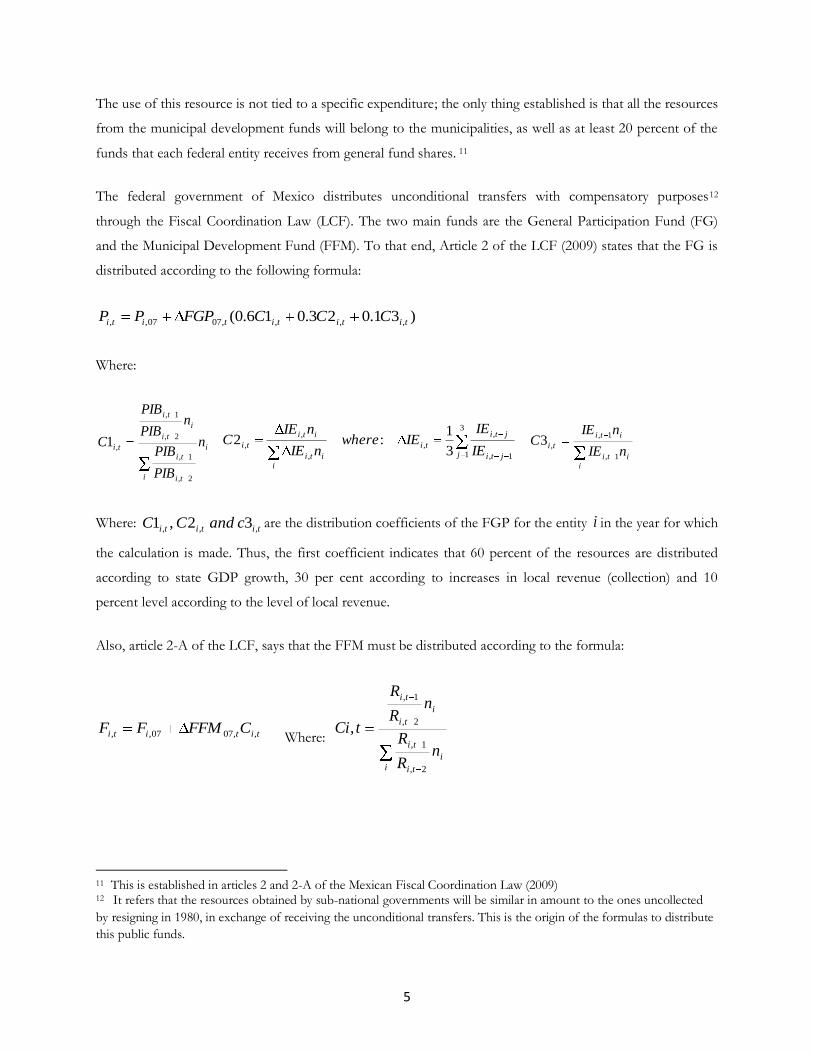
The use of this resource is not tied to a specific expenditure; the only thing established is that all the resources
from the municipal development funds will belong to the municipalities, as well as at least 20 percent of the
funds that each federal entity receives from general fund shares. 11
The federal government of Mexico distributes unconditional transfers with compensatory purposes12
through the Fiscal Coordination Law (LCF). The two main funds are the General Participation Fund (FG)
and the Municipal Development Fund (FFM). To that end, Article 2 of the LCF (2009) states that the FG is
distributed according to the following formula:
)31.023.016.0( ,,,,0707,, tititititi CCCFGPPP
Where:
i
ti
ti
i
i
ti
ti
ti n
PIB
PIB
nPIB
PIB
C
2,
1,
2,
1,
,1
1,
,3
1,
,
,
,3
1:2
jti
jti
jti
itii
iti
tiIE
IEIEwhere
nIE
nIEC
iti
i
iti
tinIE
nIEC
1,
1,
,3
Where: tititi candCC ,,, 32,1 are the distribution coefficients of the FGP for the entity i in the year for which
the calculation is made. Thus, the first coefficient indicates that 60 percent of the resources are distributed
according to state GDP growth, 30 per cent according to increases in local revenue (collection) and 10
percent level according to the level of local revenue.
Also, article 2-A of the LCF, says that the FFM must be distributed according to the formula:
tititi CFFMFF ,,0707,, Where:
i
ti
ti
i
i
ti
ti
nR
R
nR
R
tCi
2,
1,
2,
1,
,
11 This is established in articles 2 and 2-A of the Mexican Fiscal Coordination Law (2009) 12 It refers that the resources obtained by sub-national governments will be similar in amount to the ones uncollected
by resigning in 1980, in exchange of receiving the unconditional transfers. This is the origin of the formulas to distribute
this public funds.
6
tiC , is the distribution coefficient of the FFM of the entity i for the year in which the calculation is made.
This resource is distributed according to the collection property taxes and water rights registered in the
municipalities.
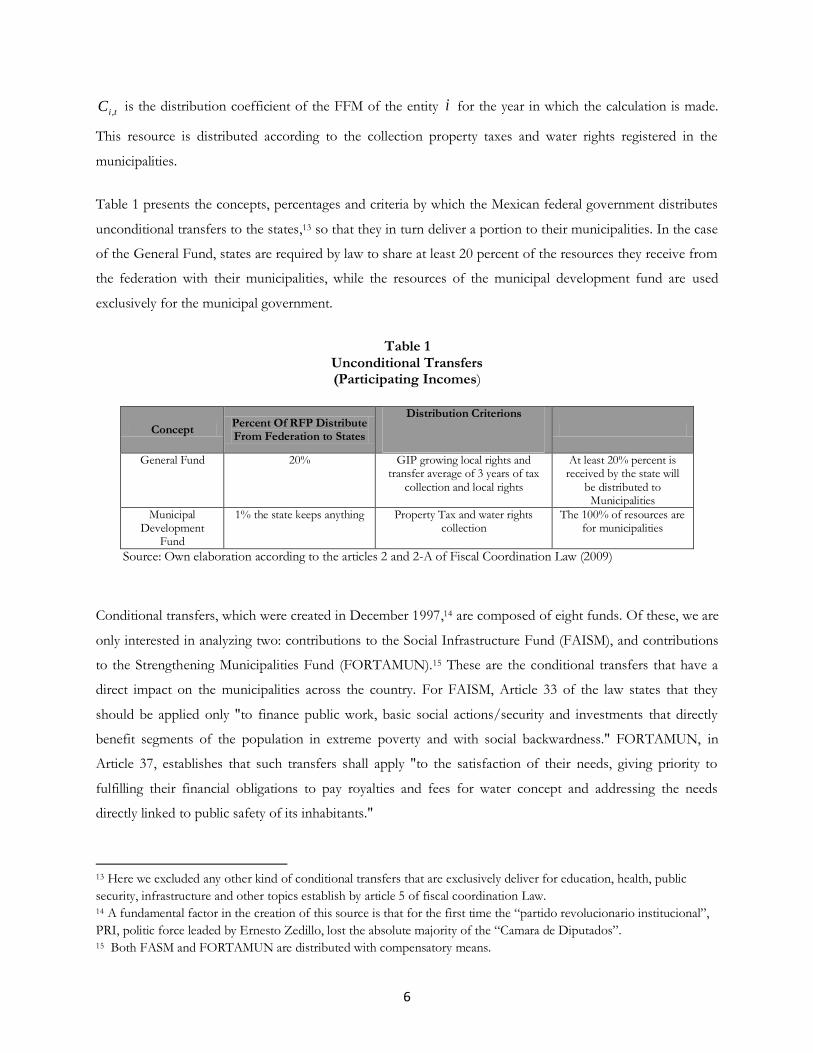
Table 1 presents the concepts, percentages and criteria by which the Mexican federal government distributes
unconditional transfers to the states,13 so that they in turn deliver a portion to their municipalities. In the case
of the General Fund, states are required by law to share at least 20 percent of the resources they receive from
the federation with their municipalities, while the resources of the municipal development fund are used
exclusively for the municipal government.
Table 1 Unconditional Transfers (Participating Incomes)
Concept Percent Of RFP Distribute From Federation to States
Distribution Criterions
General Fund 20% GIP growing local rights and transfer average of 3 years of tax
collection and local rights
At least 20% percent is received by the state will
be distributed to Municipalities
Municipal Development
Fund
1% the state keeps anything Property Tax and water rights collection
The 100% of resources are for municipalities
Source: Own elaboration according to the articles 2 and 2-A of Fiscal Coordination Law (2009)
Conditional transfers, which were created in December 1997,14 are composed of eight funds. Of these, we are
only interested in analyzing two: contributions to the Social Infrastructure Fund (FAISM), and contributions
to the Strengthening Municipalities Fund (FORTAMUN).15 These are the conditional transfers that have a
direct impact on the municipalities across the country. For FAISM, Article 33 of the law states that they
should be applied only "to finance public work, basic social actions/security and investments that directly
benefit segments of the population in extreme poverty and with social backwardness." FORTAMUN, in
Article 37, establishes that such transfers shall apply "to the satisfaction of their needs, giving priority to
fulfilling their financial obligations to pay royalties and fees for water concept and addressing the needs
directly linked to public safety of its inhabitants."
13 Here we excluded any other kind of conditional transfers that are exclusively deliver for education, health, public
security, infrastructure and other topics establish by article 5 of fiscal coordination Law. 14 A fundamental factor in the creation of this source is that for the first time the ―partido revolucionario institucional‖,
PRI, politic force leaded by Ernesto Zedillo, lost the absolute majority of the ―Camara de Diputados‖. 15 Both FASM and FORTAMUN are distributed with compensatory means.

7
In Table 2, criteria and percentages are observed regarding RFP. These have been used to assign conditional
transfers to municipalities since January 1998.
Table 2 Conditioned Transfers (Non Central Expense)
Concept Percentage of RFP distributed by
Federations Distribution Criterions
FAISM 0.303 % State 2.197 % Communities
Income person home Education average level
Housing space Drainage disposable
Electricity – cooking combustible
FORTAMUN 2.35 % Municipalities 0.2123 % Federal District
Population
Source: Own elaboration enclosing articles 32 and 36 of Coordination Fiscal Law (2009)
In the state of Sinaloa, the State Fiscal Coordination Law was created in 1990. It established the criteria and
basis for distributing these public resources to the 18 local public finances. Neither Sinaloa nor its
municipalities receive any unconditional transfers of the additional revenue from oil extraction. Only the
states of Campeche, Tabasco and Veracruz participate in these resources as well as resources from the
hydrocarbon extraction fund. As noted, these funds are linked to the oil industry.
Mexican municipal treasuries, and specifically those of Sinaloa, have a vertical fiscal imbalance because the
local taxes and revenues collected, in general, are insufficient to meet their current expenditure and
investment responsibilities. For example, in 2009, the Mexican federal government experienced a drop in the
shared federal revenue,16 which worsened the vertical gaps of the municipalities, who received fewer
resources in the category of unconditional transfers. Cabrero (2006) shows that while sub-national17 spending
represents 38.6 percent, the revenue collected by local governments is only 8 percent of that total spending.
Regarding fiscal effort estimates from empirical studies on the municipal level, Moreno (2003) indicates that
transfers have generated a fiscal substitution effect (crowding-out effect). In other words, local governments
prefer to be financed by federal funds instead of increasing their own income, resulting in a reduction of fiscal
effort. However, Sour (2007) argues that the conditional and unconditional transfers have reduced the fiscal
effort of Mexican municipalities. Raich (2004) takes as its object of study municipalities of Puebla from 1993
to 2000, and evaluates the impact of FAISM transfers on the collection of water rights and property taxes.
16 The shared federal collection is determined by article two the Fiscal Federal Coordination Law, and includes
resources obtained by the Mexican government for all their taxes as well as for the rights to oil extraction and mining,
but minus the total returns for the same. 17 Sub-national expenditure referred to by the authors is related to the expenditures of states and municipalities in
Mexico.

8
Finally, Aguilar (2009), through an adaptation of the methodology developed by Battese and Coelli (1991)
that estimates agricultural production functions, estimates the tax capacity of the largest three hundred
municipalities in the country.
While it is true that the works of Sour (2007), Moreno (2003), Raich (2004), and Aguilar (2009) apply
consistent methodologies and reach important conclusions, they also show some vulnerability as they lack a
rigorous estimation of their models. For instance, the first author only uses five variables- three independent
variables which are total municipal revenues, conditional transfers and unconditional transfers; the other two
variables, the municipal GDP and own income, are used to create the dependent. The author defines the
latter concept as "the sum of taxes, fees, goods and exploitation."18 It is necessary to clarify that fees,
products and exploitation, under Mexican tax law, are not tax revenues. Only taxes can be considered in this
category. Raich (2004) mentions that "[with respect to] the measurement of own revenue collection, several
international studies focus only on the analysis of tax revenues, especially in the property tax." Moreover, he
argues, "there are important theoretical differences between taxes and fees."
Unlike previous authors, this research makes more robust econometric estimations of tax effort and
moreover, there is a better definition of that term, since as suggested by Raich (2004), only collection of taxes
and property taxes is considered. For this article, the hypothesis to be tested is that vertical transfers have
affected the local tax effort, taking as evidence the municipalities in the state of Sinaloa in the period 1993 to
2008. In this way, we collect data such as cadastral value, gross value added and property taxes, which are
used to estimate a "pure" indicator of tax effort. In addition, applying econometric techniques, we will
examine the effect of conditional and unconditional transfers on this indicator.
4.- Methodology and empirical strategy
The first obstacle or difficulty to elaborate about was that there is no literature that has studied the tax effort
of municipalities in Mexico; moreover, there was no available information for extended periods of study.
Unlike other investigations at the municipal level, our contribution to the literature of local finances is an
alternative measurement of the fiscal effort through the collection of taxes, excluding other sources of
municipal revenue for concepts of goods, fees and use established in the municipal finance law of the state of
18 In this article Municipality’s tax incomes are the ones generated by charging taxes; that is why we exclude the other
income sources as rights, products and uses.
9
Sinaloa19. In this sense, an additional contribution to this investigation is the measurement of the fiscal effort
using information on municipalities’ property taxes.
While the documents examined show interesting results and methodologies, the main weaknesses of previous
work are the lack of a rigorous econometric estimation and a proper definition of tax effort. Thus, not only
does the methodology presented here provide better estimates than prior research in Mexico, it also improves
the definition and identification of the tax effort through taxation and property tax, with the purpose to
obtain a clearer measurement of the impact of transfers on it.
The database used consists of information about property taxes, transfers, municipal taxes20, gross domestic
product, GDP, value added production21, VACB, information collected from the System of Municipal Data
Base (SIMBAD) of the National Institute of Statistics and Geography and Informatics (INEGI). The
Municipal marginalization/exclusion index was obtained from the National Population Council (CONAPO),
while the historical table of the tax base of property tax was obtained from official information from the
Cadastral Institute of the State of Sinaloa. In addition, there is progress in relation to the work presented by
Sour (2007), Moreno (2002) and Aguilar (2009) with respect to obtaining new information that has not been
used before, such as the cadastral value by municipality territory, marginal/exclusion index, property taxes,
value added production and municipal taxes.
The information used consists of data from the 18 municipalities in Sinaloa for a period of 16 years with 10
variables.22 Unlike Aguilar (2009), we consider more than five years because tax effort, using techniques of
dynamic data panel, is better measured over time when you have a large database and the information is
affected by long-term institutional arrangements, such as the coordination of national fiscal system, which is
highlighted by Raich (2004). He states that "the quantitative studies of transfers and tax effort can help us
19Before it was mentioned that Sour (2007) measure this concept including all own income concepts, which introduces
some noise to the information. Raich (2005) also made that measure respect to property tax and water rights. He also
mentions that in reference to the own income collection, several international studies measures the fiscal effort
considering tax incomes, in particular property taxes. 20 The local taxes comprise the ones established by the municipality treasure law, and the incomes law of Sinaloa
municipalities. The statistical information considered the following six components: public shows taxes, non judiciary
sales, auctions, raffles, lotteries and allowed games, taxes on announces and commercial ads, property and land taxes,
mortgage taxes and urban development taxes. 21 GDP and VACCB, proxies for fiscal capacity, were taken from SIMBAD INEGI, by doing estimations for years
without information, because this information is only available every five years. The GDP (gross domestic product)
following: Sour(2007) was estimated as: pomum
pobest
pibestPIBM
were: pibest= is the GDP of the Sinaloa of the period,
pobest= is the Sinaloa State Population of the period pomum= is the municipality population in the period. 22 From all the variables shown, three of them have not been used in a period of 16 years. These are property values of
municipalities’ property tax, census gross added value and the index of margination.

10
better understand the structural and institutional characteristics of the fiscal decentralization policies in
Mexico."
In the tax effort and property tax effort models, their objective is to determine the impact generated by the
federal transfer on tax effort that municipalities in Sinaloa perform in order to obtain more revenues from
local taxes. In fact, the tax structure in Sinaloa has a small margin for raising revenues, which are low
compared to international standards.
The dependent variables used in the models23 FEFF, REVRAT and REVRAT-VACB were designed as
follow:
The fiscal effort to collect property taxes is defined as:
VC
RIP
it
it
Properties Counties of ValueProperty
CollectionTax Property EF
Where EF is the proportion of collected revenue for the concept of property taxes respect to the cadastral
value; RIP is the property tax collection; VC is the fiscal value of property value (proxy for the fiscal
capacity of this tax).
The tax effort relative to GDP will be defined as the following ratio:
PIBM
RIM
it
it
Product Domestic Grossty Municipali
Collection Taxes LocalREVRAT
Where REVRAT is the proportion of collected local taxes respect to the municipality gross domestic product;
RIM is the local collection tax; PIBM is the gross domestic product of the municipality.
Finally, tax effort is defined relative to the value added product as follows:
VACB
RIM
it
it
Valve Gross Added
Collection Taxes LocalVACB-REVRAT
23 The dependant and non dependant variables, with exception of population and the margination/exclusion index, are
express in 1993 constant prices. All variables are available between 1998 and 2008, since they were designed in 1997.

11
Where REVRAT-VACB is the proportion of collected local taxes respect to the value added production;
RIM is defined as above, and VACB is the census gross added value (proxy for the income per capita)
The levels of the tax effort of the municipalities can be represented as a function of several factors that
determine it. As part of this document, variables that are considered within these factors include the cadastral
value of the municipality (VC), the size of the municipality measured by its municipal population (POP),24 the
added value of local production (VA) and marginalization/exclusion index (IM).
In addition to these, the model also includes variables that show the conditional transfers level (TC) and
unconditional transfers (TI) that each municipality receives,25 constituting these core variables in our analysis.
In addition to the variables described, there can be other factors that capture additional features local and/or
random factors that affect the tax effort. For simplicity, these are considered as part of an unsystematic error
orthogonal to the explanatory variables.
Under these considerations, the model can be represented as follows:
For simplicity, if we assume that the functions F and G follow an exponential form, the models to be
estimated can be written in the following fashion:
Where W represents the explanatory variables (VC, POP, VA, IM) with the exception of transfers that are
included in logarithms. Under this specification, the coefficients b12 and b22 can be interpreted as elasticities
between EF and REVRAT with respect to changes in transfers.
In this case, assuming that W, log (TC) and log (IT) are orthogonal to the errors, and assuming that there is
no problem of endogeneity, omitted variables or specification problems, the coefficients "a" and "b" can be
estimated consistently using ordinary least squares (OLS). However, to properly estimate the effect of
24 The pibes and pobest were taken from INEGI and population projections by municipality from CONAPO.
25 The level of transferences is measured as a ratio respect to the total level of income declared by the municipality.
12
transfers from 1993 to 2008 and evaluate the introduction of the policy of conditional transfers of resources
to the municipalities since 1998, we estimate models 3 and 4 under the following specifications:
- Using both transfers sources together (TT = TC + TI) and not separately as shown in 3 and 4.
- Using only unconditional transfers.
- Using both types of transfers, but restricting the information to the years after the policy change.
- Using only conditional transfers, but also limiting the information to the years after the policy
change.
The problem with the specification above is that it does not consider that there may be specific characteristics
(unobserved heterogeneity) that can be correlated with the explanatory variables. If this is the case, the
estimates obtained using OLS would not be consistent and the coefficients would be biased because the
explanatory variables would be correlated with error, violating one of the main assumptions of OLS.
An alternative to solve this problem is to exploit the structure of the information, using panel data estimation
techniques to model these specific effects.
In this sense, models 3 and 4 can be estimated by breaking the error component , obtaining
the following specification:
Both models are estimated using random (EA) and fixed (EF) effects, considering the same specifications as
in the case of OLS. Although the fixed-effects estimation is always consistent, the estimation with random
effects, under certain conditions, can be consistent and efficient. Because of this feature, both EA and EF are
estimates and are compared using the Haussmann26 specification test.
An additional problem that may arise in estimating models 5 and 6 is that the level of transfers that
municipalities receive and the degree of property tax effort (EF) and tax effort (REVRAT) can be defined
26 The Hausman specification test is used to verify if there is any statistical difference between the EF and EA estimates.
Under the hypothesis of non-systematic differences, if this cannot be rejected, the model with RE is selected. If rejected,
the model with FE is preferred. More details in Wooldridge (2002).

13
simultaneously. This can cause problems of endogeneity, which in turn can cause the estimates to be
inconsistent and biased. This problem cannot be corrected using fixed effects. Under these conditions, it is
necessary to use the methodology developed by Arellano-Bond (1991) to deal with the potential risk of
endogeneity.
This methodology is based on a similar idea to the use of instrumental variables (IV). Instrumental variables
are those that are strongly correlated with variables that have a potential endogeneity problem, but are not
correlated with the dependent variable or the original model error. Under the assumption that these variables
can be found, they can be used to generate estimations of the variables with endogeneity problems
(instrumented) so they are no longer correlated with the error in the main model.
Because finding variables that meet both characteristics is empirically difficult, particularly in panel data, the
Arellano-Bond methodology proposes to use lagged values from those variables with potential endogeneity
problems as instruments of themselves. In the absence of serial autocorrelation, the lagged values of the
variables of interest would not be correlated with the original model errors and would be strongly correlated
with their predecessors.
In addition, the model is estimated using first differences in order to eliminate specific effects. In this case,
using this methodology, the basic specification of the model would be as follows:
Where Dep represents de dependent variable: EF and REVRAT
Given the structure of the errors, these models must be estimated using the Generalized Method of Moments
(GMM). For this methodology, we apply the same considerations as for the basic model.
5. Results
This research allows the construction of models which may possibly contribute to empirical studies
conducted in Mexico, because for the first time, the cadastral value of property tax is used for a 16-year series.
It was also necessary to create two proxy variables for fiscal capacity—VACB and GDP—as in this country
both sets of data are only generated every five years by the INEGI. For this reason, these two data sets were
estimated following the methodology applied by Sour (2007).

14
It is worth mentioning that property represents the largest component of municipal government tax revenue
collected in Mexico since 1983, not only in Sinaloa, but for every municipality in the country. It would have
been interesting to estimate this model from 1983 to 1997, but the unavailability of information limited this
analysis to the period 1993-2008. Given the nature of some of the variables involved, it was necessary to
separate the information into two periods27: from 1993 to 1998, since, at that time, municipalities received
only unconditional transfers, and from 1998 to 2008, when the conditional transfers started.
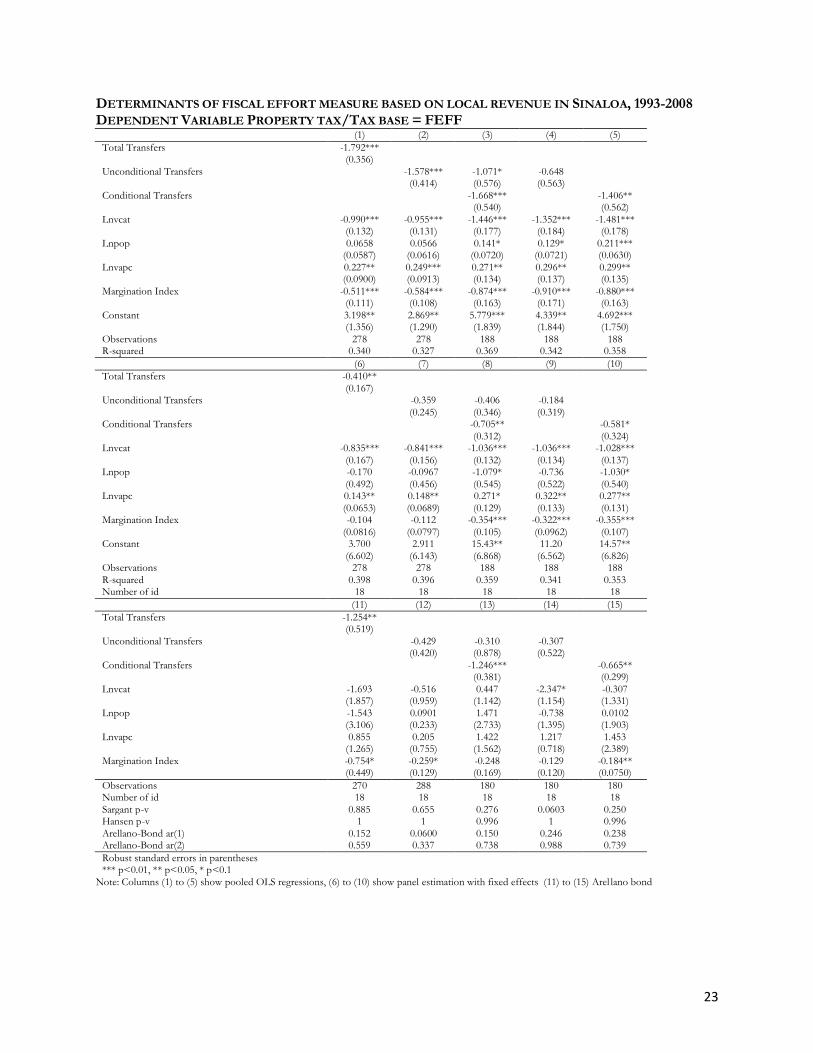
Table 3 presents the results of the determinants of property tax. Tables 4 and 5 present the results from
considering the measures of tax efforts with respect to GDP and VACB. Each of these Tables shows 15
different specifications.
The equations 1 to 5 are all estimated using OLS estimates, which do not consider the temporal
heterogeneity in the estimates. Columns 6 to 10 present the results of the regressions using panel fixed
effects28. Finally, given the potential endogeneity in the regression, as discussed in the methodological section,
columns 11 to 15 present the results using dynamic panel estimators following Arellano-Bond (1991).
Table 3
Determinants of property tax collection in Sinaloa between 1993-2008 (dependent variable: FEFF= property tax/ fiscal Base)
(1) (2) (3) (4) (5)
Total transfers -1.792***
(0.356)
Unconditional transfers
-1.578*** -1.071* -0.648
(0.414) (0.576) (0.563)
Conditional transfers
-1.668***
-1.406**
(0.540)
(0.562)
(6) (7) (8) (9) (10)
Total transfers -0.410**
(0.167)
Unconditional transfers
-0.359 -0.406 -0.184
(0.245) (0.346) (0.319)
Conditional transfers
-0.705**
-0.581*
(0.312)
(0.324)
(11) (12) (13) (14) (15)
Total transfers -1.254**
(0.519)
Unconditional transfers
-0.429 -0.310 -0.307
(0.420) (0.878) (0.522)
Conditional transfers
-1.246***
-0.665**
(0.381)
(0.299)
Robust standard errors in parentheses *** p<0.01, ** p<0.05, * p<0.1 Notes: columns(1) to (5) are pooled OLS, (6) to (10) fixed effects chart and (11) to (15) Arellano-Bond.
27 In this sense, the regressions of columns 1, 3, 6, 7, 8, 11, 12 and 13 from each chart correspond to information between 1998-2008 28 According to the Hausman Test, Panel fixed effects is the preferred model.

15
Results of the estimation29 show, in general, an ambiguous effect of population size. In most models, the
effect appears to be significant and positive, while in others it has negative coefficients. One possible
explanation for this result is that the effects of population size are nonlinear, and that different models are
capturing different sections of the nonlinearity. If the main effect is positive, it supports the hypothesis that
controlling income and collecting taxes are easier in municipalities with larger populations. Also, the larger a
municipality is, the greater the ability to control taxes.
Table 4 Determinants of property tax collection in Sinaloa between 1993-2008
(Dependent variable: REVRAT = total taxes/PIB proxy.) (1) (2) (3) (4) (5)
Total transfers -1.242***
(0.297)
Unconditional transfers
-1.176*** -0.966** -0.640
(0.370) (0.487) (0.487)
Conditional transfers
-1.282***
-1.045**
(0.417)
(0.440)
(6) (7) (8) (9) (10)
Total transfers -0.386***
(0.133)
Unconditional transfers
-0.506** -0.597* -0.493*
(0.233) (0.311) (0.249)
Conditional transfers
-0.330
-0.147
(0.296)
(0.237)
(11) (12) (13) (14) (15)
Total transfers -1.028*
(0.529)
Unconditional transfers
-0.766* -1.077 -0.950
(0.394) (0.710) (0.568)
Conditional transfers
-0.849***
-0.685*
(0.322)
(0.392)
Robust standard errors in parentheses *** p<0.01, ** p<0.05, * p<0.1
Notes: columns(1) to (5) are pooled OLS, (6) to (10) fixed effects chart and (11) to (15) Arellano-Bond.
In terms of value-added production, all models, except for the Arellano Bond models, show that its effect on
tax effort is positive and significant, with an estimated elasticity of approximately 0.3.
The exclusion index is a summary measure of nine socio-economic indicators30 that measures different forms
of social exclusion. It indicates the relative level of deprivation that large groups of the population suffer. A
higher index indicates greater social exclusion and poorer socioeconomic indicators. In this sense, all models
29 Full estimations of the models can be found in the appendixes. The tables only shows coefficients corresponding to transfers. 30 The nine indicators according to the National Population Advise (2005) are percents respecting population over 15
years old who are illiterate, population without primary education over 15 years, households without sanitary services,
household without electric services, without water or drains, with some levels of overcrowding, people living in houses
with ground floors, people leaving in localities with less than 5000 inhabitants, and working people earning less than two
minimum salaries.

16
predict that the higher the level of social exclusion in the municipality, the lower the ability of the municipality
to control taxes, which generates a lower tax effort.
Table 5 Determinants of property tax collection in Sinaloa between 1993-2008
(dependent variable: REVRAT-VACB = total taxes/gross added valve.) (1) (2) (3) (4) (5)
Total transfers -1.306***
(0.285)
Unconditional transfers
-1.151*** -0.941* -0.617
(0.358) (0.486) (0.484)
Conditional transfers
-1.276***
-1.045**
(0.417)
(0.442)
(6) (7) (8) (9) (10)
Total transfers -0.359**
(0.146)
Unconditional transfers
-0.448* -0.496* -0.403*
(0.225) (0.267) (0.213)
Conditional transfers
-0.297
-0.145
(0.276)
(0.232)
(11) (12) (13) (14) (15)
Total transfers -0.771*
(0.460)
Unconditional transfers
-0.541 -0.591 -0.709
(0.336) (0.574) (0.534)
Conditional transfers
-0.906***
-0.728*
(0.333)
(0.413)
Robust standard errors in parentheses *** p<0.01, ** p<0.05, * p<0.1
Notes: columns(1) to (5) are pooled OLS, (6) to (10) study effects chart and (11) to (15) Arellano-Bond.
The results show that the conditional and unconditional transfers have, in general, a negative impact on
municipalities’ tax effort municipalities.
The results in Columns 1, 6 and 11 of Tables 3, 4 and 5 show that from 1993 to 2008, total transfers had a
significant negative effect in terms of property tax effort and the tax effort. These results indicate that, to the
extent that municipalities in Sinaloa received higher percentages of federal revenues, these percentages
generated some kind of fiscal laziness. In other words, it was better to finance the needs of public spending
using total transfers than by using the public’s own taxes.
The fact that total transfers are in the negatives leads to the examination of independent effects of conditional
and unconditional transfers. As shown in Regressions 11 to 15, Tables 3, 4 and 5, once we corrected for
endogeneity through the estimator proposed by Arellano-Bond (1991), the marginal effect (elasticity) of the
transfers is negative, small and not significant for both samples. It should be noted that the estimated impact
of unconditional transfers is lower than that of the transfers as a whole. Looking at Columns 13 to 15, it can
be observed that the impact of conditional transfers is much deeper with respect to the reduction of tax

17
effort. In fact, the estimates show elasticities that are slightly more than twice of those for unconditional
transfers.
Finally, Columns 13 to 15 of Tables 3, 4 and 5 examine the simultaneous effects of the substitution between
unconditional and conditional transfers. These results confirm that the distribution of conditional transfers to
the municipalities of Sinaloa, through FORTAMUN and FAIS, have generated fiscal laziness in property tax
collection (as well as the collection of other taxes) in the municipalities of Sinaloa. Additionally, in this region
of Mexico, members of the legislature have been partially responsible for the negative effect on the collection
of such taxes. This is because they approved the lower fees, rates and taxable bases starting in 1998, the same
year when the conditional transfers were first distributed.
It is worth noting that when random fixed effects are considered, the estimated elasticities are much smaller
than in the ordinary least squares. Nevertheless, the same patterns regarding the magnitude of the impact of
transfers can be observed, although less significant. Also, when the models are corrected considering Arellano
Bond methodology, the elasticities are slightly higher than those found using fixed and random effects.
Thus, the results, as a whole, indicate the existence of laziness to raise property taxes because Mexican
municipalities, and in particular municipalities in Sinaloa, have received conditional transfers since 1998. Also,
in the case of tax effort, the estimates of the forth model are also consistent with the hypothesis of Sour
(2007) in the sense that federal transfers discourage the collection of local taxes, although the effect is not
significant. In this same model, the explanatory variables, population and municipal taxes, have positive
effects, particularly this last variable that is significant at 1 percent of confidence.
The positive and negative findings in this article shall be taken into consideration in future research, to
determine more accurately the impact generated by the transfers on the tax effort of the municipalities. The
tax structure of the municipalities of Sinaloa gives little scope for the collection of own resources. Relevant
aspects such as the structures of tax bases and administrative practices limit municipalities to collect or raise
fiscal resources according to their economic potential.
6 . Conclusions:
The main goal of this paper is to estimate the impact of transfers on local tax effort in Mexico, considering
the evidence on tax collection for the period 1993-2008 in the municipalities of the state of Sinaloa. The
estimates were made by understanding the determinants that stimulate or affect the tax effort as well as
affecting the effort to raise property tax.
18
The use of econometric models for panel data showed that the transfers have adversely affected the tax
effort. In line with Moreno (2003), one explanation that can be mentioned regarding this inverse relationship
is that local governments prefer to finance their budgets using transfers rather than bear the political cost of
raising taxes. Moreover, in line with Morales (2006), the negative impact of conditional transfers is due to the
high dependency that these resources have created for local governments.
One situation that cannot be overlooked is that, despite the fact that variables measuring the level of
marginalization, population, cadastral values, gross domestic product, census gross value added, conditional
and unconditional transfers were included, there could be other factors that affect or stimulate the tax effort
of both general taxes as well as the fiscal effort on the collection of property taxes. Among them, we can
mention the transparency or opacity in which the public expenditure is implemented, and the quality or
negligence of the public services that is provided to citizens. In fact, because of the way local taxes are
collected and how public services are offered are usually uncorrelated, it is a situation that discourages citizens
to meet their fiscal obligations.
Thinking about institutional variables that can be used to measure the accountability and enforcement,
proposed by Bird, Martinez-Vazquez and Torgler (2004), is just a blossoming field in Mexico, so no
information is systematized. Developing countries usually have limited high-quality statistical information,
something that is not a problem for developed nations. This situation put us at a disadvantage in the context
of the frontier of knowledge, to design panel data econometric models that applied to our empirical study.
For these reasons, the proposed methodology was designed subject to the data availability, and the design of
the variables that were used in the model of tax effort of the municipalities.
We conclude that in Mexico, unlike Brazil and Colombia, there is a high level of compliance with the
municipal tax liability. Applying the same kind of tax as applied to property taxes in different countries shows
different results. In provinces such as Alberta, Canada, most of the public expenditure budget exercise comes
from local tax collection, while in countries like Mexico, vertical imbalances of sub-national governments, to
which Bird and Wallace (2007) have been referring, must be supported by central government transfers.
Aztec municipalities, particularly the Sinaloa, have weak institutions for the collection of taxes, a situation that
adversely impacts the provision of public services. This necessarily raises the need to strengthen their tax
systems.
If the municipalities of Sinaloa had more efficient tax systems, they would be able to reduce their vertical
fiscal gap and would have more opportunities to provide better public goods and services to their citizens.
No wonder Oates (1972) stated that the benefits of fiscal decentralization should bring welfare for people
who have a closer government.
19
References:
Aguilar Gutiérrez Genaro (2009). Modelos Econométricos y Capacidad Tributaria Municipal en México: ¿Pueden los Municipios de México recaudar más? Revista Finanzas Públicas, Volumen 1, Número 1, Primer Semestre, pp. 15-48.Centro de estudios de las finanzas públicas, cámara de diputados.
Advisory Commission of Intergovernmental Relations (1986). Measuring State Fiscal Capacity: Alternative Methods and Others Uses. Information Report. Washington.
Arellano, M y S. Bond (1991). ―Some Tests of Specification for Panel Data: Monte Carlo. Evidence and an Application to Employment Equations‖. Review of Economics Studies, Vol 58, pp 277-297
Arellano M. (2003). Panel Data Econometrics (Advanced Texts in Econometrics). Oxford Press.
Astudillo Moya Marcela (2009) conceptos básicos del federalismo fiscal en México. Universidad Nacional Autónoma de México.
Battese, G.E., Coelli, T.J. (1991). Frontier Production Functions, technical efficiency and panel data: with application to farmers in Indian, Armidale: University of New England/Department of Econometrics, Working Paper in Applied Statistics.
Bell Michael, David Brunori and Joan Youngman (2009). Erosion of the Property Tax Base: Trends, Causes and Consequences. Lincoln Institute of Land Policy. Cambridge, Ma, United States of America.
Bhal Roy, W (1971). A Regression Approach to Tax Effort and Tax Ratio Analysis. International Monetary Fund, Staff Papers, 18(3), 570-612
Bhal Roy (2008) El Impuesto al Suelo Frente al Impuesto a la Propiedad en Países en Vía de Desarrollo y en Transición. Lincoln Institute of Land Policy. Programa para América Latina. Estados Unidos.
Bhal Roy and Martinez-Vazquez Jorge (2008). The Property Tax in Practice. In Making the Property Tax Work. Experiences in Developing and Transitional Countries. Bhal Roy, Jorge Martinez-Vazquez and Joan Youngman. Eds. Lincoln Institute of Land Policy
Bhal Roy and Sally Wallace (2007). Intergovernmental Transfers: the Vertical Sharing Dimension. In Fiscal Equalization. Challenges in the Design of Intergovernmental Transfers. Martinez-Vazquez Jorge y Bob Searle, eds., Springer.
Bird Richard and Francois Vaillancourt (2007) Expenditure-Based Equalization Transfers. In Fiscal Equalization. Challenges in the Design of Intergovernmental Transfers. Martinez-Vazquez Jorge y Bob Searle, eds., Springer.
Bird Richard M. Jorge Martinez –Vazquez and Benno Torgler (2004). Societal Institutions and Tax Effort in Developing Countries. Center for Research in Economics, Managament and the Arts. United States of America.
Blöchliger Hansjörg and Oliver Petzold. 2009. Impuestos y Transferencias de Fondos: sobre la Composición de los Ingresos de los Gobiernos Subcentrales. Red de Relaciones Fiscales de la OCDE
Boex Jameson and Jorge Martinez-Vazquez (2007). Design Intergovernmental Equalization Transfers with Imperfect Data: Concepts, Practices and Lessons. In Fiscal Equalization. Challenges in the Design of Intergovernmental Transfers. Martinez-Vazquez Jorge y Bob Searle, eds., Springer.
Brown L. Robert (2005) Optimización de los Sistemas de Impuesto a la Propiedad Inmobiliaria en América Latina. En Conferencia Internacional de Impuestos Inmobiliarios, Instituto para el Desarrollo Técnico de las Haciendas Públicas, Guadalajara, Jalisco, México, Verano 2005

20
Cabrero Mendoza Enrique (2004) Capacidades Institucionales en Gobiernos Sub-nacionales de México. Revista Gestión y Política Pública, Volumen XIII, número 3, segundo semestre, Centro de Investigación y Docencia Económicas, México.
Cabrero Mendoza Enrique (2006) Los Retos Institucionales de la Descentralización Fiscal en América Latina. Revista del CLAD Reforma y Democracia. No. 34, febrero 2006
De Cesare Claudia M. (2002). Impuesto a la Propiedad: los Retos que enfrentan los Países Latinoamericanos. Seminario Internacional sobre Contribuciones Inmobiliarias y el Catastro, Instituto para el Desarrollo Técnico de las Haciendas Públicas, México.
Decreto No. 419 que establece los Valores Unitarios del Suelo y de las Construcciones del Municipio de Choix, publicado en el Periódico Oficial ―El Estado de Sinaloa‖ No. 155, del 23 de diciembre del 2009.
Eltony Nagy M. (September 2002). The Determinants of Tax Effort in Arab Countries. Arab Planning Institute Kuwait.
Fernández Cintia Estefanía (2005). El Desarrollo de los Municipios Latinoamericanos Mediante la Aplicación de la Norma de Tributación Inmobiliaria. Educación a Distancia, Programa para América Latina y El Caribe. Lincoln Institute of Land Policy.
Finot Iván (2005). Descentralización, Transferencias Territoriales y Desarrollo Local. Instituto Latinoamericano y del Caribe de Planificación Económica y Social.
Frank, J.L. (June 1959). Measuring State Tax Burden. National Tax Journal. National Association.
Fisher Ronald C. (2009). What Makers Should Know About Property Tax. In Land Lines, January 2009, Lincoln Institute of Land Policy
Gupta Abhijit Sen (2007). Determinants of Tax Revenue Efforts in Developing Countries. Working Paper No. 07/184. Washington DC, International Monetary Fund
Herrero Alcalde Ana y Martínez-Vázquez Jorge (2007). La Nivelación en el Marco de las Comunidades Autónomas. Papeles de Trabajo del Instituto de Estudios Fiscales. Madrid, España.
Hofman Bert and Susana Cordeiro Guerra (2007) Ensuring Inter-Regional Equity and Poverty Reduction. In Fiscal Equalization. Challenges in the Design of Intergovernmental Transfers. Martinez-Vazquez Jorge y Bob Searle, eds., Springer.
Ibarra Jorge, Alfredo Sandoval, Lida Sotres. Variables que Explican el Desempeño de los Gobiernos Estatales Mexicanos. En Gestión y Política Pública. Volumen XIV, Número 1, Primer Semestre 2005, Centro de Investigación y Docencia Económica.
Ingram Gregory. (July 2009) The Changing Landscape of Local Public Revenues. In Land Lines. Lincoln Institute of Land Policy. Cambridge, Ma, United States of America.
Levtchenkova Sophia and Jeffrey D. Petchey (2007) A Model for Public Infrastructure Equalization in Transitional Economies. In Fiscal Equalization. Challenges in the Design of Intergovernmental Transfers. Martinez-Vazquez Jorge y Bob Searle, eds., Springer.
Levi Lucio (2009). Revista Foro de Federaciones, Volumen 8, Número 1. Canadá.
Ley de Coordinación Fiscal Federal (2009). Congreso de la Unión, consultado en www.congreso.gob.mx
Ley de Coordinación Fiscal del Estado de Sinaloa (2001). Congreso del Estado de Sinaloa, consultado en www.congresosinaloa.gob.mx
Llach J. Juan (Noviembre, 2001) Un Nuevo Contrato Fiscal Federal. XXVI Reunión Anual de la Asociación Argentina de Economía Pública.

21
Martinez-Vazquez Jorge y Jamenson Boex (1997). An Analysis of Alternative Measures of Fiscal Capacity for Regions of the Russian Federation. Georgia State University. Working Paper 97-4, June, Atlanta, United States of America.
Martinez-Vazquez Jorge y Jamenson Boex (2001). Russia´s transition to a new federalism, World Bank Institute Learning Resources Series, Washington D.C., The World Bank
Morales Schechinger Carlos (2008). Impuesto a la propiedad. Lincoln Institute of Land Policy. Estados Unidos.
Moreno L. Carlos (April, 2003) Fiscal Performance of Local Governments in México: The Role of Federal Transfers. Centro de Investigación y Docencia Económica. Working Paper 127.
Musgrave Richard (1992). Hacienda Pública. Teórica y Practica Mc. Graw Hill. Quinta Edición, México.
Oates Wallace E. (1972). Fiscal Federalism. New York, Harcourt Brace Jovanovich, Inc, New York.
Oates Wallace E. (1999). An Essay on Fiscal Federalism. Journal of Economic Literature. Vol. 37, number 3, September. United States of America
Peña Ahumada José Antonio y Rubén Mondoy Luna (2008). Manual de Transferencias Federales para Municipios. Secretaría de Gobernación, México.
Piancastelli, M. (2001) Measuring the Tax Effort of Developed and Developing Countries: Cross- Country Panel Data Analysis, 1989-95: Discussion Paper: IPEA, Río de Janeiro.
Raich Urri (2004) Impacto de la Descentralización del Gasto en los Municipios de México. En Guerrero Juan Pablo (2004) Impuestos y Gasto Público en México. Desde una Perspectiva Multidisciplinaria. Editorial Porrúa. México.
Rego Veiga Gustavo (2002). Las Transferencias y sus Efectos sobre el gasto: Una Aproximación. En Revista Galega de Economía, junio, volumen 11, número 001, Universidad de Santiago de Compostela. España
Rosen Harvey (2008). Hacienda Pública. Mc Graw Hill. Séptima Edición. España.
Searle Bob and Jorge Martinez-Vazquez (2007) The Nature and Functions of Tied Grants. In Fiscal Equalization. Challenges in the Design of Intergovernmental Transfers. Martinez-Vazquez Jorge y Bob Searle, eds., Springer.
Shah, Anwar. 2004. Lessons from international practices of intergovernmental fiscal transfers. Paper Presented at XVI Regional Seminar on Fiscal Policy CEPAL/ECLAC, Santiago de Chile.
Shah, Anwar. (2007) A Framework for Evaluating Alternative Institutional Arrangements for Fiscal Equalization Transfers. In Fiscal Equalization. Challenges in the Design of Intergovernmental Transfers. Martinez-Vazquez Jorge y Bob Searle, eds., Springer.
Shah, Anwar M (2007).Repensar el Federalismo Fiscal. Revista Foro de Federaciones. Volúmen 6, número 1, Ottawa. Canadá.
Sobarzo Horacio (2003) México: Estudio sobre la Capacidad Fiscal y Tributaria y el Esfuerzo Tributario de los Gobiernos Estatales en México. Colegio de México.
Sobarzo Horacio (2009) Relaciones Fiscales Intergubernamentales en México. En Revista Problemas del Desarrollo, Universidad Nacional Autónoma de México. Vol. 40, numero 156, enero-marzo 2009.
Sour Laura (2007). Un Repaso de Conceptos sobre Capacidad y Esfuerzo Fiscal, y su Aplicación para los Gobiernos Locales Mexicanos. Documentos de Trabajo número 187, Centro de Investigación y Docencia Económica, México
Wallace Sally and Roy Bhal .(2005) Public Financing in Developing and Transition Countries. Public Budgeting and Finance, Vol 25 (No. 4S), pp. 83-98.

22
Appendix Sinaloa State Municipalities Ahome El Fuerte Choix Guasave Sinaloa Angostura Salvador Alvarado Mocorito Badiraguato Culiacán Navolato Elota Cosalá San Ignacio Mazatlán Concordia El Rosario Escuinapa
23
DETERMINANTS OF FISCAL EFFORT MEASURE BASED ON LOCAL REVENUE IN SINALOA, 1993-2008 DEPENDENT VARIABLE PROPERTY TAX/TAX BASE = FEFF
(1) (2) (3) (4) (5)
Total Transfers -1.792***
(0.356)
Unconditional Transfers
-1.578*** -1.071* -0.648
(0.414) (0.576) (0.563)
Conditional Transfers
-1.668***
-1.406**
(0.540)
(0.562)
Lnvcat -0.990*** -0.955*** -1.446*** -1.352*** -1.481***
(0.132) (0.131) (0.177) (0.184) (0.178)
Lnpop 0.0658 0.0566 0.141* 0.129* 0.211***
(0.0587) (0.0616) (0.0720) (0.0721) (0.0630)
Lnvapc 0.227** 0.249*** 0.271** 0.296** 0.299**
(0.0900) (0.0913) (0.134) (0.137) (0.135)
Margination Index -0.511*** -0.584*** -0.874*** -0.910*** -0.880***
(0.111) (0.108) (0.163) (0.171) (0.163)
Constant 3.198** 2.869** 5.779*** 4.339** 4.692***
(1.356) (1.290) (1.839) (1.844) (1.750)
Observations 278 278 188 188 188 R-squared 0.340 0.327 0.369 0.342 0.358
(6) (7) (8) (9) (10)
Total Transfers -0.410**
(0.167) Unconditional Transfers
-0.359 -0.406 -0.184
(0.245) (0.346) (0.319) Conditional Transfers
-0.705**
-0.581*
(0.312)
(0.324)
Lnvcat -0.835*** -0.841*** -1.036*** -1.036*** -1.028***
(0.167) (0.156) (0.132) (0.134) (0.137)
Lnpop -0.170 -0.0967 -1.079* -0.736 -1.030*
(0.492) (0.456) (0.545) (0.522) (0.540)
Lnvapc 0.143** 0.148** 0.271* 0.322** 0.277**
(0.0653) (0.0689) (0.129) (0.133) (0.131)
Margination Index -0.104 -0.112 -0.354*** -0.322*** -0.355***
(0.0816) (0.0797) (0.105) (0.0962) (0.107)
Constant 3.700 2.911 15.43** 11.20 14.57**
(6.602) (6.143) (6.868) (6.562) (6.826)
Observations 278 278 188 188 188
R-squared 0.398 0.396 0.359 0.341 0.353 Number of id 18 18 18 18 18
(11) (12) (13) (14) (15)
Total Transfers -1.254**
(0.519)
Unconditional Transfers
-0.429 -0.310 -0.307
(0.420) (0.878) (0.522)
Conditional Transfers
-1.246***
-0.665**
(0.381)
(0.299)
Lnvcat -1.693 -0.516 0.447 -2.347* -0.307
(1.857) (0.959) (1.142) (1.154) (1.331)
Lnpop -1.543 0.0901 1.471 -0.738 0.0102
(3.106) (0.233) (2.733) (1.395) (1.903)
Lnvapc 0.855 0.205 1.422 1.217 1.453
(1.265) (0.755) (1.562) (0.718) (2.389)
Margination Index -0.754* -0.259* -0.248 -0.129 -0.184**
(0.449) (0.129) (0.169) (0.120) (0.0750)
Observations 270 288 180 180 180 Number of id 18 18 18 18 18
Sargant p-v 0.885 0.655 0.276 0.0603 0.250 Hansen p-v 1 1 0.996 1 0.996
Arellano-Bond ar(1) 0.152 0.0600 0.150 0.246 0.238 Arellano-Bond ar(2) 0.559 0.337 0.738 0.988 0.739
Robust standard errors in parentheses *** p<0.01, ** p<0.05, * p<0.1
Note: Columns (1) to (5) show pooled OLS regressions, (6) to (10) show panel estimation with fixed effects (11) to (15) Arel lano bond

24
DETERMINANTS OF FISCAL EFFORT MEASURE BASED ON LOCAL REVENUE IN SINALOA, 1993-2008 DEPENDENT VARIABLE TOTAL TAXES/GDP PROXY = FEFF
(1) (2) (3) (4) (5)
Total Transfers -1.242***
(0.297) Unconditional Transfers
-1.176*** -0.966** -0.640
(0.370) (0.487) (0.487) Conditional Transfers
-1.282***
-1.045**
(0.417)
(0.440)
Lnvcat 0.313* 0.337** -0.281* -0.208 -0.313**
(0.170) (0.167) (0.143) (0.148) (0.144)
Lnpop 0.142** 0.130* 0.159*** 0.149** 0.222***
(0.0665) (0.0757) (0.0590) (0.0600) (0.0539)
Lnvapc 0.116 0.128 0.255** 0.274** 0.281**
(0.119) (0.117) (0.112) (0.114) (0.112)
Margination Index -0.416*** -0.469*** -0.809*** -0.837*** -0.815***
(0.120) (0.116) (0.140) (0.146) (0.140)
Constant -9.796*** -9.913*** -5.432*** -6.539*** -6.413***
(1.759) (1.690) (1.433) (1.442) (1.339)
Observations 278 278 188 188 188
R-squared 0.677 0.676 0.763 0.755 0.759
(6) (7) (8) (9) (10)
Total Transfers -0.386***
(0.133)
Unconditional Transfers
-0.506** -0.597* -0.493*
(0.233) (0.311) (0.249)
Conditional Transfers
-0.330
-0.147
(0.296)
(0.237)
Lnvcat 0.572* 0.564* -0.266 -0.265 -0.253
(0.282) (0.280) (0.203) (0.206) (0.209)
Lnpop 0.586 0.707 0.185 0.345 0.257
(0.454) (0.443) (0.482) (0.469) (0.475)
Lnvapc 0.0826 0.0863 0.449*** 0.473*** 0.458**
(0.157) (0.149) (0.153) (0.155) (0.163)
Margination Index -0.0931 -0.111 -0.397*** -0.382*** -0.398***
(0.126) (0.113) (0.0970) (0.0910) (0.101)
Constant -17.54** -18.77** -6.381 -8.360 -7.657
(6.430) (6.528) (5.686) (5.551) (5.466)
Observations 278 278 188 188 188 R-squared 0.236 0.240 0.368 0.364 0.355
Number of id 18 18 18 18 18
(11) (12) (13) (14) (15)
Total Transfers -1.028*
(0.529) Unconditional Transfers
-0.766* -1.077 -0.950
(0.394) (0.710) (0.568) Conditional Transfers
-0.849***
-0.685*
(0.322)
(0.392)
Lnvcat 0.164 0.548 1.367* -0.676 0.785
(1.584) (1.036) (0.783) (0.979) (1.121)
Lnpop -1.351 0.153 1.076 0.677 0.216
(2.992) (0.244) (1.473) (1.144) (1.767)
Lnvapc -0.896 0.0630 0.654 0.734 0.922
(2.442) (0.755) (0.950) (0.461) (2.084)
Margination Index -0.364 -0.342** -0.212 -0.162 -0.236**
(0.643) (0.147) (0.175) (0.148) (0.116)
Observations 270 288 180 180 180
Number of id 18 18 18 18 18 Sargant p-v 0.830 0.754 0.396 0.242 0.691
Hansen p-v 1 1 0.938 1.000 0.989 Arellano-Bond ar(1) 0.0673 0.0540 0.0724 0.101 0.0905
Arellano-Bond ar(2) 0.240 0.184 0.371 0.504 0.403
Robust standard errors in parentheses
*** p<0.01, ** p<0.05, * p<0.1 Note: Columns (1) to (5) show pooled OLS regressions, (6) to (10) show panel estimation with fixed effects (11) to (15) Arel lano bond
25
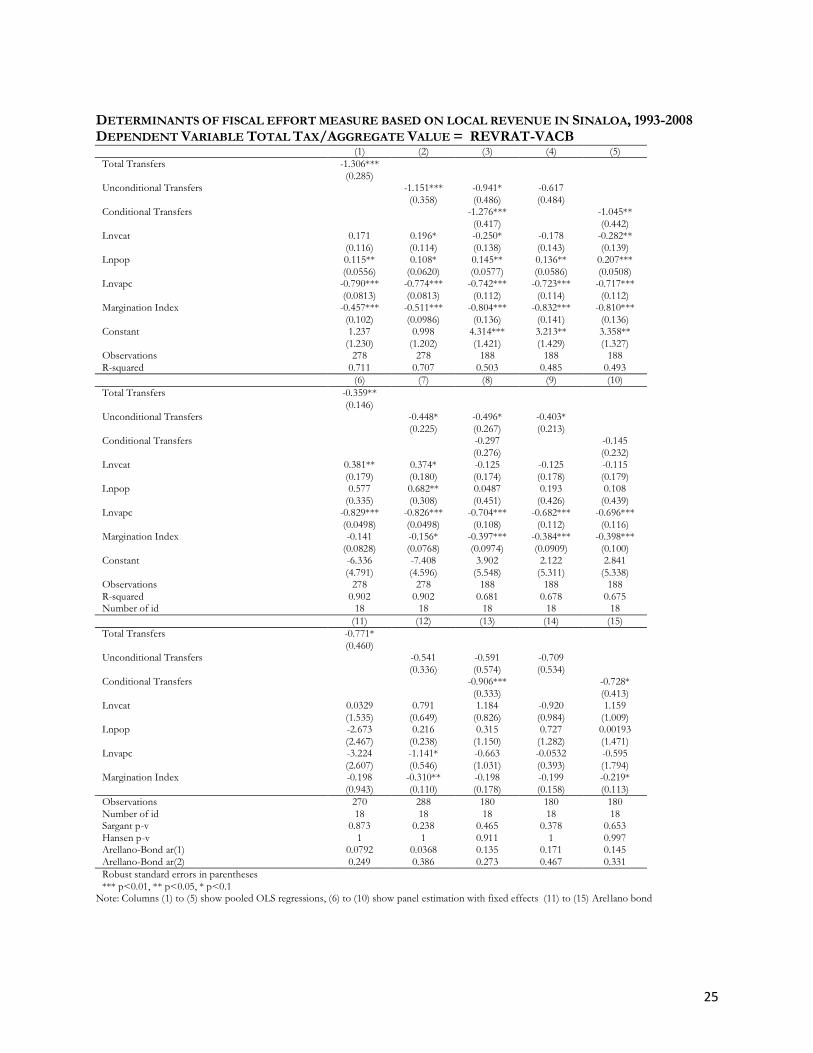
DETERMINANTS OF FISCAL EFFORT MEASURE BASED ON LOCAL REVENUE IN SINALOA, 1993-2008 DEPENDENT VARIABLE TOTAL TAX/AGGREGATE VALUE = REVRAT-VACB
(1) (2) (3) (4) (5)
Total Transfers -1.306***
(0.285) Unconditional Transfers
-1.151*** -0.941* -0.617
(0.358) (0.486) (0.484) Conditional Transfers
-1.276***
-1.045**
(0.417)
(0.442)
Lnvcat 0.171 0.196* -0.250* -0.178 -0.282**
(0.116) (0.114) (0.138) (0.143) (0.139)
Lnpop 0.115** 0.108* 0.145** 0.136** 0.207***
(0.0556) (0.0620) (0.0577) (0.0586) (0.0508)
Lnvapc -0.790*** -0.774*** -0.742*** -0.723*** -0.717***
(0.0813) (0.0813) (0.112) (0.114) (0.112)
Margination Index -0.457*** -0.511*** -0.804*** -0.832*** -0.810***
(0.102) (0.0986) (0.136) (0.141) (0.136)
Constant 1.237 0.998 4.314*** 3.213** 3.358**
(1.230) (1.202) (1.421) (1.429) (1.327)
Observations 278 278 188 188 188
R-squared 0.711 0.707 0.503 0.485 0.493
(6) (7) (8) (9) (10)
Total Transfers -0.359**
(0.146) Unconditional Transfers
-0.448* -0.496* -0.403*
(0.225) (0.267) (0.213) Conditional Transfers
-0.297
-0.145
(0.276)
(0.232)
Lnvcat 0.381** 0.374* -0.125 -0.125 -0.115
(0.179) (0.180) (0.174) (0.178) (0.179)
Lnpop 0.577 0.682** 0.0487 0.193 0.108
(0.335) (0.308) (0.451) (0.426) (0.439)
Lnvapc -0.829*** -0.826*** -0.704*** -0.682*** -0.696***
(0.0498) (0.0498) (0.108) (0.112) (0.116)
Margination Index -0.141 -0.156* -0.397*** -0.384*** -0.398***
(0.0828) (0.0768) (0.0974) (0.0909) (0.100)
Constant -6.336 -7.408 3.902 2.122 2.841
(4.791) (4.596) (5.548) (5.311) (5.338)
Observations 278 278 188 188 188
R-squared 0.902 0.902 0.681 0.678 0.675 Number of id 18 18 18 18 18
(11) (12) (13) (14) (15)
Total Transfers -0.771*
(0.460) Unconditional Transfers
-0.541 -0.591 -0.709
(0.336) (0.574) (0.534) Conditional Transfers
-0.906***
-0.728*
(0.333)
(0.413)
Lnvcat 0.0329 0.791 1.184 -0.920 1.159
(1.535) (0.649) (0.826) (0.984) (1.009)
Lnpop -2.673 0.216 0.315 0.727 0.00193
(2.467) (0.238) (1.150) (1.282) (1.471)
Lnvapc -3.224 -1.141* -0.663 -0.0532 -0.595
(2.607) (0.546) (1.031) (0.393) (1.794)
Margination Index -0.198 -0.310** -0.198 -0.199 -0.219*
(0.943) (0.110) (0.178) (0.158) (0.113)
Observations 270 288 180 180 180
Number of id 18 18 18 18 18 Sargant p-v 0.873 0.238 0.465 0.378 0.653
Hansen p-v 1 1 0.911 1 0.997 Arellano-Bond ar(1) 0.0792 0.0368 0.135 0.171 0.145
Arellano-Bond ar(2) 0.249 0.386 0.273 0.467 0.331
Robust standard errors in parentheses
*** p<0.01, ** p<0.05, * p<0.1 Note: Columns (1) to (5) show pooled OLS regressions, (6) to (10) show panel estimation with fixed effects (11) to (15) Arel lano bond