fiscal policy uncertainty and economic growth in pakistan ... fiscal policy uncertainty and economic...
TRANSCRIPT

Journal of Economic Cooperation and Development, 38, 2 (2017), 1-26
Fiscal Policy Uncertainty and Economic Growth in Pakistan:
Role of Financial Development Indicators
Ateeqa Farooq1 and Bushra Yasmin
2
The macro-economic uncertainty has been considered crucial for economic
growth in developing countries. Hypothetically, it threatens economic growth
through its bearing on the investment pattern and future policy options.
However, the financial sector development is expected to moderate the
adverse effects of these uncertainties on the economic growth and can lead to
fairly stable policy choices. This paper examines the relationship between
fiscal policy uncertainty and economic growth along with coherent input
from financial sector development in Pakistan for the period of 1970-2011,
employing Auto-Regressive Distributed Lag (ARDL) approach to Co-
integration. The findings suggest that fiscal policy instability on account of
government expenditures, revenues generation and budget uncertainty have
been abating the economic growth significantly in Pakistan. However, the
relevance of financial development indicators as ratio of liquid liabilities and
credit to private sector proved to be supportive in minimizing the said effect.
Hence, the financial development should be promoted being pertinent in
rendering high economic growth by offsetting the detrimental effects of fiscal
policy uncertainties.
Keywords: Economic uncertainty, economic growth, fiscal policy instability,
revenue generation, liquid liabilities, ARDL O4, H3, E4
1. Introduction
The importance of stable and predictable macroeconomic policies for a
prosperous and sustainable economic growth has long been realized by
the developing countries. Economic analysts accused economic
1 M.Phil Economics graduate from Fatima Jinnah Women University, The Mall,
Rawalpindi, Pakistan 2 Fulbright Visiting Scholar, Harvard University, USA
Email: [email protected]

2 Fiscal Policy Uncertainty and Economic Growth in Pakistan:
Role of Financial Development Indicators
uncertainty as one of the major cause of low economic growth of these
economies. Pastor and Veronesi (2012) argued that the bad economic
news creates uncertainty over the future government policies which
results in immediate decline in investment and economic growth.
Theoretically, the influence of economic uncertainty laid down its
channel through marginal productivity theory where marginal
productivity of capital is convex to particular uncertain variable and
penetrates into the behavior of investment. Therefore, macro-economic
uncertainty modifies the expected net value of marginal product of
capital and ultimately contributes to changes in economic growth. Such
investment behavior held responsible to generate economic uncertainty
in foregoing and future predictability, as well. The support to the role
of policy uncertainty in economic growth also comes from the line of
literature by Lucas and Prescott (1971), Arrow (1968) and Caballero
(1991). Hence, the economic uncertainty is an integral part of decision
making which is precisely inclined to the investment decisions and
renders strong implications for the economic growth.
The experience of developing countries in 1960s and 1970s
highlighted the role of macroeconomic instability as fundamental in
shattering economic growth. It also connotes the great recession that
witnessed low economic recovery due to economic uncertainty (Baker
et. al, 2012). The proclaimed instability has also become prevalent in
Pakistan and its origin is reflected in different macro-economic policy
indicators. This instability, inherited by macro-economic uncertainty,
has its roots in the economic structure and development indicators. It is
well argued that impact of monetary and fiscal policy is intensified in
the presence of economic uncertainties and gets reflected in terms of
lower economic growth mainly due to backward and unpredictable
behavior of investment (Bernanke, 1983; Pindyck and Solimano, 1993
and Dixit and Pindyck, 1994).
The fiscal policy uncertainty is very critical in this regards. According
to Chaudhry and Shabbir (2005), economic uncertainty is
demonstrated in worsened fiscal policy in terms of budget uncertainty
as the uncertain budget imposes restrictions and distributive risks for
the subsequent fiscal years. Pakistan, Govt. of (2010) proclaimed that
the economy of Pakistan has perennial budget uncertainty rolls from
2.3% to 1.9% in 1980s and fell from 3% in 1990s to 1.6% in 2000, due
to rescheduling of debt services, a very upshot of uncertain budget.

Journal of Economic Cooperation and Development 3
Similarly, the uncertainty in revenue collection imparts irreversible
investment and has long run consequences for economic growth (Atif,
Shahab and Mehmood, 2012). The upheavals in political scene and
IMF conditionality reinforce revenue generation uncertainty in
Pakistan to 0.8% and 0.4% in 1980s and 1990s, respectively.
Ultimately, the optimality of government expenditures is desirable for
sustainable fiscal conditions. The conventional fiscal policy in Pakistan
has subdued persistently by uncertain government expenditures as one
of the failures of fiscal policy entailment. The uncertain government
expenditures are expected to have negative shock on the economic
growth and endeavors to the rising tax liabilities in near future.
Precisely, such instabilities are more likely to prevail in the developing
countries as reported by Kneller et.al. (1998).
Herewith, the role of financial sector pertains to the economic growth
of the country. According to Aghion et al., (1999), since the financial
sectors are less developed in developing countries these economies
suffer more from volatility. The signaling behavior of financial
development enriched with capital market perfections can issue equity
under economic uncertainty and hence absorb the likely risks. The
contribution of liquidity for financial development in Pakistan was
ranged from 43.25% to 53.45% in 1973 and reached to 50.95% in 2007
inclined with promoting economic growth for policy makers.
The relationship between financial development and economic growth
is primarily emphasized from development perspective of the
economy. In that context, the focus of this study is to put an effort to
provide empirical evidence on the influence of financial development
as a conducive factor to scale down the effect of macro-economic
uncertainty on economic growth in Pakistan. The study covers time
period from 1970-2011 and is expected to deliver important policy
recommendations.
The rest of the study is organized as follows; Section 2 deals with the
review of existing literature; Section 3 provides brief overview of
fiscal policy indicators along with financial sector development in
Pakistan; Section 4 provides the methodology and data description;
Section 5 deals with the empirical results and discussions and section 6

4 Fiscal Policy Uncertainty and Economic Growth in Pakistan:
Role of Financial Development Indicators
concludes the study with policy recommendations on the basis of
findings.
2. Literature review
The available literature stresses on the economic uncertainty as an
integral part of decision making being logical to the investment and
have strong implications for significance of economic growth. The
relationship between uncertainty and dynamics of investment laid
down its foundation by contemporary work by Pindyck et al. (1993).
The consensus exists on the threatening behavior of irreversible
investment in relation to the marginal productivity theory reflects in
the rise in uncertainty.3 The period apprehended by irreversible
investment featured to entail sunk cost along with foregoing
uncertainty and induces unpredictable macro-economic policies.
Hence, the macroeconomic uncertainty affect economic growth by the
backward and unpredictable behavior of investment (either public or
private) as appraised by Bernanke (1983), Pindyck and Solimano
(1993), Arrow (1968), Abel & Eberly (1994) and Caballero (1991).
Regarding the uncertainty issue, a number of studies examined the
effect of uncertainty on investment at firm level, while Aizenman and
Marion (1993) was first to integrate its effects from macro-economic
perspective. For Pakistan, Fatima and Waheed (2011) examined the
effect of macro-economic uncertainty on total investment and
economic growth for the years 1975-2008 by using the accelerator
model of investment and endogenous growth model. The finding
indicates that macro-economic uncertainty has significantly negative
effect on investment and per capita income. Economic uncertainty as a
part of budget deficit create loop holes in deficit financing behind
immature coerce of government to meet its expenditures and left
adverse consequences in the form of high inflation, current account
deficit and crowding out of private investment (Chaudhry and Abe,
1999). Hence, the deficit resultantly is not sustainable (Chaudhry and
Ahmed, 1995). The optimality of government expenditures is desirable
for the sustainable fiscal conditions. Moreover, Henrekson (1993)
3 Where irreversible investment comes into existence after the threshold cross of
marginal rate of productivity of capital.

Journal of Economic Cooperation and Development 5
claimed that the dilemma of uncertain government expenditures
reduces total factor productivity and impedes economic growth.
The linkage between financial development and macroeconomic
volatility is supported in the empirical evidence both for the
developing and developed countries. Financial development is able to
reduce liquidity risk and increases investment efficiency. The
ascertained research indicates that countries with more developed
financial sector can diversify risks of economic uncertainty than
countries with less developed financial sector. The studies by Lensink
et al. (2001) and Aizenman and Marion (1993) suggested that the
unstable government policy hurt economic growth more in the
countries with poor developed financial sector.4 The standardized
bank-based financial sector by extending loan facilities fosters
economic growth through rapid accumulation of monetary services.
Conclusively, the studies so far carried out distinctly for the
relationship between uncertainties, financial development and
economic growth but a dearth in the studies is observed which
incorporates major fiscal policy uncertainties in undermining the
economic growth keeping into account the role of financial
development indicators. Therefore, this paper can be a significant
contributor to the existing literature, particularly for Pakistan.
3. Fiscal Measures Uncertainty and Financial Sector Development
Briefs in Pakistan
The concurrence of macroeconomic uncertainty in Pakistan, although
persistent, but mostly overlooked by the policy makers. The volatile
macro-economic performance from fiscal front is due to low tax
collection as proportion of national income and irrational expenditure
behavior. The volatility was observed at 1.4 % in revenue generation
for the year 1970-71 but later declined and fluctuated around 0.8 %
and 0.4 % in 1980s and 1990s, respectively. According to Pakistan,
Govt. of (2010), since inception perennial and persistent fiscal deficits
4 This proposes an avenue to auspicate the effect of financial sector development for
significance of economic growth.

6 Fiscal Policy Uncertainty and Economic Growth in Pakistan:
Role of Financial Development Indicators
have been observed varying from as low as 2.9 percent to as high as
12.2 percent of GDP.
Similarly, budget uncertainty was at 2.3% in 1970 and the major
shortfall recorded in the year 1976 due to the interruption after civil
war and nationalization policies. The deficit revolved around 5 percent
of GDP since 1980-81 (Ishfaq and Chaudhry, 1999). It again fell to 1.9
% in 1980s due to rising interest burden and high defense spending
and again rolls on 2.6% in 2011. Likewise, the optimal government
expenditures are much lower than the current size of government
expenditures and persist at 2.2% in 1970s and 5.9% in 1989.
Meanwhile, the expenditures contracted to 0.51% in 1996 and 1.57%
in 2005 and then sustained at 4.25% and 7.95% in 2007 and 2011,
respectively.
Turning towards financial development indicators, the financial
deepening persisted at 41.86% in 1970s and 1980s and was increased
to 44.22% in 1990s. A sharp rise has been observed later since 1999
from 39.6 % to 50.5 % in 2006-07 indicating a groovy job by the
financial reforms in Pakistan (Pakistan, Govt. of (2010). Besides, the
liquid liabilities redeem contribution for financial development on
average of 43.25% and 44.94% in 1970s and 1990s, respectively that
ultimately reached to 50.9% in year 2007. The performance of credit to
private sector is worth mentioning and shows encouraging trend from
23.84% in 1970 to 25.92% in 1980s. This completes the discussion on
the factual trend in fiscal policy uncertainty and financial development
indicators in Pakistan. Now, we turn to the methodology adopted to
encounter the research objectives.
4. Model Specification and Data Description
4.1 Theoretical Framework
The dynamic analysis of economic growth follows the traditional
Solow Growth model (1956). The augmented Solow model offsets
with constant returns to scale production function where output is a
function of capital (physical and human) and augmented labor. The
production function is given as:

Journal of Economic Cooperation and Development 7
Y(t) = K(t)α(𝐴(𝑡)𝐿(𝑡))1−𝛼−𝛽 (1)
Where and are parameters and 𝐴(𝑡)𝐿(𝑡) refers to the effective labor.
The equilibrium of physical and human capital of a country is given as
equation (2) and (3), respectively:5
𝑘𝑡∗ = (
𝑠𝑘𝑡1−𝛽
𝑠ℎ𝑡𝛽
𝑛+g+𝛿)
1
1−𝛼−𝛽
(2)
ℎ𝑡∗ = (
𝑠𝑘𝑡𝛼𝑠ℎ𝑡
1−𝛼
𝑛+g+𝛿)
1
1−𝛼−𝛽 (3)
By substituting equation (2) and (3) in the production function
simultaneously, the growth model for a country can be written as:
y(t)∗ =
Y(t)
L(t)= A(t)(
skt
n+g+δ)
α
1−α−β(sht
n+g+δ)
β
1−α−β (4)
Hence, the economic growth of a country virtually depends on the role
of physical and human capital to ascertain its dynamic analysis along
with other underlying determinants per research objectives.
4.2 Empirical Model
The empirical model is developed by modifying the growth model to
ascertain that whether possible growth reducing effects of economic
uncertainty may be realized by the intimidating role of financial sector
development. The final equation to be estimated, following Lensink, R
(2001), is given below:
GDPt =α1 + α2Kt + α3Ht + α4 UNCt + α5 UNCt*FDt + ut (5)
Where, GDP refers to the real Gross Domestic Product. The human
capital (H) is measured by using proxy variables of higher education
enrollment ratio, secondary school enrollment ratio and literacy rate.
Capital (K) is the measure of physical capital stock, which is the
5 See Takahashi (2012) for reference.

8 Fiscal Policy Uncertainty and Economic Growth in Pakistan:
Role of Financial Development Indicators
endowment of an economy and productivity deployed to produce flow
of goods and services (GDP). Since the data for physical capital is not
available directly, it is measured from the following formula.67
11 1 ttt KIK
Where, I is the gross fixed capital formation, data collected from
World Development Indicators, t is the depreciation rate and K is the
capital stock.
UNC refers to the macroeconomic uncertainty measured by the
volatility in budget, revenue generation and government expenditures.
Similarly, FD stands for the financial development and is measured by
three indicators namely; money and quasi-money to GDP ratio (MDP)
which quantifies the size of financial deepening in the economy, credit
to the private sector as percentage of GDP (CDP) that entails total
amount of credit/loans provided to the private sector and liquid
liabilities (M3) as percentage of GDP (LIQ) that is comprised of
demand and interest bearing financial obligations. The interaction term
of all constructed financial development indicators with
macroeconomic uncertainty are included to empirically capture that
whether financial sector development significantly mitigates the effect
of economic uncertainty on economic growth. The analysis covers the
period from 1970-2011 for Pakistan.
The data for financial development indicators are collected from the
World Development Indicators (2011), World Bank Database. The data
for economic growth, inflation rate, real interest rate, exports and real
effective exchange rate are collected from Monthly Statistical Bulletin
(2011), Pakistan Bureau of Statistics, respectively. The data for human
capital is taken from Labor Force Survey of Pakistan (2011), published
by the Pakistan Bureau of Statistics. While, the data on the fiscal
6 The method for measurement of physical capital stock is taken from steady state
and neo-classical growth model approximated by growth rate of investment as
referred by Harberger (1978). 7 As the model uses variables as the log differenced in final estimation, they
implicitly demonstrate the relative/percent changes in dependent variable with
respect to independent variables and henceforth, the GDP refers to the growth rate,
technically.
Journal of Economic Cooperation and Development 9
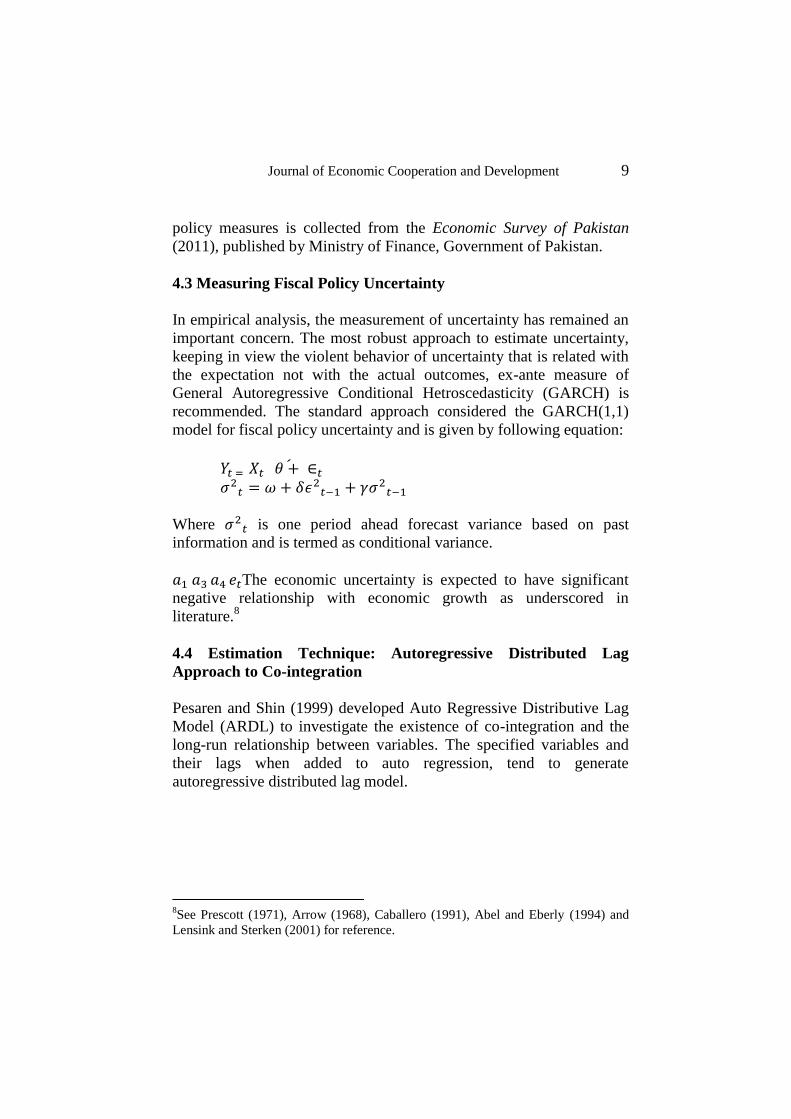
policy measures is collected from the Economic Survey of Pakistan
(2011), published by Ministry of Finance, Government of Pakistan.
4.3 Measuring Fiscal Policy Uncertainty
In empirical analysis, the measurement of uncertainty has remained an
important concern. The most robust approach to estimate uncertainty,
keeping in view the violent behavior of uncertainty that is related with
the expectation not with the actual outcomes, ex-ante measure of
General Autoregressive Conditional Hetroscedasticity (GARCH) is
recommended. The standard approach considered the GARCH(1,1)
model for fiscal policy uncertainty and is given by following equation:
𝑌𝑡 = 𝑋𝑡 𝜃 + ́ ∈𝑡
𝜎2𝑡 = 𝜔 + 𝛿𝜖2
𝑡−1 + 𝛾𝜎2𝑡−1
Where 𝜎2𝑡 is one period ahead forecast variance based on past
information and is termed as conditional variance.
𝑎1 𝑎3 𝑎4 𝑒𝑡The economic uncertainty is expected to have significant
negative relationship with economic growth as underscored in
literature.8
4.4 Estimation Technique: Autoregressive Distributed Lag
Approach to Co-integration
Pesaren and Shin (1999) developed Auto Regressive Distributive Lag
Model (ARDL) to investigate the existence of co-integration and the
long-run relationship between variables. The specified variables and
their lags when added to auto regression, tend to generate
autoregressive distributed lag model.
8See Prescott (1971), Arrow (1968), Caballero (1991), Abel and Eberly (1994) and
Lensink and Sterken (2001) for reference.

10 Fiscal Policy Uncertainty and Economic Growth in Pakistan:
Role of Financial Development Indicators
The model is specified as:
𝑌𝑡 = 𝜇 + ∑ 𝑌𝑖𝑝𝑖=1 𝑌𝑡−𝑖 + ∑ 𝛽𝑗
𝑟𝑗=0 𝑋𝑡−𝑗 + 𝛿𝑊𝑡 + 휀𝑡 (1)
Where, µ is a vector of constant (𝜇𝑦,𝜇𝑥). 𝛽 is a matrix of Vector
Autoregressive (VAR) estimates. A pair of series 𝑋𝑡 and 𝑌𝑡 may be
integrated at order I (0) and I (1). The time series vector X includes
physical capital, human capital, fiscal policy uncertainty indicators and
financial development indicators. The error term 휀𝑡 is assumed to be
serially uncorrelated and vector 휀𝑡 = (휀𝑦,𝑡휀𝑥,𝑡) ≈ 𝑁(0, Ω) where Ω is
positive and definite and t is time vector. The assumption of ARDL
model is that errors have conditional mean of zero given all past values
i.e. 𝐸 (𝑢𝑡
𝑌𝑡−1⁄ , 𝑌𝑡−2 … . . 𝑋𝑡−1𝑋𝑡−2 … . ) = 0
4.4.1 Bound Testing Approach
The ARDL bounds testing approach to co-integration uses (𝑝 + 1)𝑘 to
estimate the number of regressions. Where, p indicates the maximum
number of lags used and k refers to the total number of variables. The
order p in an auto-regression is selected on the basis of appropriate lags
to avoid biasness.9 The minimized residual’s square on the basis of
Schwarz Information Criterion (SIC) is given as:
𝑆𝐼𝐶(𝑝) = ln (𝑆𝑆𝑅(𝑃)
𝑇+ (𝑝 + 1)
𝑙𝑛𝑇
𝑇 (2)
Where, 𝑆𝑆𝑅(𝑃) is the sum of squared residuals and the lag length is
selected using the minimum values of SBC.
The standard Vector Error Correction Model (VECM) is given as:
∆𝑌𝑡 =
𝜇 + 𝛼𝑡 + 𝜆𝑌𝑡−1 + ∑ γtΔyt−i
𝑝−𝑖𝑖=1 + ∑ γ
t𝑟−𝑗𝑗=1 Δxt−j + εt (3)
9 If the order of estimated regression is too low, the valuable information in the more
distant lagged values is lost. If order is too high more coefficients are estimated than
necessary which produces estimation error in forecasts.

Journal of Economic Cooperation and Development 11
The F-test is used to test the existence of long-run relationship with
following hypothesis:10
𝐻0: 𝜆1 = 𝜆2 = 𝜆3 = 𝜆4 = 𝜆5 = 0
𝐻1: 𝜆1 ≠ 𝜆2 ≠ 𝜆3 ≠ 𝜆4 ≠ 𝜆5 ≠ 0
In the second step, following long run model is estimated:
∆(𝑔𝑑𝑝)𝑡 = 𝛼1 + ∑ 𝛽𝑖
𝑛𝑖=1 ∆(𝑔𝑑𝑝)𝑡−𝑖 + ∑ 𝛽𝑗
𝑛𝑗=1 ∆(𝐾)𝑡−𝑗 + ∑ 𝛿𝑗 ∆(𝐻)𝑡−𝑗
𝑛𝑗=1 +
∑ 𝜛𝑗𝑛𝑗=1 ∆(𝑈𝑛𝑐𝑒𝑟𝑡𝑎𝑖𝑛𝑡𝑦)𝑡−𝑗 + ∑ 𝜚𝑗∆ (𝑈𝑛𝑐𝑒𝑟𝑡𝑎𝑖𝑛𝑡𝑦 ∗ 𝐹𝑖𝑛𝐷𝑒𝑣𝑡−𝑗
𝑛𝑗=1 ) + 휀𝑖 (4)
Subsequently, the Error Correction Model (ECM) is estimated to
suggest the speed of adjustment towards long run equilibrium and also
to evaluate the short run dynamics of model. The standard error
correction representation of ARDL model is given as:
∆(𝑔𝑑𝑝)𝑡 = 𝜆1 + 𝛿1(𝐸𝐶𝑀)𝑡−1 + ∑ 𝛼𝑖
𝑛𝑖=1 ∆(𝑔𝑑𝑝)𝑡−𝑖 + ∑ 𝛽𝑗
𝑛𝑗=1 ∆(𝐾)𝑡−𝑗 +
∑ 𝜑𝑗 ∆(𝐻)𝑡−𝑗𝑛𝑗=1 + ∑ 𝜛𝑗
𝑛𝑗=1 ∆( 𝑈𝑛𝑐𝑒𝑟𝑡𝑎𝑖𝑛𝑡𝑦)𝑡−𝑗 +
∑ 〖𝜚𝑗 ∆(𝑈𝑛𝑐𝑒𝑟𝑡𝑎𝑖𝑛𝑡𝑦 ∗ 𝐹𝑖𝑛 𝐷𝑒𝑣 〗𝑡−𝑗)𝑛𝑗=1 + 휀𝑖 (5)
Where, (𝐸𝐶𝑀)𝑡−1 is lagged ECM of the model, 𝛿 is its coefficient that
shows the speed of adjustment and 휀𝑖 is the random error with zero
mean and finite covariance matrix. In order to ascertain the goodness
of fit the diagnostic test including Breusch-Godfrey LM and J-B
normality test is conducted to check the serial autocorrelation and
normality assumption of CLRM, respectively.
5. Empirical Results and Discussion
An intensifying feature of time series data, dominated by stochastic
trends and examined by Augmented Dickey Fuller (ADF) test,
10
Null hypothesis is evaluated through the significance of lagged variables by
computed F-statistics. If it exceeds the upper critical bound (UCB), then the series
are co-integrated; if it is below the lower critical bound (LCB), there is no co-
integration and if in between the UCB and the LCB, co-integration remain
inconclusive. The critical bounds are taken from Pesaren and Shin (1999).

12 Fiscal Policy Uncertainty and Economic Growth in Pakistan:
Role of Financial Development Indicators
determines the stationary of variables.11
The orders of integration for
respective series are reported in Table 5.1.
Table 5.1: ADF Unit Root Test
Variables Level 1st Difference Integration order
statistic p-value statistic p-value
LGDP -0.252 0.989 -4.835 0.001 I(1)
LK -6.406 0.000 -13.10 0.000 I(0)
LH -6.069 0.000 -9.954 0.000 I(0)
Ltax -14.91 0.000 -23.51 0.000 I(0)
Lbud -3.33 0.074 -7.892 0.000 I(0)
Lep -2.27 0.438 -8.52 0.000 I(1)
CDP -3.305 0.080 -4.913 0.001 I(0)
MDP -4.744 0.002 -6.165 0.000 I(0)
LIQ -4.890 0.001 -7.118 0.000 I(0)
Note: ADF is applied with intercept and trend option.
Table 5.1 shows that all the variables follow a combination of the
integration order of I (0) and I (1) as natural log of capital stock (K),
human capital (H), tax revenue (tax), budget deficit (bud), credit to
private sector (CDP), money and quasi money to GDP (MDP), liquid
liabilities (LIQ) are stationary at level while GDP and government
expenditures (ep) have unit root and became stationary at first
difference.
Subsequently, the Bound-testing approach to Cointegration ascertains
the existence of long-run relationship among the selected variables. At
first, the lag order on the basis of Schwarz-Bayesian criteria (SBC) is
selected at one. The results for Bound test for the existence of co-
integration are reported in table 5.2.
11
Presuming the presence of structural instability in the model Clemente Montanes
Unit root test was applied but didn’t depict significant structural breaks deliberately
for all variables. Hence, the ADF results are reported for unit root test for its more
relevance.

Journal of Economic Cooperation and Development 13
Table 5.2: Bound Test for Co-integration
Dep. variable:
LGDP
Credit to Private
Sector
Liquid Liabilities Money and Quasi
Money
Lep Ltax Lbud Lep Ltax Lbud Lep Ltax Lbud
F-Statistic 4.938 6.477 5.408 5.289 6.003 6.003 5.171 5.522 5.332
Upper Bound
Critical value
(90%)
3.794 3.831 3.831 3.794 3.831 3.831 3.794 3.831 3.831
Conclusion Ho rejected and Co-integration exists for all variables.
Note: All equations are estimated with three financial indicators namely; credit to private
sector, money and quasi money to GDP and liquid liabilities with other selected variables.
It is concluded from the findings reported above that the application of
bound test for co-integration remains valid and the null hypothesis for
no long-run relationship is rejected for all equations.
The results for ARDL approach to Cointegration for each fiscal policy
indicator are reported in section 5.1, 5.2 and 5.3. Overall, the results
are satisfactory and in line with theoretical expectation. The results of
diagnostic test including Lagrange Multiplier (LM) test of
autocorrelation suggests that residuals are not serially correlated and
Jarque-Normality test submits that errors are normally distributed for
all estimated equations. These tests validate the robustness of estimates
obtained from ARDL equations.
5.1 Results for Uncertain Government Expenditures and Financial
Development
The ARDL results for the long-run cointegrating relationship and Error
Correction Model are reported in Table 5.3, with real GDP as
dependent variable, capital stock (K), human capital (H), government
expenditures volatility (Lep) and its interaction term with financial
development indicators. Table 5.3: Empirical Results of Government Expenditures Uncertainty

14 Fiscal Policy Uncertainty and Economic Growth in Pakistan:
Role of Financial Development Indicators
Long Run Coefficients
ARDL(1,0,0,0,0) based on Schwarz Bayesian Criterion
Dependent Variable: (Lgdp)
Variables Eq. (1)
CDP
Eq. (2)
MDP
Eq. (3)
LIQ
Coefficient Std.
error
Coefficient Std.
error
Coefficien
t
Std. error
Constant 15.54*** 0.48 16.32*** 0.31 16.08*** 0.27
LK 0.302*** 0.01 0.30*** 0.01 0.31*** 0.01
LH 0.01 0.01 0.01 0.01 0.020** 0.01
Lep -0.279* 0.15 -1.16 0.97 -0.063** 0.03
Lep*fin.dev 0.271* 0.15 0.30 0.25 0.023** 0.01
Error Correction ARDL Model
∆𝑳𝑲𝒕 0.054*** 0.01 0.05*** 0.01 0.055*** 0.01
∆𝑳𝑯𝒕 0.001*** 0.001 0.002** 0.001 0.003*** 0.001
∆𝑳𝒆𝒑𝒕 -0.05** 0.02 -0.19 0.15 -0.011** 0.005
∆𝑳𝒆𝒑 ∗𝒇𝒊𝒏. 𝒅𝒆𝒗𝒕
0.048** 0.02 0.05 0.04 0.004*** 0.001
𝑬𝑪𝑴𝒕−𝟏 -0.179*** 0.04 -0.16*** 0.03 -0.175*** 0.03
Diagnostic tests
Serial correlation
(LM Test)
0.009
(0.9)
0.50
(0.4)
0.021
(0.8)
Normality Test 𝜒2 = 0.264
(0.8)
𝜒2 = 0.60 (0.7) 𝜒2 = 0.040 (0.9)
Notes:1) *, **, *** indicate significance at 10 %, 5 % level and 1 % level of significance,
respectively.
2) p-values are reported in parenthesis of diagnostic tests.
Equation (1) yields statistically significant and positive impact of
physical capital on economic growth. Specifically, this indicates that
1% increase in capital stock brings about 0.302% increase in real GDP.
This demonstrates that the main source of economic growth is capital
accumulation as also encountered by standard growth models.
Similarly in other equations, capital stock has appeared as significantly
positive and renders the physical capital as a strong contributor in
GDP, bearing highest magnitude among all the explanatory variables.

Journal of Economic Cooperation and Development 15
The coefficient for human capital index appeared as statistically
insignificant for equation (1) and (2) but it has appeared statistically
significant and positive in equation (3) highlighting that economic
growth copped with higher level of educational attainment as it
increases the workers’ productivity, once the model is controlled for
the liquid liabilities.12
Returning to the results from equation (1), the uncertain government
expenditures have statistically significant and negative effect on the
economic growth indicating 0.279 % decline in real GDP occurring by
1% increase in the government expenditures’ uncertainty. The
justification lies with the irrational government spending which
disrupts the macroeconomic equalizers of the economy. Moreover, the
volatile government expenditures leaves less resource for development
due to huge borrowing for non-development expenditures which
further curtails the development process.
The inclusion of financial sector development measured by credit to
private sector with uncertain government expenditures shows that 1 %
increase in credit to private sector tends to reverse the negative effect
of economic uncertainty and raises real GDP by 0.27%. The finding
supports the significance and dominance of financial sector
development for economic growth by Lensink et al. (2001). The
influence of credit to private sector possibly enhances mobilization of
savings and expands the economic opportunities as also identified by
Levine (1997).
Additionally, the uncertain government expenditures along with
financial indicator of liquid liabilities as % of GDP reported in
equation (3) shows that 1% increase in liquid liabilities squeezes the
negative effect of uncertain government expenditures and raise real
GDP by 0.023%. This indicates the relevancy of financial
intermediaries for bearing financial obligations in liquid assets as
emerging in developing countries. The liquid liabilities help in
financial deepening and reduce uncertainty by provision of secured
investment portfolio in liquid assets. It is also empirically proved by
12
The study also used secondary school enrollment ratio and literacy rate but
appeared insignificant, as well.

16 Fiscal Policy Uncertainty and Economic Growth in Pakistan:
Role of Financial Development Indicators
Baks and Crammer (1999) that liquidity increases the equity returns
and minimize the risks and uncertainty associated with recession and
helps predicting future advancement in economic growth. Hence, it can
be argued that financial development can reverse the negative effects
of government expenditure uncertainty. However, the results from the
third indicator of financial development i.e., money to GDP ratio do
not display any significance for government expenditures uncertainty
and interaction term in explaining growth behavior.
The coefficient of 𝐸𝐶𝑀𝑡−1 (-0.179) shows that deviation of long run
economic growth corrected by 17.97% over each year. This term is
negative and statistically significant at 1% level of significance which
in turn determines the existence of model’s stability and shows that the
error correction process converges monotonically to the equilibrium
path.
As the uncertain government expenditures get transfers to the budget
uncertainty, its link with economic growth controlling for the financial
development is discussed in next section.
5.2 Results for Budget Uncertainty and Financial Development
The estimated long run coefficients integrating budget uncertainty and
the role of financial development indicators to economic growth are
reported in Table 5.4.

Journal of Economic Cooperation and Development 17
Table 5.4: Empirical Results of Budget Uncertainty
Long Run Estimates
ARDL( 1,1,0,0,1 ) based on Schwarz Bayesian Criterion Dependent Variable:
(Lgdp)
Variables Eq. (1)
CDP
Eq. (2)
MDP
Eq. (3)
LIQ
Coefficie
nt
Std
error
Coeffici
ent
Std
error
Coeffici
ent
Std error
Constant 17.66*** 0.46 17.60*** 0.46 17.61*** 0.41
LK 0.279*** 0.01 0.280*** 0.01 0.290*** 0.01
LH 0.011 0.01 0.012 0.01 0.014 0.01
Lbud -0.273*** 0.10 -
0.258***
0.10 -
0.362***
0.11
Lbud*fin.d
ev
0.069*** 0.02 0.055*** 0.02 0.073*** 0.02
Error Correction ARDL Model
∆𝑳𝑲𝒕 0.72 0.68 0.802 0.69 0.553 0.65
∆𝑳𝑯𝒕 0.001 0.001 0.001 0.001 0.001 0.001
∆𝑳𝒃𝒖𝒅𝒕 -0.03*** 0.01 -
0.037***
0.01 -
0.047***
0.01
∆𝑳𝒃𝒖𝒅∗ 𝒇𝒊𝒏. 𝒅𝒆𝒗𝒕
0.006*** 0.002 0.005** 0.002 0.006 0.001
𝑬𝑪𝑴𝒕−𝟏 -0.144*** 0.02 -
0.145***
0.02 -0.130 0.02
Diagnostic tests
Serial
correlation
(LM Test)
0.14
(0.70)
0.24
(0.62)
0.11
(0.73)
Normality Test 𝜒2 = 0.88
(0.64)
𝜒2 = 0.78 (0.67) 𝜒2 = 0.47 (0.78)
Notes:1) *, **, *** indicate significance at 10%, 5% level and 1% level of significance,
respectively.
2) p-values are reported in parenthesis of diagnostic tests.
The estimated coefficients of capital stock in Table 5.4 appeared as
statistically significantly positive for all equations. The budget
uncertainty yields statistically significant and negative influence on
economic growth indicating that a 1% increase in budget uncertainty

18 Fiscal Policy Uncertainty and Economic Growth in Pakistan:
Role of Financial Development Indicators
brings about 0.273% decline in real GDP according to equation (1).
This declining effect of budget uncertainty is due to failure of
government policies to meet its expenditures resulting in unsustainable
budget. The revenue gap is responsible for the long run budget
uncertainty as acquainted by Siddique and Illyas (2011) for Pakistan.
Hence, uncertain budgetary targets compress economic growth and
delivers huge debt servicing in order to meet the loss of receipts thus
exaggerating the distortions in economic growth.
The inclusion of all financial development indicators with the
uncertainty measures appeared as significantly positive for economic
growth. The credit to private sector reduces the budget uncertainty
effect on economic growth as 1% increase in credit raises it by
0.069%. The financial sector is considered as source of ‘easy’
resources for the public budget as indicated by Roubini and Sala-i-
Martin (1992). This means that government is able to follow policies
of financial repression and can increase revenues through seigniorage
taxation, thus assorting to minimize budget uncertainty. State Bank of
Pakistan (2011) declared that budgetary borrowing from domestic
financial institutions instead of external finance raises net domestic
assets and reduces the uncertainty effects.
Similarly, the money and quasi money to GDP has statistically
significant and positive impact on the economic growth showing that
1% increase in this ratio leads to increase real GDP by 0.055% and
depresses the uncertainty effect by raising currency and demand
deposits of central government. Hence, it strengthens the amount of
financial resources in the economy by contributing in financial
deepening and mortify the uncertainty effects. Additionally, liquidity
has strong effect by raising real GDP by 0.073% and nullifies the
reducing effect of -0.362% . The evidence shows that the reliance of
government shifted to accumulate liquid assets as supporter of
financial development which helps in debt servicing to diversify the
loss of long run budgetary uncertainty.13
13
In this regards, the findings from this study highlights the emerging stance of
monetary policy concerns to support fiscal policy measures.

Journal of Economic Cooperation and Development 19
The error correction term (-0.14) as reported in Table 5.4, shows that
deviation from the long run equilibrium is adjusted by 14% over each
year which in turn determines the existence of model’s stability.
5.3 Results for Revenue Generation Uncertainty and Financial
Development
The budgetary uncertainty is inclined with gaps in revenues generation
capacity. A stable and consistent flow of tax revenues are required to
carry on the development projects. The effect of tax revenue
generation uncertainty on economic growth along with financial
development is reported in Table 5.5.
Table 5.5: Empirical Results of Revenue Generation Uncertainty
Long Run Estimates
ARDL(1,1,0,0,0) based on Schwarz Bayesian Criterion
Dependent Variable: (Lgdp)
Variables Eq. (1)
CDP
Eq. (2)
MDP
Eq. (3)
LIQ
Coefficie
nt
Std.
error
Coeffici
ent
Std.
error
Coefficien
t
Std. error
Constant 17.01*** 0.58 17.00*** 0.59 17.09*** 0.6
LK 0.28*** 0.01 0.28*** 0.01 0.29*** 0.01
LH 0.01 0.01 0.01 0.01 0.02** 0.01
Ltax -0.93* 0.51 -0.62 0.68 -0.48 0.36
Ltax*fin.d
ev
0.27* 0.15 0.13 0.17 0.03*** 0.01
Error Correction ARDL Model
∆𝑳𝑲𝒕 0.392 0.85 0.95 0.83 0.75 0.75
∆𝑳𝑯𝒕 0.001 0.001 0.002** 0.001 0.003*** 0.001
∆𝑳𝒕𝒂𝒙𝒕 -0.14* 0.08 -0.98*** 0.11 -0.07 0.05
∆𝑳𝒕𝒂𝒙∗ 𝒇𝒊𝒏. 𝒅𝒆𝒗𝒕
0.04** 0.02 0.02 0.02 0.005** 0.002
𝑬𝑪𝑴𝒕−𝟏 -0.15*** 0.03 -0.15*** 0.03 -0.14*** 0.03
Diagnostic tests
Serial
correlation
(LM Test)
0.17
(0.67)
0.07
(0.7)
0.06
(0.8)
Normality Test 𝜒2 = 0.22
(0.89)
𝜒2 = 0.41 (0.8) 𝜒2 = 0.39 (0.8)
Note1) *, **, *** indicate significance at 10%, 5% level and 1% level of significance,
respectively.
2) p-values are reported in parenthesis of diagnostic tests.

20 Fiscal Policy Uncertainty and Economic Growth in Pakistan:
Role of Financial Development Indicators
The long run estimates of capital and human capital are positive as
appeared in all estimated equations. The role of capital stock as major
factor input in economic growth is demonstrated by the findings.
However, it appeared as insignificant for human capital in first two
equations as was the case with the results reported in Table 5.3.
The uncertainty of tax revenue generation has statistically significant
and negative effect on economic growth and indicates that 1% increase
in tax revenue uncertainty reduces real GDP by 0.93%, 0.62% and
0.48% in three equations, respectively. The rise in revenue generation
uncertainty gets associated with uneven contribution of the economy in
revenue collection. Specifically, for income and corporate taxes this
uncertainty abrupt the pattern of irreversible investment and dispirited
economic growth as noted by Atif, Shahab and Mehmood (2012). The
persistent structure of tax evasion in developing countries is ample
cause of revenue generation uncertainty (Roubini and Sala-i-Martin,
1992) and is acquainted to influence the economic growth adversely.
It is pertinent to mention that the uncertainty in revenue generation is
overwhelmingly transmitting into the expenditures and budget
uncertainty in Pakistan and leads to suppress the economic growth by
large margin.
However, the financial development in the form of credit to private
sector nullifies the adverse effects of uncertainty on economic growth.
The credit to private sector and liquid liabilities enhances the real GDP
by 0.27% and 0.03%, respectively. As discussed earlier, the financial
resources intermediated in the economy modifies the investment
decisions and leads towards increase in the tax net for revenue
collection. Moreover, the tax evasion is a primary source of revenue
collection uncertainty which reduces the efficiency of financial sector
(Roubini and Sala-i-Martin, 1992). And in order to avoid the negative
effect of uncertainty, the development of financial structure should be
optimized. Government allows the financial markets, through financial
repression, to control the inflation tax base originated through tax
evasion and to increase the seigniorage taxation. Hence, inclusion of
financial sector development has deliberating effect for reducing
severity of uncertainty and makes headway for the economic growth.

Journal of Economic Cooperation and Development 21
The underlying error correction term (-0.15) shows that any shock to
the series will make it close to the convergence point by 15% every
year and implies the existence of long run stable relationship.
6. Conclusions and Policy Recommendations
The empirical link between macro-economic uncertainty and economic
growth is manifested in the literature as the economic uncertainty is
mostly accused by policy makers to erupt the stability and
sustainability of economic development of the economies.
Comparatively, the role of financial development is considered to be
vital for the economic growth. In this regards, this study connotes the
financial development with the moderating effects of fiscal policy
uncertainty on economic growth in Pakistan over the time period 1970-
2011. The uncertainty in macro-economic environment due to fiscal
policy instability induces hazarding policy decisions which prove to be
erroneous in the future time period.
By employing ARDL approach to Cointegration, this study indicates
that uncertainty originated from budget deficit, government
expenditures and revenue collection have significantly negative effect
on economic growth and financial development helps to mitigate these
adverse effects. Uncertainty in irrational government expenditures
reduces economic growth and induces huge burden for optimum fiscal
imbalances. The relevance of liquid liabilities that reduces uncertainty
is delivered by secure investment portfolio in liquid assets with high
equity returns. The significance of financial sector development in
easing the resources for public budget found to collaborate in lessening
the uncertainty’s effects. Moreover, the pertinence of tax evasion, huge
debt servicing and unnecessary government expenditures serves as
fiscal policy failure and left severe consequences for the economy. The
reconciling of financial sector interacts strongly in global macro-
economic environment and mitigates the endangering effects of
economic uncertainty by controlling the factors of risk behavior,
degree of irreversibility and expandability of investment and
development.
Particularly, the fiscal policy failure in generating revenues due to tax
evasion and narrow tax base and its dependency on debt servicing to

22 Fiscal Policy Uncertainty and Economic Growth in Pakistan:
Role of Financial Development Indicators
meet its expenditures induces the vulnerable budget. In order to
minimize the uncertainty in fiscal policy indicators following policy
implications can be derived from the empirical findings of the study.
The tax base should be broadened and the statement of assets
should be mandatory by the taxpayer as a part of annual return
to avoid tax evasion.
The good governance is required in order to deal with the
issues of transparency and accountability in the taxation system
of Pakistan.
The monetary policy should be monitored carefully keeping the
autonomy of the central bank.
There should be reinvestigation of budget in order to minimize
the variations on quarterly basis.
The expenditure curriculum reforms should be introduced in
order to analyze the cost and benefit of government
expenditures.
Regarding the stimulating role of financial development, following
policy measures are suggested.
Financial sector development in the form of optimal resource
allocation and mobilization is required.
The development of financial institutions should be focused in
accordance to establish new private enterprises which will be
registered tax payers increasing the tax net.
The financial sector should also regulate the international
capital flows and mobilize the monetary services to control the
monetary shocks.

Journal of Economic Cooperation and Development 23
References
Arrow, K.J. (1968). Optimal Capital Policy with Irreversible
Investment. in J. N. Wolfe (ed.), Value, Capital and Growth, Essays in
Honor of Sir John Hicks, Edinburg University Press.
Aizenman and Marion (1993). Macroeconomic Uncertainty and
Private Investment, Economics Letters, 41: 207-210.
Abel, A.B. and J.C. Eberly (1994). A Unified Model of Investment
under Uncertainty. American Economic Review, 84: 1369-1384.
Aghion, P. et al. (1999). Dualism and Macroeconomic Volatility. The
Quarterly Journal of Economics, 1359-1397
Akhtar, M. and Hilton, R. (1984). Effects of Exchange Rate
Uncertainty on German and U.S. Trade. Federal Reserve Bank of New
York Quarterly Review, 9: 7-16.
Atif, Shahab and Mehmood (2012). The Nexus between Economic
Growth, Investment and Taxes: Empirical Evidence from Pakistan,
Academic Research International, 3(2): 530-537.
Baks, K. and Kramer, C. F. (1999). Global Liquidity and Asset Prices:
Measurement, Implications, and Spillovers. IMF Working Papers
99/168, Washington, D.C
Baker, Bloom N. and S. Davis (2012). Measuring Economic Policy
Uncertainty”, Standard mimeo.
Becker, G. S. (1962). Investment in Human Capital: A Theoretical
Analysis. Journal of Political Economy, University of Chicago Press,
vol. 70
Bernanke, B.S (1983). Irreversibility, Uncertainty and Cyclical
Investment”, Quarterly Journal of Economics, 98, 85-106.
Caballero, R.J (1991). On the Sign of the Investment-Uncertainty
Relationship. American Economic Review, 81: 279-288.

24 Fiscal Policy Uncertainty and Economic Growth in Pakistan:
Role of Financial Development Indicators
Chaudhary, A. and Shabbir, G. (2005). Macroeconomic Impacts of
Budget Deficit on Pakistan’s Foreign Sector. Pakistan Economic and
Social Review, vol. X1.III (2): 185-198.
Chaudhry, M. Aslam and Abe, Kiyoshi (1999). Pakistan Economy:
Past Trends, Current Situation and Future Prospects. Economic Journal
of Chiba University, 14 (1): 49-85.
Chaudhry, M. Aslam and N. Ahmed. (1995). Money Supply, Deficit
and Inflation in Pakistan. The Pakistan Development Review, 34 (3):
945-956.
Dixit, A.K. and R.S. Pindyck (1994), Investment under Uncertainty,
Princeton University Press, New Jersey.
Fatima, A., and Waheed, A (2011), Effects of Macroeconomic
Uncertainty on Investment and Economic Growth: Evidence from
Pakistan. Transition Studies Review, 18 (1): 112–123.
Ghosal, V. and P. Loungani (2000). The Differential Impact of
Uncertainty on Investment in Small and Large Businesses. Review of
Economics and Statistics, 82 (2): 338-343.
Pakistan, Government of (2011). Economic Survey (Various Issues),
Economic Advisor's Wing, Finance Division, Islamabad.
Pakistan, Government of (2011), Labor Force Survey (Various issues),
Federal Bureau of Statistics, Islamabad
Harberger, A. C. (1978). Perspectives on Capital and Technology in
Less Developed Countries. M. J. Artis and A. R. Nobay, eds.,
Contemporary Economic Analysis, London.
Henrekson, M. (1993). Wagner’s Law: A Spurious Relationship?
Journal of Public Finance, 48(2): 406-415.
Ishfaq and Chaudhry (1999). Fiscal Deficits and Debt Dimensions of
Pakistan. The Pakistan Development Review, 38 (4): 1067–1080.

Journal of Economic Cooperation and Development 25
Kneller, R., Bleany, M., and Gemmell, N. (1998). Growth, Public
Spending and Budget Constraint: Evidence from OECD Countries:
Center for Research in Economic Development and Institutional Trade,
University of Nottingham
Lucas, R.E. and E.C. Prescott (1971). Investment under Uncertainty.
Econometrica, 39: 659-681.
Lensink, R., H. Bo and E. Sterken (2001), Investment, Capital Market
Imperfections and Uncertainty: Theory and Empirical Results, Edward
Elgar, Cheltenham, UK
Leahy, J. and T.M. White (1996). The Effects of Uncertainty on
Investment: Some Stylized Facts. Journal of Money, Credit, and
Banking, 28: 64-83.
Levine, R. (1997), “Financial Development and Economic Growth:
Views and Agenda. Journal of Economic Literature, 35: 688-726.
Pastor, L. and P. Veronesi (2012). Uncertainty about Government
Policy and Stock Prices. Journal of Finance, 67: 1219–1264.
Pindyck, R. and Solimano, A. (1993), Economic Instability and
Aggregate Investment. NBER, Macroeconomics Annual (eds) O. J.
Blanchard and S. Fischer, MIT Press, Cambridge: 259—302.
Pesaran, M. H. and Shin, Y. (1999), An Autoregressive Distributed
Lag Modeling Approach to Cointegration Analysis. Econometrics and
Economic Theory in 20th century, The Ragnar Frisch Centennial
Symposium, eds. S. Strom, Cambridge University Press, Cambridge.
Solow (1956). A Contribution to the Theory of Economic Growth.
Quarterly Journal of Economics, 70: 65-94.
Roubini, N. and Sala-i-Martin, X. (1992), A Growth Model of
Inflation, Tax Evasion, and Financial Repression, NBER Working
Papers no. 4062.

26 Fiscal Policy Uncertainty and Economic Growth in Pakistan:
Role of Financial Development Indicators
State Bank of Pakistan (2010), Hand Book of Statistics, Karachi
Takahashi, T. (2012). Capital Growth Paths of the Neoclassical
Growth Model. PLoS ONE 7(11): e49484
World Bank (2011). World Development Indicators.
http:/data.worldbank.org/indicator