fiscal policy and inclusive growth in advanced countries ...€¦ · fiscal policy and inclusive...
TRANSCRIPT

ASIAN DEVELOPMENT BANK
AsiAn Development BAnk6 ADB Avenue, Mandaluyong City1550 Metro Manila, Philippineswww.adb.org
Fiscal Policy and Inclusive Growth in Advanced CountriesTheir Experience and Implications for Asia
The study seeks to draw relevant lessons from the advanced economies for developing Asia in using fiscal policy to tackle inequality. The experience of the advanced economies clearly shows the sizable equity-promoting potential of fiscal policy. At the same time, developing Asia’s pursuit of more inclusive fiscal policy must not come at the expense of economic growth or fiscal sustainability.
About the Asian Development Bank
ADB’s vision is an Asia and Pacific region free of poverty. Its mission is to help its developing member countries reduce poverty and improve the quality of life of their people. Despite the region’s many successes, it remains home to approximately two-thirds of the world’s poor: 1.6 billion people who live on less than $2 a day, with 733 million struggling on less than $1.25 a day. ADB is committed to reducing poverty through inclusive economic growth, environmentally sustainable growth, and regional integration.
Based in Manila, ADB is owned by 67 members, including 48 from the region. Its main instruments for helping its developing member countries are policy dialogue, loans, equity investments, guarantees, grants, and technical assistance.
FIsCAl PolICy AnD InClusIve Growth In ADvAnCeD CountrIes: theIr exPerIenCe AnD ImPlICAtIons For AsIAAlmas Heshmati, Jungsuk Kim, and Donghyun Park
adb economicsworking paper series
no. 422
december 2014
ADB Economics Working Paper Series
Fiscal Policy and Inclusive Growth in Advanced Countries: Their Experience and Implications for Asia Almas Heshmati, Jungsuk Kim, and Donghyun Park
No. 422 | 2014
Almas Heshmati ([email protected]) is Professor of Economics at Sogang University, Republic of Korea. Jungsuk Kim ([email protected]) is Researcher at the Institute of International and Areas Studies, Sogang University. Donghyun Park ([email protected]) is Principal Economist in the Economics and Research Department of the Asian Development Bank.
ASIAN DEVELOPMENT BANK

Asian Development Bank 6 ADB Avenue, Mandaluyong City 1550 Metro Manila, Philippines www.adb.org
© 2014 by Asian Development Bank December 2014 ISSN 2313-6537 (Print), 2313-6545 (e-ISSN) Publication Stock No. WPS147017-3
The views expressed in this paper are those of the author and do not necessarily reflect the views and policies of the Asian Development Bank (ADB) or its Board of Governors or the governments they represent.
ADB does not guarantee the accuracy of the data included in this publication and accepts no responsibility for any consequence of their use.
By making any designation of or reference to a particular territory or geographic area, or by using the term “country” in this document, ADB does not intend to make any judgments as to the legal or other status of any territory or area.
Notes: In this publication, “$” refers to US dollars.
The ADB Economics Working Paper Series is a forum for stimulating discussion and eliciting feedback on ongoing and recently completed research and policy studies undertaken by the Asian Development Bank (ADB) staff, consultants, or resource persons. The series deals with key economic and development problems, particularly those facing the Asia and Pacific region; as well as conceptual, analytical, or methodological issues relating to project/program economic analysis, and statistical data and measurement. The series aims to enhance the knowledge on Asia’s development and policy challenges; strengthen analytical rigor and quality of ADB’s country partnership strategies, and its subregional and country operations; and improve the quality and availability of statistical data and development indicators for monitoring development effectiveness.
The ADB Economics Working Paper Series is a quick-disseminating, informal publication whose titles could subsequently be revised for publication as articles in professional journals or chapters in books. The series is maintained by the Economics and Research Department.
CONTENTS TABLES AND FIGURES iv ABSTRACT v I. INTRODUCTION 1 II. BRIEF COMPARISON OF GOVERNMENT SIZES 2 III. SOCIAL WELFARE MODELS 5 IV. A REVIEW OF THE LITERATURE 6
A. Overview of Inclusive, Equity-Promoting Fiscal Policy Measures 6 B. Redistributive Effects of Fiscal Policies 6
V. FISCAL POLICIES, POVERTY REDUCTION, AND THE EQUITY-EFFICIENCY
TRADE-OFF 9 A. Regressive Effects of Fiscal Policies 9 B. Fiscal Policy and Poverty Reduction 9 C. Equity and Growth: Trade-off or Complementary? 10 D. Design of Social Welfare Systems and Equity-Efficiency Trade-offs 10 VI. POLICY IMPLICATIONS FOR DEVELOPING ASIA 13 REFERENCES 15

TABLES AND FIGURES
TABLES 1 Organisation for Economic Co-operation and Development Members' Fiscal
Policy Patterns 11 2 Summary of Fiscal Policy Effects of the Organisation for Economic Co-operation
and Development Members 12 FIGURES 1 Development of Tax Revenues to Gross Domestic Product Ratio, Developing Asia
and the Organisation for Economic Co-operation and Development 2 2 Tax Revenues to Gross Domestic Product Ratio for Selected Countries
and Country Groups, 2011 3 3 Development of Government Expenditures to Gross Domestic Product, Developing Asia
and the Organisation for Economic Co-operation and Development 4 4 Expenditures to Gross Domestic Product Ratio for Selected Countries
and Country Groups, 2012 4 5 Gross Government Debt to Gross Domestic Product Ratio for Selected
Countries and Country Groups, 2012 14
ABSTRACT Advanced economies have a significantly longer history of using fiscal policy to tackle inequality and promote inclusive growth than those in developing Asia. Therefore, as developing Asia explores the more active use of fiscal policy for inclusive purposes, it can learn from the experiences of advanced countries. Those experiences clearly suggest that fiscal policy can have a significant effect on inequality which provides some cause for optimism about its equity-promoting potential. Nevertheless, that optimism should be tempered by the different circumstances of advanced versus developing economies along with the need for developing Asia to maintain fiscal sustainability and economic growth. Keywords: fiscal policy, inequality, inclusive growth, advanced countries, developing Asia JEL Classification: D31, H20, H50

I. INTRODUCTION Advanced economies have a much longer history of using fiscal policy to promote inclusive growth than those in developing Asia. Addressing inequality has traditionally been one of the key strategic objectives of fiscal policy in the advanced economies which tend to use progressive taxation to redistribute resources from the rich to the poor via transfers and subsidies. Organisation for Economic Co-operation and Development (OECD) governments have actively and explicitly sought to redistribute income to achieve a more equitable income distribution. In contrast, Asian governments used fiscal policy to lay the foundation for macroeconomic stability and hence, economic growth by avoiding government budget deficits. Another contribution of fiscal policy to growth in Asia has been large investments in growth-conducive infrastructure and education that have contributed to the stock of physical and human capital.
To some extent, the fundamental difference in the perception of the growth-equity trade-off between the two groups reflects a vast gap in income and development levels. As countries grow richer, they generally accord a higher priority to the quality of growth, critically including income equality as opposed to narrowly defined economic growth, i.e., the citizens of high-income countries typically have a stronger preference for redistributing income to achieve a more equitable income distribution than the citizens of low-income countries. These differences in preference are consistent with the diminishing marginal utility of income. Social preferences for redistribution are evident in the relative size of the government in rich versus poor countries. The higher tax burdens and bigger government size of rich countries is mainly the result of the larger redistributive role of the government.
Notwithstanding the larger size of the government and the higher priority accorded to income
redistribution in advanced economies, at least some of their experience with using fiscal policy for equity-promoting purposes is relevant for developing Asia. Above all, their experience can help inform and guide Asian policymakers as to whether fiscal policy can reduce inequality and thus promote inclusive growth. Furthermore, that experience will have implications about the relative effectiveness of public spending versus taxation, along with the relative effectiveness of different types of public spending—e.g., education versus transfers—and different types of taxes and fiscal revenue sources—e.g., personal income tax versus value-added tax. Therefore, while we must be careful to take into account the large differences between the two groups, the experience of the advanced economies can still inform and guide Asian policymakers.
Those lessons are all the more valuable at this point because the governments of developing Asia are beginning to recognize the potential of fiscal policy as a powerful tool for fostering more inclusive growth. That recognition is part of a broader, region-wide trend of visibly greater engagement of public policy for equity purposes. The Harmonious Society Initiative in the People’s Republic of China (PRC) and designating inclusive growth as a national strategic objective by the Indian government are just two examples of the trend. Heightened government activism for equity, in turn, is triggered by rising inequality in the region. The Asian Development Bank (ADB) (2012) reports that the Gini coefficient rose—i.e., inequality grew—from 1990 to 2010 in economies that collectively accounted for over 80% of the region’s population. Therefore, now is an opportune time for Asia to take stock of the inclusive fiscal policy experience of the advanced economies and to glean the appropriate lessons.
Section II of this paper briefly compares the fiscal policies of OECD members with those of
developing Asia. Section III reviews the different types of welfare models in OECD members while Section IV takes an in-depth look at fiscal policy for inclusive growth in the OECD. The section examines various fiscal policy measures—transfers, subsidies, and taxes—and their redistributive
2 | ADB Economics Working Paper Series No. 422
effects. The same measures can also have regressive effects, an issue explored in Section V that also takes a look at poverty reduction effects and the growth-poverty trade-off. Section VI brings the paper to a close with some observations.
II. BRIEF COMPARISON OF GOVERNMENT SIZES It is a well-known, stylized fact that the relative size of the government as measured by standard indicators, such as the ratio of gross domestic product (GDP) to total tax revenue or total public expenditure, tends to increase as per capita income rises. The pattern is well established both over time and across economies. That is, the government tends to expand as an economy grows richer, and richer economies have bigger governments than poorer ones do. There are a number of possible explanations for this. For one, the size of the informal sector that does not pay taxes and remains outside the purview of the government is generally larger in developing economies, while the tax administrations and hence, the capacity to collect tax revenues are stronger and more effective in advanced economies. Furthermore, the demand for some public services may grow as income levels rise. For example, cash transfers to the poor could increase as a result of rising public concerns over inequality.
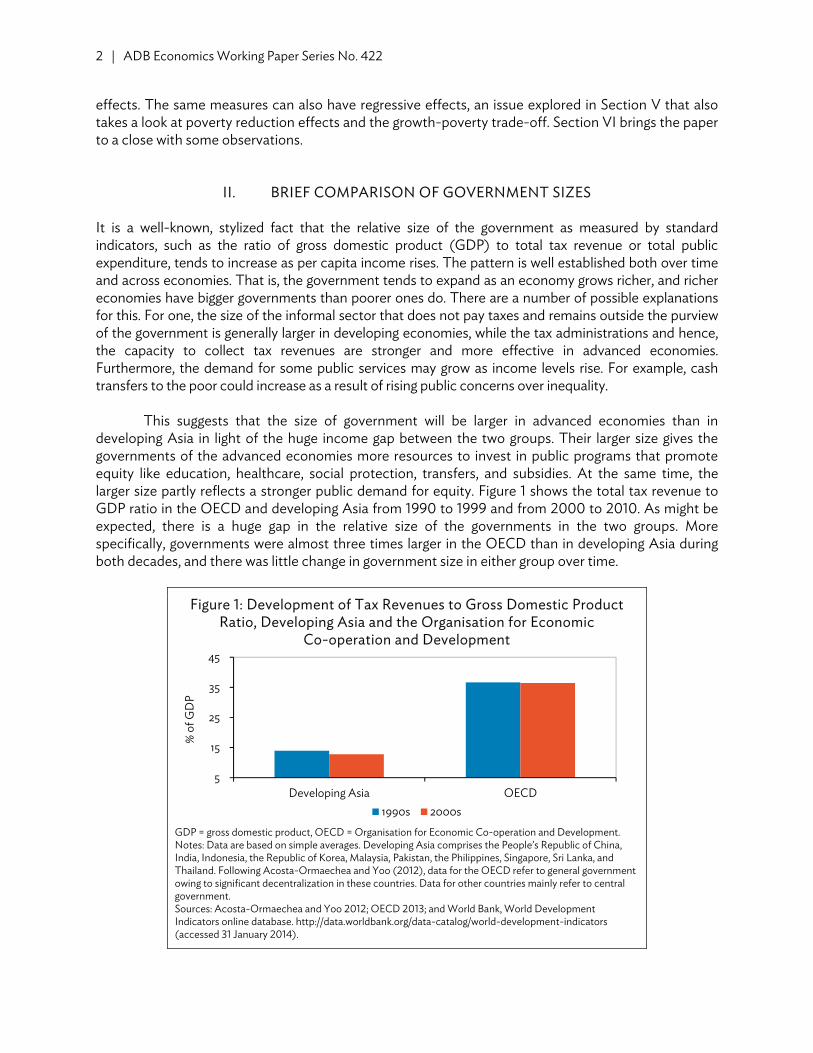
This suggests that the size of government will be larger in advanced economies than in developing Asia in light of the huge income gap between the two groups. Their larger size gives the governments of the advanced economies more resources to invest in public programs that promote equity like education, healthcare, social protection, transfers, and subsidies. At the same time, the larger size partly reflects a stronger public demand for equity. Figure 1 shows the total tax revenue to GDP ratio in the OECD and developing Asia from 1990 to 1999 and from 2000 to 2010. As might be expected, there is a huge gap in the relative size of the governments in the two groups. More specifically, governments were almost three times larger in the OECD than in developing Asia during both decades, and there was little change in government size in either group over time.
Figure 1: Development of Tax Revenues to Gross Domestic Product Ratio, Developing Asia and the Organisation for Economic
Co-operation and Development
GDP = gross domestic product, OECD = Organisation for Economic Co-operation and Development. Notes: Data are based on simple averages. Developing Asia comprises the People’s Republic of China, India, Indonesia, the Republic of Korea, Malaysia, Pakistan, the Philippines, Singapore, Sri Lanka, and Thailand. Following Acosta-Ormaechea and Yoo (2012), data for the OECD refer to general government owing to significant decentralization in these countries. Data for other countries mainly refer to central government. Sources: Acosta-Ormaechea and Yoo 2012; OECD 2013; and World Bank, World Development Indicators online database. http://data.worldbank.org/data-catalog/world-development-indicators (accessed 31 January 2014).
5
15
25
35
45
Developing Asia OECD
% o
f GD
P
1990s 2000s
Fiscal Policy and Inclusive Growth in Advanced Countries: Their Experience and Implications for Asia | 3
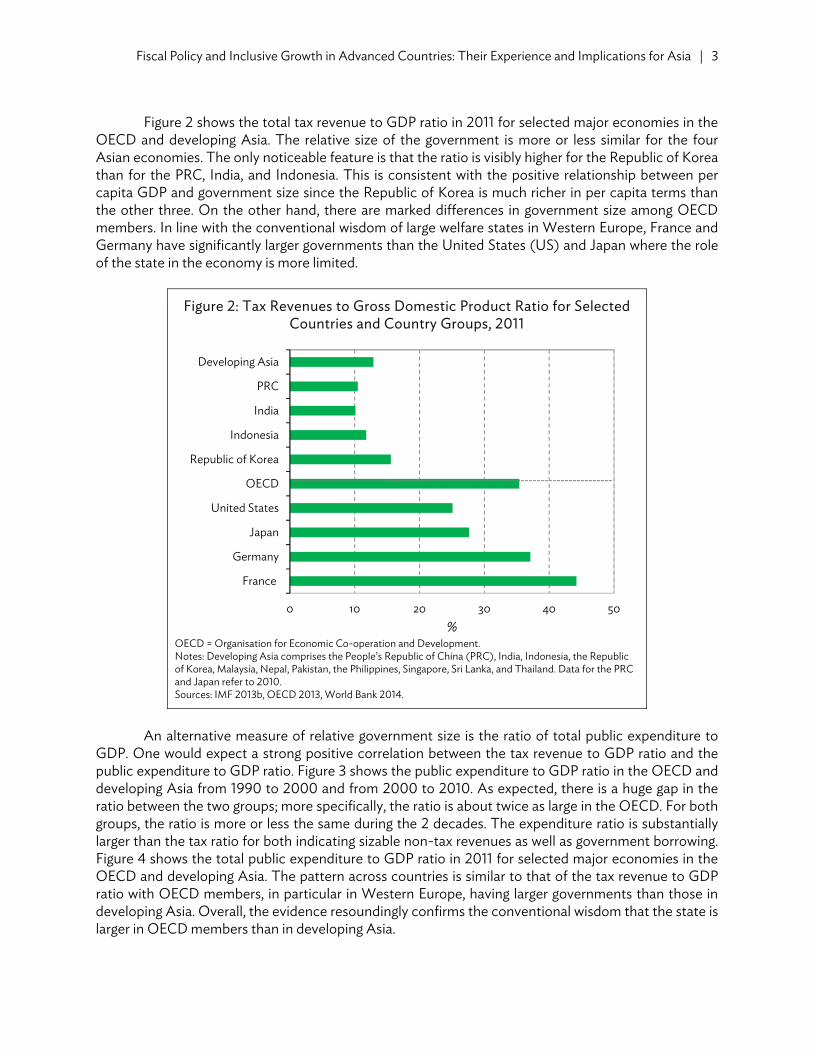
Figure 2 shows the total tax revenue to GDP ratio in 2011 for selected major economies in the
OECD and developing Asia. The relative size of the government is more or less similar for the four Asian economies. The only noticeable feature is that the ratio is visibly higher for the Republic of Korea than for the PRC, India, and Indonesia. This is consistent with the positive relationship between per capita GDP and government size since the Republic of Korea is much richer in per capita terms than the other three. On the other hand, there are marked differences in government size among OECD members. In line with the conventional wisdom of large welfare states in Western Europe, France and Germany have significantly larger governments than the United States (US) and Japan where the role of the state in the economy is more limited.
Figure 2: Tax Revenues to Gross Domestic Product Ratio for Selected Countries and Country Groups, 2011
OECD = Organisation for Economic Co-operation and Development. Notes: Developing Asia comprises the People’s Republic of China (PRC), India, Indonesia, the Republic of Korea, Malaysia, Nepal, Pakistan, the Philippines, Singapore, Sri Lanka, and Thailand. Data for the PRC and Japan refer to 2010. Sources: IMF 2013b, OECD 2013, World Bank 2014.
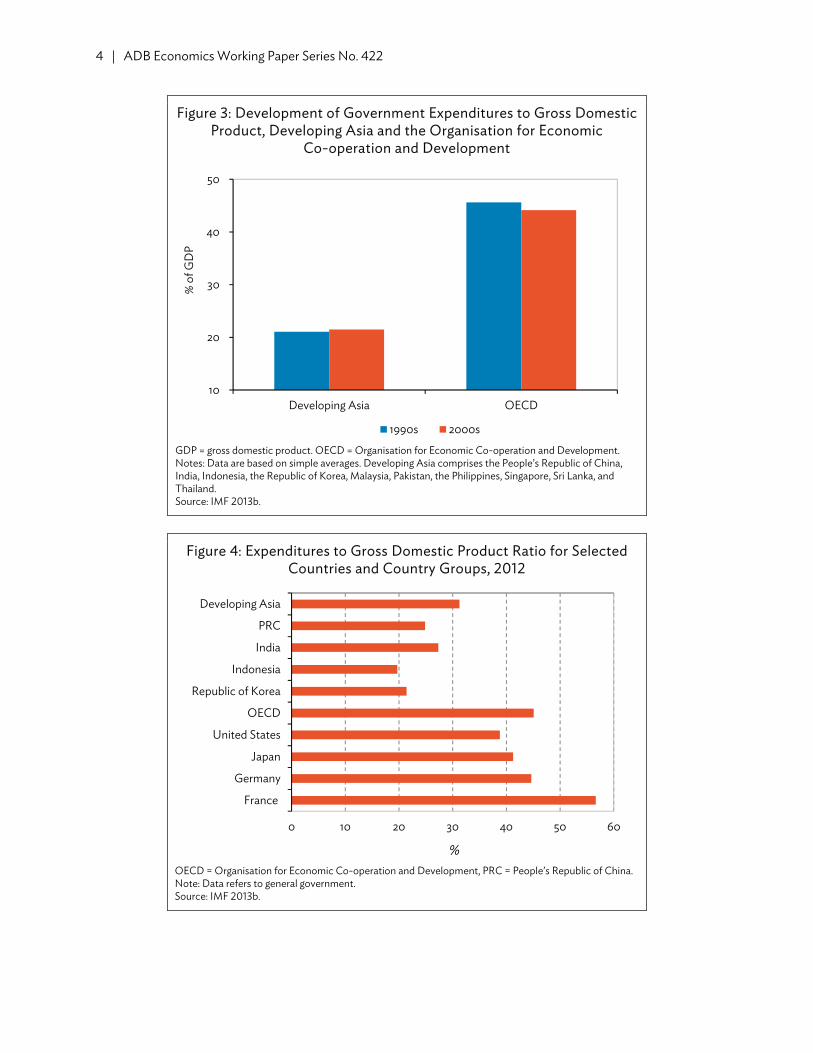
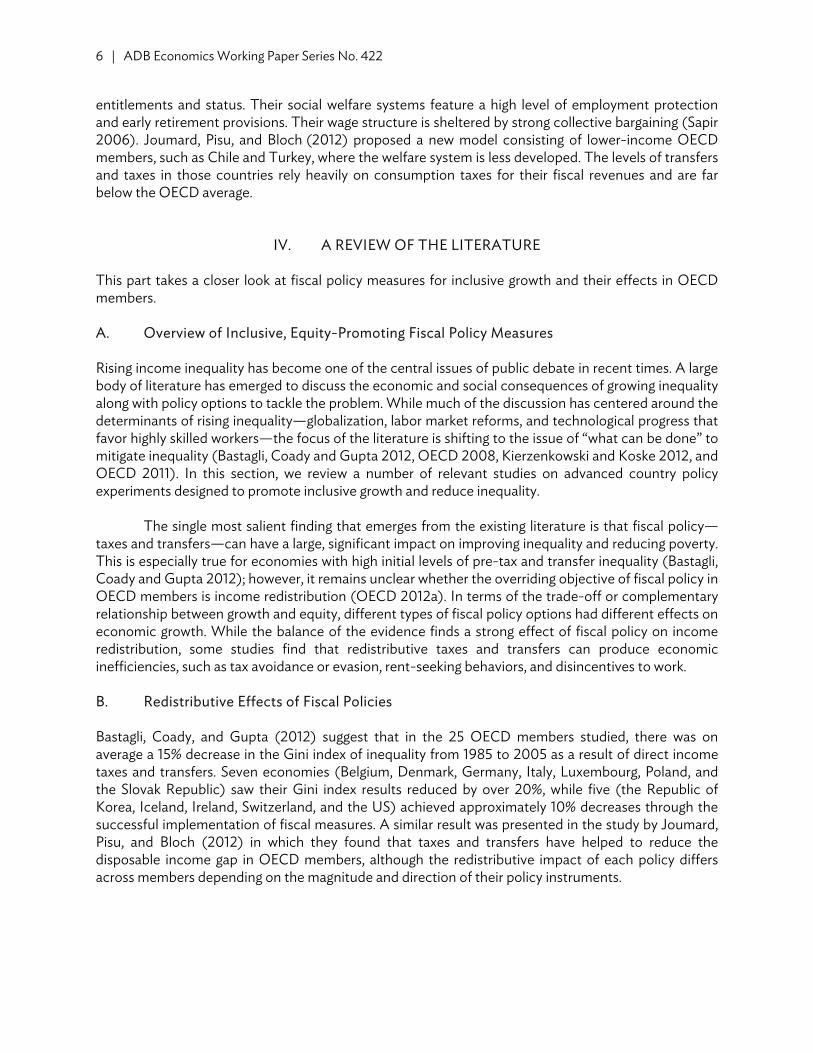
An alternative measure of relative government size is the ratio of total public expenditure to
GDP. One would expect a strong positive correlation between the tax revenue to GDP ratio and the public expenditure to GDP ratio. Figure 3 shows the public expenditure to GDP ratio in the OECD and developing Asia from 1990 to 2000 and from 2000 to 2010. As expected, there is a huge gap in the ratio between the two groups; more specifically, the ratio is about twice as large in the OECD. For both groups, the ratio is more or less the same during the 2 decades. The expenditure ratio is substantially larger than the tax ratio for both indicating sizable non-tax revenues as well as government borrowing. Figure 4 shows the total public expenditure to GDP ratio in 2011 for selected major economies in the OECD and developing Asia. The pattern across countries is similar to that of the tax revenue to GDP ratio with OECD members, in particular in Western Europe, having larger governments than those in developing Asia. Overall, the evidence resoundingly confirms the conventional wisdom that the state is larger in OECD members than in developing Asia.
0 10 20 30 40 50
Developing Asia
PRC
India
Indonesia
Republic of Korea
OECD
United States
Japan
Germany
France
%
4 | ADB Economics Working Paper Series No. 422
Figure 3: Development of Government Expenditures to Gross Domestic Product, Developing Asia and the Organisation for Economic
Co-operation and Development
GDP = gross domestic product. OECD = Organisation for Economic Co-operation and Development. Notes: Data are based on simple averages. Developing Asia comprises the People’s Republic of China, India, Indonesia, the Republic of Korea, Malaysia, Pakistan, the Philippines, Singapore, Sri Lanka, and Thailand. Source: IMF 2013b.
Figure 4: Expenditures to Gross Domestic Product Ratio for Selected Countries and Country Groups, 2012
OECD = Organisation for Economic Co-operation and Development, PRC = People’s Republic of China. Note: Data refers to general government. Source: IMF 2013b.
10
20
30
40
50
Developing Asia OECD
% o
f GD
P
1990s 2000s
0 10 20 30 40 50 60
Developing Asia
PRC
India
Indonesia
Republic of Korea
OECD
United States
Japan
Germany
France
%

Fiscal Policy and Inclusive Growth in Advanced Countries: Their Experience and Implications for Asia | 5
III. SOCIAL WELFARE MODELS Different groups of OECD members implement different mixes of policies to address income inequality and poverty reduction.1 Even within the same group, there are significant differences in terms of the relative importance of various fiscal policies. In order to examine and compare the fiscal policy regimes of OECD members, we referred to the classification of four social welfare model systems proposed by Sapir (2006) and Joumard, Pisu, and Bloch (2012) that incorporates the latest changes in the social welfare policies. The social welfare models are the Nordic, Anglo-Saxon, Continental European, and Mediterranean and Low Income. Each model is briefly described below.
The Nordic Model (Belgium, Denmark, Finland, Netherlands, and Sweden2) provides the highest levels of social protection expenditures and universal welfare cash transfers. To redistribute income, these countries adopt a high level of spending on in-kind transfers and a mix of taxes. This model features extensive fiscal interventions in labor markets while allowing strong labor unions. Promoting employment is a key policy objective. The countries that belong to this model combine economic dynamism with comprehensive social protection and are thus widely viewed as benchmarks to emulate.
The Anglo-Saxon Model3 includes Australia, Ireland, Japan, New Zealand, the United Kingdom
(UK), and the US. According to Sapir (2006), the countries in this group provide relatively large levels of social assistance. Cash transfers are primarily targeted to people of working age. Measures such as employment benefit schemes that allow access to regular employment are one essential, while weak unions, wide and increasing wage gaps, and a high incidence of low-paid employment are the main characteristics of this model. According to Joumard, Pisu, and Bloch (2012), Anglo-Saxon model countries make relatively less use of cash transfers and taxes to cope with income inequality. Transfers in Australia and New Zealand are targeted to low-income groups, while Japan and the US are characterized by limited progressivity in their cash transfers which are mostly spent on old-age pensions.
The Continental European Model4 of Austria, France, Germany, and Luxembourg depends heavily on insurance-based, non-employment benefits, and old-age pension contributions. Labor unions still remain strong, and regulations are further extended to the collective bargaining system to include non-union workers (Sapir 2006). Joumard, Pisu, and Bloch (2012) report that these countries use large cash transfers targeted primarily at old-age pensions and a tax mix that does not prioritize the promotion of redistribution across individuals. A small role for personal income tax is thus one of the key elements of this model.
The Mediterranean5 and Low-Income Model6 includes Greece, Italy, Portugal, and Spain. The model revolves around social spending on old-age pensions and permits a high segmentation of 1 According to Joumard, Pisu, and Bloch (2012) welfare systems have three main objectives: (i) redistribution of income
over the lifecycle; (ii) providing income maintenance or insurance to cope with adverse risks; and (iii) avoiding poverty or a too-wide dispersion in living standards. These benefits can be either universal or means tested.
2 Joumard, Pisu, and Bloch (2012) added Belgium into this group. 3 Sapir (2006) included Ireland and the United Kingdom; and Joumard, Pisu, and Bloch (2012) added Australia, Japan,
New Zealand, and the United States. 4 Sapir (2006) included Belgium in this group but we grouped Belgium into the Nordic model referring to Joumard, Pisu,
and Bloch (2012). 5 Berthold and Brunner (2008) grouped the countries as Nordic = Denmark, Finland, Norway and Sweden; Anglo-Saxon =
Great Britain and Ireland; Continental = Austria, Belgium, the Netherlands, Luxembourg, France, Germany, Switzerland; and South = Italy and Spain.
6 We incorporate the two models suggested by Sapir (2006) and Joumard, Pisu, and Bloch (2012).
6 | ADB Economics Working Paper Series No. 422
entitlements and status. Their social welfare systems feature a high level of employment protection and early retirement provisions. Their wage structure is sheltered by strong collective bargaining (Sapir 2006). Joumard, Pisu, and Bloch (2012) proposed a new model consisting of lower-income OECD members, such as Chile and Turkey, where the welfare system is less developed. The levels of transfers and taxes in those countries rely heavily on consumption taxes for their fiscal revenues and are far below the OECD average.
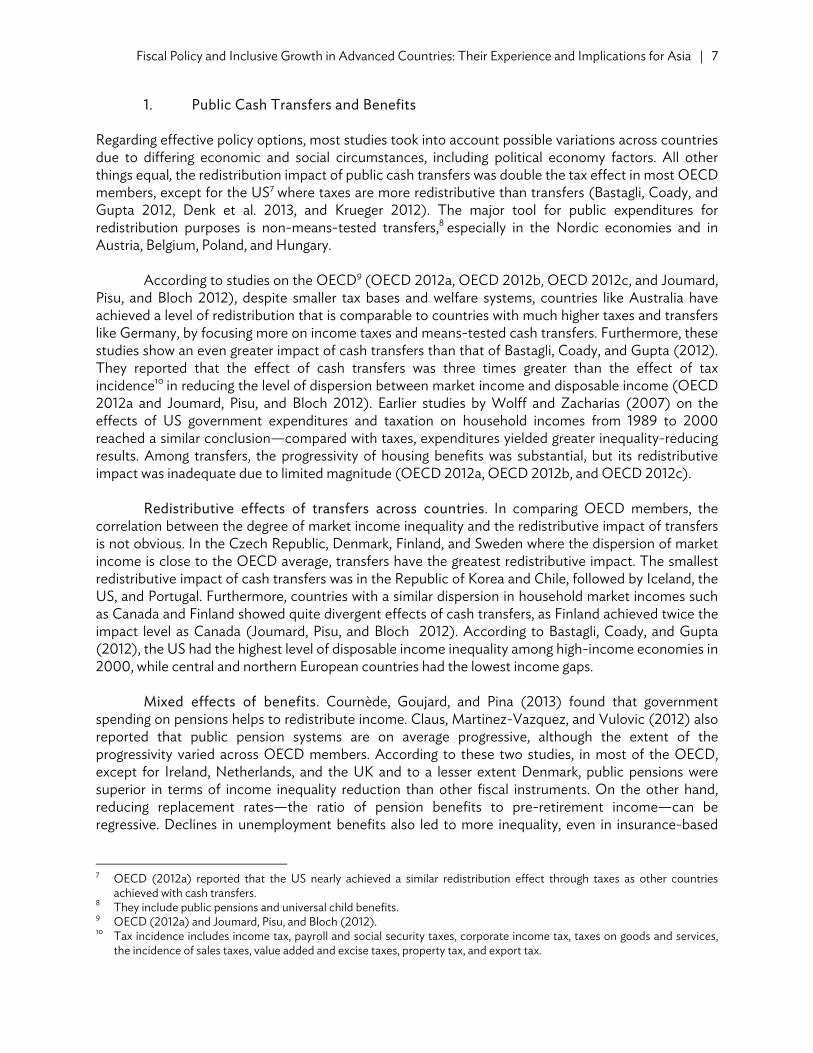
IV. A REVIEW OF THE LITERATURE This part takes a closer look at fiscal policy measures for inclusive growth and their effects in OECD members. A. Overview of Inclusive, Equity-Promoting Fiscal Policy Measures Rising income inequality has become one of the central issues of public debate in recent times. A large body of literature has emerged to discuss the economic and social consequences of growing inequality along with policy options to tackle the problem. While much of the discussion has centered around the determinants of rising inequality—globalization, labor market reforms, and technological progress that favor highly skilled workers—the focus of the literature is shifting to the issue of “what can be done” to mitigate inequality (Bastagli, Coady and Gupta 2012, OECD 2008, Kierzenkowski and Koske 2012, and OECD 2011). In this section, we review a number of relevant studies on advanced country policy experiments designed to promote inclusive growth and reduce inequality.
The single most salient finding that emerges from the existing literature is that fiscal policy—taxes and transfers—can have a large, significant impact on improving inequality and reducing poverty. This is especially true for economies with high initial levels of pre-tax and transfer inequality (Bastagli, Coady and Gupta 2012); however, it remains unclear whether the overriding objective of fiscal policy in OECD members is income redistribution (OECD 2012a). In terms of the trade-off or complementary relationship between growth and equity, different types of fiscal policy options had different effects on economic growth. While the balance of the evidence finds a strong effect of fiscal policy on income redistribution, some studies find that redistributive taxes and transfers can produce economic inefficiencies, such as tax avoidance or evasion, rent-seeking behaviors, and disincentives to work. B. Redistributive Effects of Fiscal Policies Bastagli, Coady, and Gupta (2012) suggest that in the 25 OECD members studied, there was on average a 15% decrease in the Gini index of inequality from 1985 to 2005 as a result of direct income taxes and transfers. Seven economies (Belgium, Denmark, Germany, Italy, Luxembourg, Poland, and the Slovak Republic) saw their Gini index results reduced by over 20%, while five (the Republic of Korea, Iceland, Ireland, Switzerland, and the US) achieved approximately 10% decreases through the successful implementation of fiscal measures. A similar result was presented in the study by Joumard, Pisu, and Bloch (2012) in which they found that taxes and transfers have helped to reduce the disposable income gap in OECD members, although the redistributive impact of each policy differs across members depending on the magnitude and direction of their policy instruments.
Fiscal Policy and Inclusive Growth in Advanced Countries: Their Experience and Implications for Asia | 7
1. Public Cash Transfers and Benefits Regarding effective policy options, most studies took into account possible variations across countries due to differing economic and social circumstances, including political economy factors. All other things equal, the redistribution impact of public cash transfers was double the tax effect in most OECD members, except for the US7 where taxes are more redistributive than transfers (Bastagli, Coady, and Gupta 2012, Denk et al. 2013, and Krueger 2012). The major tool for public expenditures for redistribution purposes is non-means-tested transfers,8 especially in the Nordic economies and in Austria, Belgium, Poland, and Hungary.
According to studies on the OECD9 (OECD 2012a, OECD 2012b, OECD 2012c, and Joumard, Pisu, and Bloch 2012), despite smaller tax bases and welfare systems, countries like Australia have achieved a level of redistribution that is comparable to countries with much higher taxes and transfers like Germany, by focusing more on income taxes and means-tested cash transfers. Furthermore, these studies show an even greater impact of cash transfers than that of Bastagli, Coady, and Gupta (2012). They reported that the effect of cash transfers was three times greater than the effect of tax incidence10 in reducing the level of dispersion between market income and disposable income (OECD 2012a and Joumard, Pisu, and Bloch 2012). Earlier studies by Wolff and Zacharias (2007) on the effects of US government expenditures and taxation on household incomes from 1989 to 2000 reached a similar conclusion—compared with taxes, expenditures yielded greater inequality-reducing results. Among transfers, the progressivity of housing benefits was substantial, but its redistributive impact was inadequate due to limited magnitude (OECD 2012a, OECD 2012b, and OECD 2012c).
Redistributive effects of transfers across countries. In comparing OECD members, the correlation between the degree of market income inequality and the redistributive impact of transfers is not obvious. In the Czech Republic, Denmark, Finland, and Sweden where the dispersion of market income is close to the OECD average, transfers have the greatest redistributive impact. The smallest redistributive impact of cash transfers was in the Republic of Korea and Chile, followed by Iceland, the US, and Portugal. Furthermore, countries with a similar dispersion in household market incomes such as Canada and Finland showed quite divergent effects of cash transfers, as Finland achieved twice the impact level as Canada (Joumard, Pisu, and Bloch 2012). According to Bastagli, Coady, and Gupta (2012), the US had the highest level of disposable income inequality among high-income economies in 2000, while central and northern European countries had the lowest income gaps.
Mixed effects of benefits. Cournède, Goujard, and Pina (2013) found that government spending on pensions helps to redistribute income. Claus, Martinez-Vazquez, and Vulovic (2012) also reported that public pension systems are on average progressive, although the extent of the progressivity varied across OECD members. According to these two studies, in most of the OECD, except for Ireland, Netherlands, and the UK and to a lesser extent Denmark, public pensions were superior in terms of income inequality reduction than other fiscal instruments. On the other hand, reducing replacement rates—the ratio of pension benefits to pre-retirement income—can be regressive. Declines in unemployment benefits also led to more inequality, even in insurance-based
7 OECD (2012a) reported that the US nearly achieved a similar redistribution effect through taxes as other countries
achieved with cash transfers. 8 They include public pensions and universal child benefits. 9 OECD (2012a) and Joumard, Pisu, and Bloch (2012). 10 Tax incidence includes income tax, payroll and social security taxes, corporate income tax, taxes on goods and services,
the incidence of sales taxes, value added and excise taxes, property tax, and export tax.
8 | ADB Economics Working Paper Series No. 422
systems. In the long-term, however, reducing the level of unemployment benefits generally lifted employment rates.
The size of cash transfers linked with disability and sickness benefits is large, especially in the
Netherlands and Nordic countries where the level of benefits was close to 3% of GDP in 2007, well above the average of 2% for other OECD members. Almost 6% of the working-age population across the OECD was covered by such benefits, and in some countries, the government allocation to disability and sickness benefits exceeded unemployment benefits (Joumard, Pisu, and Bloch 2012). Reducing disability benefits would increase inequality since the replacement rate tends to be higher for low-income earners. On the other hand, poorly targeted disability benefits may increase lifetime income inequality by reducing income mobility and creating poverty traps (Joumard, Pisu, and Bloch 2012 and Cournède, Goujard, and Pina 2013).
2. Redistributive and Progressive Effects of Income Taxes
The analysis of tax incidence in terms of who ultimately bears the burden of government taxes and the assessment as to whether its impact has been redistributive or progressive has been investigated in a vast body of literature. As is the case with other social benefit analyses, capturing solid evidence on the impact of different taxes remains challenging due to different economic conditions and social preferences in each country (OECD 2012a, OECD 2012b, OECD 2012c, and OECD 2011). Nonetheless, in terms of overall incidence, income taxes have been found to be the most redistributive tax in many economies. In some cases, income tax has achieved an even higher impact than that of means-tested transfers (Bastagli, Coady, and Gupta 2012). Personal income tax was especially progressive although there were significant differences across countries (OECD 2012a, OECD 2012b, OECD 2012c, and Joumard, Pisu, and Bloch 2012). Empirical evidence. Studies such as those by Kitao (2010) found that a reduction in income taxation stimulates an immediate incentive to work and save more, which in turn raises aggregate output and consumption. Temporary tax cuts and rebates improve the overall welfare of households, and the rebates are especially beneficial for low-income households. Jara and Tumino (2013) showed that the tax and benefit systems of 27 European Union (EU) countries have a significant effect on reducing inequality especially in Belgium, Germany, and Anglo-Saxon countries (the UK and Ireland) although the size of the effect varied substantially. Immervoll and Richardson (2011) found a similar result, i.e., taxes and benefits significantly reduced inequality. Other studies on income taxes found that advanced economies have a tendency to raise their tax revenues by imposing higher marginal rates on the highest income groups. Taxes on capital and wealth are also widely used in the OECD to promote equity. Changes in personal and corporate income taxes show a significant short-term output effect (Mertens and Ravn 2013). Furthermore, personal income tax is usually associated with larger multipliers than corporate income tax (IMF 2013a).
Adverse effects of taxation and tax system design. The International Monetary Fund (IMF) (2013a) argues that more progressive taxation on higher income groups is needed to mitigate widening income gaps, but in the era of globalization, the imposition of higher tax rates on wealth and capital can provoke tax evasion and avoidance. Zucman (2013) showed that almost 8% of the global financial wealth of households was in the custody of tax haven countries. The OECD (2012a) reported that the size of the tax revenue to GDP ratio does not always result in the same redistributive impact. The empirical evidence found a dissimilar impact across countries with similar ratios. Some high-tax countries showed little progressivity because (i) the tax mix favored consumption taxes and social security contributions rather than progressive personal income, and wealth and inheritance taxes; (ii)
Fiscal Policy and Inclusive Growth in Advanced Countries: Their Experience and Implications for Asia | 9
the progressivity of tax schedules was limited; or (iii) statutory progressivity was weakened by tax expenditures that benefitted high-income groups (OECD 2012a).
V. FISCAL POLICIES, POVERTY REDUCTION, AND THE EQUITY- EFFICIENCY TRADE-OFF
We explore some evidence that fiscal policies have a regressive effect in OECD members and on poverty reduction as well as the trade-off between equity and efficiency. A. Regressive Effects of Fiscal Policies In most OECD members, social security contributions, consumption taxes, and real estate taxes tend to be regressive (OECD 2012a, Joumard, Pisu, and Bloch 2012, and IMF 2013a). Tax exemptions or credits pertaining to personal income tax were more likely to profit the rich, except for in-work tax credits (OECD 2012a, and Joumard, Pisu, and Bloch 2012). Similar evidence was found by Muinelo-Gallo and Roca-Sagalés (2013) for 21 high-income OECD members. Cutting non-redistributive expenditures was found to be the most effective fiscal policy to simultaneously stimulate GDP growth and reduce income inequality. Bargain (2012) suggested that in the absence of reforms to income support and tax credits, inequality and poverty depth would have been amplified, and child poverty would not have been sharply reduced.
A study by Silva, Carvalho, and Ribeiro (2013) on the magnitude of fiscal multipliers in Europe11 found that the tax multiplier was higher in recessions, while fiscal consolidation had a negative effect on tax multipliers. Peñalosa and Turnovsky (2011) found that tax reforms that target labor supply will affect wealth and income distribution, which in turn will either reinforce or offset the redistributive impact of taxes in the US and European economies. Considering different ways of financing government expenditure, they found that policies that reduced the labor supply and output also led to a more equal distribution of after-tax income.
Kuttner and Posen (2002) investigated the effectiveness of Japanese fiscal policy from 1976 to
1999. Expansionary fiscal policies such as tax cuts or increased public expenditure did substantially stimulate the economy. The results implied that the tax cut multiplier was 25% higher over a 4-year horizon than the public spending multiplier. An analysis of historical data showed that the retrenchment of Japanese fiscal policy in the 1990s led to a significant slowdown in growth. Most of the increase in public debt was associated with declining tax revenues due to the recession. On the other hand, in an analysis of the impact of the US fiscal policy on inequality, Kenworthy and Smeeding (2013) found that actual changes in tax or transfer policies did not increase the level of inequality. B. Fiscal Policy and Poverty Reduction12
Thompson and Smeeding (2013) explored trends in inequality and poverty in the US using both market income, and after-tax and transfer income between 2008 and 2010. The effects of tax and transfer policies were not uniform across the population. Poverty declined among the elderly, changed
11 The study used tax spending and revenue variables with annual data from 1998 to 2008. 12 Poverty reduction instruments include price controls on housing rents, minimum wages, and interest rate controls on
deposits and loans, foreign exchange rationing, import quotas, and restrictions on exports (OECD 2012a).
10 | ADB Economics Working Paper Series No. 422
little among children, and rose sharply among the working-age population. Inequality fell across the entire population, but no change was seen among working-age households.
Gemmell and Morrissey (2005) reviewed the effect of various tax structure reforms on income distribution and poverty reduction in developing countries. The study suggested that taxes on exports and necessity goods consumed by the public—especially by the poor—proved to be significantly and consistently regressive, whereas taxes on luxury goods, such as cars, had a tendency to be progressive. Sales taxes were more progressive or at least less regressive than import taxes.
The OECD (2008) reported that income poverty among the elderly had declined, while the
poverty level of young adults and families with children had risen. The report suggests that providing an opportunity to work is one of the most effective tools for tackling poverty. Poverty rates among jobless families were nearly 6 times higher than those among working families; however, work alone was not the solution for preventing poverty since more than half of the poor consisted of households with low-wage workers. In-work benefits that supplement earnings were therefore proposed as a major measure for reducing in-work poverty among this group. The mixed evidence on the impact of taxation policy and cash transfers in addressing income inequality and poverty reduction across countries has led to an investigation of the correlation between equity and efficiency in fiscal policy. C. Equity and Growth: Trade-off or Complementary? Among policymakers and academics, there has been a lot of debate about the level of economic inefficiency caused by income redistribution via tax and benefit systems. The inefficiency arises because they can produce work disincentives across income distributions. Bastagli, Coady, and Gupta (2012) suggested that well-designed policies can minimize this equity-efficiency trade-off. They argue that a large part of the inefficiency is caused by means-tested social benefits due to the diminishing returns of benefits as earnings increase. More specifically, this refers to the strong disincentives for low-skilled workers to find employment opportunities (OECD 2012a, OECD 2012b, and OECD 2012c). Despite a vast body of theoretical literature on the link between inequality and growth, no general consensus has emerged, and the empirical evidence is rather inconclusive (OECD 2012a).
In a recent report, the IMF (2013a) suggests that among major taxes, corporate income taxes have the most negative effect on growth, followed by personal income taxes, then consumption taxes, and finally, property taxes. Jara and Tumino (2013) also confirmed the presence of a trade-off between income inequality and work incentives in the EU based on their analysis of the impact of fiscal policy across 27 EU member states. Empirical studies such as Berthold and Brunner (2008) found a persistent trade-off between equity and efficiency as well as a negative effect of social spending on GDP in their analysis of four different European welfare models.13 The preferences of the citizens of each country and the electoral process determine the level of income redistribution.
D. Design of Social Welfare Systems and Equity-Efficiency Trade-offs Various studies suggested that the institutional design of a welfare system to a certain extent can alleviate the degree of inefficiency (See, e.g., IMF 2013a, Bastagli, Coady, and Gupta 2012, and OECD 2012a). Among the four social welfare models, the institutional design of the Nordic system has proven to be more efficient than the others and therefore faces a smaller trade-off. The OECD
13 The four models are Nordic (Denmark, Finland, Norway Sweden,); Anglo-Saxon (Great Britain, Ireland); Continental
(Austria, Belgium, the Netherlands, Luxembourg, France, Germany, Switzerland) and South (Italy, Spain).

Fiscal Policy and Inclusive Growth in Advanced Countries: Their Experience and Implications for Asia | 11
(2012a) reported that some tax reforms have win-win characteristics by simultaneously improving growth prospects and reducing the income gap. In contrast, many of the reforms may involve trade-offs depending on their design and targeting. The fiscal policy patterns of OECD members along with their growth and equity effects are summarized in Table 1 and Table 2.14 Table 1 groups OECD members into five categories based on their levels of income inequality, while Table 2 outlines the growth and equity effects of different fiscal policies in the OECD.
Table 1: Organisation for Economic Co-operation and Development Members' Fiscal Policy Patterns
Category and
Level of Inequality
Group 1a Group 2 Group 3 Group 4 Group 5
Lowerb Inequality Intermediate
Inequality Higher Inequality Member Denmark
Iceland Norway Sweden
Switzerland
BelgiumCzech Republic
Estonia Finland Franceb
Italy Slovak Republic
Slovenia
AustriaGermany Greece
Hungary Japan
Republic of Korea Luxembourg
Poland Spain
Australia Canada Irelandb
Netherlands New Zealand
United Kingdom
ChileIsrael
Mexico Portugal Turkey
United States
Pattern Low dispersion in labor income
(high employment rate and little
wage dispersion)
Average dispersion in labor income (little wage variation but
low employment or high part-time rate); Highly concentrated
capital and self-employment income
Individual labor income is
concentrated, reflecting above
average dispersion in wages and a low
employment or high part-time
rate
Above average wage dispersion coupled with a high part-time
rate
High concentration of labor, capital and self-employment
income
Policy Cash transfers tend to be
universal and taxes are not
highly progressive
Cash transfers (largely insurance-
based) and taxes are not highly
progressive
Taxes and transfers are not
highly progressive
Cash transfers are targeted and
taxes are progressive
The poverty rate is high
Notes: a Organisation for Economic Co-operation and Development (OECD) 2012a used the term cluster instead of group. b “Inequality in household disposable income.” Source: Figure 5.6 Country groups with similar patterns of inequality, OECD 2012a.
14 OECD 2012a summarized the policy effects based on Joumard, Pisu, and Bloch 2012.

12 | ADB Economics Working Paper Series No. 422
Table 2: Summary of Fiscal Policy Effects of the Organisation for Economic Co-operation and Development Members
Policy Effects Income
Inequality GDP Growth Increasing total tax revenues ● The impact of taxes on income distribution depends on the level of taxation, the tax
mix, and the use of tax revenues; but if tax systems are progressive overall, equality is enhanced.
● Taxes dampen incentives to work, save, and invest, and are thus detrimental to growth; but some taxes have a less adverse effect than others.
Positive (in general)
Negative
Changing the tax mix while keeping total tax revenues constantMoving from personal income tax to consumption taxes: ● Personal income tax tends to be progressive, while consumption tax is regressive. ● Personal income tax reduces work and saving incentives. A shift from direct to indirect
taxes would raise GDP per capita.
Negative Positive
Moving from labor income to property and capital taxes:1) Wealth, inheritance taxes, and capital taxes.
- Wealth and inheritance taxes tend to be progressive. - The distributive impact depends on the relative progressivity of income versus
wealth and inheritance tax. 2) Real estate taxes: ● Real estate taxes are often less progressive than personal income tax and can even be
regressive. ● Property taxes are among the least harmful for growth. Moving from income to
property taxes tends to improve incentives to work and invest, and thus raise output at least in the short- and medium-term.
Ambiguous Negative
Positive Positive
Cutting tax expenditures and marginal tax rates:● Most tax expenditures benefit high-income groups (in-work tax credits and other tax
expenditures targeted at low-income groups are the exception). Cutting tax expenditure would narrow the distribution of disposable income.
● Cutting marginal rates improves incentives to work, save and invest, and thus lifts the GDP per capita
Positive in most cases but in-work tax credit is negative
Positive
Increasing the progressivity of taxes (but revenue-neutral)Personal income tax: In-work tax credits narrow the income distribution and raise incentives to work. 1) Increase in top rates. ● On the other hand, higher top rates may reduce working hours and productivity by
undermining incentives to work, invest, and innovate. 2) The above measure combined with expanded earned income tax credit schemes or
tax-free allowances. ● The GDP per capita impact is thus ambiguous.
Positive Positive Positive
Ambiguous Negative Positive
GDP = gross domestic product. Source: Table 5.3 in OECD 2012a.
In order to minimize the equity-efficiency trade-offs of fiscal policies, many OECD members have implemented in-kind benefits that link the receipt of benefits to employment. Countries have also extended the use of efficient labor market programs to tighten the rules for continued eligibility for unemployment benefits, including tougher job search and training requirements; however, designing

Fiscal Policy and Inclusive Growth in Advanced Countries: Their Experience and Implications for Asia | 13
and implementing such policies requires a high level of administrative capacity. Furthermore, the equity effect of fiscal policies is amplified when indirect taxes and in-kind benefits are supplemented with other measures (Bastagli, Coady, and Gupta 2012).
VI. POLICY IMPLICATIONS FOR DEVELOPING ASIA Advanced countries have a much longer history and tradition of using fiscal policy to promote equity than developing Asia has. As such, their experience can provide some guidance for developing Asia in its quest for inclusive fiscal policy that contributes to inclusive growth. Given the huge gaps in income and development levels between the two groups, we must exercise a great deal of caution in making policy inferences for developing Asia from the experience of the advanced economies. Notwithstanding this important caveat, the latter’s wealth of experience in inclusive fiscal policy holds some valuable lessons for the former.
The central objective of this paper was to review that experience in order to draw relevant policy lessons for Asia. The single biggest overall lesson is that fiscal policy can be a powerful instrument for tackling inequality and creating a more equitable economy. This should give Asian governments a measure of confidence that at a very broad level, fiscal policy can be a useful tool for fostering more inclusive growth in the region. To be sure, overall government size and public expenditures that can reduce inequality are markedly higher in advanced countries than in developing Asia. Be that as it may, the significant impact of fiscal policy on inequality in the advanced economies suggests that developing Asia too can leverage fiscal policy to promote equity.
With respect to the relative effectiveness of different types of fiscal policies, the evidence from the OECD resoundingly indicates that public spending has a noticeably larger effect on inequality than taxation and other fiscal revenue policies. In particular, the OECD experience indicates that among the different components of public spending, transfers can significantly reduce inequality. Given the much larger level of transfers in advanced economies, it is unclear whether transfers can have the same equity-promoting impact in developing Asia. Furthermore, it is unlikely that the level of transfers in the region will rise to OECD levels in the foreseeable future. Nevertheless, the OECD experience suggests that well-targeted transfers that benefit poor, vulnerable, and disadvantaged groups will be effective tools for inclusive growth in Asia. For example, more public spending on pensions will protect Asia’s growing elderly population which faces the risk of widespread old-age poverty.
We saw that the trade-off between efficiency and equity was an important consideration in
designing and implementing equity-promoting fiscal policy measures even in the relatively rich advanced economies. The trade-off takes on a much greater significance in developing Asia where there is a much greater need for economic efficiency and growth due to low-income levels and still widespread poverty. The OECD experience indicates that generous public expenditures often create inefficiencies such as work disincentives. Its urgent need for sustained rapid growth to lift general living standards and reduce poverty means that Asia can still afford such inefficiencies. Therefore, it is advisable for Asian policymakers to take such disincentives fully into account, for example, by pursuing active labor market policies or measures to encourage work. In this sense, the Nordic model of social welfare probably contains many useful lessons for Asian economies.
Sustained rapid growth has reduced poverty on a massive scale in developing Asia in the past, and economic growth will continue to play a key role in reducing poverty. One vital element of Asia’s sustained growth has been macroeconomic stability underpinned by fiscal prudence. While there are

14 | ADB Economics Working Paper Series No. 422
exceptions, by and large, Asian governments have been fiscally responsible which has given them fiscal space, an invaluable asset for both short-term objectives like the fiscal stimulus during the 2008–2009 global crisis, and long-term objectives like inclusive fiscal policy. The contrast with advanced economies is striking. Partly as a result of large public transfers, their government debt has reached very high levels compared to that of developing Asian economies (Figure 5). The salient lesson for Asian governments is that, as they pursue more inclusive fiscal policies, they must tax and spend efficiently in order to maintain fiscal sustainability and economic growth.
Figure 5: Gross Government Debt to Gross Domestic Product Ratio for Selected Countries and Country Groups, 2012
GDP = gross domestic product, PRC = People’s Republic of China. Note: Weighted by gross domestic product. Source: IMF Fiscal Monitor Database, October 2013.
0 50 100 150 200 250
Advanced economies
Japan
United States
France
Germany
Developing Asia
India
Republic of Korea
PRC
Indonesia
% of GDP
REFERENCES Acosta-Ormaechea, S. and J. Yoo. 2012. Tax Composition and Growth: A Broad Cross-Country
Perspective. IMF Working Paper Series. No. WP/12/257. Washington, DC: International Monetary Fund.
Asian Development Bank (ADB). 2012. Asian Development Outlook 2012 Confronting Rising Inequality
in Asia. Manila. Bargain, O. 2012. The Distributional Effects of Tax-Benefit Policies under New Labor: A
Decomposition Approach. Oxford Bulletin of Economics and Statistics. 74 (6). pp. 856–874. Bastagli, F., D. Coady, and S. Gupta. 2012. Income Inequality and Fiscal Policy. IMF Staff Discussion
Note. No. SDN/12/08. Washington, DC: International Monetary Fund. Berthold, N. and A. Brunner. 2008. The Struggle between Equity and Efficiency: Do Nordic Countries
Have a Free Lunch? University of Würzburg Working Paper. No. 103. Würzburg: Leibniz Information Centre for Economics.
Claus, I., J. Martinez-Vazquez, and V. Vulovic. 2012. Government Fiscal Policies and Redistribution in
Asian Countries. ADB Economics Working Paper Series. No. 310. Manila: Asian Development Bank.
Cournède, B., A. Goujard, and A. Pina. 2013. How to Achieve Growth- and Equity-Friendly Fiscal
Consolidation? A Proposed Methodology for Instrument Choice with an Illustrative Application to OECD Countries. OECD Economics Department Working Papers No. 1088. Paris: Organisation for Economic Co-operation and Development. http://dx.doi.org/10.1787/ 5k407lwvzkkh-en
Denk, O., R. Hageman, P. Lenain, and V. Somna. 2013. Inequality and Poverty in the United States:
Public Policies for Inclusive Growth. OECD Economics Department Working Papers. No. 1052. Paris: Organisation for Economic Co-operation and Development. http://dx.doi.org/10.1787/ 5k46957cwv8q-en
Gemmell, N. and O. Morrissey. 2005. Distribution and Poverty Impacts of Tax Structure Reform in
Developing Countries: How Little We Know. Development Policy Review. 23 (2). pp. 131–144. International Monetary Fund (IMF) 2013a. Fiscal Monitor, October 2013. Washington, DC. ———. 2013b. Government Finance Statistics online database. http://elibrary-data.imf.org/
DataExplorer.aspx (accessed 29 October 2013). Immervoll, H. and L. Richardson. 2011. Redistribution Policy and Inequality Reduction in OECD
Countries: What Has Changed in Two Decades? OECD Social, Employment, and Migration Working Paper Series. No. 122. Paris: Organisation for Economic Co-operation and Development.

16 | References
Jara, H. X. and A. Tumino. 2013. Tax-Benefit Systems, Income Distribution and Work Incentives in the European Union. EUROMOD Working Paper Series. No. EM 7/13. Essex, UK: Institute for Social and Economic Research.
Joumard, I., M. Pisu, and D. Bloch. 2012. Tackling Income Inequality: The Role of Taxes and Transfers.
OECD Journal: Economic Studies. http://dx.doi.org/10.1787/eco_studies-2012-5k95xd6l65lt Kenworthy, L. and T. Smeeding. 2013. Growing Inequalities and Their Impacts in the United States.
GINI Country Report United States, January. The GINI Project. Kierzenkowski, R. and I. Koske. 2012. Less Income Inequality and More Growth: Are They Compatible?
Part 8. The Drivers of Labour Income Inequality: A Literature Review. OECD Economics Department Working Papers. No. 931. OECD Publishing. http://dx.doi.org/10.1787/5k9bls1hlzkk-en
Kitao, S. 2010. Short-run Fiscal Policy: Welfare, Redistribution and Aggregate Effects in the Short and
Long-run. Journal of Economic Dynamics & Control. 34. pp. 2109–2125. Krueger, A. 2012. The Rise and Consequences of Inequality in the United States. Paper presented to
the Center for American Progress. Washington, DC. 12 January. Kuttner, K. N. and A. S. Posen. 2002. Fiscal Policy Effectiveness in Japan. Journal of the Japanese and
International Economies. 16. pp. 536–558. Mertens, K. and M. O. Ravn. 2013. The Dynamic Effects of Personal and Corporate Income Taxes in
the United States. American Economic Review. 101. pp. 1212–1247. Muinelo-Gallo, L. and O. Roca-Sagalés. 2013. Joint Determinants of Fiscal Policy, Income Inequality
and Economic Growth. Economic Modeling. 30. pp. 814–824. Organisation for Economic Co-operation and Development (OECD). 2008. Growing Unequal?
Income Distribution and Poverty in OECD Countries. Paris. ———. 2011. An Overview of Growing Income Inequalities in OECD Countries: Main Findings. Divided
We Stand Why Inequality Keeps Rising Paris. ———. 2012a. Reducing Income Inequality while Boosting Economic Growth: Can It Be Done?
Economic Policy Reforms 2012 Going for Growth PART II Chapter 5. Paris. ———. 2012b. Inequality in Labor Income: What Are Its Drivers and How Can It Be Reduced? OECD
Economics Department Policy Notes. No. 8. Paris. ———. 2012c. Income Inequality and Growth: The Role of Taxes and Transfers. OECD Economics
Department Policy Notes. No. 9. Paris. ———. 2013. OECD.StatExtracts. http://stats.oecd.org (accessed 29 October 2013). Peñalosa, C. G. and S. J. Turnovsky. 2011. Taxation and Income Distribution Dynamics in a Neoclassical
Growth Model. Journal of Money, Credit and Banking. 43 (8). pp. 1543–1577.

References | 17
Sapir, A. 2006. Globalization and the Reform of European Social Models. Journal of Common Market Studies. 44 (2). pp. 369–390.
Silva, R., V. M. Carvalho, and A. P. Ribeiro. 2013. How Large are Fiscal Multipliers? A Panel-Data VAR
Approach for the Euro Area. FEP Working Papers. No. 500. Porto: Faculty of Economics of the University of Porto.
Thompson, J. P and T. M. Smeeding. 2013. Inequality and Poverty in the United States: The Aftermath
of the Great Recession. Finance and Economics Discussion Series. Divisions of Research & Statistics and Monetary Affairs. Washington, DC: Federal Reserve Board.
Wolff, E. N. and A. Zacharias. 2007. The Distributional Consequences of Government Spending and
Taxation in the U.S., 1989 and 2000. Review of Income and Wealth. 53 (4). pp. 692–715. World Bank. 2014. World Development Indicators online database. http://databank.worldbank.org/
data/views/variableSelection/selectvariables.aspx?source=world-development-indicators (accessed 31 January 2014).
Zucman, G. 2013. The Missing Wealth of Nations: Are Europe and the U.S. Net Debtors or Net
Creditors? Quarterly Journal of Economics. 128 (3). pp. 1321–1364.
ASIAN DEVELOPMENT BANK
AsiAn Development BAnk6 ADB Avenue, Mandaluyong City1550 Metro Manila, Philippineswww.adb.org
Fiscal Policy and Inclusive Growth in Advanced CountriesTheir Experience and Implications for Asia
The study seeks to draw relevant lessons from the advanced economies for developing Asia in using fiscal policy to tackle inequality. The experience of the advanced economies clearly shows the sizable equity-promoting potential of fiscal policy. At the same time, developing Asia’s pursuit of more inclusive fiscal policy must not come at the expense of economic growth or fiscal sustainability.
About the Asian Development Bank
ADB’s vision is an Asia and Pacific region free of poverty. Its mission is to help its developing member countries reduce poverty and improve the quality of life of their people. Despite the region’s many successes, it remains home to approximately two-thirds of the world’s poor: 1.6 billion people who live on less than $2 a day, with 733 million struggling on less than $1.25 a day. ADB is committed to reducing poverty through inclusive economic growth, environmentally sustainable growth, and regional integration.
Based in Manila, ADB is owned by 67 members, including 48 from the region. Its main instruments for helping its developing member countries are policy dialogue, loans, equity investments, guarantees, grants, and technical assistance.
FIsCAl PolICy AnD InClusIve Growth In ADvAnCeD CountrIes: theIr exPerIenCe AnD ImPlICAtIons For AsIAAlmas Heshmati, Jungsuk Kim, and Donghyun Park
adb economicsworking paper series
no. 422
december 2014