fiscal federalism in nigeria: a cluster analysis of revenue
TRANSCRIPT
CBN Journal of Applied Statistics Vol. 3 No.1 65
Fiscal Federalism in Nigeria: A Cluster Analysis of Revenue
Allocation to States and Local Government Areas, 1999 – 2008
Sam O. Olofin1, Olusanya E. Olubusoye
2, Ajide K.Bello
3, Afees A. Salisu
4
and Akinola S. Olalekan5
Existing literature on revenue allocation in Nigeria shows more concern for merits and
demerits of sharing principles and /or formulae. Several alternatives have been proposed
and will continue to be developed to address the unending agitations from beneficiaries.
Contrary however, this paper analyzes two items of revenue (statutory and VAT) shared
among the states including FCT and all the Local Government Areas (LGAs) between
May 1999 and December 2008. The net statutory allocation after deductions was also
analyzed. Using Cluster analysis to evaluate revenue allocation in Nigeria, States and
LGAs exhibiting similarity in revenue received were grouped and their common features
highlighted. The result of this exercise may be a pointer to resolving the issue of viability
when combined with other statistics.
Key Words: Cluster Analysis, Revenue Allocation, Fiscal Federalism, Statutory
Allocation, VAT.
JEL Classification: C38, H71, H77
1.0 Introduction
The importance of revenue generation, allocation as well as its distribution
towards maintaining both the existing and new socio-politico-economic structure
in any economy be it centrally planned, market or mixed economies cannot be
overemphasized. To this end, what revenue is to an individual or a firm is what it
is to the government. Thus, revenue allocation and its distribution remain a vitally
sensitive issue which continues to spark off reactions from all stakeholders at all
times. This is more so in the sub-Saharan region and particularly in Nigeria where
ethnic plurality and language heterogeneity characterize the country’s existence.
1Professor and Director, Centre for Econometric and Allied Research (CEAR), Department of Economics,
University of Ibadan, Ibadan, Nigeria. Email: [email protected]; Phone: 08052001932. 2Department of Statistics and Research Fellow, Centre for Econometric and Allied Research (CEAR),
Department of Economics, University of Ibadan, Ibadan, Nigeria. Email: [email protected];
[email protected]. Phone: 08058258883. 3Department of Economics, University of Lagos, Lagos.
4Centre for Econometric and Allied Research (CEAR), Department of Economics, University of Ibadan,
Ibadan, Nigeria. Email: [email protected], [email protected]; Phone: 08034711769. 5Department of Computer Science, University of Ibadan, Ibadan

66 Fiscal Federalism in Nigeria: A Cluster Analysis of Revenue Allocation
to States and Local Government Areas, 1999 – 2008 Olofin et al
In recent years, the issues of resource control, revenue allocation and fiscal
federalism have dominated discussions at various levels of Nigeria’s political
debate. Like most federal systems, Nigeria has a revenue distribution system in
which the federal government shares revenue with the states and local
governments. Different formulas at different times have been adopted. Similarly,
at different times, ad hoc commissions have been set up to determine the
allocation formulae and criteria. Between 1946 and 1979, there were eight of such
commissions on revenue allocation. These were: Phillipson (1946), Hicks-
Phillipson (1951), Chick (1953), Raisman (1958), Binns (1964), Dina (1968),
Aboyade (1977), and Okigbo (1980). It was not until 1988 that a permanent body
was created to monitor, review, and advise the federal government on RAS on a
continuing basis. The new body, called the National Revenue Mobilization,
Allocation, and Fiscal Commission, represents a structured attempt to replace the
ad hoc approaches to effecting changes in the RAS. This body is enshrined in the
1989 Constitution.
Despite these efforts, revenue allocation has remained a contentious issue among
the three tiers of government in Nigeria. In the last eight years, the 36 state
governments have been at daggers-drawn with the Federal Government over the
formulation of a revenue sharing formula that would be acceptable to all the
stakeholders. One major impact of this seemingly never ending controversy is the
fact that fiscal federalism in Nigeria has not been able to contribute optimally to
social and economic development. Despite the considerable increase in the
number of administrative units, the rate of real economic growth has been low and
the country’s per capita income has declined considerably over the years
compared with the level that was attained in the 1980s. As the nation operates a
new era of democracy under a federal constitution, there is the need to critically
review the division of functions among the various tiers of governments, as well
as the revenue sharing arrangements in order to substantially improve the delivery
of public goods and services as well as promote real economic growth.
The available literature on revenue allocation in Nigeria focuses mostly on
justifying a particular sharing formula or proposing a new one. Notable among
this category are: Phillips (1991) and Aluko (2002, 2004). Other studies including
Anyanwu (1999), Aigbokhan (1999), Ebajemito and Abudu (1999), Okon and
Egbon (1999), seem to discuss generally about fiscal federalism by diagnosing the
Nigeria situation and proffering solutions. Hitherto, no attempt has been made to
even analyse the various allocations made to all the tiers of government. Some of

CBN Journal of Applied Statistics Vol. 3 No.1 67
the immediate puzzling issues that need to be examined critically from the
previous allocations include the following:
To what extent is similarity or difference in the revenue allocation in
Nigeria distributed at the state and local government levels?
Is the similarity or difference consistent across the basic components of the
revenue allocation?
The present study aims at providing answers to these immediate questions as well
as serving as a platform for raising a number of pertinent issues as basis for
further research into areas that are likely to be of great interest for policy analysis,
political analysts, and the parliamentarians who have responsibility for creating
states. Thus, the study specifically intends to analyze and conduct a comparative
analysis of revenue allocation among geo-political zones, states and local
governments and attempt to classify them using cluster analytical framework.
The study’s contributions are in two-fold: first, employing cluster analysis to
examine the state and local governments with similar (dissimilar) features in terms
of revenue allocation using specific item of revenue such as statutory allocation,
value-added tax, and net statutory allocation. Second, attempt is made to group
these tiers of government based on financial resources available to them.
Following the introduction, the rest of this paper is structured as follows: section
two presents a brief review of relevant literature on revenue allocation in Nigeria;
section three presents the methodology while section four gives the analysis of
results, section five provides the concluding remarks.
2.0 Literature Review
A large number of studies have been conducted on fiscal federalism and revenue
allocation both in the developed and developing countries. However, the focus of
majority of these studies usually revolves around examining the structure, pattern,
trends and impact analysis of revenue allocation on economic growth. In a panel
data analysis, Davoodi and Zou (1998) find a weakly significant negative relation
between the degree of fiscal federalism and the average growth rate of GDP per
capita for a sample of 46 countries over the period from 1970 to 1989. For the
sub-sample of industrial countries, this effect is not significant. The negative
influence for developing countries is robust though only weakly significant as
well. According to these estimates, an additional decentralization of spending by
10 percent reduces the growth of real GDP per capita in developing countries by
0.7 – 0.8 percentage points.
68 Fiscal Federalism in Nigeria: A Cluster Analysis of Revenue Allocation
to States and Local Government Areas, 1999 – 2008 Olofin et al
Woller and Philipps (1998) also cannot find a robust relation between economic
growth and decentralization, using a sample with a lower number of developing
countries and a shorter time period.
In an empirical analysis for average economic growth of the past 25 years in a
cross-section of 91 countries, Enikolopov and Zhuravskaya (2003) show that the
effects of fiscal decentralization depend to a large extent on the structure of the
party system as well as on the degree of “subordination” of subnational levels.
According to them, especially in developing and transition countries, the age of
the most important political parties is favorable to the positive effects of
decentralization on economic growth. In countries with a – in this respect weaker
– party system, a 10 percent increase of decentralization of revenue decreases real
per capita GDP growth by 0.14 percentage-points. These results are in contrast to
those of Martinez-Vazquez and McNab (2002). The latter finds that the
decentralization of revenue significantly reduces the growth of real GDP per
capita of developed countries, but not of the developing and transition countries.
Yilmaz (2000) analyzes the different effects of fiscal decentralization in 17
unitary and 13 federal countries for the period 1971-1990 with annual data.
Decentralization of expenditures to the local level increases the growth of real
GDP per capita in unitary states more strongly than in federal states. However, the
decentralization to the intermediate level in federations is not significant. Thießen
(2003) analyzes the average growth rates of real GDP per capita for a cross-
section of 21 developed countries in the period 1973-1998 and in a parallel study
(Thießen, 2003a) for a panel of 26 countries between 1981 and 1995. According
to his estimates, a 10 percent increase of decentralization of expenditures
increases the growth of real GDP per capita by 0.12-0.15 percentage points in
high-income countries. However, the relation between federalism and economic
growth might be non-linear, because the quadratic term of expenditure
decentralization is significantly negative.
The empirical results concerning the impact of decentralization on economic
growth for individual countries also appear to be ambiguous. To date, the
discussion is limited to China, the US, and Germany. Zhang and Zou (1998) note
a significantly negative effect of expenditure decentralization on economic growth
in 28 Chinese provinces, using annual data between 1987 and 1993. Jin et al.
(1999) however, report a weekly significant positive effect of expenditure
decentralization on economic growth of almost the same sample of Chinese
provinces over time. The most important difference between the studies is the use

CBN Journal of Applied Statistics Vol. 3 No.1 69
of time dummies that are not included by Zhang and Zou (1998). Consequently,
symmetric shocks are not adequately controlled for. Lin and Liu (2000) strengthen
the result of a positive relation between decentralization and economic growth in
Chinese provinces for the period 1970 to 1993 also for the revenue side. In
addition, higher responsibility of public budgets at the provincial level is
connected with increased economic growth. These authors also use time dummies
in addition to fixed cross-section effects. The relevance of using time dummies
points to the strong economic dynamics in China. The sometimes enormously
high Chinese growth rates apparently cannot be captured by structural variables
alone so that auxiliary variables for the individual years are necessary for
correctly specifying the econometric model. Thus, for China, there might well
exist a positive relation between decentralization of governmental activity and
economic growth.
In a time-series analysis for the US from 1951 to 1992, Xie, Zou and Davoodi
(1999) claim that the US is in a decentralization equilibrium. They ascribe this to
the fact that differences in decentralization at the state or local level do not exert
statistically significant effects on real GDP growth. Akai and Sakata (2002)
however, offer evidence to the contrary for US states. Considering additional
explanatory factors and various indicators for the degree of fiscal federalism, they
find a positive influence on economic growth. If expenditure decentralization
increases by 10 percent, the growth of GDP per capita increases by 1.6 to 3.2
percentage points. However, decentralization on the revenue side and indicators
for fiscal autonomy of sub-national levels, measured by the share of own revenue
in total revenue, do not show significant effects. Both studies might not
necessarily contradict each other because of the different perspectives adopted.
While the first study starts from a national perspective, the second one adopts the
perspective of the single states. As mentioned in Section 2, both perspectives
might well coincide with each other.
The same argument might hold for Germany. Berthold et al. (2001) analyze the
effects of horizontal fiscal equalization between states and supplementary federal
grants on economic development of the 16 Lander in a panel analysis with annual
data from 1991 to 1998. According to their estimates, higher grants in horizontal
and vertical fiscal relations significantly reduce the growth of nominal GDP per
capita of the Lander. Behnisch et al. (2002) however, find a positive effect of
increasing federal activities – measured by the share of expenditure at the federal
level – on total German productivity growth in a time series analysis from 1950 to
1990.

70 Fiscal Federalism in Nigeria: A Cluster Analysis of Revenue Allocation
to States and Local Government Areas, 1999 – 2008 Olofin et al
Similarly in Nigeria, a number of studies have analyzed dynamics of fiscal
federalism in the country. For example, Akinlo (1999) using the OLS technique,
examines the fiscal responsiveness of State governments to formal
intergovernmental flows in aggregate and according to the type of central
government assistance schemes. He finds that state governments’ Fiscal
expenditure was stimulated by federal grants during the period of analysis. More
importantly various grants examined were found to have positive effects on the
expenditure profiles of the state governments. Above all, statutory grants appear
to account for the most stimulative effect of federal funds on total state
governments’ capital and recurrent expenditure.
Aigbokhan (1999) also employs the OLS technique to investigate the fiscal
decentralization on economic growth in Nigeria. The study finds evidence of high
concentration ratio of both expenditure and revenue. It also finds evidence of
mismatch in spending and taxing responsibilities with states being harder hit. In a
similar vein, Jimoh (2003) provides concrete statistical evidence on the impact of
the extent of decentralization of government expenditures and/or revenue
collection on the levels of economic activities in Nigeria. Based on regression
analysis, the paper finds that more decentralized governance, especially in terms
of increased local governments and increased transfer of revenues to lower tiers of
government would stimulate economic activities and/ or economic growth. It also
suggests that the major determinants of the prevalence of poverty in Nigeria are
economic and population growths.
Akujuobi and Kalu (2009) focus on the role of the financing sources of Nigerian
State governments in the financing of their real asset investments. Using the OLS
technique, the paper finds that Federal allocation and stabilization fund are
significant in the financing of real asset investments at both 5% and 1% levels of
significance. Internally-generated revenue (IGR), loans (LNS), Grants (GT) and
value added tax (VAT) are found insignificant in the financing of the real asset
investments of Nigerian state governments for the period 1984-2008. Our work
differs from the previous studies as we evaluate statistically the extent of
similarities or dissimilarities in revenue allocation at the state and local
government levels. This provides some statistical evidence for any observed
variations in the revenue allocation in Nigeria and also raises other pertinent
issues that may provide basis for future research.

CBN Journal of Applied Statistics Vol. 3 No.1 71
3.0 Methodology
Cluster Analysis is a statistical technique that seeks to organize information about
variables so that relatively homogeneous groups, or "clusters," can be formed. The
clusters formed with this family of methods should be highly internally
homogenous (in terms of similarity proximity, resemblance, or association
features) and highly externally heterogeneous (that is, unrelated to members of
other clusters).
Cluster analysis is a useful technique for classifying similar and dissimilar objects
and has continued to gain prominence in social sciences where the geography of
data forms an integral part of scientific analysis.
The computational procedure for cluster analysis includes data collection and
selection of the variables for analysis, generation of a similarity matrix, decision
about number of clusters and interpretation and validation of cluster solution.
Fortunately, however, there are standard statistical packages such as STATA that
can perform cluster analysis.
In this study, cluster analysis was carried out to examine the states and local
governments with similar (dissimilar) features in terms of revenue allocation. We
have used data covering revenue allocation to all the states and local governments
in Nigeria. The specific variables of interest for our cluster analysis are statutory
allocation, value-added tax, and net statutory allocation.
4.0 Analysis of Cluster Results
4.1 A Cluster Analysis for Statutory Allocation in Nigeria
Our cluster analysis for statutory allocation was carried out separately for states
and local governments in Nigeria. For the state governments, we specified the
arrangement of statutory allocation into four clusters to see the similarity or
dissimilarity in state governments’ statutory allocation in Nigeria. For the
purpose of this analysis, we have regarded FCT Abuja as a state in the North
Central zone. Tables 1 and 2 below show the results of our cluster analysis
involving four clusters.
72 Fiscal Federalism in Nigeria: A Cluster Analysis of Revenue Allocation
to States and Local Government Areas, 1999 – 2008 Olofin et al
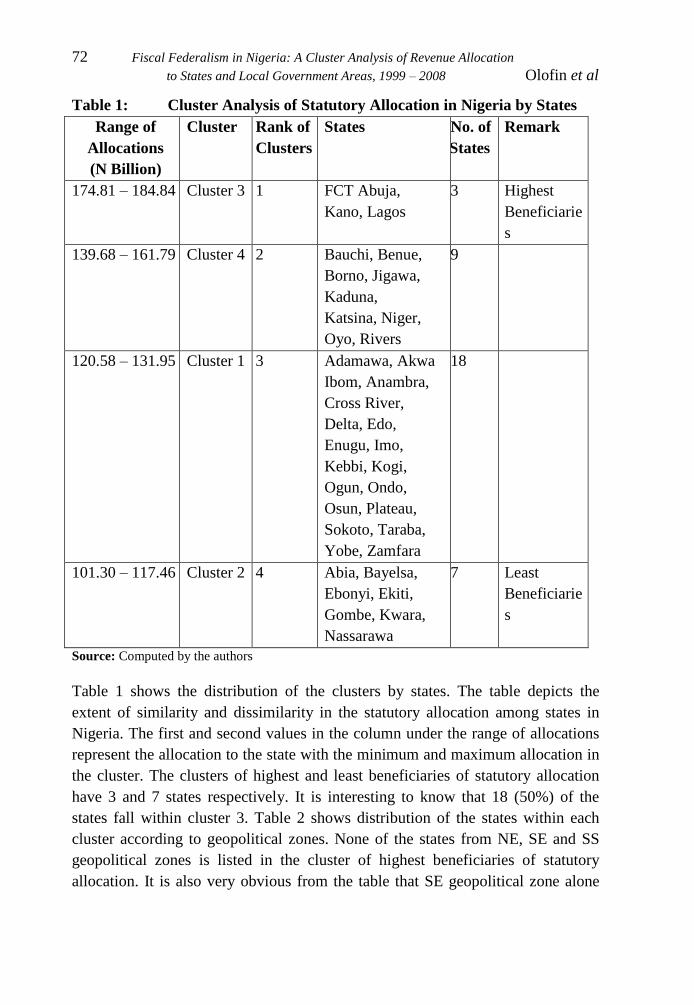
Table 1: Cluster Analysis of Statutory Allocation in Nigeria by States
Range of
Allocations
(N Billion)
Cluster Rank of
Clusters
States No. of
States
Remark
174.81 – 184.84 Cluster 3 1 FCT Abuja,
Kano, Lagos
3 Highest
Beneficiarie
s
139.68 – 161.79 Cluster 4 2 Bauchi, Benue,
Borno, Jigawa,
Kaduna,
Katsina, Niger,
Oyo, Rivers
9
120.58 – 131.95 Cluster 1 3 Adamawa, Akwa
Ibom, Anambra,
Cross River,
Delta, Edo,
Enugu, Imo,
Kebbi, Kogi,
Ogun, Ondo,
Osun, Plateau,
Sokoto, Taraba,
Yobe, Zamfara
18
101.30 – 117.46 Cluster 2 4 Abia, Bayelsa,
Ebonyi, Ekiti,
Gombe, Kwara,
Nassarawa
7 Least
Beneficiarie
s
Source: Computed by the authors
Table 1 shows the distribution of the clusters by states. The table depicts the
extent of similarity and dissimilarity in the statutory allocation among states in
Nigeria. The first and second values in the column under the range of allocations
represent the allocation to the state with the minimum and maximum allocation in
the cluster. The clusters of highest and least beneficiaries of statutory allocation
have 3 and 7 states respectively. It is interesting to know that 18 (50%) of the
states fall within cluster 3. Table 2 shows distribution of the states within each
cluster according to geopolitical zones. None of the states from NE, SE and SS
geopolitical zones is listed in the cluster of highest beneficiaries of statutory
allocation. It is also very obvious from the table that SE geopolitical zone alone

CBN Journal of Applied Statistics Vol. 3 No.1 73
has no representation in the first and second cluster. On this basis, the zone could
be regarded as the least beneficiary in respect of statutory allocation.
Table 2: Cluster Analysis by Geo-political Zones
Cluster Geo-political Zone Number
of
States
North
West
(NW)
North
East
(NE)
North
Central
(NC)
South
West
(SW)
South
East
(SE)
South-
South
(SS)
Cluster 1 3 3 2 3 3 4 18
Cluster 2 0 1 2 1 2 1 7
Cluster 3 1 0 1 1 0 0 3
Cluster 4 3 2 2 1 0 1 9
Source: Computed by the Authors
Figure 1: Cluster Analysis of Statutory Allocation to States in Nigeria

74 Fiscal Federalism in Nigeria: A Cluster Analysis of Revenue Allocation
to States and Local Government Areas, 1999 – 2008 Olofin et al
In the same vein, we conducted cluster analysis for statutory allocation to local
governments (LGs) in Nigeria. We specified the arrangement of statutory
allocation into ten clusters (because of the large number of LGs in Nigeria) in
order to see clearly the similarity or dissimilarity in local governments statutory
allocation in Nigeria. The results are presented in the graph below. The graph
shows the existence of a strong similarity in statutory allocation of some local
governments (as shown in each cluster) as well as a strong dissimilarity among
the clusters (when one compares one cluster to the other).
Figure 2: Cluster Analysis of Statutory Allocation to LGs in Nigeria
Like what we observed in figure 1 and 2 also shows that a very small number of
LGs occupy the extreme cases (that is, highest and lowest statutory allocation).
Cluster 2 shows that as low as 7 LGs out of 776 LGs fall within the range of
values for the highest statutory allocation. Similarly, cluster 4 depicts that just
about 13 LGs fall within the range of values for the lowest statutory allocation. In
terms of the number of LGs constituting the clusters, it is seen that cluster 8 has
the highest number of LGs (179 LGs to be precise) followed by cluster 2 has the
least with 7 LGs respectively. Overall, a good number of LGs in Nigeria have
similar features in terms of statutory allocation.

CBN Journal of Applied Statistics Vol. 3 No.1 75
4.2 A Cluster Analysis for Value Added Tax in Nigeria
Like statutory allocation, cluster analysis for value added tax (VAT) was carried
out separately for states and local governments in Nigeria. For the state
governments, we also specified the arrangement of VAT into four clusters to see
the similarity or dissimilarity in allocation. The tables 3 and 4 and the graph
below show the results of our cluster analysis involving four clusters.
Figure 3: Cluster Analysis of VAT in Nigeria by States
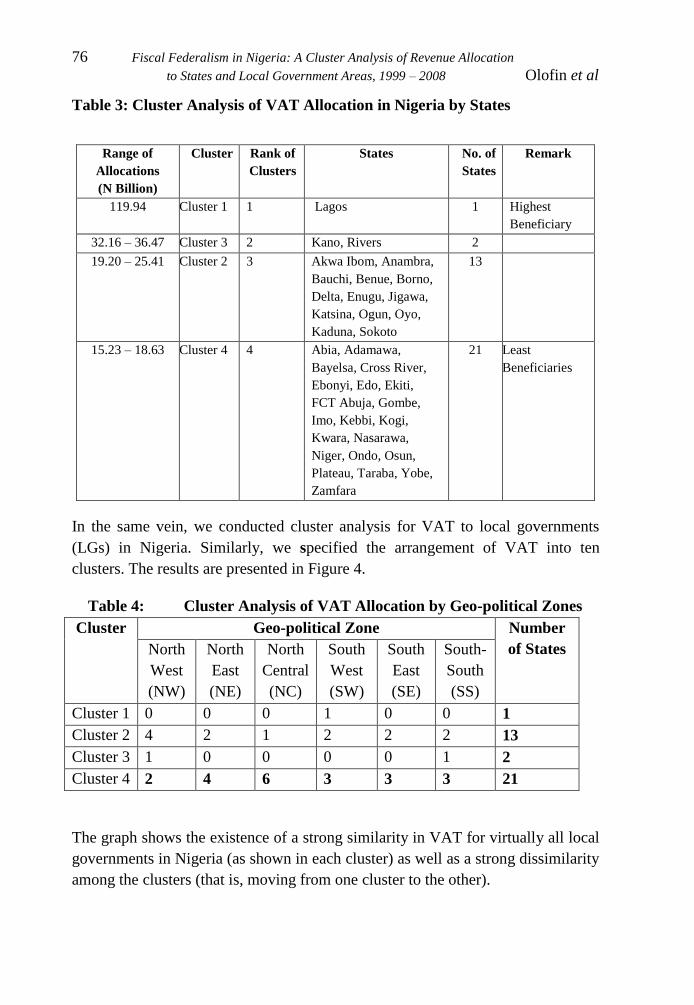
Table 3 shows the distribution of the clusters by states. The table depicts the
extent of similarity and dissimilarity in VAT among states in Nigeria. It is very
striking to see that Lagos alone is in the cluster of top beneficiary of VAT
allocation. The extent of the gap between its cluster and the next cluster can be
seen in Figure 3. Lagos is clearly a leading beneficiary of VAT allocation for
obvious reasons which include large population and level of industrialization. The
second cluster has two states – Kano and Rivers while majority (21) is in cluster
4. This is a clear indication of the low level of industrialization and even capacity
to generate fund internally in all the 21 states. By looking at the distribution of the
clusters by geo-political zones (table 4), it can be seen that NW states benefited
more than other zones while NC dominates the cluster of least beneficiaries.
76 Fiscal Federalism in Nigeria: A Cluster Analysis of Revenue Allocation
to States and Local Government Areas, 1999 – 2008 Olofin et al
Table 3: Cluster Analysis of VAT Allocation in Nigeria by States
In the same vein, we conducted cluster analysis for VAT to local governments
(LGs) in Nigeria. Similarly, we specified the arrangement of VAT into ten
clusters. The results are presented in Figure 4.
Table 4: Cluster Analysis of VAT Allocation by Geo-political Zones
Cluster Geo-political Zone Number
of States North
West
(NW)
North
East
(NE)
North
Central
(NC)
South
West
(SW)
South
East
(SE)
South-
South
(SS)
Cluster 1 0 0 0 1 0 0 1
Cluster 2 4 2 1 2 2 2 13
Cluster 3 1 0 0 0 0 1 2
Cluster 4 2 4 6 3 3 3 21
The graph shows the existence of a strong similarity in VAT for virtually all local
governments in Nigeria (as shown in each cluster) as well as a strong dissimilarity
among the clusters (that is, moving from one cluster to the other).
Range of
Allocations
(N Billion)
Cluster Rank of
Clusters
States No. of
States
Remark
119.94 Cluster 1 1 Lagos 1 Highest
Beneficiary
32.16 – 36.47 Cluster 3 2 Kano, Rivers 2
19.20 – 25.41 Cluster 2 3 Akwa Ibom, Anambra,
Bauchi, Benue, Borno,
Delta, Enugu, Jigawa,
Katsina, Ogun, Oyo,
Kaduna, Sokoto
13
15.23 – 18.63 Cluster 4 4 Abia, Adamawa,
Bayelsa, Cross River,
Ebonyi, Edo, Ekiti,
FCT Abuja, Gombe,
Imo, Kebbi, Kogi,
Kwara, Nasarawa,
Niger, Ondo, Osun,
Plateau, Taraba, Yobe,
Zamfara
21 Least
Beneficiaries
CBN Journal of Applied Statistics Vol. 3 No.1 77
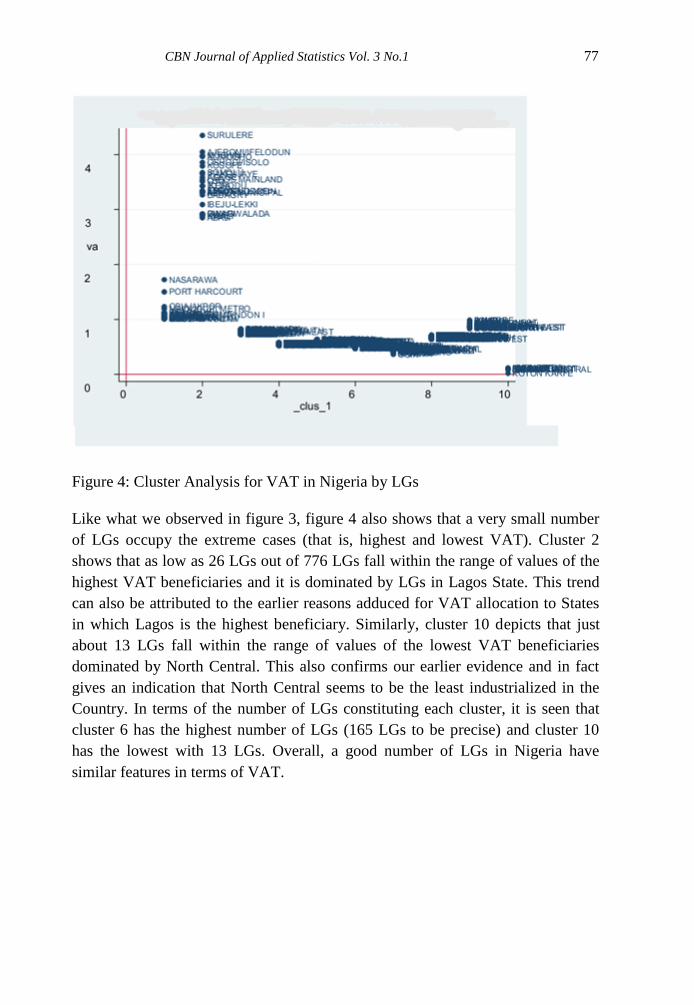
Figure 4: Cluster Analysis for VAT in Nigeria by LGs
Like what we observed in figure 3, figure 4 also shows that a very small number
of LGs occupy the extreme cases (that is, highest and lowest VAT). Cluster 2
shows that as low as 26 LGs out of 776 LGs fall within the range of values of the
highest VAT beneficiaries and it is dominated by LGs in Lagos State. This trend
can also be attributed to the earlier reasons adduced for VAT allocation to States
in which Lagos is the highest beneficiary. Similarly, cluster 10 depicts that just
about 13 LGs fall within the range of values of the lowest VAT beneficiaries
dominated by North Central. This also confirms our earlier evidence and in fact
gives an indication that North Central seems to be the least industrialized in the
Country. In terms of the number of LGs constituting each cluster, it is seen that
cluster 6 has the highest number of LGs (165 LGs to be precise) and cluster 10
has the lowest with 13 LGs. Overall, a good number of LGs in Nigeria have
similar features in terms of VAT.

78 Fiscal Federalism in Nigeria: A Cluster Analysis of Revenue Allocation
to States and Local Government Areas, 1999 – 2008 Olofin et al
4.3 A Cluster Analysis of Net Statutory Allocation in Nigeria
Like statutory allocation and VAT, our cluster analysis for net statutory allocation
(netstat) was carried out for states in Nigeria. The intention actually is to ascertain
the impact of derivation fund and charges on debt incurred by some states on the
available funds at their disposal. For the state governments, we also specified the
arrangement of netstat into four clusters to see the similarity or dissimilarity in
state netstat allocations. Tables 5 and 6 as well Figure 5 show the results of our
cluster analysis.
Figure 5: Cluster Analysis for Net-Statutory Allocation in Nigeria by States
The netstat is determined by subtracting charges on debt incurred by each state
from its gross allocation. The gross allocation actually is the sum of statutory
allocation, derivation fund and VAT. The cluster analysis as presented in tables 5
and 6 for the netstat in Nigeria by states reflects the significant impact of
derivation fund and charges on debt incurred by some states as virtually all the
states of the Niger Delta (South- South geo-political zone) occupy the range of
values for high netstat (see tables 5 and 6). Specifically, table 5 shows that cluster
3 with 1 state (Rivers) occupy the highest range of values of netsat followed by

CBN Journal of Applied Statistics Vol. 3 No.1 79
cluster 4 with 3 states (Akwa Ibom, Bayelsa and Delta), cluster 1 with 8 states and
cluster 2 with 25 states.
These findings suggest that the oil producing states seem to receive the largest net
statutory allocation even far above the highest industrialized state in Nigeria –
Lagos. The single factor responsible for this trend is the Derivation fund allocated
to the oil producing states.
Table 5: Cluster Analysis of Net Statutory Allocation in Nigeria by
States
Range of
Allocations
(N Billion)
Cluster
s
Rank
of
Cluster
s
States No. of
States
Remark
686.69 Cluster
3
1 Rivers 1 Highest
Beneficiary
465.12 – 500.51 Cluster
4
2 Balyesa, Akwa
Ibom and Delta
3
142.96 – 217.18 Cluster
1
3 Borno, FCT
Abuja, Imo,
Kaduna, Kano,
Katsina, Ondo,
Oyo
8
91.41 – 137.97 Cluster
2
4 Abia, Adamawa,
Anambra, Bauchi,
Benue, Cross
River, Ebonyi,
Edo, Ekiti, Enugu,
Gombe, Jigawa,
Kebbi, Kogi,
Kwara, Lagos,
Nassarawa, Niger,
Ogun, Osun,
Plateau, Sokoto,
Taraba, Yobe,
Zamfara
25 Least
Beneficiarie
s

80 Fiscal Federalism in Nigeria: A Cluster Analysis of Revenue Allocation
to States and Local Government Areas, 1999 – 2008 Olofin et al
Table 6: Cluster Analysis of VAT Allocation by Geo-political Zones
Cluster Geo-political Zone Number
of States
North
West
(NW)
North
East
(NE)
North
Central
(NC)
South
West
(SW)
South
East
(SE)
South-
South
(SS)
Cluster 1 3 1 1 2 1 0 8
Cluster 2 4 5 6 4 4 2 25
Cluster 3 0 0 0 0 0 1 1
Cluster 4 0 0 0 0 0 3 3
By looking at the distribution of the clusters by geo-political zones (Table 6), it
can be seen that all the geopolitical zones are represented only in clusters 2 while
clusters 3 and 4 featured only the SS zone, cluster 1 featured all the geo-political
zones excluding the SS.
Unlike what we observed in Tables 2 and 3, Tables 5 and 6 show that a very large
number of states occupy one of the extreme cases (that is, the lowest netstat).
Cluster 2 shows that 25 states out of 37 fall within the range of values for the
lowest netstat. This observation may not be unconnected with the fact that just
about 6 out of the 37 states in Nigeria are eligible for the derivation fund that
often shoots up the gross allocation for these states. Overall, a good number of
States in Nigeria have similar features in terms of statutory netstat.
5.0 CONCLUDING REMARKS
Though, a large body of study exists on fiscal federalism and revenue allocation
both in the developed and developing countries but with the bulk of these studies
focusing majorly sharing principles and formulae. This paper however, analyzed
allocations since the inception of the third republic to examine the distribution
pattern among the states and the LGAs. The results from cluster analysis showed
that a small number of states constituting each of the clusters in terms of statutory
allocation, VAT and net statutory allocation occupied the range of values for
highest and lowest allocations. Specifically, the SE zone was found to be the least
beneficiary of statutory allocation. In the case of VAT, NW zone benefited more
than other zones while NC dominates the cluster of least beneficiary states. The
story changed completely in the case of net statutory allocation. The oil producing

CBN Journal of Applied Statistics Vol. 3 No.1 81
states received the largest net statutory allocation even above the most
industrialized state in Nigeria – Lagos simply because of the derivation fund
enjoyed solely by them. Nonetheless, a good number of LGs in Nigeria have
similar features in terms of both statutory allocation and VAT. Subsequent
analysis hopes to combine other statistics to examine the question of state and
local government viability.
References
Aigbokhan B. (1999). Fiscal Federalism and Economic Growth in Nigeria, NES
selected paper presented at the 1999 annual conference.
Akai, N. and Sakata, M. (2002). Fiscal decentralization contributes to economic
growth: evidence from state-level cross-section data for the United States,"
Journal of Urban Economics, 52(1), pp 93-108.
Akinlo, A.E. (1999). A Cross-sectional Analysis of the Expenditure
Responsiveness of States to Federal Allocations During Civilian Era in
Nigeria- A paper presented at the 1999 annual conference of Nigerian
Economic Society.
Akujuobi, L.E. and I.U. Kalu (2009). State Government Finances and Real Asset
Investments: the Nigerian Experience. African Journal of Accounting,
Economics, Finance and Banking Research Vol. 4. No. 4. 2009.
Aluko, M.E. (2002). Simplifying Our Revenue Allocation Formula Once and For
All. http://www.gamji.com/aluko16.htm
Aluko, M.E. (2004). Revising Nigeria's Revenue Allocation Formula Aftermath of
a Supreme Court Ruling By, http://www.newageonline.com/politics/article01
Anyanwu, J.C. (1999). Fiscal Relations among the various Tiers of Government
in Nigeria, NES selected paper presented at the 1999 annual conference.
Behnisch, A., T. Büttner and D. Stegarescu (2002). Public Sector Centralization
and Productivity Growth: Reviewing the German Experience, ZEW
Discussion Paper No. 02-03, Mannheim.
Berthold, N., S. Drews and E. Thode (2001). Die föderale Ordnung in
Deutschland – Motor oder Bremse des wirtschaftlichen Wachstums?,
Discussion Paper No. 42, University of Wurzburg 2001.

82 Fiscal Federalism in Nigeria: A Cluster Analysis of Revenue Allocation
to States and Local Government Areas, 1999 – 2008 Olofin et al
Davoodi, H. and H. Zou (1998). Fiscal Decentralization and Economic Growth: A
Cross-Country Study, Journal of Urban Economics 43, 244 – 257.
Ebajemito J.O and M.I. Abudu. (1999). Intergovernmental Fiscal Relation in a
Federal System: the Nigerian Experience, NES selected paper presented at
the 1999 Annual Conference.
Enikolopov, R. and E. Zhuravskaya (2003). Decentralization and Political
Institutions, CEPR Discussion Paper No. 3857, London.
Jimoh, A. (2003). Fiscal Policy and Growth in Africa: Fiscal Federalism,
Decentralization and the Incidence of Taxation: Fiscal Federalism: The
Nigerian Experience. Fiscal Policy and Growth in Africa (Fiscal Federalism:
The Nigerian Experience), Addis Ababa: Economic Commission for Africa
pp26.
Lin, J. Y. and Z. Liu (2000). Fiscal Decentralization and Economic Growth in
China, Economic Development and Cultural Change 49, 1 – 23.
Martinez-Vazquez, J. and R.M. McNab (2002). Cross-Country Evidence on the
Relationship between Fiscal Decentralization, Inflation, and Growth, in:
National Tax Association (ed.), Proceedings of the 94th Annual Conference
on Taxation 2001, Washington, D.C, 42 – 47.
Okoh, R.N. and P.C. Egbon (1999). Fiscal Federalism and Revenue Allocation:
The Poverty of the Niger Delta. In Fiscal Federalism and Nigeria’s
Economic Development, Ibadan Nigeria: The Nigerian Economic Society.
Phillips, A.O. (1991). Managing Fiscal Federalism: Revenue Allocation Issues.
Oxford Journals Social Sciences, Publius Volume21, Issue4 Pp. 103-111.
Qiao, B., J. Martinez-Vazquez, and Y. Xu (2002), Growth and Equity Trade-off
in Decentralization Policy: China’s Experience, Georgia State University,
International Studies Programm, Working Paper 02-16, Georgia.
Thießen, U. (2003). Fiscal Decentralization and Economic Growth in High
Income OECD Countries, Fiscal Studies 24, 237 – 274.
Thießen, U. (2003a). Fiscal Federalism in Western European and Selected Other
Countries: Centralization or Decentralization? What Is Better for Economic
Growth, Unpublished Manuscript, DIW Berlin.

CBN Journal of Applied Statistics Vol. 3 No.1 83
Woller, G.M. and K. Phillips (1998). Fiscal Decentralization and LDC Economic
Growth: An Empir ical Investigation, Journal of Development Studies, 34,
139 –148.
Xie, D., H. Zou and H. Davoodi (1999). Fiscal Decentralization and Economic
Growth in the United States, Journal of Urban Economics 45, 228 – 239.
Yilmaz, S. (2000). The Impact of Fiscal Decentralization on Macroeconomic
Performance, in: National Tax Association (ed.), Proceedings of the 92nd
Annual Conference on Taxation 1999, Washington, D.C, 251 – 260.
Zhang, T. and H. Zou (1998). Fiscal Decentralization, Public Spending, and
Economic Growth, Journal of Public Economics 67, 221 –240.