fiscal austerity socgen oct 2011
TRANSCRIPT
8/3/2019 Fiscal Austerity SocGen Oct 2011
http://slidepdf.com/reader/full/fiscal-austerity-socgen-oct-2011 1/18
THE NEW WORLD ORDER
CROSS ASSET THEMATIC RESEARCHOctober 2011
Véronique Riches-Flores Phone: +33 (0)1 42 13 84 04
Societe Generale (“SG”) does and seeks to do business with companies covered in its research reports. As a result, investors should be aware that SG mayhave a conflict of interest that could affect the objectivity of this report. Investors should consider this report as only a single factor in making theirinvestment decision. PLEASE SEE APPENDIX AT THE END OF THIS REPORT FOR THE ANALYST(S) CERTIFICATION(S), IMPORTANT DISCLOSURES ANDDISCLAIMERS AND THE STATUS OF NON-US RESEARCH ANALYSTS.

8/3/2019 Fiscal Austerity SocGen Oct 2011
http://slidepdf.com/reader/full/fiscal-austerity-socgen-oct-2011 2/18
WE ARE ALL GREEKS!
THE REAL-LIFE STRESS TEST OF GREECE – i.e. FAILURE OF AN OECD STATE – IS AN
ELECTROSHOCK FOR THE COMMUNITY OF INDUSTRIALISED NATIONS, THAT WILL BE
FOLLOWED BY MAJOR CHANGES IN THOSE COUNTRIES’ FISCAL POLICIES
NO ONE CAN CLAIM TO BE IMMUNE FROM A GREEK-STYLE SPIRAL, WHY?
» OUR ECONOMIES ARE MATURE - with weak potential GDP, especially post the financial crisis
» WE ARE AGEING - we have no chance to see our future income improving substantially in the
long run ; our savings capacities are shrinking and our health and pensions spending is increasing
225/10/2011
Abstract from our report “After the central banks who will buy our government bonds?” June 09
Already in 2006, S&P was arguing that ageing populations would cause most OECD countries to
lose their investment grade status by 2040
Australia Canada France Germany Italy Japan S. Korea Spain Sweden UK USA
2005 AAA AAA AAA AAA AA AA A AAA AAA AAA AAA
2020 AA AAA A AAA A Non-IG A AAA AAA AAA BBB
2030 BBB AAA Non-IG A Non-IG Non-IG Non-IG BBB A A Non-IG
2040 Non-IG AAA Non-IG Non-IG Non-IG Non-IG Non-IG Non-IG Non-IG Non-IG Non-IG
Source: S&P 2006, SG Cross Asset Research
S&P 2006 long-term baseline scenario – sovereign debt ratings
8/3/2019 Fiscal Austerity SocGen Oct 2011
http://slidepdf.com/reader/full/fiscal-austerity-socgen-oct-2011 3/18
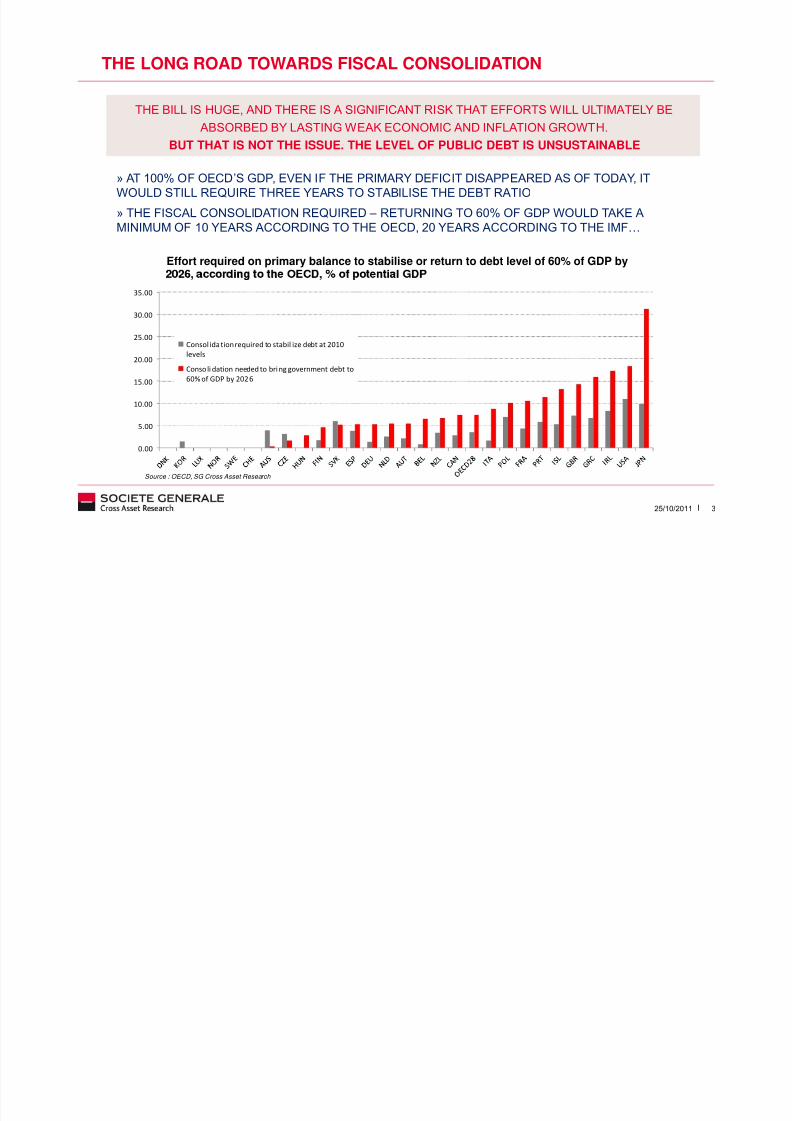
THE LONG ROAD TOWARDS FISCAL CONSOLIDATION
» AT 100% OF OECD’S GDP, EVEN IF THE PRIMARY DEFICIT DISAPPEARED AS OF TODAY, IT
WOULD STILL REQUIRE THREE YEARS TO STABILISE THE DEBT RATIO» THE FISCAL CONSOLIDATION REQUIRED – RETURNING TO 60% OF GDP WOULD TAKE A
MINIMUM OF 10 YEARS ACCORDING TO THE OECD, 20 YEARS ACCORDING TO THE IMF…
Effort required on primary balance to stabilise or return to debt level of 60% of GDP by
THE BILL IS HUGE, AND THERE IS A SIGNIFICANT RISK THAT EFFORTS WILL ULTIMATELY BE
ABSORBED BY LASTING WEAK ECONOMIC AND INFLATION GROWTH.
BUT THAT IS NOT THE ISSUE. THE LEVEL OF PUBLIC DEBT IS UNSUSTAINABLE
325/10/2011
0.00
5.00
10.00
15.00
20.00
25.00
30.00
35.00
Consol idation required to stabil ize debt at 2010
levels
Consoli dation needed to bri ng government debt to
60% of GDP by 2026
Source : OECD, SG Cross Asset Research

8/3/2019 Fiscal Austerity SocGen Oct 2011
http://slidepdf.com/reader/full/fiscal-austerity-socgen-oct-2011 4/18
WHAT’S NEXT?
» OF THE 107 EPISODES OF FISCAL ADJUSTMENTS OBSERVED IN THE PAST 40 YEARS THE MOST
EFFICIENT IN TERMS OF FISCAL RESULTS AND LEAST COSTLY IN TERMS OF GROWTH HAVE
BEEN THE ONES BASED ON SPENDING DRAG RATHER THAN TAX INCREASES
“IDEALLY”, SUCH AN ADJUSTMENT WOULD BE MADE BY EFFORTS TO REDUCE SPENDING
Typolog y and efficiency of fiscal consol idation episodes between 1970 and 2007 in OECD countries
Repartition of the 107 episodes of fiscal
adjustment by d uration
Contribution of expenditure and revenue
items to fiscal adjustment and impact
on growth
Contribution of expenditure and revenue
items to fiscal adjustment and impact
on primary deficit
425/10/2011
0
10
20
30
40
50
60
70
1 2 3 4Duration (years)
Number of episodes by duration
Exp. 86%
Exp. 35%
Revenue
14
Revenue
65%
0%
10%
20%
30%
40%
50%
60%
70%
80%90%
100%
Expansionary
episodes
Contractionary
episodes
Exp.
135%
Exp. 34%
Revenue
-35%
Revenue
66%
-60
-40
-20
0
20
40
60
80
100
120140
160
Successes Failures
Source: Alesina et Ardagna, 2009, SG Cro ss Asset Research Alesina and Ardagna define fiscal adjustment episodes as the years during which the cyclically adjusted primary balance (public balanceexc. interests) improves by at least 1.5 % of GDP. Authors identified 107 episodes of fiscal adjustmen ts between 1970 and 2007 (91 episodes of stimuli ). Over these 107 periods, 65 lasted only oneyear, 13 lasted two years, 4 lasted three years but one only lasted over four consecutive years (Denmark from 1983 to 1986). An episode of fiscal adjustment is qu alified as “expansionary” if theaverage growth rate of GDP gap with the G7 in the first year of adjustment and the two following years significantly exceeds the same variable in all episodes of fiscal adjustment. They are qualified as“successful” when the cumulative reduction of the debt to GDP ratio three years after the beginning of the fiscal adjustment is greater than 4.5 percentage points.
8/3/2019 Fiscal Austerity SocGen Oct 2011
http://slidepdf.com/reader/full/fiscal-austerity-socgen-oct-2011 5/18
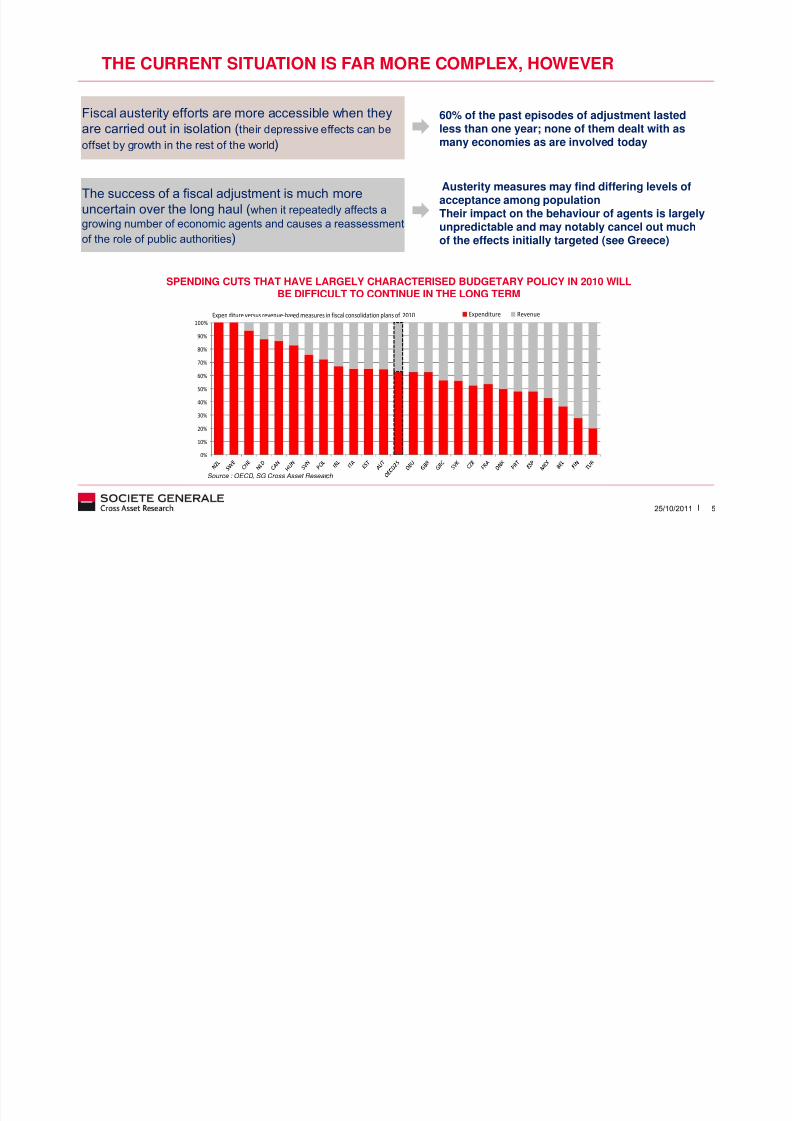
THE CURRENT SITUATION IS FAR MORE COMPLEX, HOWEVER
Fiscal austerity efforts are more accessible when they
are carried out in isolation (their depressive effects can be
offset by growth in the rest of the world)
60% of the past episodes of adjustment lastedless than one year; none of them dealt with asmany economies as are involved today
The success of a fiscal adjustment is much moreuncertain over the long haul (when it repeatedly affects a
growing number of economic agents and causes a reassessment
of the role of public authorities)
Austerity measures may find differing levels of
acceptance among populationTheir impact on the behaviour of agents is largelyunpredictable and may notably cancel out muchof the effects initially targeted (see Greece)
525/10/2011
0%
10%
20%
30%
40%
50%
60%
70%
80%
90%
100%
Expenditure RevenueExpen diture versus revenue-based measures in fiscal consolidation plans of 2010
SPENDING CUTS THAT HAVE LARGELY CHARACTERISED BUDGETARY POLICY IN 2010 WILL
BE DIFFICULT TO CONTINUE IN THE LONG TERM
Source : OECD, SG Cross Asset Research

8/3/2019 Fiscal Austerity SocGen Oct 2011
http://slidepdf.com/reader/full/fiscal-austerity-socgen-oct-2011 6/18
GROWTH CONSTRAINTS
3
4
FittedChange in pub. exp/GDP ratio - OECD
a c t o f
c
80% OF THE CHANGE IN THE RATIO OF PUBLIC SPENDING/GDP HAS RESULTEDFROM THE COMBINATION OF GDP GROWTH AND UNEMPLOYMENT RATE OVER
THE LAST 40 YEARS!
THE CURRENT CONTEXT OF SLOW GROWTH AND A STUBBORNLY HIGH UNEMPLOYMENT RATE
CONSIDERABLY REDUCES THE PROBABILITY OF A SUBSTANTIAL CUT IN PUBLIC SPENDING
625/10/2011
-2
-1
0
1
2
Actual
I m p l i c i t
i m p
S G e c o n
o m i
f o r e c a s t s
-2
0
2
74 75 76 77 78 79 80 81 82 83 84 85 86 87 88 89 90 91 92 93 94 95 96 97 98 99 0 1 2 3 4 5 6 7 8 9 10
Residuals
d=1.657+0.096*u-0.53*g
R2=0.789
d = one year change in public
spending/GDP ratio
u = one year change in the unemployment rate
g = one year change in reral GDP growth
Source : SG Cross Asset Research

8/3/2019 Fiscal Austerity SocGen Oct 2011
http://slidepdf.com/reader/full/fiscal-austerity-socgen-oct-2011 7/18
BEWARE THE SOCIAL/POLITICAL CONSTRAINTS…
THE SOCIAL COST OF THE ONGOING CRISIS WILL LIMIT THE SCOPE OF PUBLIC SPENDING CUTS
Countries with thehighest protection
level will have very
limited room for
manoeuvre to reduce60
70
80
90
OECD average
Average replacement rate of revenue during initial phase of unemployment based on six family types – level
1 of earnings (from 67% to 150% of national average wages)
725/10/2011
Source: From OECD, Tax-Benefit Models, SG Cross Asset Research
their spending.
Those that offer the
least protection may
be faced with the
need to increase
their social action.
40
50
AUS NZL KOR GBR TUR USA POL IRL JPN EST SWE GRC AUT FIN HUN ITA BEL ESP CAN SVK NOR CZE DNK DEU NLD SVN FRA ICE CHE PRT LUX
-20
-10
0
10
20
AUS NZL KOR GBR TUR USA POL IRL JPN EST SWE GRC AUT FIN HUN ITA BEL ESP CAN SVK NOR CZE DNK DEU NLD SVN FRA ICE CHE PRT LUX
Gap to average

8/3/2019 Fiscal Austerity SocGen Oct 2011
http://slidepdf.com/reader/full/fiscal-austerity-socgen-oct-2011 8/18
PUBLIC INVESTMENT IN THE FIRING LINE
Eventually, public sector investment is likely to bear the
brunt of the spending cuts
Easier to cut or postpone than other forms ofexpenditures, less political/social conflict
BUT A LONG-TERM ECONOMIC COST
A substantial part of public spending (10% of OCDEpublic spending)
Sometimes poor economic efficiency
45.0
Weightof public investmentamong OECD members, 2009
Public investment account for 1/5th of total investmentin OECD countries
Lasting underinvestment in the public sector has alwayscome at a cost in terms of infrastructure efficiency and,in the end, productivity (see UK or German experiences)
825/10/2011
0.0
5.0
10.0
15.0
20.0
25.0
30.0
35.0
40.0
.
As a % of total investment
As a % of total publ ic expenditure
Source: OECD, SG Cross Asset Research

8/3/2019 Fiscal Austerity SocGen Oct 2011
http://slidepdf.com/reader/full/fiscal-austerity-socgen-oct-2011 9/18
HIGHER TAX AND MORE PROGRESSIVITY AHEAD
250000
300000
350000
400000USA
1981
1981 at 2010 prices
2010
Income level, nat.cur.
0
10000
20000
30000
40000
50000
60000
70000
80000
0 10 20 30 40 50 60
France1981
1981 at 2010 prices
2010
Marginal tax rate, %
Income level, nat.cur.
Greece
925/10/2011
0
50000
100000
150000
200000
0 20 40 60 80
Marginal tax rate, %
0
20000
40000
60000
80000
100000
120000
0 10 20 30 40 50 60 70
1981
1981 at 2010 prices
2010
Income level, nat. cur.
Marginal tax rate, %Source: OECD, SG Cross Asset Research

8/3/2019 Fiscal Austerity SocGen Oct 2011
http://slidepdf.com/reader/full/fiscal-austerity-socgen-oct-2011 10/18
SAME PROBLEMS, DIFFERENT OUTCOME
The preservation of nationally preferred
models may be hit by the fiscal consolidation
AUS
OE
BEL
CAN
DNK
FIN
FRA DEU
GRC
IRE
ITA
JAP
KOR
NDL
OECD
POL
PRT
ESP
SWE
CHE
GBR USA
5000
10000
15000
20000
25000
Public revenues/cap.
Public spending per capita relative to GDP per capita for the main OECD countriesand probable trend (- - -)
Tax revenues/capita relative to GDP/capita for main OECD countries and probabletrend (- - - )
1025/10/2011
0
15000 20000 25000 30000 35000 40000 45000 50000
GDP/cap., 2009, $PPP
AUS
OEBEL
CAN
DNKFIN
FRA
GERGRC
IRE
ITA
JAP
KOR
NDL
OECD
POL
PRT
SP
SWE
CHE
GBRUSA
0
5000
10000
15000
20000
25000
15000 20000 25000 30000 35000 40000 45000 50000
GDP/cap., 2009, $, PPP
Public expenditure/cap.
Source: OECD “Governments at a glance”, 2011,;SG Cross Asset Research
8/3/2019 Fiscal Austerity SocGen Oct 2011
http://slidepdf.com/reader/full/fiscal-austerity-socgen-oct-2011 11/18
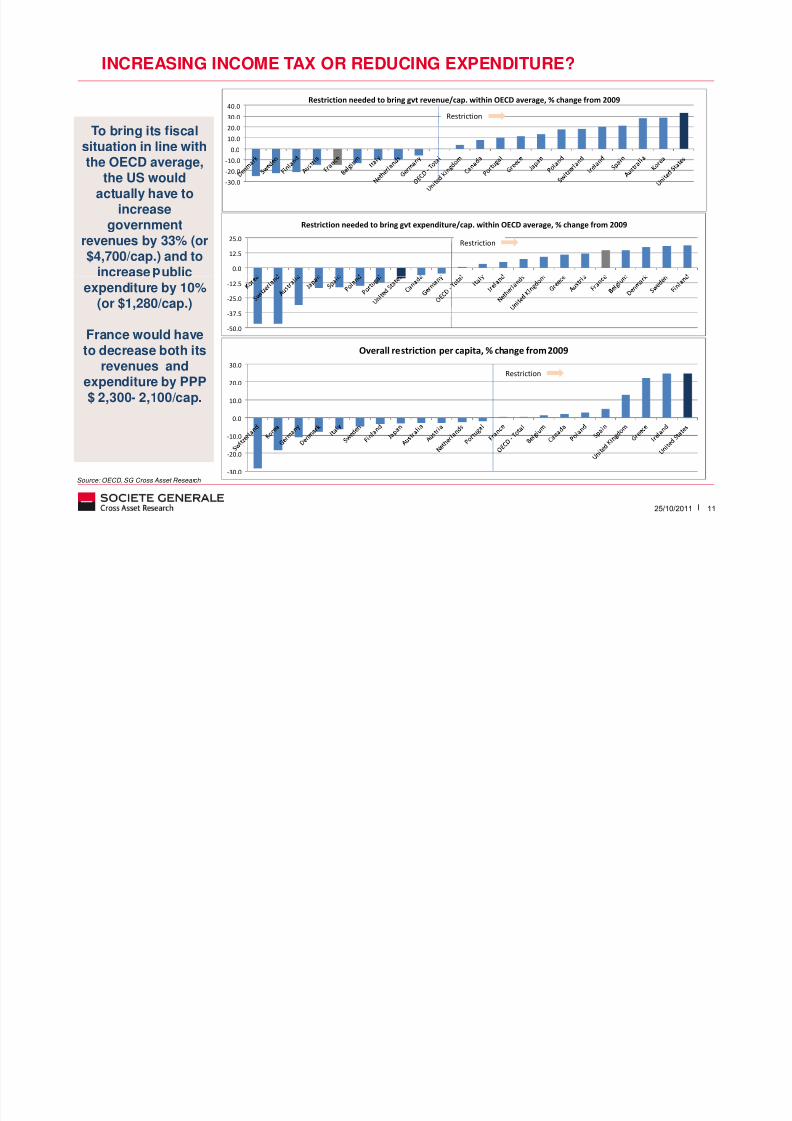
INCREASING INCOME TAX OR REDUCING EXPENDITURE?
To bring its fiscalsituation in line withthe OECD average,
the US would
actually have toincreasegovernment
revenues by 33% (or$4,700/cap.) and to
increase ublic
-30.0
-20.0
-10.0
0.0
10.0
20.0
30.0
40.0 Restriction needed to bring gvt revenue/cap. within OECD average, % change from 2009
Restriction
0.0
12.5
25.0
Restriction needed to bring gvt expenditure/cap. within OECD average, % change from 2009
Restriction
1125/10/2011
expenditure by 10%(or $1,280/cap.)
France would haveto decrease both its
revenues andexpenditure by PPP
$ 2,300- 2,100/cap.
-30.0
-20.0
-10.0
0.0
10.0
20.0
30.0
Overall restriction per capita, % change from 2009
Restriction
-50.0
-37.5
-25.0
-12.5
Source: OECD, SG Cross Asset Research

8/3/2019 Fiscal Austerity SocGen Oct 2011
http://slidepdf.com/reader/full/fiscal-austerity-socgen-oct-2011 12/18
CORPORATE TAXATION: POTENTIALLY VERY DIFFERENT SITUATIONS IN THEUS AND EUROPE
35
40
45
50
55
60
JAP
USA
FRA
Adjusted top statutary tax rate on corporate income
Corporate income tax rate, %
THE US IS POTENTIALLY MORE EXPOSED TO ANINCREASE IN SOCIAL CONTRIBUTIONS THANEUROPE (potentially negative for US labour-intensive
industries)
BUT IT IS IN EUROPE THAT THE RISK OF HIGHERINCOME TAX SEEMS THE MOST ELEVATED (the
US corporate income tax is among the highest in the
OECD)
1225/10/2011
20
25
30
1995 1997 1999 2001 2003 2005 2007 2009 2011
ITA
DEU
ESP
GBR
Source: EUROSTAT, SG Cross Asset Research

8/3/2019 Fiscal Austerity SocGen Oct 2011
http://slidepdf.com/reader/full/fiscal-austerity-socgen-oct-2011 13/18
CROWDING-OUT EFFECTS
DRAIN ON REVENUES/weaker economic growthHigher risk premium
UNSTABLE TAX AND REGULATORY ENVIRONMENT
/negative for investmentStructural decline in P/E
CONSUMER TAXATION Negative on consumption outlook
1325/10/2011
CORPORATE TAXATIONNegative on investment and corporateperformance
WHICH ARE THE MOST EXPOSED SECTORS?

8/3/2019 Fiscal Austerity SocGen Oct 2011
http://slidepdf.com/reader/full/fiscal-austerity-socgen-oct-2011 14/18
MULTI-CRITERIA* EXPOSURE OF THE VARIOUS EUROPEAN SECTORS TO ANINCREASE IN TAXATION
Textiles, Apparel & Luxury Goods
Metals & Mining
Food Products
Oil & gaz extraction
Media
Real Estate
Beverages
Pharmaceuticals
Semiconductors & Semiconductor Equipment
Telecommunication Services
Utilities
Tobacco Overall
exposure
Most profitable sectors arehighly exposed
Low taxed Cies are highlyexposed
1425/10/2011
-4.0 -3.0 -2.0 -1.0 0.0 1.0 2.0 3.0 4.0 5.0 6.0
Commercial Services & Supplies
IT Services
Hotels Restaura nts & Leisure
Specialty Retail - retail
Automobiles & Components
Software
Machinery
Aerospace & Defence
Construction Material s
Electrical Equipment
Chemicals
Energy Equipment & Services
Labour intensity
EBIT margins
Payout ratio
Effective tax rate
-4.0 -2.0 0.0 2.0 4.0Source: SG Cross Asset Research. *All indicators are normalised and rebased to zero.
Labour intensive Cies maybe relatively protected

8/3/2019 Fiscal Austerity SocGen Oct 2011
http://slidepdf.com/reader/full/fiscal-austerity-socgen-oct-2011 15/18
THE EUROPEAN FISCAL HIT LIST
Exposure of the various sectors to tougher fiscal conditions for companies in Europe
The most exposed sectors Neutral sectors The most protected sectors
Tobacco Agrifood Commercial services
Utilities Metals & Mining Hotels, restaurants & leisure
Telecoms Textiles, apparel & Luxury goods Specialised distribution
1525/10/2011
Semiconductors Energy equipment & Services Automobile & Equipment makers
Pharmaceuticals Chemicals Software & IT services
Real estate Electrical equipment Machinery
Media Construction & Materials Aerospace & Defence
Beverages
Oil & Gas
Source: SG Cross Asset Research
8/3/2019 Fiscal Austerity SocGen Oct 2011
http://slidepdf.com/reader/full/fiscal-austerity-socgen-oct-2011 16/18

8/3/2019 Fiscal Austerity SocGen Oct 2011
http://slidepdf.com/reader/full/fiscal-austerity-socgen-oct-2011 17/18

8/3/2019 Fiscal Austerity SocGen Oct 2011
http://slidepdf.com/reader/full/fiscal-austerity-socgen-oct-2011 18/18
SG LEADER IN GLOBAL CROSS ASSET RESEARCH
Macro & Strategy
#1 Global Strategy#1 Multi Asset Research
#2 Global Economics
#2 Pan-Euro Economics
Fixed Income
#1 Overall Trade Ideas
#1 Credit Research Team
#1 Overall Credit Strategy
#1 in Sovereigns
#1 in 4 sector teams
20112011
1825/10/2011
Commodities
#3 Research in Power and Gas
#4 Research in Oil
#4 Research in Base Metals
#5 Research in Precious Metals
Equity
#1 Equity Quant
#1 Index Analysis
10 sector teams in the Top 10
2011