fiscal 2020 year to date results - seeking alpha
TRANSCRIPT

May 11, 2020 US
May 12, 2020 Australia
Ron DeliaCEO
Michael CasamentoCFO
Fiscal 2020 year to date results(nine months ended March 31, 2020)
NYSE: AMCR | ASX: AMC

Disclaimers
2
Cautionary Statement Regarding Forward-Looking StatementsThis presentation contains certain statements that are “forward-looking statements” within the meaning of the safe harbor provisions of the U.S. Private Securities Litigation Reform Act of 1995. Forward-looking statements are generally identified with words like “believe,” “expect,”, “target”, “project”, “may,”
“could,” “would,” “approximately,” “possible,” “will,” “should,” “expect,” “intend,” “plan,” “anticipate,” “estimate,” “potential,” “outlook” or “continue,” the negative of these words, other terms of similar meaning or the use of future dates. Such statements are based on the current expectations of the
management of Amcor and are qualified by the inherent risks and uncertainties surrounding future expectations generally. Actual results could differ materially from those currently anticipated due to a number of risks and uncertainties. None of Amcor or any of its respective directors, executive officers or
advisors, provide any representation, assurance or guarantee that the occurrence of the events expressed or implied in any forward-looking statements will actually occur. Risks and uncertainties that could cause actual results to differ from expectations include, but are not limited to: the continued
financial and operational impacts of the COVID-19 pandemic on Amcor and its customers, suppliers, employees and the geographic markets in which it and its customers operate; fluctuations in consumer demand patterns; the loss of key customers or a reduction in production requirements of key
customers; significant competition in the industries and regions in which Amcor operates; failure to realize the anticipated benefits of the acquisition of Bemis Company, Inc. (“Bemis”), and the cost synergies related thereto; failure to successfully integrate Bemis’ business and operations in the expected
time frame or at all; integration costs related to the acquisition of Bemis; failure by Amcor to expand its business; the potential loss of intellectual property rights; various risks that could affect our business operations and financial results due to the international operations; price fluctuations or shortages in
the availability of raw materials, energy and other inputs; disruptions to production, supply and commercial risks, including counterparty credit risks, which may be exacerbated in times of economic downturn; the possibility of labor disputes; fluctuations in our credit ratings; disruptions to the financial or
capital markets; and other risks and uncertainties identified from time to time in Amcor’s filings with the U.S. Securities and Exchange Commission (the “SEC”), including without limitation, those described under Item 1A. “Risk Factors” of Amcor’s annual report on Form 10-K for the fiscal year ended June
30, 2019 as supplemented by the risk factor contained in Amcor’s Current Report on Form 8-K filed on March 9, 2020. You can obtain copies of Amcor’s filings with the SEC for free at the SEC’s website (www.sec.gov). Forward-looking statements included herein are made only as of the date hereof and
Amcor does not undertake any obligation to update any forward-looking statements, or any other information in this communication, as a result of new information, future developments or otherwise, or to correct any inaccuracies or omissions in them which become apparent, except as expressly required
by law. All forward-looking statements in this communication are qualified in their entirety by this cautionary statement.
Basis of Preparation of Supplemental Unaudited Combined Financial InformationThe fiscal 2018 unaudited combined financial information presented in the release gives effect to Amcor's acquisition of Bemis as if the combination had been consummated on July 1, 2018. The Supplemental Unaudited Combined Financial Information includes adjustments for (1) accounting policy
alignment, (2) elimination of the effect of events that are directly attributable to the combination (e.g., one-time transaction costs), (3) elimination of the effect of consummated and identifiable divestitures agreed to with certain regulatory agencies as a condition of approval for the transaction, and (4) items
which management considers are not representative of ongoing operations. The Supplemental Unaudited Combined Financial Information does not include the preliminary purchase accounting impact, which has not been finalized at the date of the release and does not reflect any cost or growth
synergies that Amcor may achieve as a result of the transaction, future costs to combine the operations of Amcor and Bemis or the costs necessary to achieve any cost or growth synergies. The Supplemental Unaudited Combined Financial Information has been presented for informational purposes only
and is not necessarily indicative of what Amcor’s results of operations actually would have been had the combination been completed as of July 1, 2018, nor is it indicative of the future operating results of Amcor. The Supplemental Unaudited Combined Financial Information should be read in conjunction
with the separate historical financial statements and accompanying notes contained in each of the Amcor and Bemis periodic reports, as available. For avoidance of doubt, the Supplemental Unaudited Combined Financial Information is not intended to be, and was not, prepared on a basis consistent with
the unaudited condensed combined financial information in Amcor’s Registration Statement on Form S-4 filed March 25, 2019 with the SEC (the “S-4 Pro Forma Statements”), which provides the pro forma financial information required by Article 11 of Regulation S-X. For instance, the Supplemental
Unaudited Combined Financial Information does not give effect to the combination under the acquisition method of accounting in accordance with Financial Accounting Standards Board (“FASB”) Accounting Standard Codification Topic 805, Business Combinations (“ASC Topic 805”), with Amcor treated
as the legal and accounting acquirer. The Supplemental Unaudited Combined Financial Information has not been adjusted to give effect to pro forma events that are (1) directly attributable to the combination, (2) factually supportable, or (3) expected to have a continuing impact on the combined results of
Amcor and Bemis. More specifically, other than excluding Amcor’s divested plants and one-time transaction costs, the Supplemental Unaudited Combined Financial Information does not reflect the types of pro forma adjustments set forth in S-4 Pro Forma Statements. Consequently, the Supplemental
Unaudited Combined Financial Information is intentionally different from, but does not supersede, the pro forma financial information set forth in S-4 Pro Forma Statements.
Reconciliations of non-GAAP combined measures to their most comparable GAAP measures and reconciliations of pro forma net income in accordance with Article 11 of Regulation S-X to combined net income is included in the "Reconciliation of Non-GAAP Measures" section of this release.
Presentation of non-GAAP financial informationIncluded in this release are measures of financial performance that are not calculated in accordance with U.S. GAAP. These measures include adjusted EBIT (calculated as earnings before interest and tax), adjusted net income, adjusted earnings per share, adjusted free cash flow before dividends,
adjusted cash flow after dividends, net debt and the Supplemental Unaudited Combined Financial Information including adjusted earnings before interest, tax, amortization and depreciation, adjusted earnings before interest and tax, and adjusted earnings per share and any ratios related thereto. In
arriving at these non-GAAP measures, we exclude items that either have a non-recurring impact on the income statement or which, in the judgment of our management, are items that, either as a result of their nature or size, could, were they not singled out, potentially cause investors to extrapolate future
performance from an improper base. While not all inclusive, examples of these items include:
• material restructuring programs, including associated costs such as employee severance, pension and related benefits, impairment of property and equipment and other assets, accelerated depreciation, termination payments for contracts and leases, contractual obligations and any other qualifying
costs related to the restructuring plan;
• earnings from discontinued operations and any associated profit on sale of businesses or subsidiaries;
• consummated and identifiable divestitures agreed to with certain regulatory agencies as a condition of approval for Amcor’s acquisition of Bemis;
• impairments in goodwill and equity method investments;
• material acquisition compensation and transaction costs such as due diligence expenses, professional and legal fees and integration costs;
• material purchase accounting adjustments for inventory;
• amortization of acquired intangible assets from business combinations;
• impact of economic net investment hedging activities not qualifying for hedge accounting;
• payments or settlements related to legal claims; and
• impacts from hyperinflation accounting.
Management has used and uses these measures internally for planning, forecasting and evaluating the performance of the company’s reporting segments and certain of the measures are used as a component of Amcor’s board of directors’ measurement of Amcor’s performance for incentive
compensation purposes. Amcor also evaluates performance on a constant currency basis, which measures financial results assuming constant foreign currency exchange rates used for translation based on the rates in effect for the comparable prior-year period. In order to compute constant currency
results, we multiply or divide, as appropriate, current-year U.S. dollar results by the current-year average foreign exchange rates and then multiply or divide, as appropriate, those amounts by the prior-year average foreign exchange rates. Amcor believes that these non-GAAP measures are useful to
enable investors to perform comparisons of current and historical performance of the company. For each of these non-GAAP financial measures, a reconciliation to the most directly comparable U.S. GAAP financial measure has been provided herein. These non-GAAP financial measures should not be
construed as an alternative to results determined in accordance with U.S. GAAP. The company provides guidance on a non-GAAP basis as we are unable to predict with reasonable certainty the ultimate outcome and timing of certain significant items without unreasonable effort. These items include
but are not limited to the impact of foreign exchange translation, restructuring program costs, asset impairments, possible gains and losses on the sale of assets and certain tax related events. These items are uncertain, depend on various factors and could have a material impact on U.S. GAAP earnings
and cash flow measures for the guidance period.

4.14.0
3.4
2.6
2.0 2.0 2.0
2.4
2.6
2.1
3.32.9
0
0.5
1
1.5
2
2.5
3
3.5
4
4.5
Safety
3
Recordable-case frequency rate
Acquisition
impacts
Notes: Recordable cases per 1,000,000 hours worked. All data shown for a 12 month period ended June 30, unless otherwise indicated
2010 to 2012 data includes the demerged Orora business. Total rates for 2015 to 2018 include acquired businesses from the first day of ownership. The Bemis acquisition is excluded for all periods prior to and including 2019. Bemis acquisition is included for
YTD19 and YTD20.
*The increase in the frequency rate between 2016 and 2018 reflects the inclusion of the Alusa and Sonoco acquisitions and the increase between 2019 and YTD19 reflects the inclusion of the Bemis acquisition.
Committed to our goal of ‘no injuries’
• 54% of sites injury free for >12 months
• 8% reduction in number of injuries
• Continuing to align safety practices

Key messages for today
4
To our employees around the world: “Thank You!”
1. COVID-19: Well positioned and demonstrating resilience
2. Strong YTD result and increased FY20 outlook
3. Bemis acquisition ahead of Year One expectations
4. Clear visibility to near term shareholder returns
5. Substantial opportunities to create value over the long term
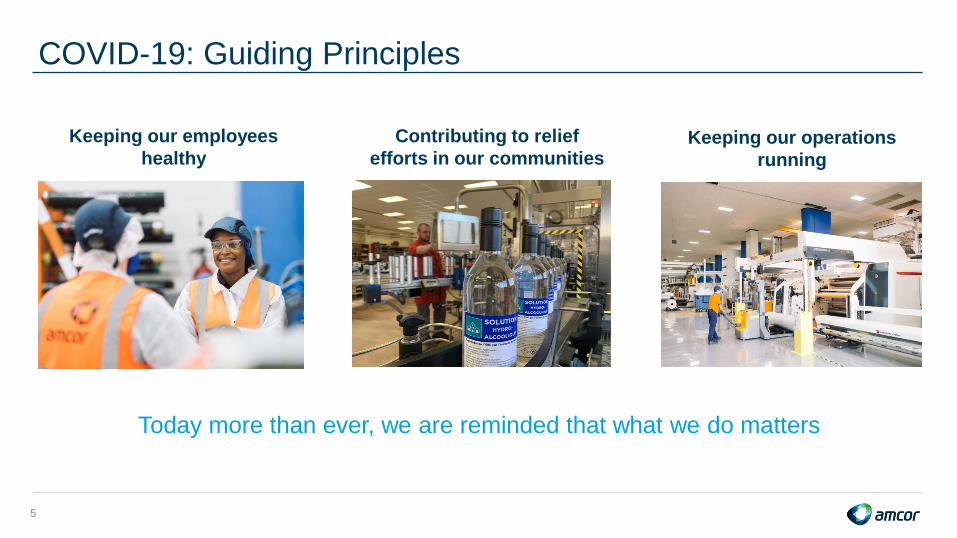
COVID-19: Guiding Principles
Keeping our employees
healthyKeeping our operations
running
Contributing to relief
efforts in our communities
Today more than ever, we are reminded that what we do matters
5

Playing a vital role in essential food and healthcare supply chains
Note: All amounts referenced throughout this document are in US dollars unless otherwise indicated and numbers may not add up precisely to the totals provided due to rounding
Reflects FY19 combined sales revenue which excludes results from flexible packaging plants in Europe and the United States which were required to be sold in order to secure anti-trust approval for the Bemis acquisition.
HPC is Home & Personal Care.
Food 44%
Beverage24%
Healthcare12%
HPC6%
Other consumer
9%
Other5%
$13 bn FY19
sales by end
market
>95% of sales in
consumer end markets
6

Increased focus on critical needs
Role of food and healthcare packaging has never been clearer
Preserve food and healthcare products…Protect consumers…Promote brands
Hygiene AutomationConvenience
7

Reduced volatility from scale and geographic diversification
8
250 sites in more than 40 countries
Notes: Reflects FY19 combined sales revenue which excludes results from flexible packaging plants in Europe and the United States which were required to be sold in order to secure anti-trust approval for the Bemis acquisition.
~$3 bn
FY19
EM sales
North America
Western Europe
Asia
Eastern Europe
Latam
Australia NZ
$13 bn FY19
sales by
region
Presence in >25 emerging market countries

5.1%
2.0%
Amcor Industry average
S&P 500
2.1%
Well positioned with financial strength
9
Estimated FY202.8X
3.9X
Amcor Industry average
Strong investment grade balance sheet
Supported by consistent cash flow growth
Sustainable and
compelling dividend
Leverage Dividend yield
Notes: Leverage defined as Net Debt/EBITDA, and Yield measured as of April 30, 2020
CC CAGR refers to Constant Currency CAGR
Industry average comprised of Aptar, Ardagh, Ball, Berry, Crown, Greif, Huhtamaki, Owens-Illinois, Orora, Pact, Sealed Air, Silgan, and Sonoco. Source: Goldman Sachs
Strong and
consistent results
CC CAGR (2014-2019)
3%
5%
7%
12%
Sales EBIT EPS EPS +dividend

10
FY20 Q3 trading details
Q320 total
volume growth(1):
Amcor +2%
Global demand trends continue to evolve
Q320 volume positives Q320 volume negatives
• North America Flexibles +4%
• Europe Flexibles +1%
• North America Beverage +5%
• By end market:• Wine capsules;
• Convenience channel
• On-premise consumption
1%Flexibles
5%
Rigid
Packaging
(1) Volume contribution to constant currency excluding raw materials sales growth. Excludes price/mix impacts.
• By end market: • Global healthcare
• Home care
• Protein and prepared meals
• Flexibles China and India
• Flexibles Latin America & Cartons• Sequential improvement

Fiscal 2020 year to date financial results(nine months ended March 31, 2020)

FY20 Year to date results(1)
12(1) Adjusted non-GAAP measures exclude items which management considers as not representative of ongoing operations. Further details related to non-GAAP measures and reconciliations to U.S. GAAP measures can be found in the appendix section.
Organic growth and synergy benefits
EPS
+14%
44.7 cents
Net
income
+13%
$719 m
EBIT
margin
+100bps
11.4%
Growth vs prior year (constant currency)
EBIT
+7%
$1,059 m11.5 cps
quarterly
dividend
Cash returns to shareholders
52 million
(3.2%) shares
repurchasedFree cash flow
+217 m
$367 m

Year to date highlights
• Adjusted EBIT growth 11.3%
• 7% organic growth
• $40 million(2) synergy benefits
• Volume growth in North America and Europe
• Sequential volume improvement in Specialty Cartons
& Flexible Latin America but remain lower than the
prior nine month period
• Strong cost performance
• 150bps EBIT margin expansion
FY20 Year to date results(1) - Flexibles segment
13(1) Non-GAAP measures exclude items which management considers are not representative of ongoing operations. Further details related to non-GAAP measures and reconciliations to U.S. GAAP measures can be found in the appendix section
(2) Total pre tax synergy benefits delivered YTD20 were $55 million, with $40 million recognised in the Flexibles segment and the remaining $15 million recognised as a reduction in corporate expenses
7% organic growth in addition to $40 million(2) of synergies
863 947
YTD19 YTD20
Adjusted EBIT ($m)
11.5% 13.0%
YTD19 YTD20
Adjusted EBIT margin

Bemis acquisition ahead of expectations
Strategic rationale
Global footprint Greater scale Best-in-class
capabilities
• Momentum in acquired base business
• Integration mostly complete
• Timing of first year synergy benefits
ahead of expectations
• $55m YTD(1); $80m FY20; $180m by FY22
• Delivering against strategic rationale
Commitment to
environmental
sustainability
Management talentAttractive end
markets
(1) Total pre tax synergy benefits delivered YTD were $55 million, with $40 million recognised in the Flexibles segment and the remaining $15 million recognised as a reduction in corporate expenses14

FY20 Year to date results(1) - Rigid Packaging segment
15(1) Non-GAAP measures exclude items which management considers are not representative of ongoing operations. Further details related to non-GAAP measures and reconciliations to U.S. GAAP measures can be found in the appendix section
(2) LRB refers to Liquid Refreshment Beverage market. Source IRI. Refer slide 31.
Returned to EBIT growth in Q3 as expected after cycling a strong H1 comparative
218 202
YTD19 YTD20
Adjusted EBIT ($m)
Year to date highlights
• 4% EBIT growth in Q3 as expected
• North America - beverage volume growth 1.7%
(hot fill 5% growth), in-line with market growth
• Latin America - volumes 3.4% higher
10.2% 9.8%
YTD19 YTD20
Adjusted EBIT margin
Non-alcoholic LRB retail sales by package format(2)

Cash flow in line with expectations, working capital improved
16
(1) Non-GAAP measures exclude items which management considers as not representative of ongoing operations. Further details related to non-GAAP measures and reconciliations to U.S. GAAP measures can be found in the appendix section.
(2) 3Q20 excludes Bemis transaction and integration related costs of $145 million of which $69 million is cash integration costs.
(3) Includes Bemis and remedy adjustments.
(4) 3Q19 includes dividends paid to former Bemis shareholders of $86 million.
(5) Before expected cash integration costs of ~$100 million in FY20.
Year to date cash flow
($ million)3Q19 3Q20 FY19
FY20
outlook(5)
Adjusted EBITDA 957 1,378
Interest and tax payments (216) (247)
Capital expenditure (net of
asset sale proceeds)(182) (308)
Movement in working capital (511) (370)
Other (79) (86)
Adjusted free cash flow(1)(2) (31) 367
Combined adjustments(3) 181 -
Combined adjusted free
cash flow(1)(2) 150 367 970 >1bn
Dividends(4) (378) (574) (767)
Adjusted free cash flow
after dividends(1) (228) (207) 204 300–400
On track to deliver >$1 billion of free cash flow in FY20
• YTD cash flow of $367 million, up $217 million and
consistent with historic seasonality
• Strong improvement in working capital to sales ratio
• Expect FY20 adjusted free cash flow of >$1bn
• Cash supports strong YTD returns to shareholders
• Shares repurchased $478m
• Dividends $574m
Average working capital to sales (%)
8.7% 8.9% 8.6% 8.3%9.6%
10.6%
9.0%
10.7%10.0%
Jun 13 Jun 14 Jun 15 Jun 16 Jun 17 Jun 18 Jun 19 Mar 20
Legacy Amcor
Combined

Strong balance sheet and debt profile
17
Balance sheetMarch
2020
Net debt ($ million) 5,984
Net interest expense ($ million) 140
EBITDA interest cover (x) 10.1
Leverage: Net debt / LTM EBITDA (x) 3.1
Industry leading, investment grade balance sheet
• Investment grade balance sheet
• S&P: BBB, Moody’s: Baa2
• Strong balance sheet metrics
• Leverage of 3.1x in line with 3.1x in March 2019
quarter FY20 leverage estimate of 2.8x
• No significant maturities within 12 months
• Ample liquidity of $1.9 bn
• Cash of $0.5 bn and $1.4 bn undrawn committed
facilities
(1) Calculated as long-term drawn debt maturing within 12 months as a percentage of gross debt
Debt profileMarch
2020
Fixed / floating interest rate ratio 28% fixed
Undrawn committed facilities (USD billion) 1.4
Non-current debt maturity (years) 3.9
% of drawn debt maturing in NTM(1) 2%

18 Note: Reconciliations of the 2020 projected non-GAAP measures are not included herein because the individual components are not known with certainty as individual financial statements for fiscal 2020 have not been completed.
Fiscal 2020 guidance
FY19 combinedPrevious FY20
guidance
Current FY20
guidance
Estimated adjusted EPS constant currency growth % 7-10% 11-12%
Adjusted EPS (cps) in constant currency terms 58.2 cents 62.0-64.0 cents* 64.6-65.2 cents*
Pre-tax synergy benefits $80 million $80 million
Adjusted cash flow before dividends (before cash integration costs) >$1 billion >$1 billion
Adjusted cash flow after dividends (before cash integration costs) $300 - $400 million $300 - $400 million
Cash integration costs ~$100 million ~$100 million
Additional guidance metrics for the 2020 fiscal year Previous FY20
guidance
Current FY20
guidance
Corporate expenses before synergies in constant currency terms $160 - $170 million $160 - $170 million
Net interest costs in constant currency terms $210 - $230 million $190 - $200 million
Adjusted effective tax rate 21-23% 21-23%
Increased outlook for fiscal year ending June 30, 2020
*Implied constant currency EPS range calculated using average fiscal 2019 exchange rates. Assuming current exchange rates prevail for the remainder of the year, currency would have an unfavourable impact on
reported EPS of approximately 1.0-1.5 US cents per share.
The COVID-19 pandemic creates significantly higher degrees of uncertainty and additional complexity with regard to estimating future
financial results. Assuming the Company and its supply chain partners and customers are able to continue operating with minimal
disruption, Amcor expects:

Near and long term drivers of shareholder value

Consistent shareholder returns
20
• Defensive organic growth
• $180m synergy benefits
• Sustainable, compelling dividend
• $500m buy-back
Near term: controllable drivers of shareholder returns
Longer term: unchanged Shareholder Value Creation Model

Sustainability: Responsible packaging is the answer
21
Waste
management
infrastructure
Consumer
participation
Packaging
design
Greenhouse gas emissions*
Recycling rate (%)
5
7
27
26
Flexiblepackaging
Composite carton
Aluminium can
Glass bottle
6
PET bottle
0
30
66
33
10
Source: PTIS Global. *Kg-CO2 equivalent, ‘000

Uniquely positioned, fully committed, continuing to invest
22
Develop all our
packaging to be
recyclable or
reusable by 2025
Increase use of
post-consumer
recycled content
Collaborate to increase
recycling rates worldwide
2025 Pledge announced Jan 2018
R&D infrastructure,
manufacturing equipment and
partnerships
Targeted investment:
$50 million

Summary
23
To our employees around the world: “Thank You!”
1. COVID-19: Well positioned and demonstrating resilience
2. Strong YTD result and increased FY20 outlook
3. Bemis acquisition ahead of Year One expectations
4. Clear visibility to near term shareholder returns
5. Substantial opportunities to create value over the long term

Appendix slidesAmcor profile

Amcor Strategy
25
Significant growth opportunitiesTHE leading global packaging company
Our businesses
FOCUSED PORTFOLIO:
Our differentiated capabilities
THE AMCOR WAY:
Our winning aspiration
WINNING FOR CUSTOMERS, EMPLOYEES,
INVESTORS AND THE ENVIRONMENT:
Flexible Packaging Rigid Packaging Specialty Cartons Closures
Amcor
profile

Global leader in primary consumer packaging
• Founded in Australia in 1860 - NYSE
(AMCR) and ASX (AMC) listed
• $13 bn sales with ~250 plants,
~50,000 employees, 40+ countries
• Global leader in flexible and
rigid consumer packaging
Scale
PlayerGlobal
Reach
Innovation
Leader
Sustainability
Focus
Strong
Financial
Metrics
26 Note: Sales, people and site information presented on a combined basis.
Reflects FY19 combined sales revenue which excludes results from flexible packaging plants in Europe and the United States which were required to be sold in order to secure anti-trust approval for the Bemis acquisition.
Amcor
profile

Scale position in every region
27Note: Sales, EBITDA, cash flow, people and site information presented on a combined basis.
(1) Excludes estimated synergy benefits of $180 million expected to be realized by the end of the 2022 fiscal year.
(2) Adjusted combined cashflows before capital expenditure, dividends and transaction costs for FY19.
Flexibles
Asia Pacific
Rigid Packaging
North America
Rigid Packaging
Latin America
Flexibles
EMEA
Flexibles
Latin America
#1Specialty Cartons,
Global
~$13 bnSales
~$1.9 bn1
EBITDA
>$1.4 bn2
Cash Flow
~50,000People
~250Sites
46%
24%
3%
27%
North America Western Europe
ANZ Emerging Markets
#1
#1
#1
#1Flexibles
North America#1
#1
FY19
sales mix
Amcor
profile
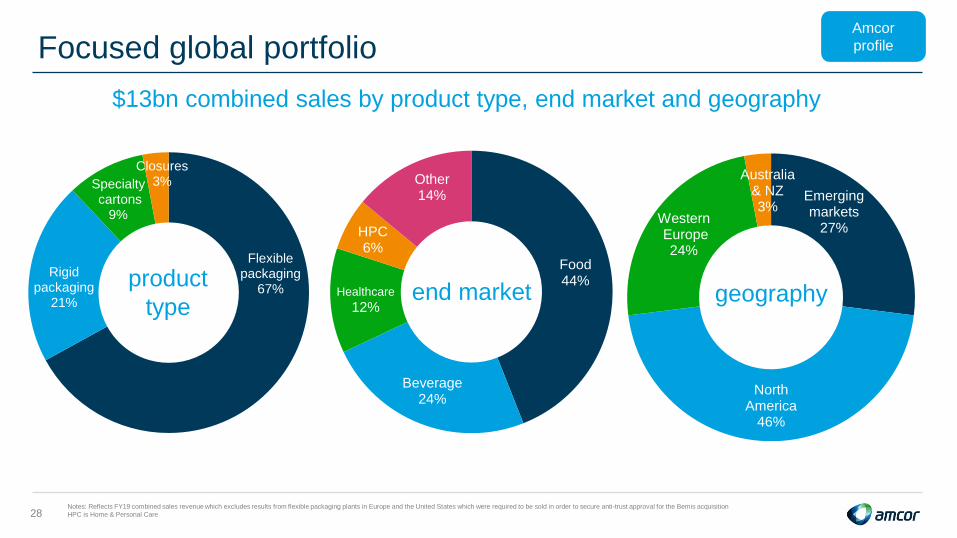
Focused global portfolio
28
Amcor
profile
$13bn combined sales by product type, end market and geography
Notes: Reflects FY19 combined sales revenue which excludes results from flexible packaging plants in Europe and the United States which were required to be sold in order to secure anti-trust approval for the Bemis acquisition
HPC is Home & Personal Care
Flexible packaging
67%
Rigid packaging
21%
Specialtycartons
9%
Closures3%
product
type
Food44%
Beverage24%
Healthcare
12%
HPC6%
Other14%
end market
Emerging markets
27%
North America
46%
WesternEurope24%
Australia & NZ3%
geography

Amcor Flexibles overview
29
Notes: Reflects FY19 combined sales revenue which excludes results from flexible packaging plants in Europe and the United States which were required to be sold in order to secure anti-trust approval for the Bemis acquisition.
Non-GAAP measures exclude items which management considers as not representative of ongoing operations. Further details related to non-GAAP measures and reconciliations to U.S. GAAP measures can be found
in the appendix section.
Europe, Middle
East and Africa, 38%
Asia Pacific,
15%
North America,
36%
Latin America,
11%
Europe, Middle East and Africa
Asia Pacific
North America
Latin America
Combined sales by
end market
Combined sales by
region
Food, 54%
Healthcare, 15%
Beverage, 8%
Home & Personal care, 6%
Other consumer,
17%
FoodHealthcareBeverageHome & Personal careOther consumer
2019 combined
sales
2019 combined
Adjusted EBIT
Plants Countries Employees
$10.1 bn $1.2 bn ~190 38 ~43,000
Amcor
profile

29%
37%
28%
6%
North
America
$2.3 bn
sales
73%
13%
14%
Cold fill beverage Hot fill beverage Specialty containers Closures
Latin America
$0.6 bn sales
Sales by geography
81%
19%
North America Latin America
Sales by product category
Amcor Rigid Packaging overview
30 Notes: Non-GAAP measures exclude items which management considers as not representative of ongoing operations. Further details related to non-GAAP measures and reconciliations to U.S. GAAP measures can be found in the appendix section.
2019 Sales 2019 Adjusted
EBIT
Plants Countries Employees
$2.9 bn $308 m ~60 12 ~6,000
Amcor
profile
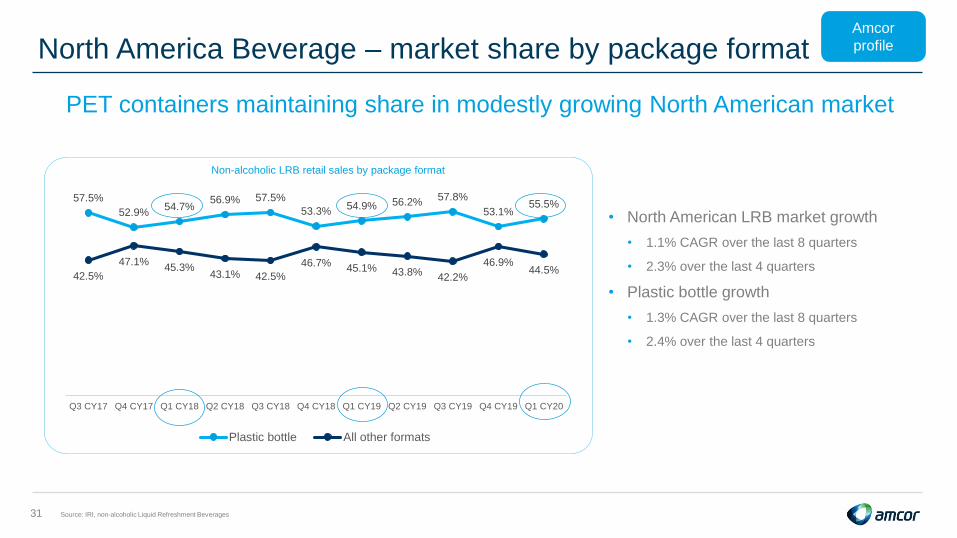
North America Beverage – market share by package format
31
57.5%
52.9%54.7%
56.9% 57.5%
53.3%54.9% 56.2%
57.8%
53.1%55.5%
42.5%
47.1%45.3%
43.1% 42.5%
46.7%45.1% 43.8%
42.2%
46.9%44.5%
Q3 CY17 Q4 CY17 Q1 CY18 Q2 CY18 Q3 CY18 Q4 CY18 Q1 CY19 Q2 CY19 Q3 CY19 Q4 CY19 Q1 CY20
Plastic bottle All other formats
Source: IRI, non-alcoholic Liquid Refreshment Beverages
PET containers maintaining share in modestly growing North American market
• North American LRB market growth
• 1.1% CAGR over the last 8 quarters
• 2.3% over the last 4 quarters
• Plastic bottle growth
• 1.3% CAGR over the last 8 quarters
• 2.4% over the last 4 quarters
Amcor
profile
Non-alcoholic LRB retail sales by package format

Appendix slidesSustainability

Our Sustainability “Point of View”
33
To Preserve food
and healthcare
products
To Protect
consumers
To Promote
brands
Consumers want
packaging to be:
• Cost effective
• Convenient
• Easy to use
• Great looking
AND
Sustainable, leading
to LESS WASTE
Achieving less
waste takes:
1. Packaging Design
2. Waste Management
Infrastructure
3. Consumer
Participation
To innovate and
develop new
products
To collaborate
with stakeholders
To inform the
debate
There will always be a
role for packagingRequirements of packaging are
increasing: end of life solutions /
waste reduction are critical
Responsible packaging
is the answer
Amcor is uniquely
positioned and taking
action to lead the way
Sustainability

There will always be a role for packaging
34 Sources: EPA.gov – “Reducing Wasted Food: How Packaging Can Help” ; Association for the Dutch Plastic Packaging Industry. Referenced by Goldman Sachs Equity Research. The Plastics Paradox – 17 July 2019; U.N. Food and Agriculture Organization (2018).
Extending shelf life Reducing food waste Protecting the environment
Lettuce
Fresh
red meat
Fresh
pasta
Cheese
2-4
14
2-3
21
3
60
7
180
Non-Modified Atmosphere Packaging
Modified Atmosphere Packaging
Refrigerated Shelf Life in days
3rd
Food waste accounts for
8%of global GHG emissions
Alternative
pkg, %
product
waste
Plastic
pkg, %
product
waste
Grams of
CO2
Saved
Steak 34% 18% 2,100
Cheese 5% 0.1% 41
Bread 11% 1% 148
Cress 42% 3% 186
30% of food is
wasted globally
If it were a country, food
waste would be ranked
for highest GHG
emissions
Sustainability

Requirements are increasing: end of life solutions are critical
35 Sources: Accenture 2019, Nielsen 2016, Amcor analysis.
Consumers buying more
environmentally friendly products
Today vs
5 years ago
Next 5 years
72%
81%
of global consumers
(76% of millennials)
Are willing to pay morefor sustainable goods
66%
<1centUS cents per bottle
Small price to pay
or 0.45% retail price
~1centUS cents per container
or 0.25% retail price
Sustainability

Responsible packaging is the answer
36
Waste
management
infrastructure
Consumer
participation
Packaging
design
Greenhouse gas emissions*
Recycling rate (%)
5
7
27
26
Flexiblepackaging
Composite carton
Aluminium can
Glass bottle
6
PET bottle
0
30
66
33
10
Source: PTIS Global. *Kg-CO2 equivalent, ‘000

Uniquely positioned and taking action: Innovation
37
Lighter Weight Recyclable
Sustainability

38
21gr
18gr
Light Weight Recyclable
100%
PCR
Recycled content
Uniquely positioned and taking action: InnovationSustainability

Uniquely positioned and taking action: Innovation
39
less virgin resin used p.a. by 2025
recycled resin demand created
through 2025
Effective markets:
>1 million tonnes
Continued innovation:
>200k tonnes
Brand relaunch in
PET
Sustainability
Existing product
now 100% recycled
PET
Conversion from
glass to 100%
recycled PET

Uniquely positioned and taking action: Collaborating and informing
40
Bilateral top-to-top customer summits
Sustainability

Appendix slidesFiscal 2020 YTD results – supplementary schedules and reconciliations

Year to date cost synergies of ~$55(1) million;
Integration progressing well and continue to expect $180 million(2) by end of fiscal 2022
Bemis acquisition: On track for $80m of synergies in FY20
42 (1) Total pre tax synergy benefits delivered YTD20 were $55 million, with $40 million recognised in the Flexibles segment and the remaining $15 million recognised as a reduction in corporate expenses.
(2) Pre-tax annual net cost synergies.
Procurement Operations G&A & othercosts
Total costsynergies
40%
20%
40% 100%
Expected from the following areas: Estimated realization ($m):
80
130
180
FY 2020 FY 2021 FY 2022
55 5555

FX translation impact
43
EUR, 20-30%
Other currencies(3),
20-30%
USD(2), 45-55%
EUR:USD
Euro weakened vs USD, Average
USD to EUR rate YTD20 0.9032 vs
YTD19 0.8721
USD million impact on YTD
adjusted net income
(4%) (8)
Other currencies(3):USD
Other currencies weighted average
vs USD weakened for YTD20 vs
YTD19 average rates
USD million impact on
YTD adjusted net income
(4%) (5)
(1) Approximate range based on estimated combined adjusted net income by currency.
(2) Includes all businesses effectively managed as USD functional currency businesses.
(3) Includes all currencies other than USD and EUR.
Total currency impact $ million
Adjusted EBIT (17)
Adjusted net income (13)
Combined net income currency
exposures(1)YTD currency impact

Reconciliations of non-GAAP financial measures
44(1) Includes costs associated with the Bemis acquisition. The nine months ended March 31, 2020 includes $58 million of acquisition related inventory fair value step-up recognized in the September 2019 quarter.
(2) The nine months ended March 31, 2020 includes $26 million of sales backlog amortization related to the Bemis acquisition recognized in the September 2019 quarter.
(3) Includes Bemis and remedy adjustments. EPS also adjusts for new shares issued to complete the Bemis combination.

Reconciliations of non-GAAP financial measures
45
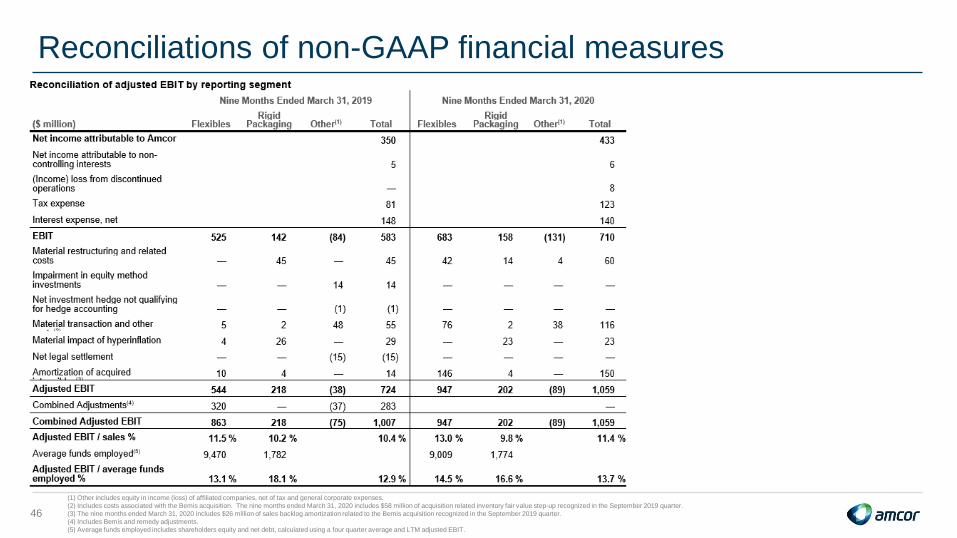
Reconciliations of non-GAAP financial measures
46
(1) Other includes equity in income (loss) of affiliated companies, net of tax and general corporate expenses.
(2) Includes costs associated with the Bemis acquisition. The nine months ended March 31, 2020 includes $58 million of acquisition related inventory fair value step-up recognized in the September 2019 quarter.
(3) The nine months ended March 31, 2020 includes $26 million of sales backlog amortization related to the Bemis acquisition recognized in the September 2019 quarter.
(4) Includes Bemis and remedy adjustments.
(5) Average funds employed includes shareholders equity and net debt, calculated using a four quarter average and LTM adjusted EBIT.

Reconciliations of non-GAAP financial measures
47