fiscal 2017 operating budget - financial planning & analysis operating budget.pdf · fiscal...
TRANSCRIPT
Fiscal 2017 Operating Budget
The Ohio State University Office of Business and Finance
Financial Planning and Analysis

FISCAL 2017
The Ohio State University | Financial Planning and Analysis 2
Foundation of The Ohio State University’s Academic Mission .................................................................. 6
Strategic Context ....................................................................................................................................... 6
Core Goals ............................................................................................................................................. 6
Discovery Themes at The Ohio State University ................................................................................... 7
Strategic Finance: Planning for Success ............................................................................................... 8
Fiscal 2017 University Budget: Key Themes............................................................................................. 8
Fiscal 2017 Budget: Financial Statements ................................................................................................. 10
Consolidated Financial Statements ............................................................................................................ 11
University Financial Statement (excluding Health System and OSUP): ..................................................... 12
University Budget: Revenue .................................................................................................................... 13
Tuition and Fees .................................................................................................................................. 13
State Support ....................................................................................................................................... 16
Grants and Contracts ........................................................................................................................... 18
Sales and Service Revenues ............................................................................................................... 19
Advancement ....................................................................................................................................... 20
University Budget: Expense ................................................................................................................... 21
Salaries and Benefits ........................................................................................................................... 21
Student Financial Aid ........................................................................................................................... 22
Fee Authorizations ............................................................................................................................... 24
Supplies, Services & Other Expenses ................................................................................................. 24
Financial Services and Investments ........................................................................................................ 25
Investment Income ............................................................................................................................... 26
Debt...................................................................................................................................................... 26
Health System ............................................................................................................................................. 27
OSU Wexner Medical Center Health System .......................................................................................... 27
Revenue Drivers .................................................................................................................................. 28
Expense Drivers ................................................................................................................................... 28
OSU Physicians, Inc. .................................................................................................................................. 29
University Budget Process .......................................................................................................................... 31
Budget System ........................................................................................................................................ 31
Fund Accounting ...................................................................................................................................... 31
Table of Contents

FISCAL 2017
The Ohio State University | Financial Planning and Analysis 3
Allocation of Funds .................................................................................................................................. 32
Board of Trustees ........................................................................................................................................ 34
Appendices ................................................................................................................................................. 35
Columbus Campus Tuition and State Share of Instruction History ......................................................... 35
Undergraduate Tuition & Fees – AY 2017 .............................................................................................. 36
Student Fee Schedule (per semester) ........................................................................................................ 37
Columbus Campus .................................................................................................................................. 37
Undergraduate .................................................................................................................................... 37
Undergraduate – Distance Learning ................................................................................................... 37
Columbus Campus .................................................................................................................................. 38
Technology Fees ................................................................................................................................. 38
Program Fees ...................................................................................................................................... 38
Graduate and Professional ...................................................................................................................... 39
Masters & PhD .................................................................................................................................... 39
Masters & PhD – Distance Learning .................................................................................................... 39
Master of Accounting .............................................................................................................................. 40
MBA ........................................................................................................................................................ 40
MBLE ...................................................................................................................................................... 41
Working Professional MBA ..................................................................................................................... 41
MHRM ..................................................................................................................................................... 42
EMBA ...................................................................................................................................................... 42
MBOE ..................................................................................................................................................... 43
Specialized Master in Business – Finance ............................................................................................. 43
Graduate Minor in Business for Health Sciences .................................................................................... 44
Dentistry – Rank 1 .................................................................................................................................. 45
Dentistry – Ranks 2, 3, 4 ........................................................................................................................ 45
Law .......................................................................................................................................................... 46
Medicine .................................................................................................................................................. 47
Master in Genetic Counseling ................................................................................................................. 48
Master of Occupational Therapy ............................................................................................................. 48
Master/Doctor of Physical Therapy ......................................................................................................... 49
Master of Health Administration .............................................................................................................. 49
Master of Public Health ........................................................................................................................... 50
Public Health PEP ................................................................................................................................... 50
Pharmacy................................................................................................................................................. 51
FISCAL 2017
The Ohio State University | Financial Planning and Analysis 4
Optometry – Ranks 1 and 2..................................................................................................................... 52
Optometry – Ranks 3 and 4..................................................................................................................... 52
AuD .......................................................................................................................................................... 53
MSL ......................................................................................................................................................... 53
Master of Social Work ............................................................................................................................. 54
Vet Medicine ........................................................................................................................................... 55
Master in Agricultural and Extension Education – Distance Learning ................................................... 56
Master of Global Engineering Leadership (MGEL)-Distance Learning .................................................. 56
Lima, Mansfield, Marion & Newark Regional Campuses ........................................................................ 57
Undergraduate ..................................................................................................................................... 57
Graduate .............................................................................................................................................. 58
Agricultural Technical Institute ................................................................................................................ 59
Annual Fee History – Columbus Campus Resident Fees .......................................................................... 60
Summary of Typical Student Fees – Undergraduates Columbus ............................................................... 61
FISCAL 2017
The Ohio State University | Financial Planning and Analysis 5
The Ohio State University continues to move forward to achieve its vision to be the world’s preeminent public comprehensive university, solving problems of worldwide significance and, to fulfill our mission to advance the well-being of the people of Ohio and the global community through the creation and dissemination of knowledge.
President Drake laid out a renewed commitment to access, affordability and excellence in his 2020 Vision, which reflects the ideals that have defined the role of public, land-grant institutions since their inception. Student debt is a significant issue, and the university is committed to addressing it.
All strategic decisions are made within the framework of these priorities to focus resources on the key drivers of access, affordability and excellence. Consistent with the 2020 Vision to generate $400 million for these priorities over five years, the university is focused on efficiencies to make better use of current resources and innovative funding strategies to produce new revenue streams.
With fiscal 2016 closing, the university remains financially strong. Tuition revenue is stable as student applications and enrollment continue to grow. However, there are a number of challenges that we must manage. We anticipate continued pressure on government expenditures for research and student financial aid.
The university is focused on innovative funding strategies in light of our focus on student affordability and our expectation that traditional government revenue sources will not grow significantly. Both revenue enhancement and expense streamlining are needed to ensure that resources are in place to fund both current needs and our strategic initiatives. The 2020 Vision goal of generating $400 million over five years includes $200 million of administrative efficiencies and $200 million in new revenue from sources other than tuition or taxpayers.
The lease of our parking operations provides an example of the university’s commitment to redirecting resources to core priorities. Through that partnership, the university received a $483 million payment that was placed in our long-term investment pool for key priorities. From the investment yield, $22.5 million was distributed to campus priorities in fiscal 2016, bringing the total since inception to $105.9 million. An additional $23 million is expected to be distributed in fiscal 2017. The money is being used to fund student scholarships, faculty initiatives and research, investments in the Arts District and transportation and sustainability.
The financial performance of the Health System continues to be strong in fiscal 2016 and the 2017 budget continues to build on that performance while adding much needed capacity to the system. In fiscal 2017, payment transformation will continue to increase downward pressure on revenues as payers continue to link payments to quality, cost and outcomes. As these new models take shape changes to care coordination will drive the need for efficient and effective care models through continued collaboration between the Health System, OSUP and the College of Medicine.
This document presents The Ohio State University’s fiscal 2017 Budget for approval. The Budget is presented on a consolidated basis with the university, the Health System and OSU Physicians, Inc. also presented as unique operating entities. This document also provides narratives on the overall budgeting process, and the key drivers of strategic decisions, revenue and expenses budgeted for fiscal 2017.
Vision
The Ohio State University will be the world’s preeminent public comprehensive university, solving problems of worldwide significance.
FISCAL 2017
The Ohio State University | Financial Planning and Analysis 6
Foundation of The Ohio State University’s Academic Mission
In his 2020 Vision, President Drake has directed the university to focus on three specific areas that underpin Ohio State’s academic mission:
1. Our commitment to access, affordability, and excellence as the land-grant university. We will continue to work to reduce student debt. Education transforms lives, but only if we can deliver on our promise of access to an excellent and affordable education.
2. Our commitment to community engagement. We will continue to focus on our motto of Education for Citizenship, engaging with our community partners to extend our scholarship and knowledge with the full force and precision of one of the most powerful institutions in the world.
3. Our commitment to assure that Ohio State must be a national model of inclusiveness and diversity. We will continue to lead our colleagues in exemplifying what it means to be an inclusive university in the 21st century, a place where diversity is a defining characteristic and a source of strength.
Strategic Context
The fiscal 2017 budget is further built upon the foundation of The Ohio State University strategic plan. The plan outlines four core goals, with a specific focus for investment across three discovery themes: Health and Wellness, Energy and Environment, Food and Production Safety.
Core Goals
Four institution-wide goals are fundamental to Ohio State’s mission and future success and must be reflected in all that we accomplish:
Teaching and Learning: to provide an unsurpassed, student-centered learning experience led by engaged, world-class faculty and enhanced by a globally diverse student body.
Research and Innovation: to create distinctive and internationally recognized contributions to the advancement of fundamental knowledge and scholarship and to solutions of the world’s most pressing problems.
Outreach and Engagement: to establish mutually beneficial partnerships with the citizens and institutions of Ohio, the nation, and the world so that our communities are actively engaged in the exciting work of The Ohio State University.
Mission
We exist to advance the well-being of the people of Ohio and the global community through the creation and dissemination of knowledge.

FISCAL 2017
The Ohio State University | Financial Planning and Analysis 7
Resource Stewardship: to become the model for an affordable public university recognized for financial sustainability, unsurpassed management of human and physical resources, and operational efficiency and effectiveness.
Discovery Themes at The Ohio State University
The University’s move to eminence will continue to be founded in the University’s four discovery themes of Health and Wellness, Food Production and Security, Energy and Environment and Humanities and Arts. These themes are based on special, broad, and deep expertise across the university. Through these discovery themes, in fiscal 2017, the university plans to spend another $34.5 million of its resources and activities on finding durable solutions to issues of global as well as regional importance in fiscal 2017. The discovery themes are essential elements of Ohio State’s strategic planning. The initial area of focus for all four of the Discovery Themes is data analytics.
Data analytics is a process of collecting, organizing, integrating and examining vast amounts of information in order to extract insight. With today’s increasingly large, complex, and diverse data sets, problem-solving is more data driven than ever. In this environment, the ability to find, analyze, and interact with these data will be the difference-maker in accelerating the pace of change—from disease prognosis to smart materials; from environmental mapping to sustainable energy systems; from bioinformatics to precision agriculture. As part of this focus, the university has established a new interdisciplinary undergraduate major in data analytics. This major was designed by the colleges of Arts and Sciences,
Discovery Themes
Health and Wellness: will allow faculty from Ohio State’s seven health sciences colleges and the Wexner Medical Center to work with partners across the university in nutrition, social work, health education, and public policy, to cite but a few examples. These experts will focus on such issues as disease prevention, community health, and health systems.
Energy and Environment: will create an unprecedented interdisciplinary collaboration of experts spanning the university and touching upon every specialization to fully address issues related to energy and environment. By working with experts beyond the university, Ohio State faculty will lead the way in developing scientific and policy responses to the global need for energy and the associated effects on the environment.
Food Production and Security: will draw on Ohio State’s unique expertise in food, agricultural, and environmental sciences as well as the arts and sciences, health sciences, business, law, and beyond. Working with partners within and outside the university, these experts will focus on enhancing the quality of food and animal feed and ensuring an adequate, affordable and safe food supply for a global population.
Humanities and Arts: will engage students and interdisciplinary groups of faculty in signature scholarship across the humanities and the arts. These experts will initiate a university-wide conversation focused on defining the humanities and the arts, exploring current topics and trends, and addressing today's most important concerns

FISCAL 2017
The Ohio State University | Financial Planning and Analysis 8
Engineering, Medicine and Fisher College of Business. With this new degree offering, Ohio State becomes the first university in the country to offer an undergraduate degree in data analytics.
Faculty from every college and all six campuses of the university will be encouraged to actively contribute to these discovery themes. Meanwhile, as these colleagues concentrate their efforts on the issues the discovery themes are meant to address, they and others will continue to advance our understanding of history and philosophy, languages and cultures, and the arts as they pursue excellence in our core goals. Our programs in medicine, agriculture, veterinary sciences, engineering, business and many other fields of study are rich and strong because they are grounded by excellence in the arts, humanities and physical as well as social sciences.
Strategic Finance: Planning for Success
In recent years, we have launched a number of successful initiatives to increase the resources available to support the core academic mission. Revenue generation initiatives have included the establishment of unique partnerships and collaborations, with organizations such as Nike, Huntington Bank and Nationwide Insurance; innovative financing strategies such as the issuance of $500 million in century bonds; asset strategies such as the 50-year parking lease; and strengthening the endowment through diversification and value orientation strategies. We are currently evaluating an opportunity to accelerate progress toward our sustainability goals through the Comprehensive Energy Management Project.
Going forward, the university must continue to focus on generating additional revenue from traditional and innovative sources, including further exploration of public/private partnerships, enhanced funding, technology commercialization and endowment growth. We continue to explore these untapped revenue opportunities in addition to the leased parking funding, century bond funding and current affinity contracts. We continue to focus on our financial investment strategies, streamlining activities and procurement strategies to maximize the funding available to advance our goals in Teaching and Learning, Research and Innovation, Outreach and Engagement, and Resource Stewardship.
The university played a leadership role in the Ohio Task Force on Affordability and Efficiency, which in October 2015 produced recommendations for all Ohio public institutions of higher education. The university will continue to work, both as an institution and with other colleges and universities in Ohio, to produce efficiencies and new resources that benefit our students. Among our continuing efforts, we will build on successful initiatives such as the university’s strategic procurement program, which has produced savings by leveraging our buying power with a focused group of suppliers; implementing systems to improve operational efficiencies; lean process reengineering; and supporting sustainability by moving to paperless systems.
By investing in the activities as outlined above, the university will meet President Drake’s goals of increasing revenue by $200 million and implementing administrative efficiencies that generate $200 million in savings over five years.
Fiscal 2017 University Budget: Key Themes The major themes for the budget this year are affordability, access and quality as well as safety and security issues for students and systems. The Ohio State University has frozen in-state undergraduate tuition and mandatory fees since 2012-13, allowing two classes to graduate without ever experiencing an increase. At the same time, the university will expand the President’s Affordability Grants, which supply
FISCAL 2017
The Ohio State University | Financial Planning and Analysis 9
need-based financial aid for low- and middle-income Ohio undergraduates, to provide $20 million in aid for students in fiscal 2017. This grant program was established with $15 million in fiscal 2016 as part of the 2020 Vision plan to increase need-based student aid by $100 million over five years.
The final state budget as passed contained a freeze on in-state undergraduate instructional fees for all institutions, along with a corresponding increase in the State Share of Instruction (SSI). The SSI pool was increased 4.7% in fiscal 2016 and another 4.0% in fiscal 2017.
Fiscal 2017 will be the fourth year of the State of Ohio’s new SSI funding model for higher education. This outcome-based funding model was established based on recommendations developed by the Commission on Higher Education under the leadership of former Ohio State President Gee. This new model emphasizes degree completion as the main driver for funding and course completions as secondary. It also rewards the ability of the university to retain the best and brightest in Ohio after graduation as well as recognizing the additional financial requirements for assisting at-risk students to degree attainment. The university continues to assess the impacts of the funding model change within the context of growth in distance education and other non-traditional programs across the state.
The fiscal 2017 Budget continues our commitment to hire new tenure or tenure-track faculty by 2019 who will be specializing in disciplines that support the Discovery Themes. In fiscal 2017, a projected $11.1 million will be spent in support of these themes, an increase of 105% over fiscal 2016. A portion of the funding for these positions is provided through the parking endowment. Start-up funding is also budgeted to assure that the university can hire the best faculty for our programs.
The budget also focuses on increasing the institutionally funded financial aid for undergraduate students, supporting colleges with additional revenue generated from tuition dollars and state subsidy dollars, additional compensation for faculty and staff, and providing funding for priority requests for support operations, all while assuring that general funds are balanced.
The fiscal 2017 Budget Plan outlines important aspects of the university’s financial strategy in the year ahead. The budget plan, coupled with our Annual Financial Report, presents our current financial state and our future opportunities and challenges. It illustrates our financial path for achieving our vision of being the world’s preeminent public comprehensive university.

FISCAL 2017
The Ohio State University | Financial Planning and Analysis 10
Fiscal 2017 Budget: Financial Statements
The fiscal 2017 budget includes a consolidated financial statement in addition to discrete financial statements for each of the following segments:
The Ohio State University The Ohio State University Health System The Ohio State University Physicians
Given the operational differences between segments, we will provide narratives around the key drivers for each segment.
FISCAL 2017
The Ohio State University | Financial Planning and Analysis 11
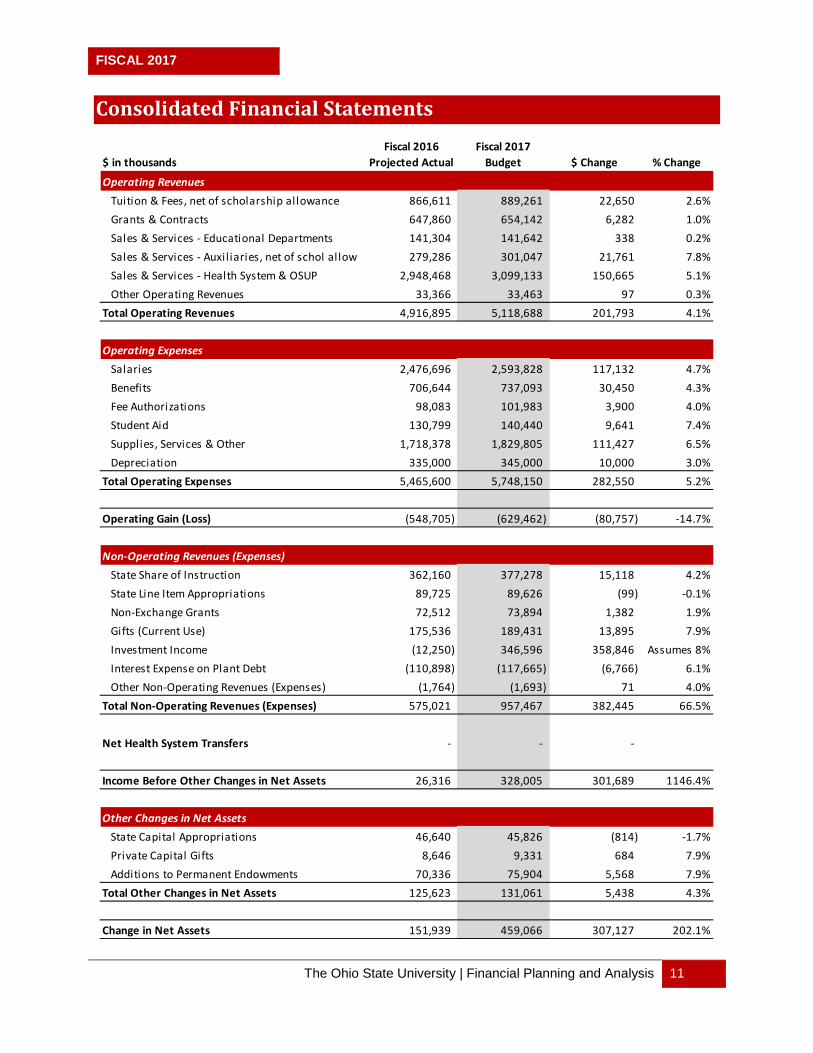
Consolidated Financial Statements
$ in thousandsFiscal 2016
Projected ActualFiscal 2017
Budget $ Change % Change
Operating RevenuesTuition & Fees, net of scholarship allowance 866,611 889,261 22,650 2.6%Grants & Contracts 647,860 654,142 6,282 1.0%Sales & Services - Educational Departments 141,304 141,642 338 0.2%Sales & Services - Auxil iaries, net of schol allow 279,286 301,047 21,761 7.8%Sales & Services - Health System & OSUP 2,948,468 3,099,133 150,665 5.1%Other Operating Revenues 33,366 33,463 97 0.3%
Total Operating Revenues 4,916,895 5,118,688 201,793 4.1%
Operating ExpensesSalaries 2,476,696 2,593,828 117,132 4.7%Benefits 706,644 737,093 30,450 4.3%Fee Authorizations 98,083 101,983 3,900 4.0%Student Aid 130,799 140,440 9,641 7.4%Supplies, Services & Other 1,718,378 1,829,805 111,427 6.5%Depreciation 335,000 345,000 10,000 3.0%
Total Operating Expenses 5,465,600 5,748,150 282,550 5.2%
Operating Gain (Loss) (548,705) (629,462) (80,757) -14.7%
Non-Operating Revenues (Expenses)State Share of Instruction 362,160 377,278 15,118 4.2%State Line Item Appropriations 89,725 89,626 (99) -0.1%Non-Exchange Grants 72,512 73,894 1,382 1.9%Gifts (Current Use) 175,536 189,431 13,895 7.9%Investment Income (12,250) 346,596 358,846 Assumes 8%Interest Expense on Plant Debt (110,898) (117,665) (6,766) 6.1%Other Non-Operating Revenues (Expenses) (1,764) (1,693) 71 4.0%
Total Non-Operating Revenues (Expenses) 575,021 957,467 382,445 66.5%
Net Health System Transfers - - -
Income Before Other Changes in Net Assets 26,316 328,005 301,689 1146.4%
Other Changes in Net AssetsState Capital Appropriations 46,640 45,826 (814) -1.7%Private Capital Gifts 8,646 9,331 684 7.9%Additions to Permanent Endowments 70,336 75,904 5,568 7.9%
Total Other Changes in Net Assets 125,623 131,061 5,438 4.3%
Change in Net Assets 151,939 459,066 307,127 202.1%
FISCAL 2017
The Ohio State University | Financial Planning and Analysis 12
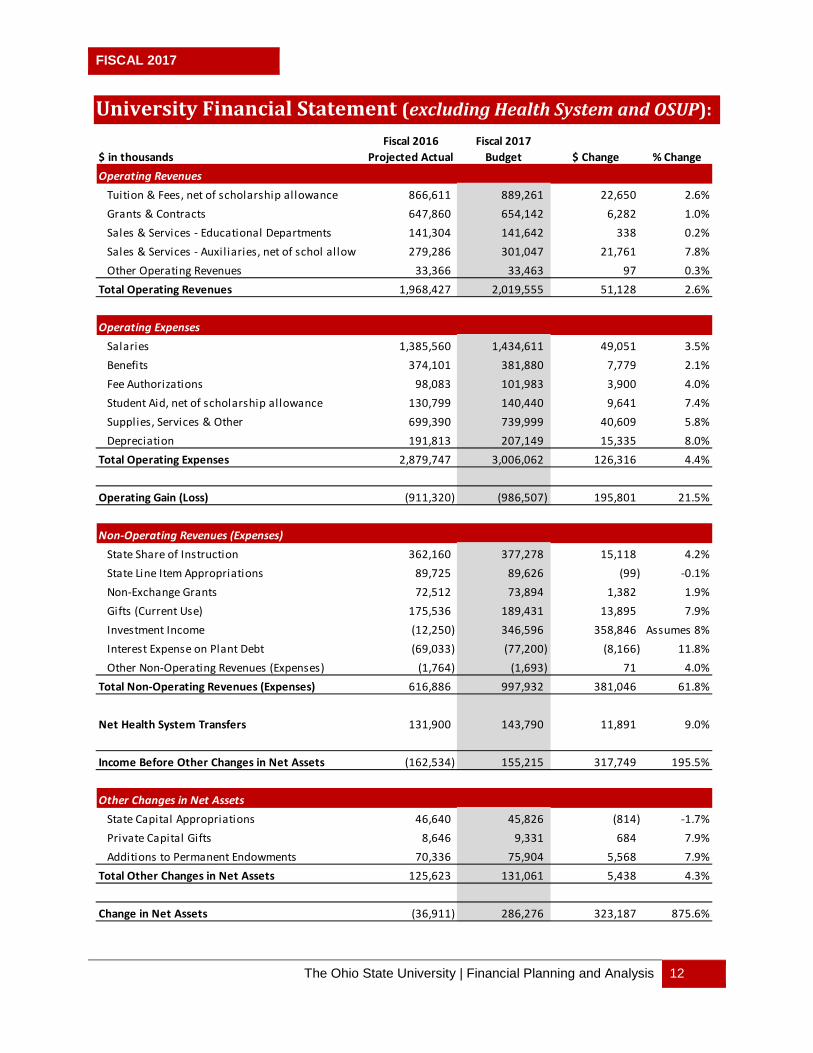
University Financial Statement (excluding Health System and OSUP):
$ in thousandsFiscal 2016
Projected ActualFiscal 2017
Budget $ Change % ChangeOperating Revenues
Tuition & Fees, net of scholarship allowance 866,611 889,261 22,650 2.6%Grants & Contracts 647,860 654,142 6,282 1.0%Sales & Services - Educational Departments 141,304 141,642 338 0.2%Sales & Services - Auxil iaries, net of schol allow 279,286 301,047 21,761 7.8%Other Operating Revenues 33,366 33,463 97 0.3%
Total Operating Revenues 1,968,427 2,019,555 51,128 2.6%
Operating ExpensesSalaries 1,385,560 1,434,611 49,051 3.5%Benefits 374,101 381,880 7,779 2.1%Fee Authorizations 98,083 101,983 3,900 4.0%Student Aid, net of scholarship allowance 130,799 140,440 9,641 7.4%Supplies, Services & Other 699,390 739,999 40,609 5.8%Depreciation 191,813 207,149 15,335 8.0%
Total Operating Expenses 2,879,747 3,006,062 126,316 4.4%
Operating Gain (Loss) (911,320) (986,507) 195,801 21.5%
Non-Operating Revenues (Expenses)State Share of Instruction 362,160 377,278 15,118 4.2%State Line Item Appropriations 89,725 89,626 (99) -0.1%Non-Exchange Grants 72,512 73,894 1,382 1.9%Gifts (Current Use) 175,536 189,431 13,895 7.9%Investment Income (12,250) 346,596 358,846 Assumes 8%Interest Expense on Plant Debt (69,033) (77,200) (8,166) 11.8%Other Non-Operating Revenues (Expenses) (1,764) (1,693) 71 4.0%
Total Non-Operating Revenues (Expenses) 616,886 997,932 381,046 61.8%
Net Health System Transfers 131,900 143,790 11,891 9.0%
Income Before Other Changes in Net Assets (162,534) 155,215 317,749 195.5%
Other Changes in Net AssetsState Capital Appropriations 46,640 45,826 (814) -1.7%Private Capital Gifts 8,646 9,331 684 7.9%Additions to Permanent Endowments 70,336 75,904 5,568 7.9%
Total Other Changes in Net Assets 125,623 131,061 5,438 4.3%
Change in Net Assets (36,911) 286,276 323,187 875.6%

FISCAL 2017
The Ohio State University | Financial Planning and Analysis 13
University Budget: Revenue
Tuition and Fees
Gross tuition and fees, before scholarship allowance, are expected to increase by $27 million, or 2.6%, to $1.07 billion. After applying a scholarship allowance of $185.1 million, net tuition and fees are expected to increase by $22.7 million, or 2.6% to $889 million. The increase is driven both by an increased number of new freshmen and an increased mix of non-resident students and increased non-resident fees for fiscal 2017. Instructional and mandatory fees will not increase in fiscal 2016 for undergraduate or graduate students. However, some tagged masters and professional programs that have differential fees are scheduled to increase. For all student levels, the non-resident surcharge will increase 5.0% across most colleges.
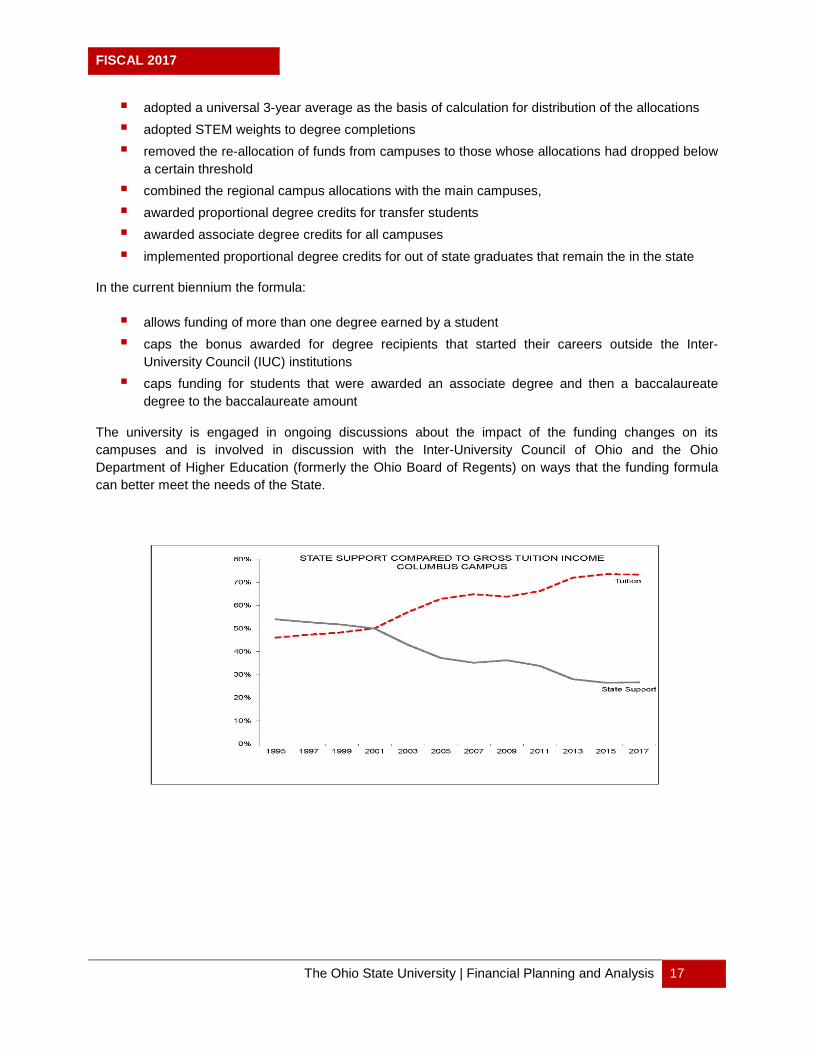
The university is committed to maintaining both affordability and excellence. In areas where limited increases are being applied, the proceeds are used to partially cover inflation and to invest in excellence within the core academic mission. Tuition and fees provide more than 69% of university revenue available to fund the core academic mission. The remaining 31% is largely provided through the State of Ohio instructional subsidy (SSI).
FISCAL 2017
The Ohio State University | Financial Planning and Analysis 14
Enrollment
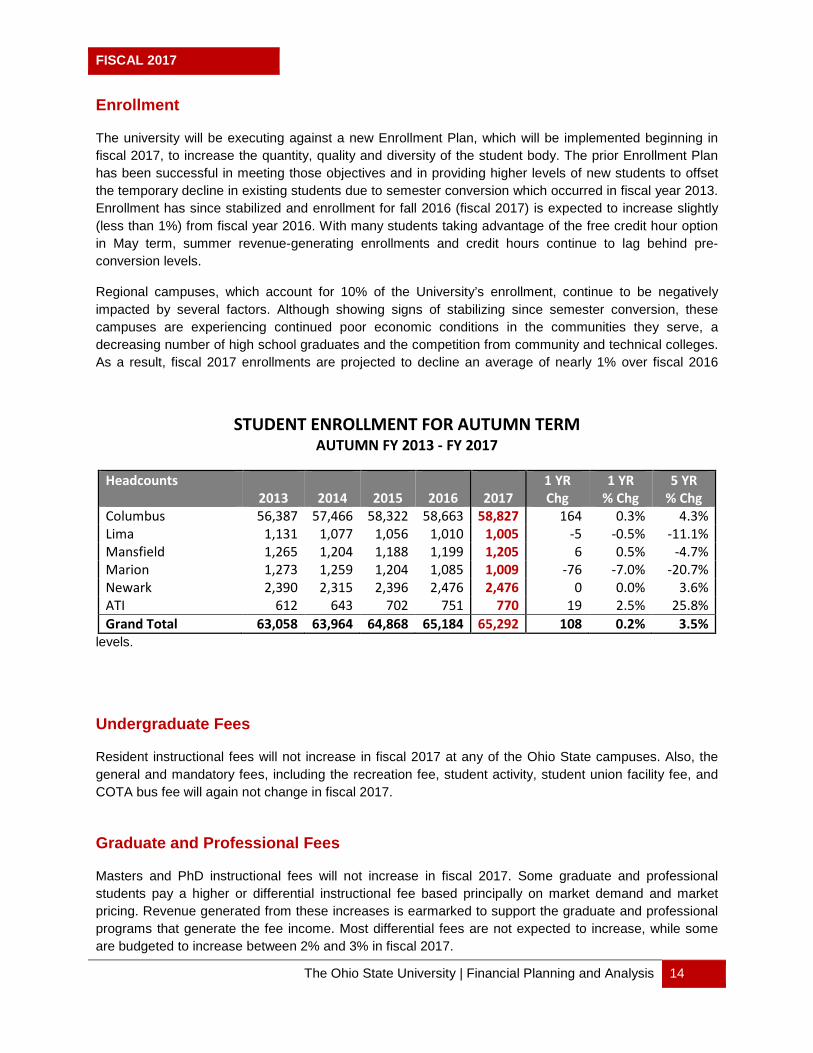
The university will be executing against a new Enrollment Plan, which will be implemented beginning in fiscal 2017, to increase the quantity, quality and diversity of the student body. The prior Enrollment Plan has been successful in meeting those objectives and in providing higher levels of new students to offset the temporary decline in existing students due to semester conversion which occurred in fiscal year 2013. Enrollment has since stabilized and enrollment for fall 2016 (fiscal 2017) is expected to increase slightly (less than 1%) from fiscal year 2016. With many students taking advantage of the free credit hour option in May term, summer revenue-generating enrollments and credit hours continue to lag behind pre-conversion levels.
Regional campuses, which account for 10% of the University’s enrollment, continue to be negatively impacted by several factors. Although showing signs of stabilizing since semester conversion, these campuses are experiencing continued poor economic conditions in the communities they serve, a decreasing number of high school graduates and the competition from community and technical colleges. As a result, fiscal 2017 enrollments are projected to decline an average of nearly 1% over fiscal 2016
levels.
Undergraduate Fees
Resident instructional fees will not increase in fiscal 2017 at any of the Ohio State campuses. Also, the general and mandatory fees, including the recreation fee, student activity, student union facility fee, and COTA bus fee will again not change in fiscal 2017.
Graduate and Professional Fees
Masters and PhD instructional fees will not increase in fiscal 2017. Some graduate and professional students pay a higher or differential instructional fee based principally on market demand and market pricing. Revenue generated from these increases is earmarked to support the graduate and professional programs that generate the fee income. Most differential fees are not expected to increase, while some are budgeted to increase between 2% and 3% in fiscal 2017.
STUDENT ENROLLMENT FOR AUTUMN TERM
AUTUMN FY 2013 - FY 2017 Headcounts 1 YR 1 YR 5 YR
2013 2014 2015 2016 2017 Chg % Chg % Chg Columbus 56,387 57,466 58,322 58,663 58,827 164 0.3% 4.3% Lima 1,131 1,077 1,056 1,010 1,005 -5 -0.5% -11.1% Mansfield 1,265 1,204 1,188 1,199 1,205 6 0.5% -4.7% Marion 1,273 1,259 1,204 1,085 1,009 -76 -7.0% -20.7% Newark 2,390 2,315 2,396 2,476 2,476 0 0.0% 3.6% ATI 612 643 702 751 770 19 2.5% 25.8% Grand Total 63,058 63,964 64,868 65,184 65,292 108 0.2% 3.5%
FISCAL 2017
The Ohio State University | Financial Planning and Analysis 15
Non-Resident Surcharges
Effective Autumn term fiscal 2017, the non-resident surcharge will increase 5.0% for most undergraduate, graduate, and most professional programs at each campus. Exceptions include the College of Optometry, which is lowering their surcharge by $4,000 in response to competition; the College of Law, which will see no increase; Dentistry and Veterinary Medicine which will only increase 2%; and four graduate business programs, an online FAES program and an online Engineering Program that charge a flat non-resident surcharge.
Program, Technology, and Other Fees
Several colleges and academic programs have established additional fees to support specific programs and initiatives. These include program fees designed to provide financial support for specific programs, technology fees, international student fees, course fees and distance education fees. There are no new fees in fiscal 2017.
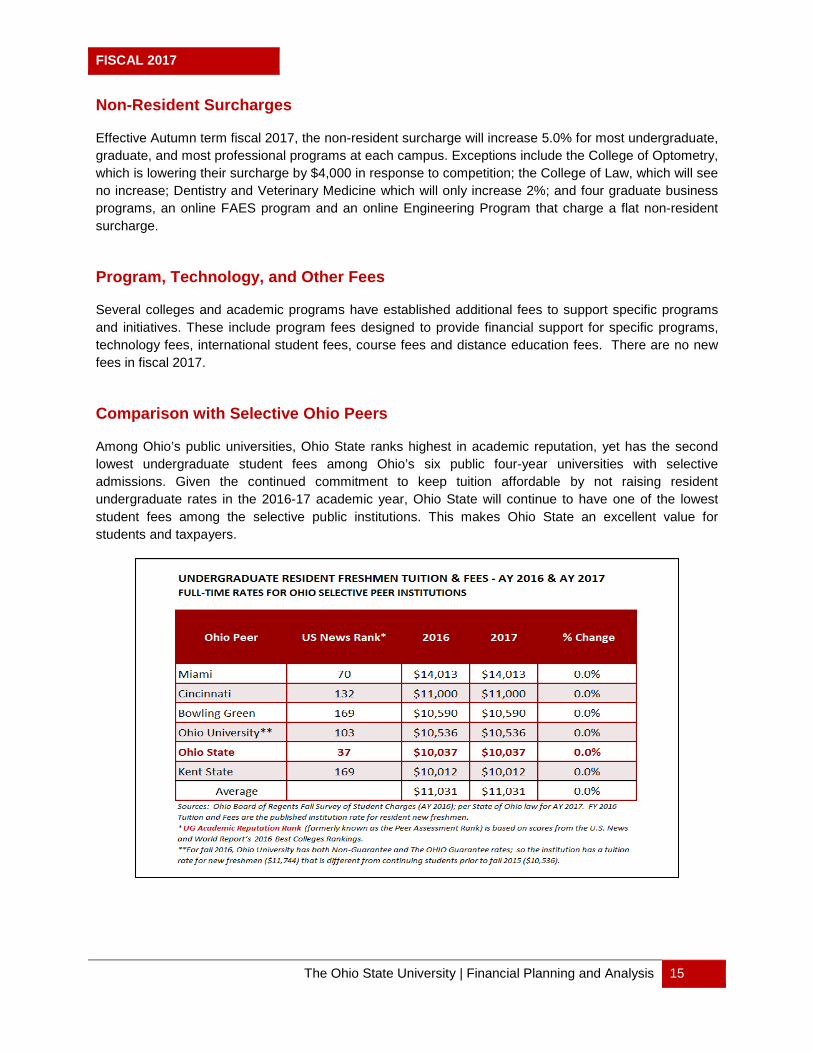
Comparison with Selective Ohio Peers
Among Ohio’s public universities, Ohio State ranks highest in academic reputation, yet has the second lowest undergraduate student fees among Ohio’s six public four-year universities with selective admissions. Given the continued commitment to keep tuition affordable by not raising resident undergraduate rates in the 2016-17 academic year, Ohio State will continue to have one of the lowest student fees among the selective public institutions. This makes Ohio State an excellent value for students and taxpayers.

FISCAL 2017
The Ohio State University | Financial Planning and Analysis 16
Comparison with Benchmarks and Top Public Schools
In comparing Ohio State with our peer institutions on tuition and fees (latest data available is fiscal 2014), tuition and fee revenues per student FTE were 6.4% below the average of OSU’s benchmark institutions and 18.0% below the top 10 ranked public institutions’ average.
State Support
The state economy has recovered from the Great Recession. Unemployment, once at 10.6% during the height of the recession (February 2010), was at 5.1% in March 2016. Through March 2016 state finances appear to be strong and the state is currently projecting an unencumbered fund balance of $470 million at year’s end. There appear to be no threats on the horizon that would threaten the state’s increased funding to higher education though conditions can change.
State Share of Instruction (SSI)
The SSI allocation is the State of Ohio’s primary funding support for enrollments and degree completions at its colleges and universities. The SSI funds campuses on the basis of several criteria including successful course completions, indexed by financially and academically at-risk resident undergraduate students, degree completions with added funding for degree completions by undergraduate at-risk students, and a number of other criteria intended to advance the goals of the state.
The state budget increases SSI funding by 4.0% from $1.90 billion in fiscal 2016 to $1.98 billion in fiscal 2017, but for the second consecutive year holds instruction and general fees to 2015 levels. In total the university projects to receive $377 million in SSI funding in fiscal 2017 an increase of $15.1 million over fiscal 2016.
Fiscal 2017 will mark the third year of the implementation of the recommendations of the committee chaired by former President Gee. In the fall of 2012, Gov. Kasich asked former President Gee to chair a committee comprised of the presidents from Miami University, Ohio University, Wright State University, and Shawnee State University to recommend changes to the State Share of Instruction (SSI) formula to better align it with the goals of the state. The committee was tasked with finding ways to use the formula to support the following objectives:
Increase participation rates Encourage the best and brightest to attend Improve graduation rates Make higher education more affordable Graduate students with the skills they need Encourage graduates to stay in Ohio
The committee recommendations were endorsed by the presidents of all public colleges and universities in the state, as well as Gov. Kasich, and have been incorporated into each subsequent budget bill.
In its first two years the formula:
shifted to rewarding degree recipients
FISCAL 2017
The Ohio State University | Financial Planning and Analysis 17
adopted a universal 3-year average as the basis of calculation for distribution of the allocations adopted STEM weights to degree completions removed the re-allocation of funds from campuses to those whose allocations had dropped below
a certain threshold combined the regional campus allocations with the main campuses, awarded proportional degree credits for transfer students awarded associate degree credits for all campuses implemented proportional degree credits for out of state graduates that remain the in the state
In the current biennium the formula:
allows funding of more than one degree earned by a student caps the bonus awarded for degree recipients that started their careers outside the Inter-
University Council (IUC) institutions caps funding for students that were awarded an associate degree and then a baccalaureate
degree to the baccalaureate amount
The university is engaged in ongoing discussions about the impact of the funding changes on its campuses and is involved in discussion with the Inter-University Council of Ohio and the Ohio Department of Higher Education (formerly the Ohio Board of Regents) on ways that the funding formula can better meet the needs of the State.
FISCAL 2017
The Ohio State University | Financial Planning and Analysis 18
State Line Item Appropriations
In addition to SSI funding, the university also receives funding directed to specific purposes through state line item appropriations. In fiscal 2017, the university expects to receive $89.6 million in state line item appropriations, roughly the same as projected fiscal 2016. Major appropriations are received for the Ohio Agricultural Research and Development Center (OARDC) ($36 million), OSU Extension ($25 million), and OH-Tech ($15 million).
Capital Appropriations
Ohio State also receives capital allocations from the State of Ohio used to maintain and improve the physical infrastructure of the university. The state capital budget process occurs in the off years from the state operating budget process. The current capital bill has not been passed as of the drafting of this book, but the university expects a total allocation of $97.4M for the fiscal 2017-2018 biennium, including $2.7 million in pass-through community projects. We expect to expend approximately $45.8 million in state capital appropriations in fiscal 2017.
Of the $94.7 million, in university projects, $26.4 million will be allocated for the renovation of Koffolt/Fontana Laboratories to support the Advanced Materials Corridor; $26.0 million will be allocated for the renovation and partial replacement of Postle Hall for the College of Dentistry; and $5.0 million will be allocated to the Wooster campus for the replacement of Thorne Hall. The remainder of the funding ($37.3 million) will be allocated to various renovations and repairs at all Ohio State campuses.
Grants and Contracts
Grants and contracts revenue is administered in two ways: recorded by individual units in segregated grants and contracts funds, or as sponsored projects administered by the Office of Sponsored Programs. For fiscal 2017, revenue from grants and contracts (excluding non-exchange grants) is expected to be $654 million, which is $6 million above than fiscal 2016 projections.
Of the $654 million, $486 million is administered by the Office of Sponsored Programs and $168 million is administered directly by colleges and support units. Projects administered by the Office of Sponsored Programs typically have more stringent process and documentation requirements than projects that are directly administered through the colleges and support units.
Sponsored Research Programs
The university secures funding for sponsored research programs from a variety of external sources. External grants are awarded by federal, state and local agencies along with private foundations and corporate sponsors. Total direct revenue for sponsored research programs administered by the Office of Sponsored Programs is expected to increase slightly to approximately $486 million.
The sponsored research revenues include facilities and administrative (F&A) cost recoveries which are projected to be $108 million, which is slightly below fiscal 2016 levels. F&A costs are recovered from most sponsored programs to offset the cost of maintaining the physical and administrative infrastructure that supports the research enterprise at the university. It is important to note that direct and indirect cost

FISCAL 2017
The Ohio State University | Financial Planning and Analysis 19
expenditures do not necessarily align when comparing expected revenue streams, and this occurs for two reasons. First, certain direct cost expenditures do not recover F&A. Second, not all sponsors allow the university to recover F&A at the university’s fully negotiated rate.
Sponsored research funding comes from a variety of sources, each of which is impacted by economic and political considerations. For example, the federal government is by far the largest source of research support. In recent years, federal research budgets have been essentially flat, and the number of proposals submitted has been increasing, resulting in lower funding rates. The most recent federal budget included increases for many research funding agencies, but it will take time for those gains to flow to university research programs. Another challenge is that State funding is being directed toward private enterprises rather than to research development activities at universities.
The university is working to mitigate ongoing downward trends using two primary strategies. First, we are actively focusing on increasing the competitiveness of researchers through activities internal to the university. This effort includes facilitating multidisciplinary research to take advantage of the breadth of expertise at the university through the Discovery Themes initiative; establishing new centers focused on current and emerging research challenges; creating a proposal development center; and establishing and maintaining cutting edge core facilities to support our growing community of research-intensive faculty. The second strategy involves building external relationships that will help grow the university’s portfolio of federally-funded research, expand strategic partnerships with industry, and promote and develop the Ohio Technology Consortium (OH-Tech).
College/Support Unit Administered Grants and Contracts
Revenue for exchange grants and contracts administered directly by individual colleges and support units is expected to remain relatively flat from $165 million projected for fiscal 2016 to $168 million budgeted for fiscal 2017. This $168 million is included in the Grants & Contracts line of the budget as operating revenue.
Some grants and contracts revenue is considered a non-exchange item and appears in the non-operating section of the income statement as Non-Exchange Grants. These items include federal funding for interest on Build America bonds, federal funding for Pell and Supplemental Educational Opportunity Grants (SEOG), and state funding for Ohio College Opportunity Grants (OCOG). Funding levels for these items are expected to increase slightly in fiscal 2017 over projected fiscal 2016.
Sales and Service Revenues
Sales and Services of Educational Departments
Sales and services of educational departments are expected to remain relatively flat to projected fiscal 2016, remaining at $141 million. Revenue sources consist largely of clinical operations in colleges such as Dentistry, Optometry and Veterinary Medicine and non-college departments such as Recreational Sports and Student Health Services.

FISCAL 2017
The Ohio State University | Financial Planning and Analysis 20
Sales and Services of Auxiliary Enterprises
Student Life, Athletics, and Business Advancement comprise the majority of sales and services of auxiliary enterprises. Revenue from sales and services of auxiliary enterprises before scholarship allowances is expected to increase $21.8 million, or 7.8% in fiscal 2017 over projected fiscal 2016. This increase is driven primarily by increased Student Life housing and dining revenue due to the opening of all dorms and dining facilities in the North Residential District. This increase is partially offset by decreases in the Schottenstein Center due to fewer concerts planned for fiscal 2017.
Advancement
In September, the university will conclude the But for Ohio State campaign having exceeded the $2.5 billion goal and will likely close fiscal 2016 with record-breaking fundraising totals. The campaign invited alumni, friends, grateful patients, and the rest of Buckeye Nation to invest in our students, our faculty, our campuses, and our potential. Supporters helped us secure unmatched educational opportunities for future generations of students, and empowered our faculty and staff to tackle the critical challenges we face as a global society. Campaign proceeds will be used to fund scholarships to attract the most promising students, elevate faculty, create modern learning environments, promote multidisciplinary research, and drive high-impact innovation.
Advancement recognizes the critical importance of aligning communications, marketing and alumni/constituent engagement with our partners across the University. A number of efforts in these areas have been recognized internally and by our peers as among the best in higher education. Some examples include: the Alumni Association’s growing volunteer engagement program; centralized stewardship guidelines for personalized, meaningful donor recognition
initiatives; our Buckeye Room virtual community that captures insights from more than 10,000 alumni; and
marketing campaigns that connect people in new ways with Ohio State while strengthening the university’s brand and reputation. Advancement’s communications, marketing, engagement and fundraising teams are working together to plan for the next campaign with a clear focus on increasing access, affordability and excellence at Ohio State, the hallmarks of President Drake’s 2020 Vision.
In fiscal 2016, the university’s goal for “New Fundraising Activity” was $450 million, including pledges and certain private contracts. Those dollars are being raised by engaging a variety of constituents, including students, faculty, staff, alumni, friends, corporate partners and private foundations.
The Advancement-related line items within the fiscal year 2016 financials are representative of expected cash receipts for current use gifts, gifts provided as endowment additions, and private capital gifts.

FISCAL 2017
The Ohio State University | Financial Planning and Analysis 21
University Budget: Expense
Salaries and Benefits
Salaries
Salary expense is expected to increase by $49.1 million or 3.5% over fiscal 2016 projections. Faculty and staff salary guideline increases of up to 2.0% have been included in the budget for fiscal 2017.
Consistent with prior years, the approved salary guidelines take into consideration the financial condition of the university as well as statistics of the current labor market. The university continues to employ its philosophy of setting faculty salaries at a level that will maintain or advance Ohio State’s position nationally for the highest quality faculty, and to set staff salaries to be competitive with the local employment markets.
The fiscal 2017 budget for salaries also includes net new hires in several key areas, including hiring of faculty for discovery themes across multiple colleges and disciplines, additional clinical faculty in the College of Medicine, engineering faculty to improve the college’s student-faculty ratio, Public Health faculty to support new enrollments, additional advancement personnel, and staffing for newly opened dorms and dining facilities in the North Residential District.
Benefits
Benefit costs are expected to increase by $7.8 million or 2.1% over fiscal 2016 projections. Benefits increases are driven by the 2% salary guideline increase, which directly affects the retirement plan contribution expenses, and net new additional hires. This is balanced by a 4% decrease in the average composite rate for all benefits. Benefits include the university’s contribution to employee retirement plans, various medical, dental, vision, life and disability plans, employee and dependent tuition plans and university expense related to compulsory plans, such as workers’ compensation and unemployment compensation.
Retirement Plans - University employees are covered by one of three retirement systems. The university faculty is covered by the State Teachers Retirement System of Ohio (STRS Ohio). Substantially all other employees are covered by the Public Employees Retirement System of Ohio (OPERS). Employees may opt out of STRS Ohio and OPERS and participate in the Alternative Retirement Plan (ARP) if they meet certain eligibility requirements. Under each of the plans, the university contributes 14% of the employee’s pay to the plan annually, while the employees contribute 10%. Vesting varies by plan.
Medical Plan - The university is self-insured for employee health insurance. Fiscal 2017 medical plan costs are budgeted based on historical cost trend data, projected employee eligibility, and expected plan changes associated with governmental regulations and plan design. Given these factors, we are projecting a 5% decrease per FTE in costs for fiscal 2017 across all medical plans. The university will continue to monitor the impact the new health care laws will have on the university as an employer as legislation and regulations evolve.
FISCAL 2017
The Ohio State University | Financial Planning and Analysis 22
Student Financial Aid
Financial Aid is a critical investment of resources that keeps the cost of education manageable for students. The Ohio State University engages both the federal and state governments in conversations to stress the importance of financial aid and reasonable loan programs for students. Interactions with donors also stress the importance of gifts that support financial aid.
The financial aid plan seeks to advance two specific goals for the university: to invest in the quality, quantity and diversity of students in order to continue to move Ohio State towards its goal of being in the top 10 public universities in the country; and to invest in students to fulfill our role as the land grant university for the State of Ohio, whereby access to college is afforded to those students with limited resources. The university continues to work to support both goals and continues to develop the appropriate balance in moving the university towards eminence. Fundraising efforts are also underway through various initiatives including the Ohio Scholarship Challenge in which all 88 Ohio counties are raising funds to recruit students from each county to attend Ohio State.
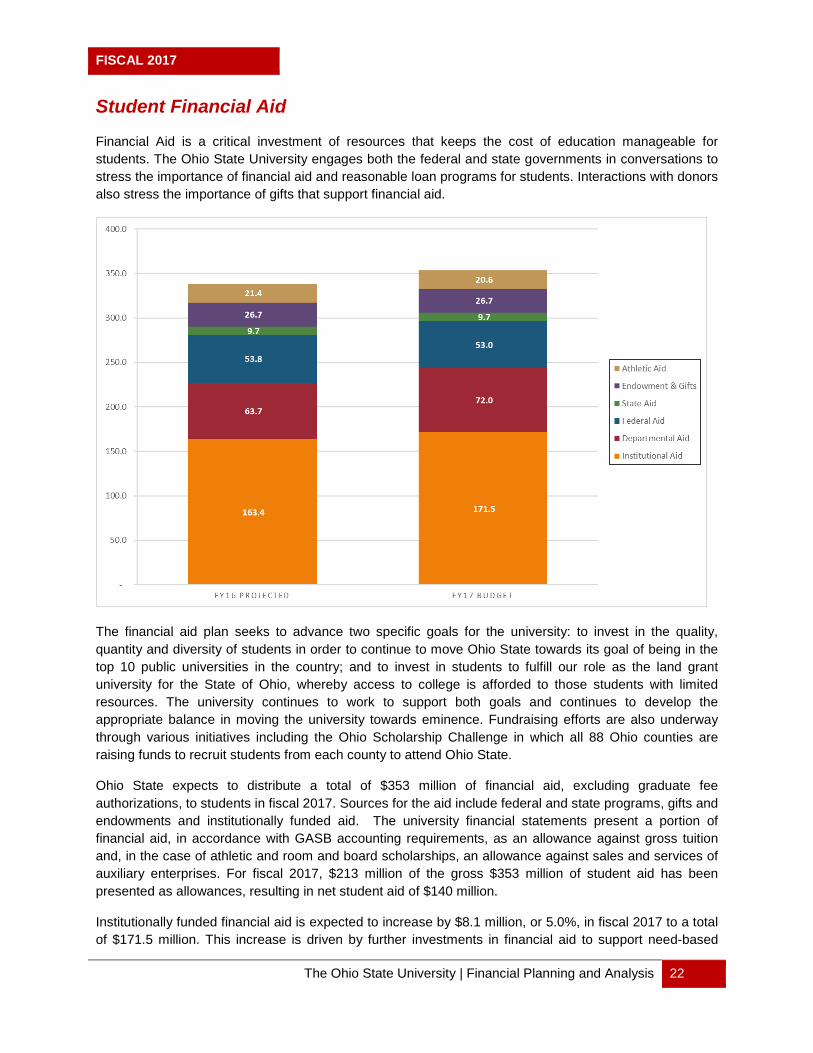
Ohio State expects to distribute a total of $353 million of financial aid, excluding graduate fee authorizations, to students in fiscal 2017. Sources for the aid include federal and state programs, gifts and endowments and institutionally funded aid. The university financial statements present a portion of financial aid, in accordance with GASB accounting requirements, as an allowance against gross tuition and, in the case of athletic and room and board scholarships, an allowance against sales and services of auxiliary enterprises. For fiscal 2017, $213 million of the gross $353 million of student aid has been presented as allowances, resulting in net student aid of $140 million.
Institutionally funded financial aid is expected to increase by $8.1 million, or 5.0%, in fiscal 2017 to a total of $171.5 million. This increase is driven by further investments in financial aid to support need-based

FISCAL 2017
The Ohio State University | Financial Planning and Analysis 23
financial aid, as the President has committed to significantly increasing financial aid for students with financial needs in order to help to mitigate ongoing increases in student debt. A total of $15 million was funded in fiscal 2016 and an additional $5 million will be added for a total of $20 million in new funding for students with financial needs in fiscal 2017 above fiscal 2015 levels. This will continue to be funded to meet a total investment of $100 million over five years.
Federal financial aid, which consists primarily of Pell Grants and some Supplemental Educational Opportunity Grant (SEOG), is expected to slightly decrease to $53 million in fiscal 2017. State financial aid is expected to remain flat in fiscal 2017 at $9.7 million and is driven by funding levels for programs such as the Ohio College Opportunity Grant (OCOG). Donor and other funds are also expected to remain flat to fiscal year 2015 actuals at $26.7 million.
Athletic scholarships are planned to decrease slightly to $20.6 million. The remaining aid provided directly by colleges for graduate fellowships and awards is projected to increase $7.8 million in fiscal 2017, driven by a $7.3 million increase in graduate fellowships.

FISCAL 2017
The Ohio State University | Financial Planning and Analysis 24
Fee Authorizations
Fee authorizations are an additional component of student aid directed toward graduate student appointments. Total university fee authorization expense is expected to increase slightly by 4.0% to $101.9 million in fiscal 2017. Fee authorization increases are driven by the College of Engineering (up $1.9 million) and the Graduate School (up $1.1 million).
Supplies, Services & Other Expenses
Supplies, Services and Other Expenses are projected to increase $40.6 million, or 5.8% versus fiscal 2016 driven primarily by increased OH-Tech expenses and costs associated with the Workday implementation. Supplies, Services and Other Expenses are comprised of several discrete categories, including Intra-University Revenue, Cost of Sales, Supplies, Office Services, Repairs & Maintenance, Non-Capitalized Equipment, Utilities, Travel, Other Expense and University Overhead which are discussed below.
Cost of Sales, Supplies, Office Services, Repairs & Maintenance, and Non-Capitalized Equipment
Cost of sales represents the purchase of goods and services that are passed directly through to external and internal customers. Cost of sales is budgeted to increase by $5.8 million, or 7.4% for fiscal 2017. This increase is driven primarily by a $6.6 million increase in cost of sales in Student Life related to the opening of all dorms and dining facilities in the North Residential District. This increase is partially offset by a $1.4 million decrease in cost of sales associated with activities at the Schottenstein Center. Supplies expense is expected to decrease by $1.1 million, or 1.0% in fiscal 2017. This is driven by a $3.4 million decrease in the College of Medicine associated with the closure of a pathology lab, which is offset by a $1.0 million increase in Student Life and other miscellaneous increases across the remainder of the university. Office services expense is expected to remain mostly flat to fiscal 2016, increasing by $81 thousand, or 0.3%. Repairs & maintenance expense is expected to remain flat to fiscal 2016, increasing by $67 thousand, or 0.1%. Non-capitalized equipment expense is to remain mostly flat to fiscal 2016, increasing by $181 thousand or 0.3%. Many units budget non-capitalized equipment as flat, and increases in Student Life non-capitalized equipment expenses (increase of $6.4 million budgeted in fiscal 2017) are offset by decreases in other units such as OH-Tech and Business Advancement.
Utilities
Utilities expense includes both commodities expense paid externally for electricity, natural gas, and water and sewer, and internal charges paid by units that are billed centrally based on

FISCAL 2017
The Ohio State University | Financial Planning and Analysis 25
consumption. The internal revenue associated with these expenses is booked as part of intra-university revenue, which is treated as a contra-expense. Utilities expense is expected to increase $1.4 million, or 1.5% over fiscal 2016. These increases are driven by unit-level expenses associated with the opening of all North Residential District facilities and additional utilities surcharges for the Biomedical Research Tower.
Travel
Travel expense is expected to decrease by $290 thousand, or 0.5% over fiscal 2016. However, this decrease is driven by Athletics’ practice of budgeting neither revenue nor expense for post-season tournaments or bowl games. Athletics’ travel expense was down $1.9 million, or 13.8% over fiscal 2016 due to this practice. This decrease was offset by other increases, including increases of $1.1 million in the colleges and $641 thousand in other support units.
Other Expense
Other Expense is increasing $31.3 million, or 6.7% over fiscal 2016. This increase is driven by several units. First, the university is expecting $17.5 million in expenses related to the implementation of Workday for the replacement of its financial system. Also, OH-Tech is increasing expenses related to increased eContent for OhioLINK, and increased HEI/Research Portal expenses. This results in a $7.6 million increase (15.2%) in other expense for OH-Tech over fiscal 2016. Engineering is expecting a $1.8 million increase in other expense due to increases in OSP awards, and Health Sciences is expecting a $1.3 million increase due to startup and other expenses related to new hires in the Comprehensive Cancer Center.
University Overhead
Overhead is charged to non-general funds units to help fund centrally-provided services. In fiscal 2017, $79.3 million is expected to be allocated via internal charges to fund centrally-provided services, a decrease of $0.4 million (0.5%) from fiscal 2016. Since overhead is an intra-university allocation, entries are eliminated against intra-university revenue in the financial statement consolidation process. Specific expense categories comprising the overhead rates include Facilities Support, Administrative Support, and Specialized Support (Health Administration and Student Services). Different overhead rates are calculated based on participation in the different expense categories. The base rate includes all expense categories; other rates are calculated to include only those expenses applicable to those units. For example, the regional campus rate includes only the insurance, academic administration, and central support expense categories. For fiscal 2017, the rates ranged from 2.4% for the Wexner Medical Center to 5.7% for most earnings operations.
Financial Services and Investments
The Office of Financial Services manages cash, short and intermediate term investments and other funds totaling over $2.0 billion. They also oversee a debt portfolio of $3.2 billion. In performing these functions,
FISCAL 2017
The Ohio State University | Financial Planning and Analysis 26
the office serves as internal bank to the University taking deposits, issuing debt, investing operating funds and approving loans. The internal bank is a framework for coordinating these activities and providing a consolidated view of the associated assets, liabilities, revenues and expenses.
The Office of Investments manages the Long Term Investment Pool (LTIP), which totals $3.6 billion and includes gifted endowment funds, designated funds and a significant portion of operating funds. Through a partnership with external managers, the Office of Investments has adopted an asset allocation model for the LTIP that groups assets into three broad categories. This model enables the investment team to build a portfolio of specialized investment teams around the world to implement our strategic allocation and to be responsive to changing market conditions.
Investment Income
Investment income on cash, short and intermediate term investments is budgeted at $14 million, in line with our fiscal 2016 forecast and reflecting continued low bank yields and fixed income markets more volatile than prior years.
The LTIP is budgeted to return $333 million before fees, at an 8.0% return, in fiscal 2017. This compares to a negative $26 million return projected for fiscal 2016.
Debt
The proceeds of past debt issuance have been utilized to fund major construction projects including the Wexner Medical Center expansion, student housing construction and refurbishments, as well as significant campus infrastructure improvements.
The debt is comprised of a mix of tax exempt and taxable bonds. Over 82 % of the outstanding debt balance is comprised of fixed rate obligations ranging between 1.56% and 4.85% all-in true interest cost. The remainder of the debt is tax-exempt variable rate debt obligations. The variable rates, most of which are subject to change every seven days, averaged 0.02% through the first ten months of fiscal 2016 and have a 15-year average of 1.2%. Under the terms of the variable rate agreements, the rates cannot exceed 8% or 12%, depending on the issue.
The University expects to incur approximately $125 million of interest expense on plant debt in fiscal 2017, an increase of $15 million over fiscal 2016 projected levels due to the issuance of $600 million in bonds in late fiscal 2016.

FISCAL 2017
The Ohio State University | Financial Planning and Analysis 27
Health System
OSU Wexner Medical Center Health System
The margin for the OSU Wexner Medical Center Health System (Health System) is budgeted at $204 million for fiscal 2017. Included in the budget is the Health System’s continued support to OSU Physicians and the College of Medicine (COM) ($150 million). The Health System operating budget is set at a level to provide the necessary margin to invest in clinical programs, capital, provide debt service coverage and build cash reserves. The operating budget for fiscal 2017 anticipates the volumes and financial impact of the opening of the Brain and Spine Hospital, Jameson Crane Sports Medicine Institute and the Upper Arlington Outpatient Care Center. The budget also takes into consideration the impact of healthcare reform, Medicaid rate rebasing, as well as changes related to reimbursement from the Hospital Care Assurance Program (HCAP), and the state’s Upper Payment Limit program (UPL). In addition, the
$ in thousandsFiscal 2016
Projected ActualFiscal 2017
Budget $ Change % ChangeOperating Revenues
Patient Revenue 7,950,391 8,233,002 282,610 3.6%Deductions from Patient Revenue (5,490,611) (5,661,406) (170,795) -3.1%Other Operating Revenue 87,794 99,956 12,162 13.9%
Total Operating Revenues 2,547,574 2,671,552 123,978 4.9%
Operating ExpensesSalaries 775,929 818,629 42,699 5.5%Benefits 269,903 285,000 15,097 5.6%Hospital Physician Fees 89,135 92,864 3,729 4.2%Physician/Faculty Services 16,973 18,071 1,097 6.5%Supplies 276,199 281,685 5,486 2.0%Cost of Drugs 224,208 251,363 27,155 12.1%Services 271,056 294,245 23,189 8.6%Resident Salaries and Benefits 51,520 55,229 3,709 7.2%Depreciation 138,787 133,605 (5,182) -3.7%Interest 41,865 40,465 (1,400) -3.3%University Overhead 48,900 48,902 2 0.0%
Total Operating Expenses 2,204,476 2,320,060 115,583 5.2%
Operating Gain (Loss) 343,098 351,492 8,394 2.4%
Medical Center Investments (140,000) (150,000) (10,000) -7.1%Income From Investments 2,296 2,929 633 27.6%Other Gains (Losses) 1,440 14 (1,426) -99.1%
Excess of Revenue over Expenses 206,833 204,435 (2,399) -1.2%
FISCAL 2017
The Ohio State University | Financial Planning and Analysis 28
model also incorporates payer mix changes resulting from an aging population. The budget provides a Total Operating Margin percentage of 7.65% and an EBIDA operating margin of 19.7%
Revenue Drivers
Overall revenue is budgeted to increase approximately 4.9% compared with the current year rate of 7.6%. Activity increases account for approximately 3.5% and rates account for 1.4% of fiscal 2017 growth. Inpatient admission growth is budgeted at 3% and driven primarily by continued James Cancer Hospital growth and the anticipated opening of the Brain and Spine Hospital in September. Outpatient activity will grow at 5.1% with ambulatory growth related to the Jameson Crane Sports Medicine Institute and Upper Arlington Outpatient Care Center.
Medicaid Expansion continues to be favorable for the Health System as patients previously covered under charity programs now have coverage. Medicaid continues to make additional rate cuts in order to fund this expansion. The Health System will see decreases in Medicaid rates related to rebasing efforts at the Ohio Department of Medicaid. The Health System will also see reductions in HCAP funding due to a lower number of uninsured patients due to expansion.
Medicare inpatient rates will see a decrease while outpatient rates will remain flat. Managed care plan migration to Medicare due to the aging population is anticipated at 1% in fiscal 2017. Managed care arrangements are negotiated through the end of 2017 and in some cases into 2018. Quality and risk-based contracts as well as tiered pricing are expected to be prevalent in ongoing negotiations with payers. The budget does not anticipate significant negative impacts to fiscal 2017 due to these factors. The payment increases for managed care contracts are on average 4-
5% in rate growth while governmental payers are anticipated to decrease due to multiple factors. There are currently no planned list price increases in this budget.
Expense Drivers
Expenses before interest and depreciation will grow by 6.0% compared to the current year growth of 6.1%. The fiscal 2017 budget includes $27 million in increased drug cost associated with drug inflation and new FDA approved drug utilization. Excluding drug costs, operating expenses will grow at approximately 4.5%, of which 2.5% will be activity driven and 2.0% rate driven. Salary increases for employees averaging 2% is included in the budget. Benefit rates are expected to remain consistent with current year. Labor productivity is budgeted to improve 0.5%. Expense management initiatives will continue to be an emphasis during fiscal 2017.

FISCAL 2017
The Ohio State University | Financial Planning and Analysis 29
OSU Physicians, Inc.
Total operating revenue is budgeted to increase $27 million or 6.7% over fiscal 2016 projections. Total operating revenue includes net patient revenue and other revenue. Net patient revenue is budgeted to increase $28 million or 8.4% over fiscal 2016 projection, while other revenue is budgeted to decrease $.9 million. The increase in net patient revenue is due to faculty recruitment, increased clinical productivity, improved payment rates, improved service mix, and new ambulatory locations opening.
Total expenses are expected to increase $39 million. Expense categories with the largest increases were services and physician salaries & benefits, staff salaries & benefits, and supplies. Net new physicians in fiscal 2017 are 84. Generally, the amount of time for a new practice to reach full profitability is approximately 2-3 years.
In 2017, a new ambulatory site in Upper Arlington will open. The site will contain several medical specialties including family medicine, internal medicine, women’s health and surgery. The location is expected to show a profit within two years from opening.
$ in thousands
Fiscal 2016 Projected
ActualFiscal 2017
Budget $ Change % ChangeOperating Revenues
Net Patient Revenue 328,898 356,483 27,585 8.4%Other Operating Revenue 71,996 71,099 (897) -1.2%
Total Operating Revenues 400,894 427,582 26,687 6.7%
Operating ExpensesStaff Salaries & Benefits 77,350 86,882 9,532 12.3%Supplies & Pharmaceuticals 33,357 37,581 4,224 12.7%Services 33,016 36,100 3,083 9.3%General Administrative Expenses 12,354 13,888 1,534 12.4%Other Expenses 10,036 11,000 963 9.6%Depreciation 4,399 4,246 (153) -3.5%
Total Operating Expenses 170,513 189,697 19,183 11.3%
Excess of Revenue over Expenses Before Provider Expenses 230,381 237,885 7,504 3.3%
Provider Expenses 252,729 272,797 20,068 7.9%
Excess of Revenue over Expenses After Provider Expenses (22,348) (34,912) (12,564) -56.2%
Net Non-Operating Revenue 947 817 (130) -13.8%Medical Center Investments 45,672 47,961 2,289 5.0%
Change in Net Assets 24,272 13,866 (10,406) -42.9%

FISCAL 2017
The Ohio State University | Financial Planning and Analysis 30
Work continues on increasing physician productivity through increased clinic time. In addition, expense control measures continue to evolve to help keep controllable costs, such as staff salaries, supplies, and services, in line with revenue changes.
FISCAL 2017
The Ohio State University | Financial Planning and Analysis 31
University Budget Process
For the fiscal 2017 Budget Plan, the university continues a budget process that encompasses all funds of the university. This approach affords a holistic view of all operations of the university in an easily understood format that will enable the university to highlight the evolution of funding sources. This will allow leadership to make informed strategic decisions in a timely manner.
This all funds total operating budget will provide the base framework for evaluating the activities of all academic and support units within the university, allowing proactive responses to changing economic issues as they arise.
Budget System
The university uses a budget system that is comprised of two components: a modified Responsibility Center Management (RCM) model and the strategic investment of central funds. This structure allows for decentralized decision making and control of financial resources at the colleges and support units. The modified RCM budget model assigns substantial control over resource decisions to individual colleges and support units. The underlying premise of the university’s decentralized budget model is entrusting academic and support unit leaders with significant control over financial resources, leading to more informed decision making and better results and outcomes for the university as a whole. Through this decentralized model, colleges in particular are incentivized to increase resources by teaching more credit hours and increasing research activity. Auxiliary and earnings units, which are not included in the RCM model, prepare their budgets based on their business plans and projected use of their products and services. Research budget are projected based on historical patterns and anticipated grants that may be received.
The OSU Health System and OSU Physicians, Inc. prepare their budgets based upon projected activity and associated costs. External factors, such as government regulations and reimbursements rates, as well as contractual agreements with health care payers also play an integral part in developing the health system’s budget.
Fund Accounting
The university’s budget is developed and managed according to the principles of fund accounting. We manage over 20,000 active expendable funds and over 5,300 endowment principal funds through a robust accounting system. Revenue is segregated into a variety of fund types, the use of which is governed by the restrictions of the specific fund. Some fund types are unrestricted, including general funds and some earnings funds. Others have restrictions derived from the source of the revenue, including grants and contracts received from government agencies, foundations, and other outside sponsors. Individual funds are set up to ensure strict adherence to the terms of the grant or contract that governs these funds.
Endowments are another type of restricted fund, where separate funds are set up to preserve the corpus or principal of the gifts. As those funds earn investment returns, annual income distributions are made out of the endowment fund and into a current fund for spending in accordance with the donors’ restrictions. The segregation of each gift allows the university to ensure the funds are spent appropriately and to enable reporting to donors on the activities that their funds support.
FISCAL 2017
The Ohio State University | Financial Planning and Analysis 32
Although emphasis was placed on including all university funds in the fiscal year 2016 budget process, general funds continue to remain a key component of the budget. General funds can generally be used for any university purpose whereas restricted funds are more specifically targeted. These funds play a major role in the budget, as they cover many expenses in the colleges and support units for which it is difficult to raise money. The main sources of general funds are tuition and other student fees, state support of instruction, indirect cost recovery, and overhead charged to earnings units.
Allocation of Funds
Each college and support unit receives a portion of general funds in support of both academic and administrative functions. The process for allocating the funds is administered through the Office of Financial Planning & Analysis under the guidance of the Chief Financial Officer and Provost. General funds are allocated to colleges and support units on a marginal basis under an established set of criteria. In other words, increases (or decreases) in the pool of general funds available each budget year are allocated back to colleges and support units as increases (or decreases) to their base general funds budgets.
Marginal changes in revenue are allocated to colleges based on three primary funding formulas. The first funding formula for colleges utilizes a model to distribute undergraduate marginal tuition and state support. Sixty percent of the funding is allocated based on total credit hours taught, while forty percent is allocated based on the cost of instruction. This budget allocation method takes into account the fact that some courses have a higher cost for delivery and are, thus, allocated a greater share of the funding. The other two primary funding formulas allocate graduate tuition and state support based on credit hours in fee-paying categories (tuition) and type of course taught based on cost of instruction (state support). As a college teaches more of the share of total credit hours, it receives a larger share of the incremental funding. Conversely, if a college’s share of the hours taught declines, the college’s allotted share of incremental funding will correspondingly decline. Colleges will receive their share of revenue on indirect research cost recovery, based upon the college’s share of research revenue. Fee revenue from learning technology, course and program fees are provided directly to colleges.
Support units are funded through a combination of central tax, specific activity-based assessments charged to colleges and an overhead rate charged to auxiliary and earnings units. The central tax, assessments and overhead charges are designed to provide the funds necessary to maintain support services such as payroll services, central human resource services, and student life services. Support units are generally ineligible for marginal revenue changes because the funding formulas rely on credit hours taught; instead, support units must request additional funding during the annual budget process to support new services or mandates.
Auxiliaries and earnings units are expected to operate at a break even or better margin and generally do not receive general fund support. One exception is the Office of Student Life which does receive general fund support via special Student Activity, Ohio Union and Recreational Facility fees that were enacted to specifically advance the student experience.
Regional campuses develop their own individual campus budgets primarily based on the student tuition and fees received from the regional campus students, the State Share of Instruction they expect to collect and costs directly incurred to operate those campuses.
Traditionally, university-wide initiatives and special requests by colleges and support units are funded through the formal budget process or through central reserves established to fund campus-wide projects

FISCAL 2017
The Ohio State University | Financial Planning and Analysis 33
that benefit the entire population or advance the mission of the university. For fiscal 2017, the formal support office budget request process was reinstated giving the support offices the ability to request funding for expansion of existing activities or new activities that meet the university’s mission.

FISCAL 2017
The Ohio State University | Financial Planning and Analysis 34
Board of Trustees
Alex Shumate, Chair (2020) Linda S. Kass, Vice Chair (2017) Michael J. Gasser, Vice Chair (2021) Janet B. Reid (2018) W. G. Jurgensen (2018) Jeffrey Wadsworth (2019) Clark Kellogg (2019) Timothy P. Smucker (2020) Cheryl L. Krueger (2021) Michael J. Gasser (2021) Brent R. Porteus (2022) Erin P. Hoeflinger (2022) Alex R. Fischer (2023) Abigail S. Wexner (2023) Vacant - To Be Named by Governor Vacant - To Be Named by Governor Corbett A. Price, Charter Trustee (2017) Alan VanderMolen, Charter Trustee (2017) James D. Klingbell, Charter Trustee (2018) Halle M. Vilagi (2017) Lydia Lancaster (2018)
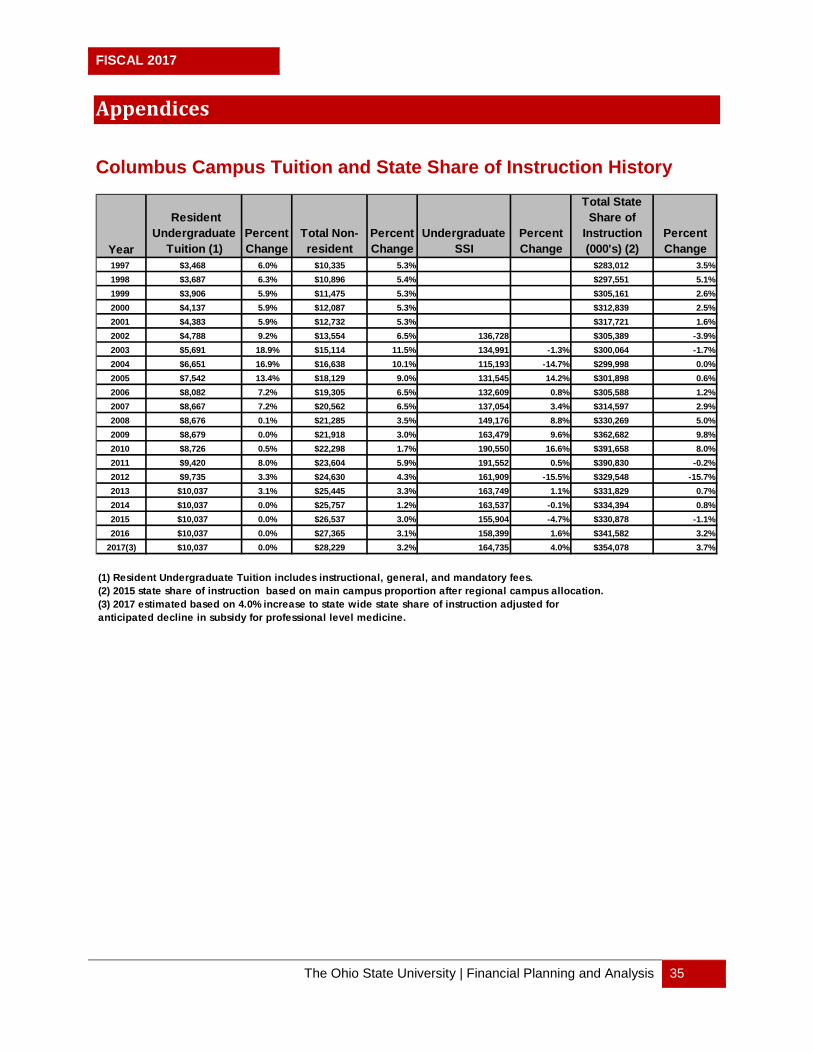
FISCAL 2017
The Ohio State University | Financial Planning and Analysis 35
Appendices
Columbus Campus Tuition and State Share of Instruction History
Year
Resident Undergraduate
Tuition (1)Percent Change
Total Non-resident
Percent Change
Undergraduate SSI
Percent Change
Total State Share of
Instruction (000's) (2)
Percent Change
1997 $3,468 6.0% $10,335 5.3% $283,012 3.5%1998 $3,687 6.3% $10,896 5.4% $297,551 5.1%1999 $3,906 5.9% $11,475 5.3% $305,161 2.6%2000 $4,137 5.9% $12,087 5.3% $312,839 2.5%2001 $4,383 5.9% $12,732 5.3% $317,721 1.6%2002 $4,788 9.2% $13,554 6.5% 136,728 $305,389 -3.9%2003 $5,691 18.9% $15,114 11.5% 134,991 -1.3% $300,064 -1.7%2004 $6,651 16.9% $16,638 10.1% 115,193 -14.7% $299,998 0.0%2005 $7,542 13.4% $18,129 9.0% 131,545 14.2% $301,898 0.6%2006 $8,082 7.2% $19,305 6.5% 132,609 0.8% $305,588 1.2%2007 $8,667 7.2% $20,562 6.5% 137,054 3.4% $314,597 2.9%2008 $8,676 0.1% $21,285 3.5% 149,176 8.8% $330,269 5.0%2009 $8,679 0.0% $21,918 3.0% 163,479 9.6% $362,682 9.8%2010 $8,726 0.5% $22,298 1.7% 190,550 16.6% $391,658 8.0%2011 $9,420 8.0% $23,604 5.9% 191,552 0.5% $390,830 -0.2%2012 $9,735 3.3% $24,630 4.3% 161,909 -15.5% $329,548 -15.7%2013 $10,037 3.1% $25,445 3.3% 163,749 1.1% $331,829 0.7%2014 $10,037 0.0% $25,757 1.2% 163,537 -0.1% $334,394 0.8%2015 $10,037 0.0% $26,537 3.0% 155,904 -4.7% $330,878 -1.1%2016 $10,037 0.0% $27,365 3.1% 158,399 1.6% $341,582 3.2%
2017(3) $10,037 0.0% $28,229 3.2% 164,735 4.0% $354,078 3.7%
(1) Resident Undergraduate Tuition includes instructional, general, and mandatory fees.(2) 2015 state share of instruction based on main campus proportion after regional campus allocation. (3) 2017 estimated based on 4.0% increase to state wide state share of instruction adjusted for anticipated decline in subsidy for professional level medicine.

FISCAL 2017
The Ohio State University | Financial Planning and Analysis 36
Undergraduate Tuition & Fees – AY 2017
Resident Non-ResCampus Resident* Non-Resident** % Chg % Chg
Columbus $10,036.80 $28,228.80 0.0% 3.2%Lima $7,140.00 $25,332.00 0.0% 3.5%Mansfield $7,140.00 $25,332.00 0.0% 3.5%Marion $7,140.00 $25,332.00 0.0% 3.5%Newark $7,140.00 $25,332.00 0.0% 3.5%ATI $7,104.00 $25,296.00 0.0% 3.5%*Resident=instructional + mandatory fees.**Non-Resident=instructional + non-resident surcharge (5% increase) + mandatory fees. Excludes International Surcharge of $498/term for students enrolled prior to August 2015 and $966/term for those students enrolled August 2015 and after.

FISCAL 2017
The Ohio State University | Financial Planning and Analysis 37
Student Fee Schedule (per semester)
Columbus Campus
Undergraduate (1)
Undergraduate – Distance Learning (1)(6)
Credit HoursInstructional
Fees BasicStudent Activity
Student Union Fee Rec Fee(2) COTA Fee(3)
Resident Total
Non-Resident Tuition
Non-Resident
Total
Students Enrolled prior to
August 2015
Students Enrolled
August 2015 and after
Students Enrolled prior to
August 2015
Students Enrolled
August 2015 and after
0.5 191.00 7.75 37.50 3.10 13.50 252.85 379.00 631.85 20.75 40.25 608.85 628.351.0 382.00 15.50 37.50 6.20 13.50 454.70 758.00 1,212.70 41.50 80.50 1,217.70 1,256.702.0 764.00 31.00 37.50 12.40 13.50 858.40 1,516.00 2,374.40 83.00 161.00 2,435.40 2,513.403.0 1,146.00 46.50 37.50 18.60 13.50 1,262.10 2,274.00 3,536.10 124.50 241.50 3,653.10 3,770.104.0 1,528.00 62.00 37.50 24.80 123.00 13.50 1,788.80 3,032.00 4,820.80 166.00 322.00 4,870.80 5,026.805.0 1,910.00 77.50 37.50 31.00 123.00 13.50 2,192.50 3,790.00 5,982.50 207.50 402.50 6,088.50 6,283.506.0 2,292.00 93.00 37.50 37.20 123.00 13.50 2,596.20 4,548.00 7,144.20 249.00 483.00 7,306.20 7,540.207.0 2,674.00 108.50 37.50 43.40 123.00 13.50 2,999.90 5,306.00 8,305.90 290.50 563.50 8,523.90 8,796.908.0 3,056.00 124.00 37.50 49.60 123.00 13.50 3,403.60 6,064.00 9,467.60 332.00 644.00 9,741.60 10,053.609.0 3,438.00 139.50 37.50 55.80 123.00 13.50 3,807.30 6,822.00 10,629.30 373.50 724.50 10,959.30 11,310.30
10.0 3,820.00 155.00 37.50 62.00 123.00 13.50 4,211.00 7,580.00 11,791.00 415.00 805.00 12,177.00 12,567.0011.0 4,202.00 170.50 37.50 68.20 123.00 13.50 4,614.70 8,338.00 12,952.70 456.50 885.50 13,394.70 13,823.70
12.0 to 18.0(5) 4,584.00 186.00 37.50 74.40 123.00 13.50 5,018.40 9,096.00 14,114.40 498.00 966.00 14,612.40 15,080.40
International Surcharge(4) International Total(4)
General Fees
Credit HoursInstructional
Fees
Basic General
Fee
Distance Education
FeeResident
Total
Non-Resident Tuition(2)
Non-Resident
Total0.5 191.00 7.75 100.00 298.75 5.00 303.751.0 382.00 15.50 100.00 497.50 5.00 502.502.0 764.00 31.00 100.00 895.00 5.00 900.003.0 1,146.00 46.50 100.00 1,292.50 5.00 1,297.504.0 1,528.00 62.00 100.00 1,690.00 5.00 1,695.005.0 1,910.00 77.50 100.00 2,087.50 5.00 2,092.506.0 2,292.00 93.00 100.00 2,485.00 5.00 2,490.007.0 2,674.00 108.50 100.00 2,882.50 5.00 2,887.508.0 3,056.00 124.00 100.00 3,280.00 5.00 3,285.009.0 3,438.00 139.50 100.00 3,677.50 5.00 3,682.50
10.0 3,820.00 155.00 100.00 4,075.00 5.00 4,080.0011.0 4,202.00 170.50 100.00 4,472.50 5.00 4,477.50
12.0 to 18.0(5) 4,584.00 186.00 100.00 4,870.00 5.00 4,875.00
(2) The Recreation Fee is a flat fee for four or more credit hours.
(6) For students taking all distance courses, all on-site fees are waived and the non-resident tuition is reduced to $5. Students pay full campus-based and non-resident fees if enrolled in a campus-based course.
(5) Students pay an additional half credit hour instructional, basic general, and non-resident fee for each half credit hour of enrollment over 18.
(1) See Detail of Selected Rates for clinic, technology, and program fees charged by certain programs.
(3) The COTA Fee goes to the Central Ohio Transit Authority for student bus passes.
(4) Implemented in Autumn 2012, the international surcharge fee was converted to a per credit hour fee beginning in Summer 2016. Starting in Autumn 2015, all new Columbus campus international undergraduate students will be assessed the higher fee per term.

FISCAL 2017
The Ohio State University | Financial Planning and Analysis 38
Columbus Campus
Technology Fees
Program Fees
CIS in MPSCommuni-
cations EngPhys Medicine Music PPMCredit Hours UG Grad UG Grad UG UG UG Grad UG (AGR)1 Grad UG UG2 Grad2 Grad UG UG Grad Grad
0.5 6.75 13.50 7.75 21.75 4.50 2.05 3.75 15.75 10.00 21.25 4.50 2.05 4.10 5.50 6.75 8.30 16.65 15.001.0 13.50 27.00 15.50 43.50 9.00 4.10 7.50 31.50 20.00 42.50 9.00 4.10 8.20 11.00 13.50 16.60 33.30 30.002.0 27.00 54.00 31.00 87.00 18.00 8.20 15.00 63.00 40.00 85.00 18.00 8.20 16.40 22.00 27.00 33.20 66.60 60.003.0 40.50 81.00 46.50 130.50 27.00 12.30 22.50 94.50 60.00 127.50 27.00 12.30 24.60 33.00 40.50 49.80 99.90 90.004.0 54.00 108.00 62.00 174.00 36.00 16.40 30.00 126.00 80.00 170.00 36.00 16.40 32.80 44.00 54.00 66.40 133.20 120.005.0 67.50 135.00 77.50 217.50 45.00 20.50 37.50 157.50 100.00 212.50 45.00 20.50 41.00 55.00 67.50 83.00 166.50 150.006.0 81.00 162.00 93.00 261.00 54.00 24.60 45.00 189.00 120.00 255.00 54.00 24.60 49.20 66.00 81.00 99.60 199.80 180.007.0 94.50 162.00 108.50 261.00 63.00 28.70 52.50 189.00 140.00 255.00 63.00 28.70 49.20 66.00 94.50 116.20 199.80 180.008.0 108.00 162.00 124.00 261.00 72.00 32.80 60.00 189.00 160.00 255.00 72.00 32.80 49.20 66.00 108.00 132.80 199.80 180.009.0 121.50 139.50 81.00 36.90 67.50 180.00 81.00 36.90 121.50 149.40 6.00
10.0 135.00 155.00 90.00 41.00 75.00 200.00 90.00 41.00 135.00 166.0011.0 148.50 170.50 99.00 45.10 82.50 220.00 99.00 45.10 148.50 182.6012.0 162.00 186.00 108.00 49.20 90.00 240.00 108.00 49.20 162.00 199.20
1Beginning in FY 2015, specific Agriculture majors and plans only2With the exception of students in the Equine program, ATI students in FAES also pay this fee.
EHE NursingArts Business FAESEngineering
SHRS3 Anim Sci Art Business Eng4 EngPhys SENR FAES Music Nursing Nursing Nursing PsychCredit Hours UG UG UG UG UG UG UG UG UG UG Grad - Exist5 Grad - New6 UG
0.5 8.30 3.25 4.75 27.05 24.55 14.55 2.05 2.05 14.50 26.00 62.50 78.10 4.351.0 16.60 6.50 9.50 54.10 49.10 29.10 4.10 4.10 29.00 52.00 125.00 156.20 8.702.0 33.20 13.00 19.00 108.20 98.20 58.20 8.20 8.20 58.00 104.00 250.00 312.40 17.403.0 49.80 19.50 28.50 162.30 147.30 87.30 12.30 12.30 87.00 156.00 375.00 468.60 26.104.0 66.40 26.00 38.00 216.40 196.40 116.40 16.40 16.40 116.00 208.00 500.00 624.80 34.805.0 83.00 32.50 47.50 270.50 245.50 145.50 20.50 20.50 145.00 260.00 625.00 781.00 43.506.0 99.60 39.00 57.00 324.60 294.60 174.60 24.60 24.60 174.00 312.00 750.00 937.20 52.207.0 116.20 45.50 66.50 378.70 343.70 203.70 28.70 28.70 203.00 364.00 875.00 1,093.40 60.908.0 132.80 52.00 76.00 432.80 392.80 232.80 32.80 32.80 232.00 416.00 1,000.00 1,249.60 69.609.0 149.40 58.50 85.50 486.90 441.90 261.90 36.90 36.90 261.00 468.00 78.30
10.0 166.00 65.00 95.00 541.00 491.00 291.00 41.00 41.00 290.00 520.00 87.0011.0 182.60 71.50 104.50 595.10 540.10 320.10 45.10 45.10 319.00 572.00 95.7012.0 199.20 78.00 114.00 649.20 589.20 349.20 49.20 49.20 348.00 624.00 104.40
*Non-whole dollar amounts were adjusted slightly to meet SIS rounding rules3Name change from Allied Medical to School of Health and Rehabilitation Services4All Engineering except Engineering Physics5Nursing students enrolled prior to Fall 2013.6Nursing students enrolled in Fall 2013 and subsequent terms.
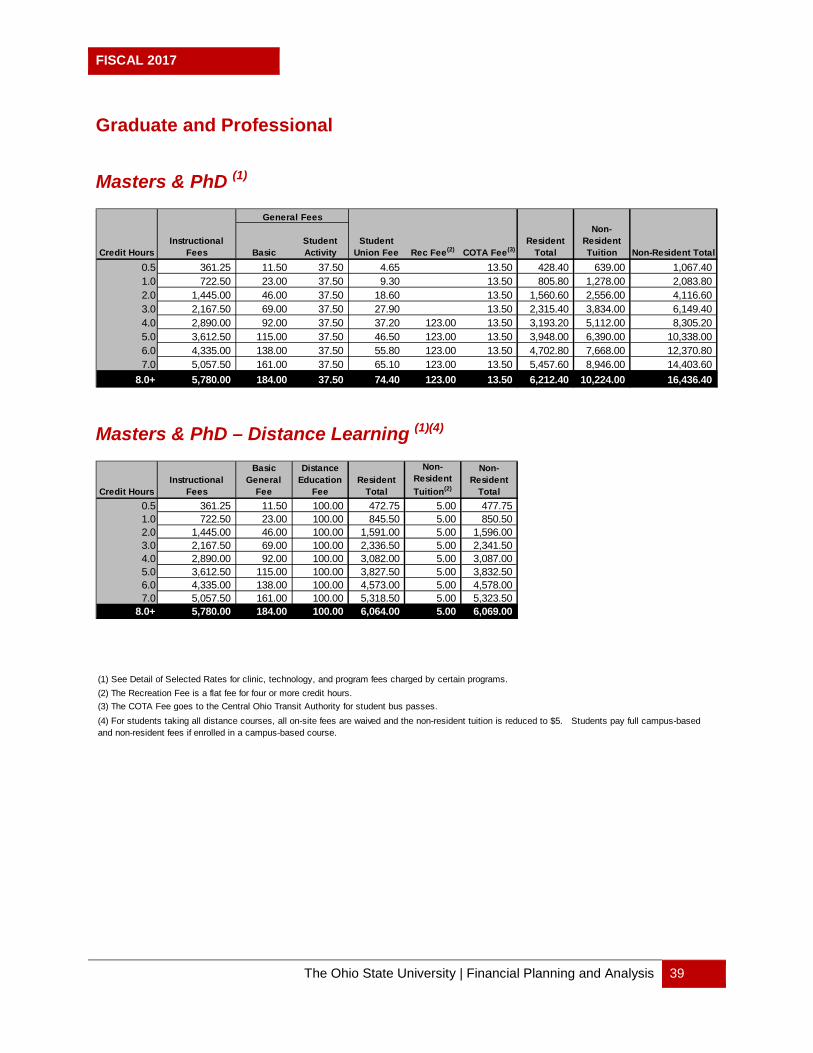
FISCAL 2017
The Ohio State University | Financial Planning and Analysis 39
Graduate and Professional
Masters & PhD (1)
Masters & PhD – Distance Learning (1)(4)
Credit HoursInstructional
Fees BasicStudent Activity
Student Union Fee Rec Fee(2) COTA Fee(3)
Resident Total
Non-Resident Tuition Non-Resident Total
0.5 361.25 11.50 37.50 4.65 13.50 428.40 639.00 1,067.401.0 722.50 23.00 37.50 9.30 13.50 805.80 1,278.00 2,083.802.0 1,445.00 46.00 37.50 18.60 13.50 1,560.60 2,556.00 4,116.603.0 2,167.50 69.00 37.50 27.90 13.50 2,315.40 3,834.00 6,149.404.0 2,890.00 92.00 37.50 37.20 123.00 13.50 3,193.20 5,112.00 8,305.205.0 3,612.50 115.00 37.50 46.50 123.00 13.50 3,948.00 6,390.00 10,338.006.0 4,335.00 138.00 37.50 55.80 123.00 13.50 4,702.80 7,668.00 12,370.807.0 5,057.50 161.00 37.50 65.10 123.00 13.50 5,457.60 8,946.00 14,403.60
8.0+ 5,780.00 184.00 37.50 74.40 123.00 13.50 6,212.40 10,224.00 16,436.40
General Fees
Credit HoursInstructional
Fees
Basic General
Fee
Distance Education
FeeResident
Total
Non-Resident Tuition(2)
Non-Resident
Total0.5 361.25 11.50 100.00 472.75 5.00 477.751.0 722.50 23.00 100.00 845.50 5.00 850.502.0 1,445.00 46.00 100.00 1,591.00 5.00 1,596.003.0 2,167.50 69.00 100.00 2,336.50 5.00 2,341.504.0 2,890.00 92.00 100.00 3,082.00 5.00 3,087.005.0 3,612.50 115.00 100.00 3,827.50 5.00 3,832.506.0 4,335.00 138.00 100.00 4,573.00 5.00 4,578.007.0 5,057.50 161.00 100.00 5,318.50 5.00 5,323.50
8.0+ 5,780.00 184.00 100.00 6,064.00 5.00 6,069.00
(1) See Detail of Selected Rates for clinic, technology, and program fees charged by certain programs.(2) The Recreation Fee is a flat fee for four or more credit hours.(3) The COTA Fee goes to the Central Ohio Transit Authority for student bus passes.(4) For students taking all distance courses, all on-site fees are waived and the non-resident tuition is reduced to $5. Students pay full campus-based and non-resident fees if enrolled in a campus-based course.

FISCAL 2017
The Ohio State University | Financial Planning and Analysis 40
Master of Accounting (1)
MBA (1)
Credit HoursInstructional
Fees BasicStudent Activity
Student Union Fee Rec Fee(2) COTA Fee(3)
Resident Total
Non-Resident Tuition Non-Resident Total
0.5 983.00 11.50 37.50 4.65 13.50 1,050.15 639.00 1,689.151.0 1,966.00 23.00 37.50 9.30 13.50 2,049.30 1,278.00 3,327.302.0 3,932.00 46.00 37.50 18.60 13.50 4,047.60 2,556.00 6,603.603.0 5,898.00 69.00 37.50 27.90 13.50 6,045.90 3,834.00 9,879.904.0 7,864.00 92.00 37.50 37.20 123.00 13.50 8,167.20 5,112.00 13,279.205.0 9,830.00 115.00 37.50 46.50 123.00 13.50 10,165.50 6,390.00 16,555.506.0 11,796.00 138.00 37.50 55.80 123.00 13.50 12,163.80 7,668.00 19,831.807.0 13,762.00 161.00 37.50 65.10 123.00 13.50 14,162.10 8,946.00 23,108.10
8.0+ 15,728.00 184.00 37.50 74.40 123.00 13.50 16,160.40 10,224.00 26,384.40
General Fees
Credit HoursInstructional
Fees BasicStudent Activity
Student Union Fee Rec Fee(2) COTA Fee(3)
Resident Total
Non-Resident Tuition Non-Resident Total
0.5 929.75 11.50 37.50 4.65 13.50 996.90 639.00 1,635.901.0 1,859.50 23.00 37.50 9.30 13.50 1,942.80 1,278.00 3,220.802.0 3,719.00 46.00 37.50 18.60 13.50 3,834.60 2,556.00 6,390.603.0 5,578.50 69.00 37.50 27.90 13.50 5,726.40 3,834.00 9,560.404.0 7,438.00 92.00 37.50 37.20 123.00 13.50 7,741.20 5,112.00 12,853.205.0 9,297.50 115.00 37.50 46.50 123.00 13.50 9,633.00 6,390.00 16,023.006.0 11,157.00 138.00 37.50 55.80 123.00 13.50 11,524.80 7,668.00 19,192.807.0 13,016.50 161.00 37.50 65.10 123.00 13.50 13,416.60 8,946.00 22,362.60
8.0+ 14,876.00 184.00 37.50 74.40 123.00 13.50 15,308.40 10,224.00 25,532.40
General Fees
(1) Students in this program also pay a $261 Learning Technology Fee prorated by credit hour.(2) The Recreation Fee is a flat fee for four or more credit hours.(3) The COTA Fee goes to the Central Ohio Transit Authority for student bus passes.
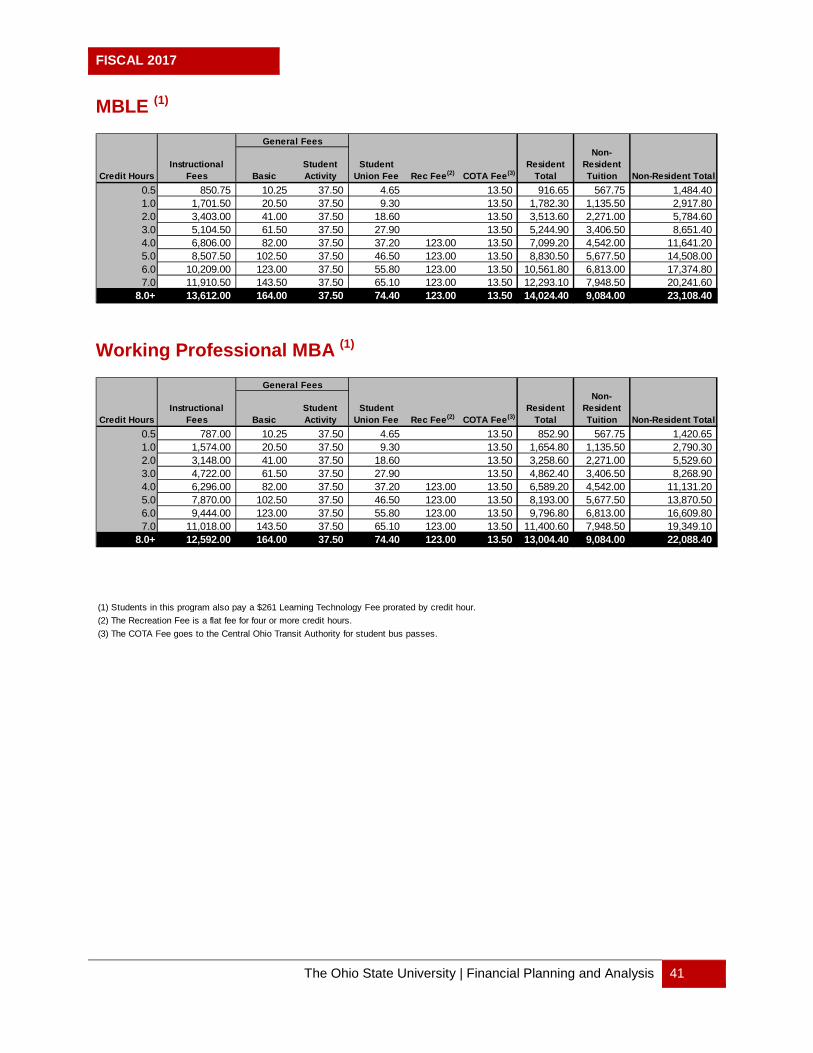
FISCAL 2017
The Ohio State University | Financial Planning and Analysis 41
MBLE (1)
Working Professional MBA (1)
Credit HoursInstructional
Fees BasicStudent Activity
Student Union Fee Rec Fee(2) COTA Fee(3)
Resident Total
Non-Resident Tuition Non-Resident Total
0.5 850.75 10.25 37.50 4.65 13.50 916.65 567.75 1,484.401.0 1,701.50 20.50 37.50 9.30 13.50 1,782.30 1,135.50 2,917.802.0 3,403.00 41.00 37.50 18.60 13.50 3,513.60 2,271.00 5,784.603.0 5,104.50 61.50 37.50 27.90 13.50 5,244.90 3,406.50 8,651.404.0 6,806.00 82.00 37.50 37.20 123.00 13.50 7,099.20 4,542.00 11,641.205.0 8,507.50 102.50 37.50 46.50 123.00 13.50 8,830.50 5,677.50 14,508.006.0 10,209.00 123.00 37.50 55.80 123.00 13.50 10,561.80 6,813.00 17,374.807.0 11,910.50 143.50 37.50 65.10 123.00 13.50 12,293.10 7,948.50 20,241.60
8.0+ 13,612.00 164.00 37.50 74.40 123.00 13.50 14,024.40 9,084.00 23,108.40
General Fees
Credit HoursInstructional
Fees BasicStudent Activity
Student Union Fee Rec Fee(2) COTA Fee(3)
Resident Total
Non-Resident Tuition Non-Resident Total
0.5 787.00 10.25 37.50 4.65 13.50 852.90 567.75 1,420.651.0 1,574.00 20.50 37.50 9.30 13.50 1,654.80 1,135.50 2,790.302.0 3,148.00 41.00 37.50 18.60 13.50 3,258.60 2,271.00 5,529.603.0 4,722.00 61.50 37.50 27.90 13.50 4,862.40 3,406.50 8,268.904.0 6,296.00 82.00 37.50 37.20 123.00 13.50 6,589.20 4,542.00 11,131.205.0 7,870.00 102.50 37.50 46.50 123.00 13.50 8,193.00 5,677.50 13,870.506.0 9,444.00 123.00 37.50 55.80 123.00 13.50 9,796.80 6,813.00 16,609.807.0 11,018.00 143.50 37.50 65.10 123.00 13.50 11,400.60 7,948.50 19,349.10
8.0+ 12,592.00 164.00 37.50 74.40 123.00 13.50 13,004.40 9,084.00 22,088.40
(1) Students in this program also pay a $261 Learning Technology Fee prorated by credit hour.(2) The Recreation Fee is a flat fee for four or more credit hours.(3) The COTA Fee goes to the Central Ohio Transit Authority for student bus passes.
General Fees

FISCAL 2017
The Ohio State University | Financial Planning and Analysis 42
MHRM (1)
EMBA (1)
Credit HoursInstructional
Fees BasicStudent Activity
Student Union Fee Rec Fee(2) COTA Fee(3)
Resident Total
Non-Resident Tuition Non-Resident Total
0.5 496.25 11.50 37.50 4.65 13.50 563.40 587.50 1,150.901.0 992.50 23.00 37.50 9.30 13.50 1,075.80 1,175.00 2,250.802.0 1,985.00 46.00 37.50 18.60 13.50 2,100.60 2,350.00 4,450.603.0 2,977.50 69.00 37.50 27.90 13.50 3,125.40 3,525.00 6,650.404.0 3,970.00 92.00 37.50 37.20 123.00 13.50 4,273.20 4,700.00 8,973.205.0 4,962.50 115.00 37.50 46.50 123.00 13.50 5,298.00 5,875.00 11,173.006.0 5,955.00 138.00 37.50 55.80 123.00 13.50 6,322.80 7,050.00 13,372.807.0 6,947.50 161.00 37.50 65.10 123.00 13.50 7,347.60 8,225.00 15,572.60
8.0+ 7,940.00 184.00 37.50 74.40 123.00 13.50 8,372.40 9,400.00 17,772.40
General Fees
Credit HoursInstructional
Fees BasicStudent Activity
Student Union Fee Rec Fee(2) COTA Fee(3)
Resident Total
Non-Resident Tuition Non-Resident Total
0.5 2,018.75 10.25 37.50 4.65 13.50 2,084.65 5.00 2,089.651.0 4,037.50 20.50 37.50 9.30 13.50 4,118.30 5.00 4,123.302.0 8,075.00 41.00 37.50 18.60 13.50 8,185.60 5.00 8,190.603.0 12,112.50 61.50 37.50 27.90 13.50 12,252.90 5.00 12,257.904.0 16,150.00 82.00 37.50 37.20 123.00 13.50 16,443.20 5.00 16,448.205.0 20,187.50 102.50 37.50 46.50 123.00 13.50 20,510.50 5.00 20,515.506.0 24,225.00 123.00 37.50 55.80 123.00 13.50 24,577.80 5.00 24,582.807.0 28,262.50 143.50 37.50 65.10 123.00 13.50 28,645.10 5.00 28,650.10
8.0+ 32,300.00 164.00 37.50 74.40 123.00 13.50 32,712.40 5.00 32,717.40
(1) Students in this program also pay a $261 Learning Technology Fee prorated by credit hour. Figures for EMBA are based on program-based fees. (2) The Recreation Fee is a flat fee for four or more credit hours.(3) The COTA Fee goes to the Central Ohio Transit Authority for student bus passes.
General Fees

FISCAL 2017
The Ohio State University | Financial Planning and Analysis 43
MBOE (1)
Specialized Master in Business – Finance (1)
Credit HoursInstructional
Fees BasicStudent Activity
Student Union Fee Rec Fee(2) COTA Fee(3)
Resident Total
Non-Resident Tuition Non-Resident Total
0.5 1,072.44 10.25 37.50 4.65 13.50 1,138.34 5.00 1,143.341.0 2,144.88 20.50 37.50 9.30 13.50 2,225.68 5.00 2,230.682.0 4,289.75 41.00 37.50 18.60 13.50 4,400.35 5.00 4,405.353.0 6,434.63 61.50 37.50 27.90 13.50 6,575.03 5.00 6,580.034.0 8,579.50 82.00 37.50 37.20 123.00 13.50 8,872.70 5.00 8,877.705.0 10,724.38 102.50 37.50 46.50 123.00 13.50 11,047.38 5.00 11,052.386.0 12,869.25 123.00 37.50 55.80 123.00 13.50 13,222.05 5.00 13,227.057.0 15,014.13 143.50 37.50 65.10 123.00 13.50 15,396.73 5.00 15,401.73
8.0+ 17,159.00 164.00 37.50 74.40 123.00 13.50 17,571.40 5.00 17,576.40
General Fees
Credit HoursInstructional
Fees BasicStudent Activity
Student Union Fee Rec Fee(2) COTA Fee(3)
Resident Total
Non-Resident Tuition Non-Resident Total
0.5 1,727.00 11.50 37.50 4.65 13.50 1,794.15 5.00 1,799.151.0 3,454.00 23.00 37.50 9.30 13.50 3,537.30 5.00 3,542.302.0 6,908.00 46.00 37.50 18.60 13.50 7,023.60 5.00 7,028.603.0 10,362.00 69.00 37.50 27.90 13.50 10,509.90 5.00 10,514.904.0 13,816.00 92.00 37.50 37.20 123.00 13.50 14,119.20 5.00 14,124.205.0 17,270.00 115.00 37.50 46.50 123.00 13.50 17,605.50 5.00 17,610.506.0 20,724.00 138.00 37.50 55.80 123.00 13.50 21,091.80 5.00 21,096.807.0 24,178.00 161.00 37.50 65.10 123.00 13.50 24,578.10 5.00 24,583.10
8.0+ 27,632.00 184.00 37.50 74.40 123.00 13.50 28,064.40 5.00 28,069.40
(2) The Recreation Fee is a flat fee for four or more credit hours.
General Fees
(1) Students in this program also pay a $261 Learning Technology Fee prorated by credit hour. Figures are based on program-based fees.
(3) The COTA Fee goes to the Central Ohio Transit Authority for student bus passes.
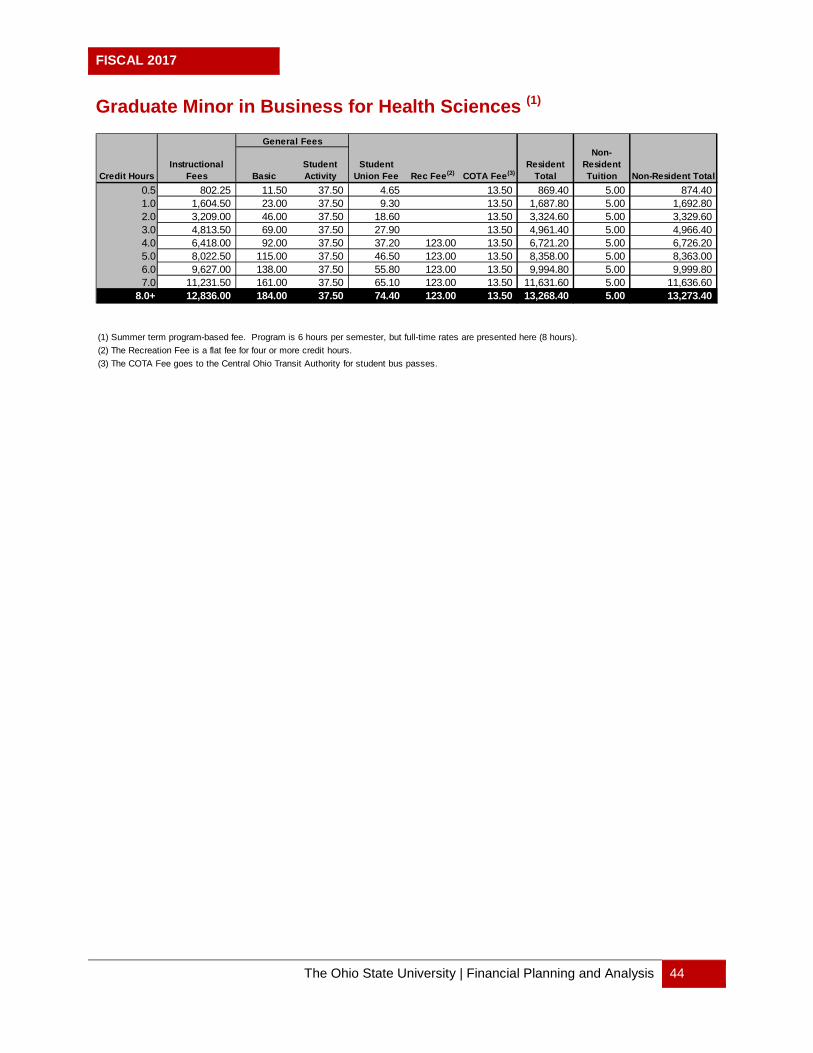
FISCAL 2017
The Ohio State University | Financial Planning and Analysis 44
Graduate Minor in Business for Health Sciences (1)
Credit HoursInstructional
Fees BasicStudent Activity
Student Union Fee Rec Fee(2) COTA Fee(3)
Resident Total
Non-Resident Tuition Non-Resident Total
0.5 802.25 11.50 37.50 4.65 13.50 869.40 5.00 874.401.0 1,604.50 23.00 37.50 9.30 13.50 1,687.80 5.00 1,692.802.0 3,209.00 46.00 37.50 18.60 13.50 3,324.60 5.00 3,329.603.0 4,813.50 69.00 37.50 27.90 13.50 4,961.40 5.00 4,966.404.0 6,418.00 92.00 37.50 37.20 123.00 13.50 6,721.20 5.00 6,726.205.0 8,022.50 115.00 37.50 46.50 123.00 13.50 8,358.00 5.00 8,363.006.0 9,627.00 138.00 37.50 55.80 123.00 13.50 9,994.80 5.00 9,999.807.0 11,231.50 161.00 37.50 65.10 123.00 13.50 11,631.60 5.00 11,636.60
8.0+ 12,836.00 184.00 37.50 74.40 123.00 13.50 13,268.40 5.00 13,273.40
(1) Summer term program-based fee. Program is 6 hours per semester, but full-time rates are presented here (8 hours).(2) The Recreation Fee is a flat fee for four or more credit hours.(3) The COTA Fee goes to the Central Ohio Transit Authority for student bus passes.
General Fees

FISCAL 2017
The Ohio State University | Financial Planning and Analysis 45
Dentistry – Rank 1 (1)
Dentistry – Ranks 2, 3, 4 (1)
Credit HoursInstructional
Fees BasicStudent Activity
Student Union Fee Rec Fee(2) COTA Fee(3)
Resident Total
Non-Resident Tuition Non-Resident Total
0.5 1,034.25 11.50 37.50 4.65 13.50 1,101.40 1,225.00 2,326.401.0 2,068.50 23.00 37.50 9.30 13.50 2,151.80 2,450.00 4,601.802.0 4,137.00 46.00 37.50 18.60 13.50 4,252.60 4,900.00 9,152.603.0 6,205.50 69.00 37.50 27.90 13.50 6,353.40 7,350.00 13,703.404.0 8,274.00 92.00 37.50 37.20 123.00 13.50 8,577.20 9,800.00 18,377.205.0 10,342.50 115.00 37.50 46.50 123.00 13.50 10,678.00 12,250.00 22,928.006.0 12,411.00 138.00 37.50 55.80 123.00 13.50 12,778.80 14,700.00 27,478.807.0 14,479.50 161.00 37.50 65.10 123.00 13.50 14,879.60 17,150.00 32,029.60
8.0+ 16,548.00 184.00 37.50 74.40 123.00 13.50 16,980.40 19,600.00 36,580.40
General Fees
Credit HoursInstructional
Fees BasicStudent Activity
Student Union Fee Rec Fee(2) COTA Fee(3)
Resident Total
Non-Resident Tuition Non-Resident Total
0.5 917.25 10.25 37.50 4.65 13.50 983.15 1,086.25 2,069.401.0 1,834.50 20.50 37.50 9.30 13.50 1,915.30 2,172.50 4,087.802.0 3,669.00 41.00 37.50 18.60 13.50 3,779.60 4,345.00 8,124.603.0 5,503.50 61.50 37.50 27.90 13.50 5,643.90 6,517.50 12,161.404.0 7,338.00 82.00 37.50 37.20 123.00 13.50 7,631.20 8,690.00 16,321.205.0 9,172.50 102.50 37.50 46.50 123.00 13.50 9,495.50 10,862.50 20,358.006.0 11,007.00 123.00 37.50 55.80 123.00 13.50 11,359.80 13,035.00 24,394.807.0 12,841.50 143.50 37.50 65.10 123.00 13.50 13,224.10 15,207.50 28,431.60
8.0+ 14,676.00 164.00 37.50 74.40 123.00 13.50 15,088.40 17,380.00 32,468.40
General Fees
(1) Dentistry students in Rank 1 also pay a flat $1,476/semester equipment fee; Ranks 2,3, and 4 pay $1,309/semester.(2) The Recreation Fee is a flat fee for four or more credit hours.(3) The COTA Fee goes to the Central Ohio Transit Authority for student bus passes.

FISCAL 2017
The Ohio State University | Financial Planning and Analysis 46
Law
Credit HoursInstructional
Fees BasicStudent Activity
Student Union Fee Rec Fee(1) COTA Fee(2)
Resident Total
Non-Resident Tuition Non-Resident Total
0.5 900.75 11.50 37.50 4.65 13.50 967.90 467.25 1,435.151.0 1,801.50 23.00 37.50 9.30 13.50 1,884.80 934.50 2,819.302.0 3,603.00 46.00 37.50 18.60 13.50 3,718.60 1,869.00 5,587.603.0 5,404.50 69.00 37.50 27.90 13.50 5,552.40 2,803.50 8,355.904.0 7,206.00 92.00 37.50 37.20 123.00 13.50 7,509.20 3,738.00 11,247.205.0 9,007.50 115.00 37.50 46.50 123.00 13.50 9,343.00 4,672.50 14,015.506.0 10,809.00 138.00 37.50 55.80 123.00 13.50 11,176.80 5,607.00 16,783.807.0 12,610.50 161.00 37.50 65.10 123.00 13.50 13,010.60 6,541.50 19,552.10
8.0+ 14,412.00 184.00 37.50 74.40 123.00 13.50 14,844.40 7,476.00 22,320.40
General Fees
(1) The Recreation Fee is a flat fee for four or more credit hours.(2) The COTA Fee goes to the Central Ohio Transit Authority for student bus passes.

FISCAL 2017
The Ohio State University | Financial Planning and Analysis 47
Medicine (1)
Credit HoursInstructional
Fees BasicStudent Activity
Student Union Fee Rec Fee(2) COTA Fee(3)
Resident Total
Non-Resident Tuition Non-Resident Total
0.5 916.25 10.25 37.50 4.65 13.50 982.15 644.25 1,626.401.0 1,832.50 20.50 37.50 9.30 13.50 1,913.30 1,288.50 3,201.802.0 3,665.00 41.00 37.50 18.60 13.50 3,775.60 2,577.00 6,352.603.0 5,497.50 61.50 37.50 27.90 13.50 5,637.90 3,865.50 9,503.404.0 7,330.00 82.00 37.50 37.20 123.00 13.50 7,623.20 5,154.00 12,777.205.0 9,162.50 102.50 37.50 46.50 123.00 13.50 9,485.50 6,442.50 15,928.006.0 10,995.00 123.00 37.50 55.80 123.00 13.50 11,347.80 7,731.00 19,078.807.0 12,827.50 143.50 37.50 65.10 123.00 13.50 13,210.10 9,019.50 22,229.60
8.0+ 14,660.00 164.00 37.50 74.40 123.00 13.50 15,072.40 10,308.00 25,380.40
(2) The Recreation Fee is a flat fee for four or more credit hours.(3) The COTA Fee goes to the Central Ohio Transit Authority for student bus passes.
General Fees
(1) Medicine students also pay a $66 Learning Technology Fee prorated by credit hour.

FISCAL 2017
The Ohio State University | Financial Planning and Analysis 48
Master in Genetic Counseling
Master of Occupational Therapy
Credit HoursInstructional
Fees BasicStudent Activity
Student Union Fee Rec Fee(1) COTA Fee(2)
Resident Total
Non-Resident Tuition Non-Resident Total
0.5 598.00 11.50 37.50 4.65 13.50 665.15 689.00 1,354.151.0 1,196.00 23.00 37.50 9.30 13.50 1,279.30 1,378.00 2,657.302.0 2,392.00 46.00 37.50 18.60 13.50 2,507.60 2,756.00 5,263.603.0 3,588.00 69.00 37.50 27.90 13.50 3,735.90 4,134.00 7,869.904.0 4,784.00 92.00 37.50 37.20 123.00 13.50 5,087.20 5,512.00 10,599.205.0 5,980.00 115.00 37.50 46.50 123.00 13.50 6,315.50 6,890.00 13,205.506.0 7,176.00 138.00 37.50 55.80 123.00 13.50 7,543.80 8,268.00 15,811.807.0 8,372.00 161.00 37.50 65.10 123.00 13.50 8,772.10 9,646.00 18,418.10
8.0+ 9,568.00 184.00 37.50 74.40 123.00 13.50 10,000.40 11,024.00 21,024.40
General Fees
Credit HoursInstructional
Fees BasicStudent Activity
Student Union Fee Rec Fee(1) COTA Fee(2)
Resident Total
Non-Resident Tuition Non-Resident Total
0.5 351.50 10.25 37.50 4.65 13.50 417.40 567.75 985.151.0 703.00 20.50 37.50 9.30 13.50 783.80 1,135.50 1,919.302.0 1,406.00 41.00 37.50 18.60 13.50 1,516.60 2,271.00 3,787.603.0 2,109.00 61.50 37.50 27.90 13.50 2,249.40 3,406.50 5,655.904.0 2,812.00 82.00 37.50 37.20 123.00 13.50 3,105.20 4,542.00 7,647.205.0 3,515.00 102.50 37.50 46.50 123.00 13.50 3,838.00 5,677.50 9,515.506.0 4,218.00 123.00 37.50 55.80 123.00 13.50 4,570.80 6,813.00 11,383.807.0 4,921.00 143.50 37.50 65.10 123.00 13.50 5,303.60 7,948.50 13,252.10
8.0+ 5,624.00 164.00 37.50 74.40 123.00 13.50 6,036.40 9,084.00 15,120.40
(1) The Recreation Fee is a flat fee for four or more credit hours.(2) The COTA Fee goes to the Central Ohio Transit Authority for student bus passes.
General Fees

FISCAL 2017
The Ohio State University | Financial Planning and Analysis 49
Master/Doctor of Physical Therapy
Master of Health Administration
Credit HoursInstructional
Fees BasicStudent Activity
Student Union Fee Rec Fee(1) COTA Fee(2)
Resident Total
Non-Resident Tuition Non-Resident Total
0.5 391.75 10.25 37.50 4.65 13.50 457.65 567.75 1,025.401.0 783.50 20.50 37.50 9.30 13.50 864.30 1,135.50 1,999.802.0 1,567.00 41.00 37.50 18.60 13.50 1,677.60 2,271.00 3,948.603.0 2,350.50 61.50 37.50 27.90 13.50 2,490.90 3,406.50 5,897.404.0 3,134.00 82.00 37.50 37.20 123.00 13.50 3,427.20 4,542.00 7,969.205.0 3,917.50 102.50 37.50 46.50 123.00 13.50 4,240.50 5,677.50 9,918.006.0 4,701.00 123.00 37.50 55.80 123.00 13.50 5,053.80 6,813.00 11,866.807.0 5,484.50 143.50 37.50 65.10 123.00 13.50 5,867.10 7,948.50 13,815.60
8.0+ 6,268.00 164.00 37.50 74.40 123.00 13.50 6,680.40 9,084.00 15,764.40
General Fees
Credit HoursInstructional
Fees BasicStudent Activity
Student Union Fee Rec Fee(1) COTA Fee(2)
Resident Total
Non-Resident Tuition Non-Resident Total
0.5 436.50 11.50 37.50 4.65 13.50 503.65 639.00 1,142.651.0 873.00 23.00 37.50 9.30 13.50 956.30 1,278.00 2,234.302.0 1,746.00 46.00 37.50 18.60 13.50 1,861.60 2,556.00 4,417.603.0 2,619.00 69.00 37.50 27.90 13.50 2,766.90 3,834.00 6,600.904.0 3,492.00 92.00 37.50 37.20 123.00 13.50 3,795.20 5,112.00 8,907.205.0 4,365.00 115.00 37.50 46.50 123.00 13.50 4,700.50 6,390.00 11,090.506.0 5,238.00 138.00 37.50 55.80 123.00 13.50 5,605.80 7,668.00 13,273.807.0 6,111.00 161.00 37.50 65.10 123.00 13.50 6,511.10 8,946.00 15,457.10
8.0+ 6,984.00 184.00 37.50 74.40 123.00 13.50 7,416.40 10,224.00 17,640.40
General Fees
(1) The Recreation Fee is a flat fee for four or more credit hours.(2) The COTA Fee goes to the Central Ohio Transit Authority for student bus passes.

FISCAL 2017
The Ohio State University | Financial Planning and Analysis 50
Master of Public Health
Public Health PEP
Credit HoursInstructional
Fees BasicStudent Activity
Student Union Fee Rec Fee(1) COTA Fee(2)
Resident Total
Non-Resident Tuition Non-Resident Total
0.5 387.25 11.50 37.50 4.65 13.50 454.40 639.00 1,093.401.0 774.50 23.00 37.50 9.30 13.50 857.80 1,278.00 2,135.802.0 1,549.00 46.00 37.50 18.60 13.50 1,664.60 2,556.00 4,220.603.0 2,323.50 69.00 37.50 27.90 13.50 2,471.40 3,834.00 6,305.404.0 3,098.00 92.00 37.50 37.20 123.00 13.50 3,401.20 5,112.00 8,513.205.0 3,872.50 115.00 37.50 46.50 123.00 13.50 4,208.00 6,390.00 10,598.006.0 4,647.00 138.00 37.50 55.80 123.00 13.50 5,014.80 7,668.00 12,682.807.0 5,421.50 161.00 37.50 65.10 123.00 13.50 5,821.60 8,946.00 14,767.60
8.0+ 6,196.00 184.00 37.50 74.40 123.00 13.50 6,628.40 10,224.00 16,852.40
General Fees
(1) The Recreation Fee is a flat fee for four or more credit hours.(2) The COTA Fee goes to the Central Ohio Transit Authority for student bus passes.

FISCAL 2017
The Ohio State University | Financial Planning and Analysis 51
Pharmacy
Credit HoursInstructional
Fees BasicStudent Activity
Student Union Fee Rec Fee(1) COTA Fee(2)
Resident Total
Non-Resident Tuition Non-Resident Total
0.5 650.00 11.50 37.50 4.65 13.50 717.15 672.75 1,389.901.0 1,300.00 23.00 37.50 9.30 13.50 1,383.30 1,345.50 2,728.802.0 2,600.00 46.00 37.50 18.60 13.50 2,715.60 2,691.00 5,406.603.0 3,900.00 69.00 37.50 27.90 13.50 4,047.90 4,036.50 8,084.404.0 5,200.00 92.00 37.50 37.20 123.00 13.50 5,503.20 5,382.00 10,885.205.0 6,500.00 115.00 37.50 46.50 123.00 13.50 6,835.50 6,727.50 13,563.006.0 7,800.00 138.00 37.50 55.80 123.00 13.50 8,167.80 8,073.00 16,240.807.0 9,100.00 161.00 37.50 65.10 123.00 13.50 9,500.10 9,418.50 18,918.60
8.0+ 10,400.00 184.00 37.50 74.40 123.00 13.50 10,832.40 10,764.00 21,596.40
General Fees
(1) The Recreation Fee is a flat fee for four or more credit hours.(2) The COTA Fee goes to the Central Ohio Transit Authority for student bus passes.
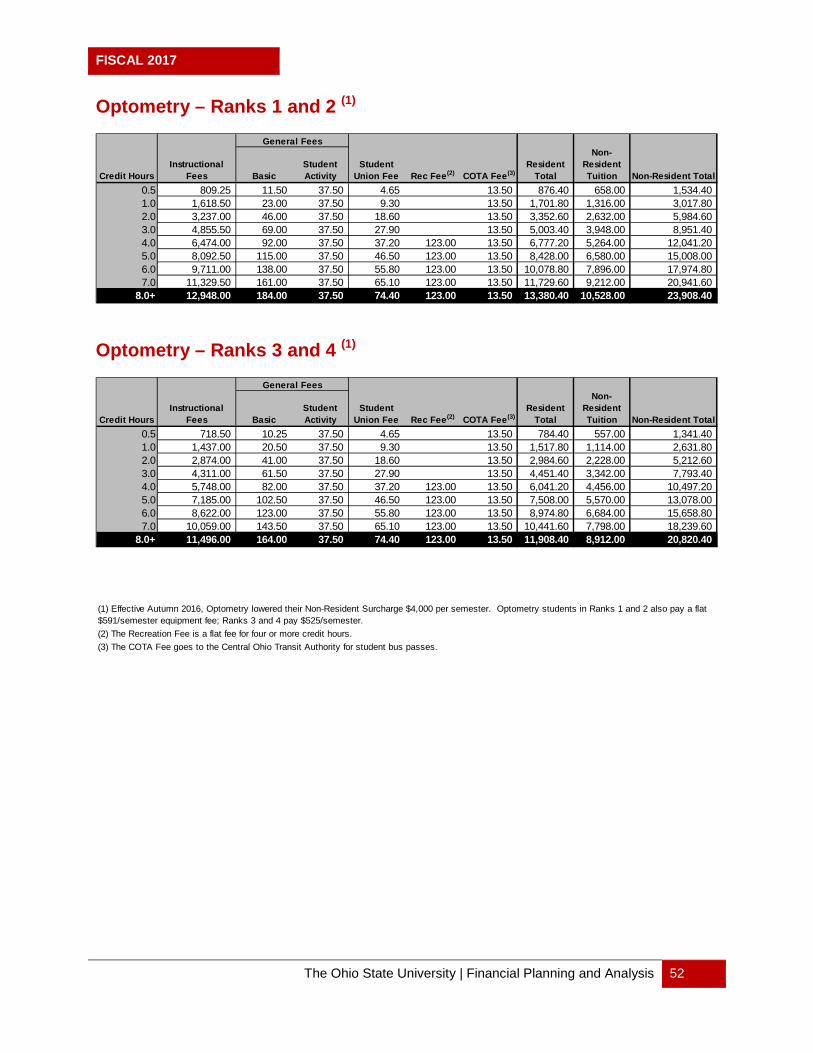
FISCAL 2017
The Ohio State University | Financial Planning and Analysis 52
Optometry – Ranks 1 and 2 (1)
Optometry – Ranks 3 and 4 (1)
Credit HoursInstructional
Fees BasicStudent Activity
Student Union Fee Rec Fee(2) COTA Fee(3)
Resident Total
Non-Resident Tuition Non-Resident Total
0.5 809.25 11.50 37.50 4.65 13.50 876.40 658.00 1,534.401.0 1,618.50 23.00 37.50 9.30 13.50 1,701.80 1,316.00 3,017.802.0 3,237.00 46.00 37.50 18.60 13.50 3,352.60 2,632.00 5,984.603.0 4,855.50 69.00 37.50 27.90 13.50 5,003.40 3,948.00 8,951.404.0 6,474.00 92.00 37.50 37.20 123.00 13.50 6,777.20 5,264.00 12,041.205.0 8,092.50 115.00 37.50 46.50 123.00 13.50 8,428.00 6,580.00 15,008.006.0 9,711.00 138.00 37.50 55.80 123.00 13.50 10,078.80 7,896.00 17,974.807.0 11,329.50 161.00 37.50 65.10 123.00 13.50 11,729.60 9,212.00 20,941.60
8.0+ 12,948.00 184.00 37.50 74.40 123.00 13.50 13,380.40 10,528.00 23,908.40
General Fees
Credit HoursInstructional
Fees BasicStudent Activity
Student Union Fee Rec Fee(2) COTA Fee(3)
Resident Total
Non-Resident Tuition Non-Resident Total
0.5 718.50 10.25 37.50 4.65 13.50 784.40 557.00 1,341.401.0 1,437.00 20.50 37.50 9.30 13.50 1,517.80 1,114.00 2,631.802.0 2,874.00 41.00 37.50 18.60 13.50 2,984.60 2,228.00 5,212.603.0 4,311.00 61.50 37.50 27.90 13.50 4,451.40 3,342.00 7,793.404.0 5,748.00 82.00 37.50 37.20 123.00 13.50 6,041.20 4,456.00 10,497.205.0 7,185.00 102.50 37.50 46.50 123.00 13.50 7,508.00 5,570.00 13,078.006.0 8,622.00 123.00 37.50 55.80 123.00 13.50 8,974.80 6,684.00 15,658.807.0 10,059.00 143.50 37.50 65.10 123.00 13.50 10,441.60 7,798.00 18,239.60
8.0+ 11,496.00 164.00 37.50 74.40 123.00 13.50 11,908.40 8,912.00 20,820.40
(2) The Recreation Fee is a flat fee for four or more credit hours.(3) The COTA Fee goes to the Central Ohio Transit Authority for student bus passes.
(1) Effective Autumn 2016, Optometry lowered their Non-Resident Surcharge $4,000 per semester. Optometry students in Ranks 1 and 2 also pay a flat $591/semester equipment fee; Ranks 3 and 4 pay $525/semester.
General Fees
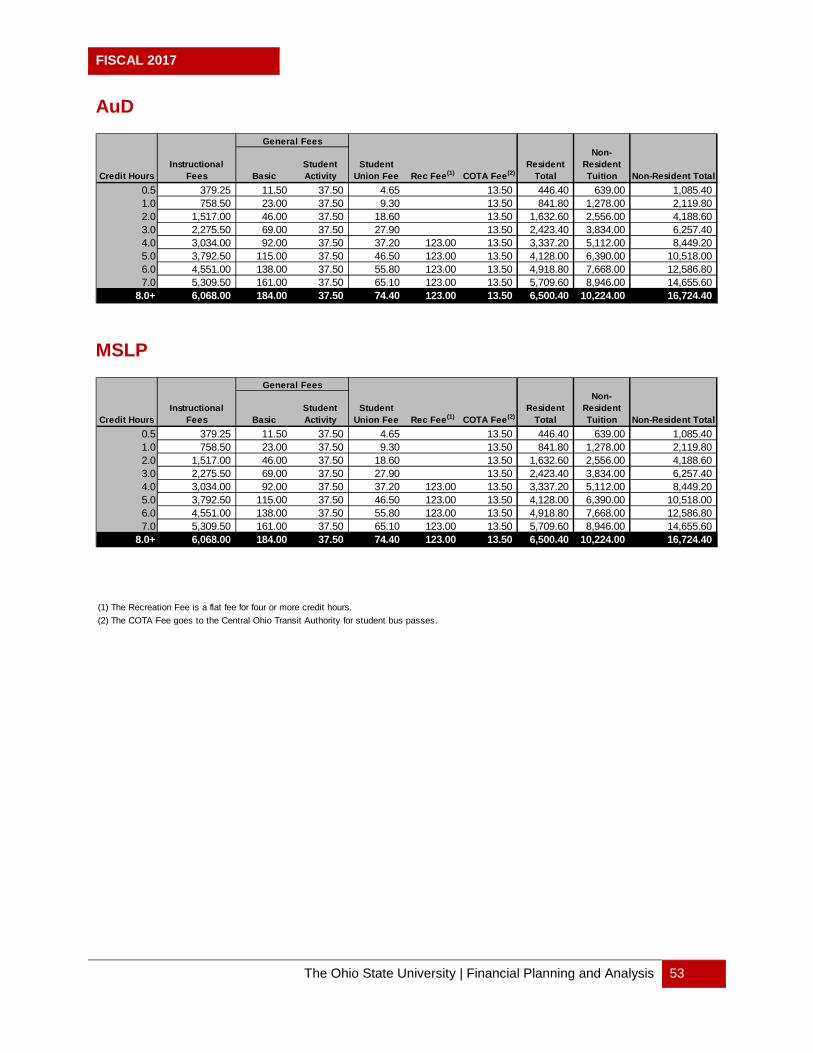
FISCAL 2017
The Ohio State University | Financial Planning and Analysis 53
AuD
MSLP
Credit HoursInstructional
Fees BasicStudent Activity
Student Union Fee Rec Fee(1) COTA Fee(2)
Resident Total
Non-Resident Tuition Non-Resident Total
0.5 379.25 11.50 37.50 4.65 13.50 446.40 639.00 1,085.401.0 758.50 23.00 37.50 9.30 13.50 841.80 1,278.00 2,119.802.0 1,517.00 46.00 37.50 18.60 13.50 1,632.60 2,556.00 4,188.603.0 2,275.50 69.00 37.50 27.90 13.50 2,423.40 3,834.00 6,257.404.0 3,034.00 92.00 37.50 37.20 123.00 13.50 3,337.20 5,112.00 8,449.205.0 3,792.50 115.00 37.50 46.50 123.00 13.50 4,128.00 6,390.00 10,518.006.0 4,551.00 138.00 37.50 55.80 123.00 13.50 4,918.80 7,668.00 12,586.807.0 5,309.50 161.00 37.50 65.10 123.00 13.50 5,709.60 8,946.00 14,655.60
8.0+ 6,068.00 184.00 37.50 74.40 123.00 13.50 6,500.40 10,224.00 16,724.40
General Fees
(1) The Recreation Fee is a flat fee for four or more credit hours.(2) The COTA Fee goes to the Central Ohio Transit Authority for student bus passes.

FISCAL 2017
The Ohio State University | Financial Planning and Analysis 54
Master of Social Work (1)
Credit HoursInstructional
Fees BasicStudent Activity
Student Union Fee Rec Fee(2) COTA Fee(3)
Resident Total
Non-Resident Tuition Non-Resident Total
0.5 382.25 11.50 37.50 4.65 13.50 449.40 639.00 1,088.401.0 764.50 23.00 37.50 9.30 13.50 847.80 1,278.00 2,125.802.0 1,529.00 46.00 37.50 18.60 13.50 1,644.60 2,556.00 4,200.603.0 2,293.50 69.00 37.50 27.90 13.50 2,441.40 3,834.00 6,275.404.0 3,058.00 92.00 37.50 37.20 123.00 13.50 3,361.20 5,112.00 8,473.205.0 3,822.50 115.00 37.50 46.50 123.00 13.50 4,158.00 6,390.00 10,548.006.0 4,587.00 138.00 37.50 55.80 123.00 13.50 4,954.80 7,668.00 12,622.807.0 5,351.50 161.00 37.50 65.10 123.00 13.50 5,751.60 8,946.00 14,697.60
8.0+ 6,116.00 184.00 37.50 74.40 123.00 13.50 6,548.40 10,224.00 16,772.40
(1) Students in this program may also pay a field practicum fee of $94.50/semester.(2) The Recreation Fee is a flat fee for four or more credit hours.(3) The COTA Fee goes to the Central Ohio Transit Authority for student bus passes.
General Fees
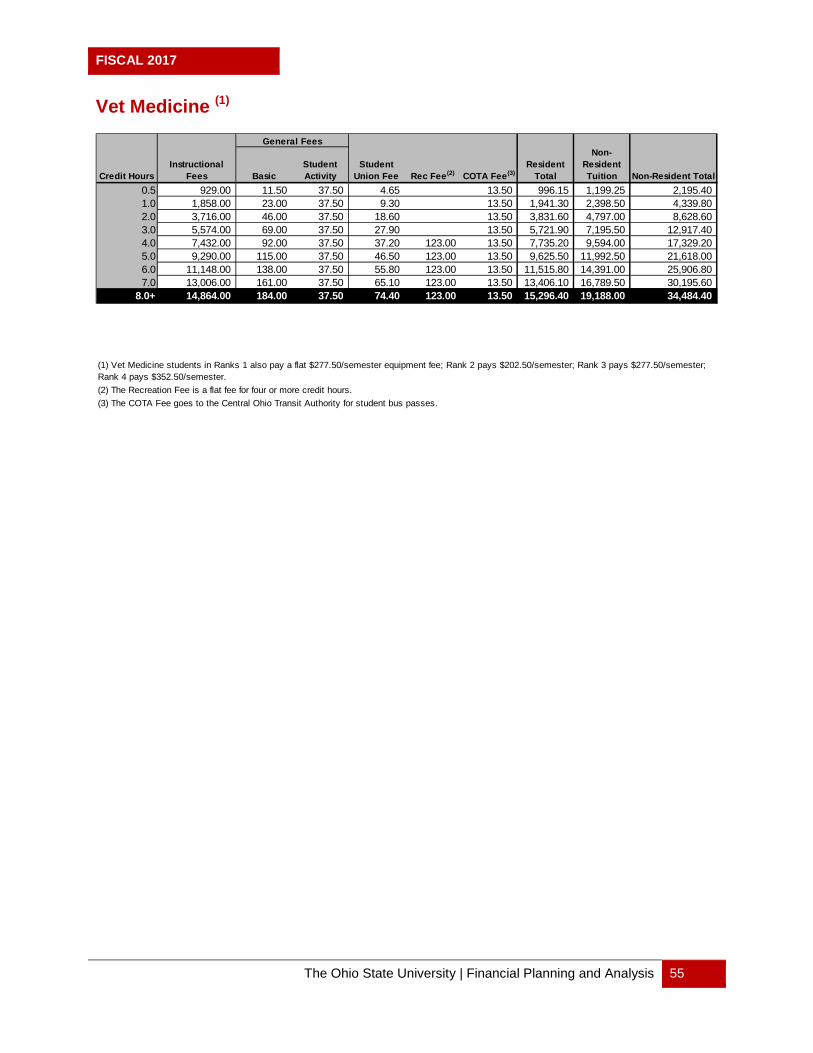
FISCAL 2017
The Ohio State University | Financial Planning and Analysis 55
Vet Medicine (1)
Credit HoursInstructional
Fees BasicStudent Activity
Student Union Fee Rec Fee(2) COTA Fee(3)
Resident Total
Non-Resident Tuition Non-Resident Total
0.5 929.00 11.50 37.50 4.65 13.50 996.15 1,199.25 2,195.401.0 1,858.00 23.00 37.50 9.30 13.50 1,941.30 2,398.50 4,339.802.0 3,716.00 46.00 37.50 18.60 13.50 3,831.60 4,797.00 8,628.603.0 5,574.00 69.00 37.50 27.90 13.50 5,721.90 7,195.50 12,917.404.0 7,432.00 92.00 37.50 37.20 123.00 13.50 7,735.20 9,594.00 17,329.205.0 9,290.00 115.00 37.50 46.50 123.00 13.50 9,625.50 11,992.50 21,618.006.0 11,148.00 138.00 37.50 55.80 123.00 13.50 11,515.80 14,391.00 25,906.807.0 13,006.00 161.00 37.50 65.10 123.00 13.50 13,406.10 16,789.50 30,195.60
8.0+ 14,864.00 184.00 37.50 74.40 123.00 13.50 15,296.40 19,188.00 34,484.40
(2) The Recreation Fee is a flat fee for four or more credit hours.(3) The COTA Fee goes to the Central Ohio Transit Authority for student bus passes.
(1) Vet Medicine students in Ranks 1 also pay a flat $277.50/semester equipment fee; Rank 2 pays $202.50/semester; Rank 3 pays $277.50/semester; Rank 4 pays $352.50/semester.
General Fees

FISCAL 2017
The Ohio State University | Financial Planning and Analysis 56
Master in Agricultural and Extension Education – Distance Learning (1)
Master of Global Engineering Leadership (MGEL)-Distance Learning (1)(2)
Credit HoursInstructional
Fees
Basic General
Fee
Distance Education
Fee
Resident Total,
Semester
Resident Total, Year
Non-Resident Tuition(1)
Non-Resident
Total, Semester
Non-Resident
Total, Year0.5 448.25 11.50 100.00 559.75 1,679.25 5.00 564.75 1,694.251.0 896.50 23.00 100.00 1,019.50 3,058.50 5.00 1,024.50 3,073.502.0 1,793.00 46.00 100.00 1,939.00 5,817.00 5.00 1,944.00 5,832.003.0 2,689.50 69.00 100.00 2,858.50 8,575.50 5.00 2,863.50 8,590.504.0 3,586.00 92.00 100.00 3,778.00 11,334.00 5.00 3,783.00 11,349.005.0 4,482.50 115.00 100.00 4,697.50 14,092.50 5.00 4,702.50 14,107.506.0 5,379.00 138.00 100.00 5,617.00 16,851.00 5.00 5,622.00 16,866.007.0 6,275.50 161.00 100.00 6,536.50 19,609.50 5.00 6,541.50 19,624.50
8.0+ 7,172.00 184.00 100.00 7,456.00 22,368.00 5.00 7,461.00 22,383.00
Credit HoursInstructional
Fees
Basic General
Fee
Distance Education
Fee
Resident Total,
Semester
Non-Resident Tuition(1)
Non-Resident
Total, Semester
0.5 430.50 11.50 100.00 542.00 5.00 547.001.0 961.00 23.00 100.00 1,084.00 5.00 1,089.002.0 2,022.00 46.00 100.00 2,168.00 5.00 2,173.003.0 3,083.00 69.00 100.00 3,252.00 5.00 3,257.004.0 4,144.00 92.00 100.00 4,336.00 5.00 4,341.005.0 5,205.00 115.00 100.00 5,420.00 5.00 5,425.006.0 6,266.00 138.00 100.00 6,504.00 5.00 6,509.007.0 7,327.00 161.00 100.00 7,588.00 5.00 7,593.008.0 8,388.00 184.00 100.00 8,672.00 5.00 8,677.00
Each add'l credit hour 1,061.00 23.00
(1) For students taking all distance courses, all on-site fees are waived and the non-resident tuition is reduced to $5.(2) Students enrolled in the MGEL program pay per credit hour.

FISCAL 2017
The Ohio State University | Financial Planning and Analysis 57
Lima, Mansfield, Marion & Newark Regional Campuses
Undergraduate
Credit Hours Instructional FeesGeneral
FeesResident
Total
Non-Resident Tuition
Non-Resident
Total0.5 144.00 4.75 148.75 379.00 527.751.0 288.00 9.50 297.50 758.00 1,055.502.0 576.00 19.00 595.00 1,516.00 2,111.003.0 864.00 28.50 892.50 2,274.00 3,166.504.0 1,152.00 38.00 1,190.00 3,032.00 4,222.005.0 1,440.00 47.50 1,487.50 3,790.00 5,277.506.0 1,728.00 57.00 1,785.00 4,548.00 6,333.007.0 2,016.00 66.50 2,082.50 5,306.00 7,388.508.0 2,304.00 76.00 2,380.00 6,064.00 8,444.009.0 2,592.00 85.50 2,677.50 6,822.00 9,499.50
10.0 2,880.00 95.00 2,975.00 7,580.00 10,555.0011.0 3,168.00 104.50 3,272.50 8,338.00 11,610.50
12.0 to 18.0(1) 3,456.00 114.00 3,570.00 9,096.00 12,666.00
(1) Students pay an additional half credit hour instructional, basic general, and non-resident fee for each half credit hour of enrollment over 18.
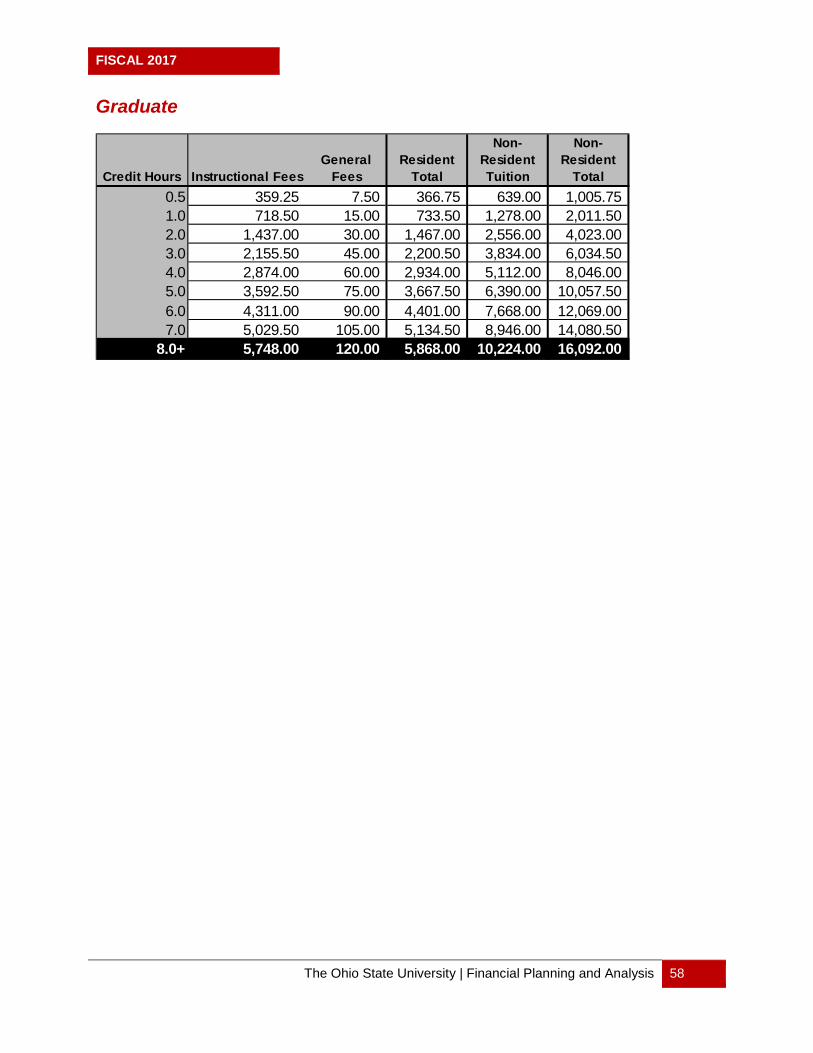
FISCAL 2017
The Ohio State University | Financial Planning and Analysis 58
Graduate
Credit Hours Instructional FeesGeneral
FeesResident
Total
Non-Resident Tuition
Non-Resident
Total0.5 359.25 7.50 366.75 639.00 1,005.751.0 718.50 15.00 733.50 1,278.00 2,011.502.0 1,437.00 30.00 1,467.00 2,556.00 4,023.003.0 2,155.50 45.00 2,200.50 3,834.00 6,034.504.0 2,874.00 60.00 2,934.00 5,112.00 8,046.005.0 3,592.50 75.00 3,667.50 6,390.00 10,057.506.0 4,311.00 90.00 4,401.00 7,668.00 12,069.007.0 5,029.50 105.00 5,134.50 8,946.00 14,080.50
8.0+ 5,748.00 120.00 5,868.00 10,224.00 16,092.00

FISCAL 2017
The Ohio State University | Financial Planning and Analysis 59
Agricultural Technical Institute
Credit Hours Instructional FeesGeneral
FeesResident
Total
Non-Resident Tuition
Non-Resident
Total0.5 143.25 4.75 148.00 379.00 527.001.0 286.50 9.50 296.00 758.00 1,054.002.0 573.00 19.00 592.00 1,516.00 2,108.003.0 859.50 28.50 888.00 2,274.00 3,162.004.0 1,146.00 38.00 1,184.00 3,032.00 4,216.005.0 1,432.50 47.50 1,480.00 3,790.00 5,270.006.0 1,719.00 57.00 1,776.00 4,548.00 6,324.007.0 2,005.50 66.50 2,072.00 5,306.00 7,378.008.0 2,292.00 76.00 2,368.00 6,064.00 8,432.009.0 2,578.50 85.50 2,664.00 6,822.00 9,486.00
10.0 2,865.00 95.00 2,960.00 7,580.00 10,540.0011.0 3,151.50 104.50 3,256.00 8,338.00 11,594.00
12.0 to 18.0(1) 3,438.00 114.00 3,552.00 9,096.00 12,648.00
(1) Students pay an additional half credit hour instructional, basic general, and non-resident fee for each half credit hour of enrollment over 18.

FISCAL 2017
The Ohio State University | Financial Planning and Analysis 60
Annual Fee History – Columbus Campus Resident Fees
FY 2013 FY 2014 FY 2015 FY 2016 FY 2017
Undergraduate(1) 9,615 9,615 9,615 9,615 9,615
Graduate Programs(1):Masters & PhD 11,704 11,928 11,928 11,928 11,928Master of Accounting 29,160 30,600 31,208 31,824 31,824Master of Business Administration (MBA) 27,336 28,688 29,536 30,120 30,120Master in Business Logistics Engineering (MBLE) 36,444 38,244 39,384 41,328 41,328 ^Working Professionals/Master of Business Administration (WP-MBA) 34,080 35,760 36,816 38,268 38,268 ^Master of Human Resource Management (MHRM) 13,456 14,368 15,208 16,248 16,248Graduate Minor in Business for Health Sciences n/a n/a 13,204 13,204 13,204Master of Genetic Counseling n/a n/a 29,256 29,256 29,256Master of Occupational Therapy 11,144 11,360 11,576 11,576 11,576Master/Doctor of Physical Therapy 18,564 18,924 19,296 19,296 19,296Master of Health Administration 13,800 14,064 14,336 14,336 14,336Master of Public Health (MPH) 12,280 12,520 12,760 12,760 12,760Program for Experienced Professionals - Master of Public Health (PEP) 12,280 12,520 12,760 12,760 12,760Doctor of Audiology 12,032 12,264 12,504 12,504 12,504Master of Speech-Language Pathology 12,032 12,264 12,504 12,504 12,504Master of Social Work 12,128 12,360 12,600 12,600 12,600Master in Agricultural and Extension Education - Distance Learning (MAEE-DL) n/a 21,648 22,068 22,068 22,068
Specialized Programs - Flat Rates Per Program(3):Executive Master of Business Administration (EMBA) 85,500 89,500 94,500 115,000 115,000Masters of Business Operational Excellence 47,500 48,500 51,500 53,500 53,500Master of Global Engineering Leadership (MGEL) - Distance Learning n/a n/a 38,000 38,000 38,000Specialized Masters in Business - Finance 51,500 53,000 55,000 56,650 56,650
Professional Programs - Rank 1 Only (1),(2):Dentistry 30,808 31,560 32,184 32,816 33,464Law 27,000 27,536 28,080 28,632 29,192Medicine 28,512 29,072 29,648 29,648 29,648Optometry 23,824 24,296 24,776 25,512 26,264Pharmacy 19,592 19,976 20,560 21,168 21,168Veterinary Medicine 27,568 28,112 28,664 29,512 30,096
^
(1)
(2)
(3) Specialized programs are designed for specific populations of students and do not follow a traditional academic program structure. Specialized programs have fees for the entire length of the program, which can span several semesters and fiscal years for each cohort.
Semester conversion (FY 2013) resulted in multiple tiers for all professional programs except for Law due to different curriculum schedules by rank. Since then, Medicine, Pharmacy, and Veterinary Medicine have now converged into one fee for all ranks. Only Rank 1 is reported here for Dentistry and Optometry, representing a traditional academic year (2 semesters).
Students in these programs typically attend for a full calendar year (3 semesters).
Full time for undergraduates is 12+ hours; full time for graduate/professional is 8+ hours. Fee numbers include only the instructional and general fees.

FISCAL 2017
The Ohio State University | Financial Planning and Analysis 61
Summary of Typical Student Fees – Undergraduates Columbus
FY 2016 FY 2017 Dollar PercentFees Fees Change Change
Resident FeesInstructional Fee 9,168 9,168 - 0.0%Basic Fee 372 372 - 0.0%Student Activity Fee (1) 75 75 - 0.0%
246 246 - 0.0%Room & Board (2) 11,576 11,576 - 0.0%Student Union Facility Fee 149 149 - 0.0%
Subtotal 21,586 21,586 - 0.0%Health Insurance (3) 2,374 2,754 380 16.0%Parking (4) 291 307 16 5.5%COTA Pass 27 27 - 0.0%
Total 24,278 24,674 396 1.6%
Non-Resident FeesInstructional Fee 9,168 9,168 - 0.0%Non-Resident Tuition 17,328 18,194 866 5.0%Basic Fee 372 372 - 0.0%Student Activity Fee (1) 75 75 - 0.0%Recreation Fee 246 246 - 0.0%Room & Board (2) 11,576 11,576 - 0.0%Student Union Facility Fee 149 149 - 0.0%
Subtotal 38,914 39,780 866 2.2%Health Insurance (3) 2,374 2,754 380 16.0%Parking (4) 291 307 16 5.5%COTA Pass 27 27 - 0.0%
Total 41,606 42,868 1,262 3.0%
(1) (2) (3) (4)
Student insurance is based on the single student comprehensive rate.
Recreation Fee
The student activity fee is considered part of the general fee for undergraduates. Based on the most popular options. Assumes no increases in rate.
Using an average of west campus rates.

FISCAL 2017
The Ohio State University | Financial Planning and Analysis 62
FY 2016 FY 2017 Dollar PercentFees Fees Change Change
International Non-Resident FeesInstructional & General 9,168 9,168 - 0.0%Non-Resident Tuition 17,328 18,194 866 5.0%International Student Surcharge (5) 1,000 996 (4) -0.4%International Student Surcharge (6) 1,940 1,932 (8) -0.4%Basic Fee 372 372 - 0.0%Student Activity Fee (1) 75 75 - 0.0%Recreation Fee 246 246 - 0.0%Room & Board (2) 11,576 11,576 - 0.0%Student Union Facility Fee 149 149 - 0.0%
Subtotal (5) 39,914 40,776 862 2.2%Subtotal (6) 40,854 41,712 858 2.1%
Health Insurance (3) 2,374 2,754 380 16.0%Parking (4) 291 307 16 5.5%COTA Pass 27 27 - 0.0%
Total (5) 42,606 43,864 1,258 3.0%Total (6) 43,546 44,800 1,254 2.9%
(1) (2) (3) (4) (5) (6)
Using an average of west campus rates. International student surcharge for students enrolled prior to August 2015. Subtotal and Total
International student surcharge for students enrolled prior to August 2015. Subtotal and Total are based on this surcharge rate.
The student activity fee is considered part of the general fee for undergraduates. Based on the most popular options. Assumes no increases in rate.Student insurance is based on the single student comprehensive rate.