first things first: development and global warmingecon/papers/1999papers/09hartley.pdf · first...
TRANSCRIPT
First Things First:
Development and Global Warming
James A Baker III Institute for Public Policy
by
Michael WarbyInstitute for Public Affairs, Melbourne
and
Peter Hartley and Kenneth Medlock, IIIRice University
1
First Things First: Development and Global Warming
Proposed controls over greenhouse gas emissions do not apply to developing countries thatare expected to become major producers of such gases. Controls on the developed nationsalone will do very little to reduce the accumulation of carbon dioxide in the atmosphere.Extending the controls to developing nations, however, will be very expensive, particularlyif developing countries are asked to implement controls sooner rather than later.Furthermore, the potential benefits of controls on greenhouse gas emissions are moreuncertain now than they are likely to be in several decades when more will be known aboutsome of the outstanding scientific issues.
In any rational ranking of national priorities in developing countries, many activities oughtto take precedence over combating global warming. These include such things asimproving health and education, raising living standards and ameliorating other moreurgent environmental problems. These benefits are not worth sacrificing for somethingwhich might – or might not – be the best way to handle what might – or might not – be aproblem 50 to 100 years from now.
In order for the developing countries to take effective action on global warming, they willhave to be compensated until the net cost is acceptable. Given the unimportance of theissue, relative to their other priorities, an acceptable net cost is likely to be close to zero.Thus, the cost of any sacrifice that is demanded of developing countries is likely to fall onthe taxpayers of those countries whose politicians view the problem as a high priority.However, such massive transfers of resources will be resisted.
When policy goes against simple, powerful rationality one can predict three possibleoutcomes. The policy is not serious and will be abandoned when its other purposes havebeen achieved, the policy will fail, or major resource transfers accompanied byconsiderable political upheaval will occur in an attempt to make the policy succeed.Unfortunately, these are not mutually exclusive outcomes.
The Global Warming Issue
The basic facts about global warming are fairly simply stated. High concentrations of so-called ‘greenhouse gases’ in the atmosphere create a ‘heat-absorbing blanket’ that raises thetemperature at the surface of the earth above what it would otherwise be. The FrameworkConvention on Climate Change (FCCC) defines greenhouse gases as ‘those gaseousconstituents of the atmosphere, both natural and anthropogenic, that absorb and re-emitinfrared radiation’. The relevant gases include carbon dioxide (CO2), methane (CH4),nitrous oxide (N2O), hydrofluorocarbons, perfluorocarbons and sulfur hexafluoride. Themost important greenhouse gas is water vapor.1
1 Davis, R. W., Legates, D., (June 1998).
First Things First - Development and Global Warming
2
The ‘global warming problem’ arises, as a theoretical result, from computer simulationmodels suggesting that an increase in the concentration of greenhouse gases – CO2 inparticular – will raise surface temperatures. The direct effect of higher concentrations ofCO2 on temperature is not large. Rather, most of the predicted increase in radiationabsorption by the atmosphere results from higher levels of water vapor triggered by theincrease in CO2. A change in water vapor may be associated, however, with increasedcloud and snow cover, both of which reduce warming by reflecting incoming solarradiation. Large computer models are needed to keep track of these and other interrelatedeffects. Since the original increase in CO2 represents a small perturbation to a complexsystem, the likely consequences are difficult to predict. The result has been substantialdisagreement about global warming science (see Appendices II-IV).
Since 1958, the concentration of CO2 in the atmosphere has risen about 14% (a notinconsiderable rise in 40 years) and is now about 30% above pre-industrial levels.2 TheIntergovernmental Panel on Climate Change (IPCC) currently estimates that this will riseby another 48% during the next century to a level 90% above pre-industrial levels.3 Claimsin the mass media notwithstanding, the level of increase to be expected, and its likelyconsequences for temperatures, sea levels or extreme weather events, is unclear.
The latest (1995) IPCC report’s median projection is an increase in average temperatures of2oC by 2100. This figure is 23% below the IPCC’s 1992 median projection and 38%below their 1990 median projection.4 It is only a quarter of the figure projected at theToronto conference of 1988, the year the IPCC was created. The instability of theprojections – with a 75% fall in seven years, almost 40% in five – is an indication of theuncertainty of the science in this area.
We have claimed the argument is mainly a ‘theoretical result’ because there is only weakevidence that past increases in the concentration of CO2 in the atmosphere have raisedaverage global temperatures. Surface temperature records have revealed a warming trendsince the late nineteenth century. There is considerable doubt, however, whether theserecords are representative.5
2 World Resources Institute, (1997).
3 Houghton, J. T. et al (eds) (1996) P.25. As is explained below, projections of future emissions and
concentrations are subject to considerable uncertainty.
4 Houghton et al (1996); Houghton et al (eds) (1992); Houghton et al (eds) (1990).
5 For example, in a press statement accompanying a research report released on February 4, 1999, the
National Research Council stated “Deficiencies in the accuracy, quality and continuity of the records …
place serious limitations on the confidence that can be placed in the research results.”
First Things First - Development and Global Warming
3
Over-sampling of urban, and other highly populated, areas contaminates many of the land-based records. In what has been called the ‘heat-island’ effect, urban areas are known toraise temperatures relative to the surrounding countryside. Walls of buildings andextensive areas of pavement absorb heat during the day and radiate it back to theatmosphere at night. There is also substantial doubt about the accuracy of the oceanicrecords – and oceans cover about two-thirds of the global surface area.
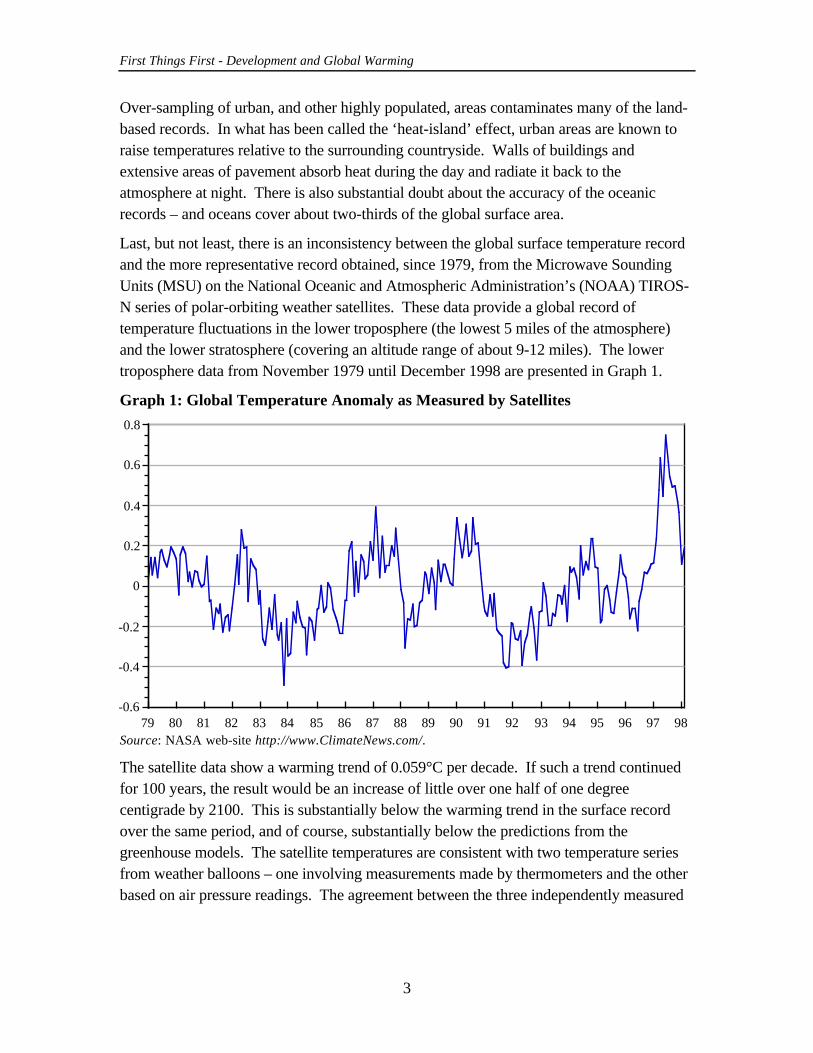
Last, but not least, there is an inconsistency between the global surface temperature recordand the more representative record obtained, since 1979, from the Microwave SoundingUnits (MSU) on the National Oceanic and Atmospheric Administration’s (NOAA) TIROS-N series of polar-orbiting weather satellites. These data provide a global record oftemperature fluctuations in the lower troposphere (the lowest 5 miles of the atmosphere)and the lower stratosphere (covering an altitude range of about 9-12 miles). The lowertroposphere data from November 1979 until December 1998 are presented in Graph 1.
Graph 1: Global Temperature Anomaly as Measured by Satellites
Source: NASA web-site http://www.ClimateNews.com/.
The satellite data show a warming trend of 0.059°C per decade. If such a trend continuedfor 100 years, the result would be an increase of little over one half of one degreecentigrade by 2100. This is substantially below the warming trend in the surface recordover the same period, and of course, substantially below the predictions from thegreenhouse models. The satellite temperatures are consistent with two temperature seriesfrom weather balloons – one involving measurements made by thermometers and the otherbased on air pressure readings. The agreement between the three independently measured
79 80 81 82 83 84 85 86 87 88 89 90 91 92 93 94 95 96 97 98-0.6
-0.4
-0.2
0
0.2
0.4
0.6
0.8
First Things First - Development and Global Warming
4
series, and the disagreement between those series and the surface record, suggests that thesurface record is unrepresentative.6
Nevertheless, the satellite temperatures do reveal a positive trend in global averagetemperatures. There is also an indication that most of the warming that has occurred hasbeen on winter nights in Alaska and Siberia. This pattern of warming is consistent with thepredictions of the computer simulation models.
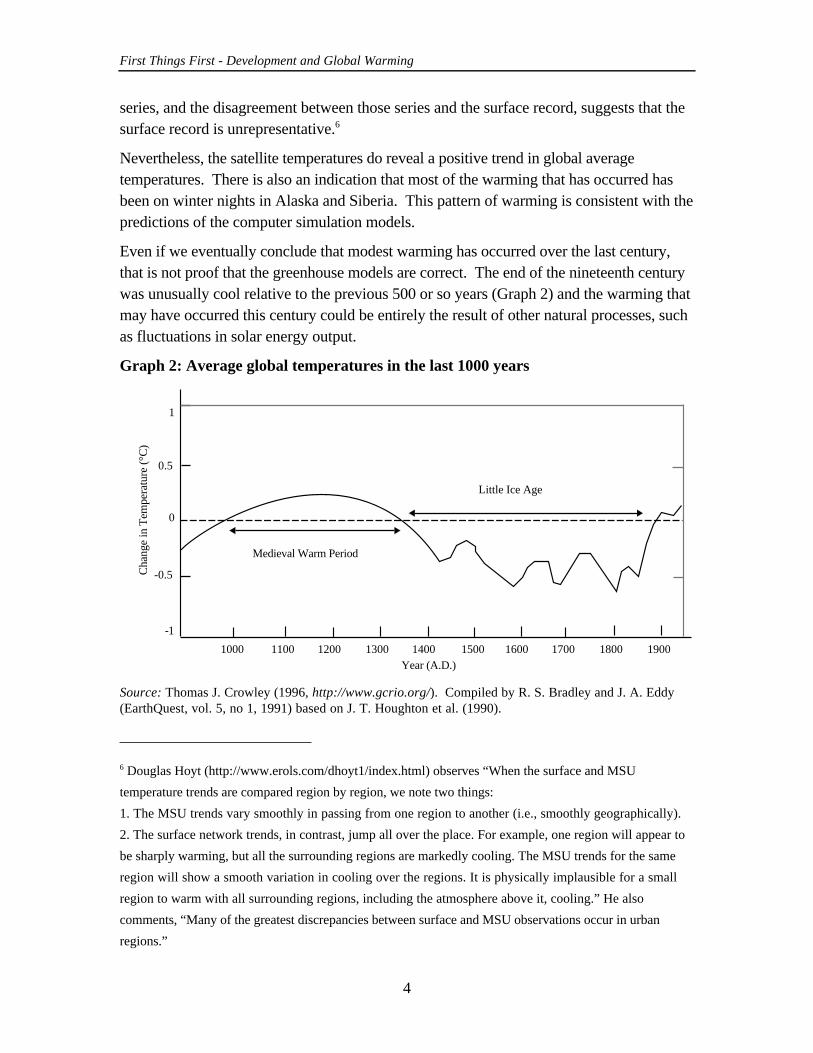
Even if we eventually conclude that modest warming has occurred over the last century,that is not proof that the greenhouse models are correct. The end of the nineteenth centurywas unusually cool relative to the previous 500 or so years (Graph 2) and the warming thatmay have occurred this century could be entirely the result of other natural processes, suchas fluctuations in solar energy output.
Graph 2: Average global temperatures in the last 1000 years
Source: Thomas J. Crowley (1996, http://www.gcrio.org/). Compiled by R. S. Bradley and J. A. Eddy(EarthQuest, vol. 5, no 1, 1991) based on J. T. Houghton et al. (1990).
6 Douglas Hoyt (http://www.erols.com/dhoyt1/index.html) observes “When the surface and MSU
temperature trends are compared region by region, we note two things:
1. The MSU trends vary smoothly in passing from one region to another (i.e., smoothly geographically).
2. The surface network trends, in contrast, jump all over the place. For example, one region will appear to
be sharply warming, but all the surrounding regions are markedly cooling. The MSU trends for the same
region will show a smooth variation in cooling over the regions. It is physically implausible for a small
region to warm with all surrounding regions, including the atmosphere above it, cooling.” He also
comments, “Many of the greatest discrepancies between surface and MSU observations occur in urban
regions.”
Cha
nge
in T
empe
ratu
re (
°C)
-1
-0.5
0
0.5
1
Medieval Warm Period
Little Ice Age
1000 1100 1200 1300 1400 1500 1600 1700 1800 1900Year (A.D.)
First Things First - Development and Global Warming
5
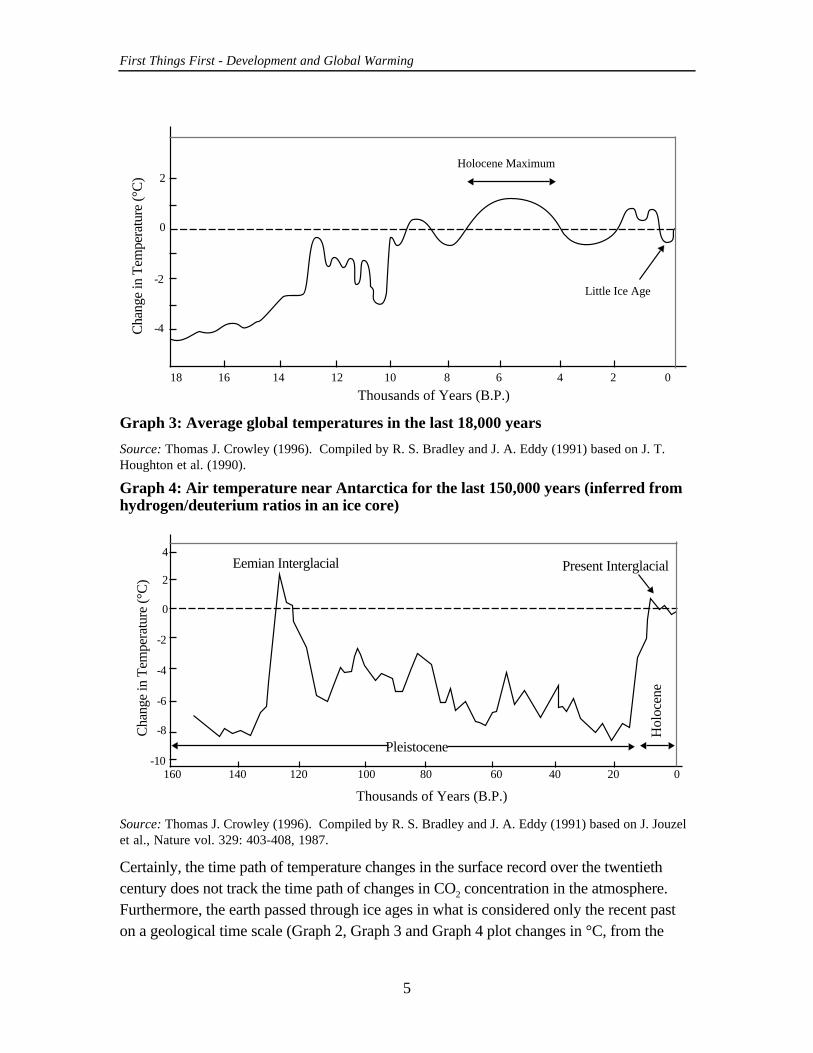
Graph 3: Average global temperatures in the last 18,000 years
Source: Thomas J. Crowley (1996). Compiled by R. S. Bradley and J. A. Eddy (1991) based on J. T.Houghton et al. (1990).
Graph 4: Air temperature near Antarctica for the last 150,000 years (inferred fromhydrogen/deuterium ratios in an ice core)
Source: Thomas J. Crowley (1996). Compiled by R. S. Bradley and J. A. Eddy (1991) based on J. Jouzelet al., Nature vol. 329: 403-408, 1987.
Certainly, the time path of temperature changes in the surface record over the twentiethcentury does not track the time path of changes in CO2 concentration in the atmosphere.Furthermore, the earth passed through ice ages in what is considered only the recent paston a geological time scale (Graph 2, Graph 3 and Graph 4 plot changes in °C, from the
18 16 14 12 10 8 6 4 2 0
-4
-2
0
2
Thousands of Years (B.P.)
Cha
nge
in T
empe
ratu
re (°
C)
Holocene Maximum
Little Ice Age
Pleistocene
Hol
ocen
e
Present InterglacialEemian Interglacial
Thousands of Years (B.P.)
Cha
nge
in T
empe
ratu
re (°
C)
-10
-8
-6
-4
-2
0
2
4
160 140 120 100 80 60 40 20 0
First Things First - Development and Global Warming
6
average global temperature for 1900). In fact, current IPCC projections of futuretemperatures are within the range of those previously encountered on a geological timescale. Admittedly, however, a high rate of change of temperature could overwhelm manyecosystems before they have time to adjust.
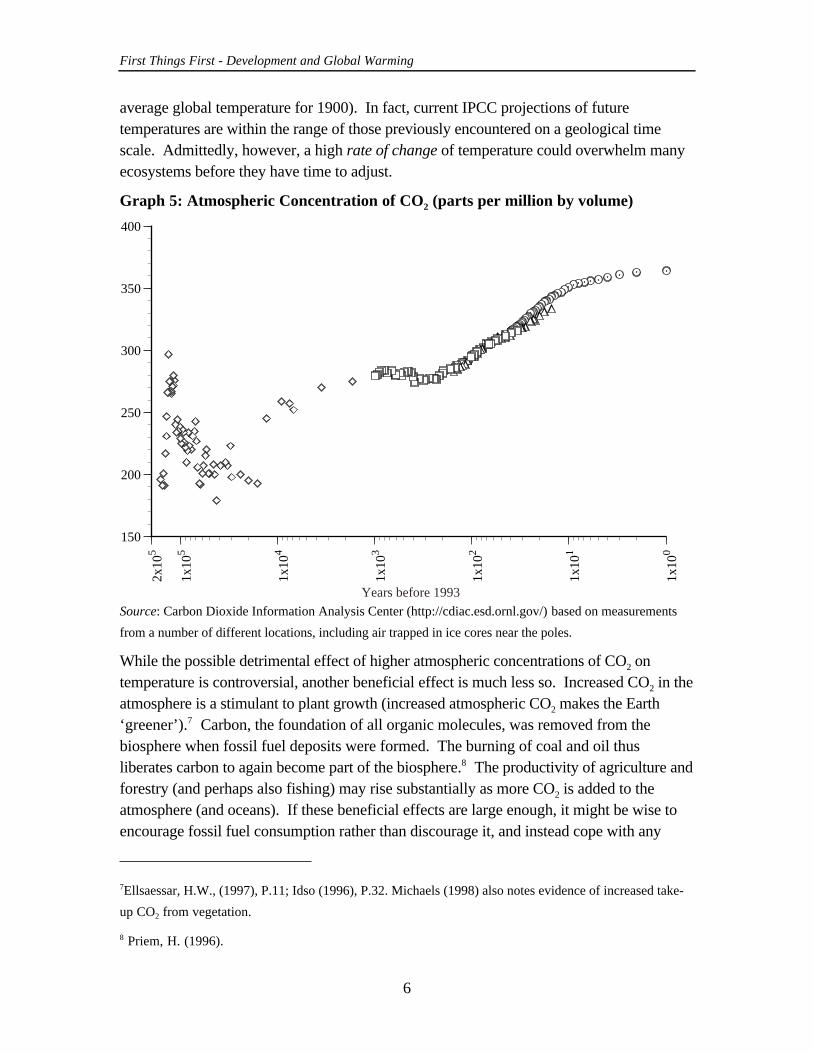
Graph 5: Atmospheric Concentration of CO2 (parts per million by volume)
Source: Carbon Dioxide Information Analysis Center (http://cdiac.esd.ornl.gov/) based on measurements
from a number of different locations, including air trapped in ice cores near the poles.
While the possible detrimental effect of higher atmospheric concentrations of CO2 ontemperature is controversial, another beneficial effect is much less so. Increased CO2 in theatmosphere is a stimulant to plant growth (increased atmospheric CO2 makes the Earth‘greener’).7 Carbon, the foundation of all organic molecules, was removed from thebiosphere when fossil fuel deposits were formed. The burning of coal and oil thusliberates carbon to again become part of the biosphere.8 The productivity of agriculture andforestry (and perhaps also fishing) may rise substantially as more CO2 is added to theatmosphere (and oceans). If these beneficial effects are large enough, it might be wise toencourage fossil fuel consumption rather than discourage it, and instead cope with any
7Ellsaessar, H.W., (1997), P.11; Idso (1996), P.32. Michaels (1998) also notes evidence of increased take-
up CO2 from vegetation.
8 Priem, H. (1996).
150
200
250
300
350
400
2x10
5
1x10
5
1x10
4
1x10
3
1x10
2
1x10
1
1x10
0
Years before 1993
First Things First - Development and Global Warming
7
adverse consequences from temperature increases in other ways. A rise in the amount ofcarbon present in biosphere ‘sinks’ also limits the effect of CO2 emissions on theatmospheric concentrations of CO2 (Graph 5).
The accumulation of CO2 in the atmosphere at projected levels of concentration is not in andof itself dangerous to our health or survival. This makes CO2 emission a very differenttype of air pollution problem than, for example, sulfurous or nitrous oxides. The spillovercosts associated with the latter pollutants arise from the flow of current emissions. In thecase of CO2, possible spillover costs (or benefits) arise only from the gradual accumulationof past emissions in the atmosphere. If emissions had no effect on concentrations –because, for example, they were immediately absorbed in sinks, such as increasedvegetation – there would be no greenhouse gas issue. The real policy target, if we areseriously concerned about global warming from greenhouse gases, is to stop the rise ingreenhouse gas concentrations in the atmosphere. Unlike most other types of air pollution,control of CO2 emissions in the future is a close substitute for control today. This makesthe potential problem less urgent.
Forecasting Emissions Growth
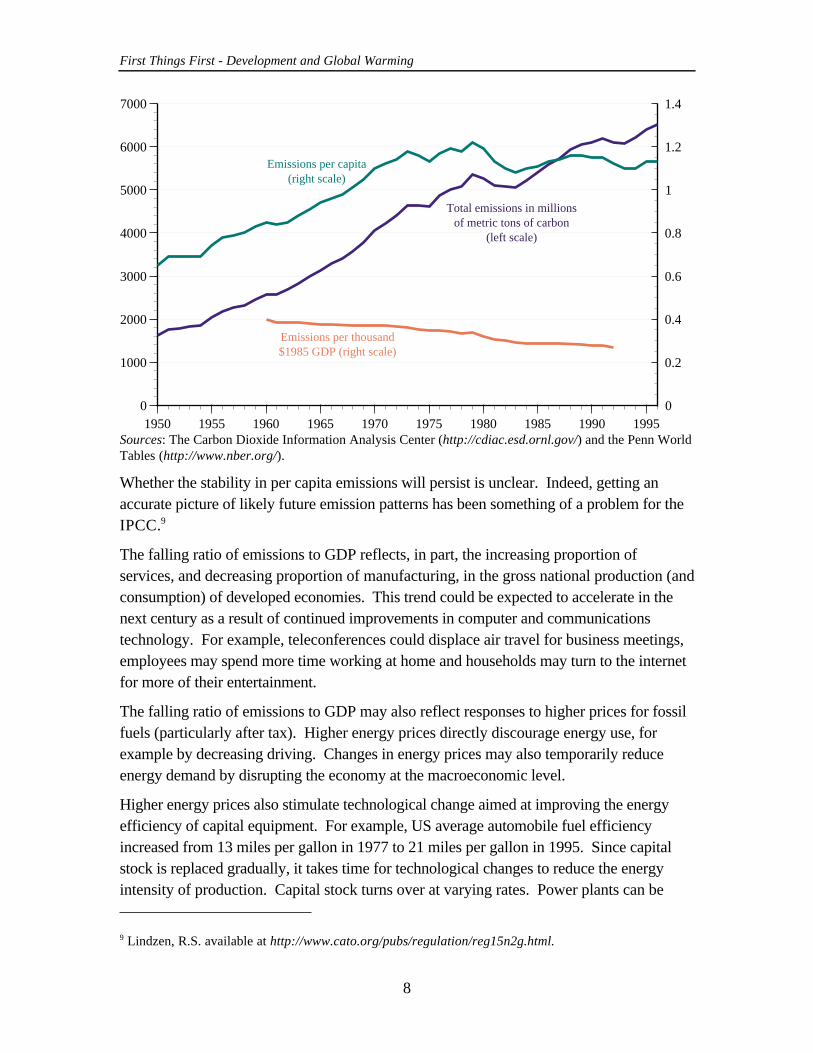
Aside from whether emissions of CO2 end up being harmful or beneficial on balance,another substantial uncertainty is the projected size of any increase in greenhouse gasemissions over the next century. Graph 6 shows that global per capita emissions of CO2
have been relatively stable for 20 years while the emission intensity of overall economicproduction has been falling.
Graph 6: Global CO2 emissions from industrial processes
First Things First - Development and Global Warming
8
Sources: The Carbon Dioxide Information Analysis Center (http://cdiac.esd.ornl.gov/) and the Penn WorldTables (http://www.nber.org/).
Whether the stability in per capita emissions will persist is unclear. Indeed, getting anaccurate picture of likely future emission patterns has been something of a problem for theIPCC.9
The falling ratio of emissions to GDP reflects, in part, the increasing proportion ofservices, and decreasing proportion of manufacturing, in the gross national production (andconsumption) of developed economies. This trend could be expected to accelerate in thenext century as a result of continued improvements in computer and communicationstechnology. For example, teleconferences could displace air travel for business meetings,employees may spend more time working at home and households may turn to the internetfor more of their entertainment.
The falling ratio of emissions to GDP may also reflect responses to higher prices for fossilfuels (particularly after tax). Higher energy prices directly discourage energy use, forexample by decreasing driving. Changes in energy prices may also temporarily reduceenergy demand by disrupting the economy at the macroeconomic level.
Higher energy prices also stimulate technological change aimed at improving the energyefficiency of capital equipment. For example, US average automobile fuel efficiencyincreased from 13 miles per gallon in 1977 to 21 miles per gallon in 1995. Since capitalstock is replaced gradually, it takes time for technological changes to reduce the energyintensity of production. Capital stock turns over at varying rates. Power plants can be
9 Lindzen, R.S. available at http://www.cato.org/pubs/regulation/reg15n2g.html.
0
1000
2000
3000
4000
5000
6000
7000
0
0.2
0.4
0.6
0.8
1
1.2
1.4
1950 1955 1960 1965 1970 1975 1980 1985 1990 1995
Emissions per thousand$1985 GDP (right scale)
Total emissions in millionsof metric tons of carbon
(left scale)
Emissions per capita(right scale)
First Things First - Development and Global Warming
9
expected to last 30 to 50 years, industrial manufacturing facilities 10 to 30, cars about 10,jet airplanes about 25, ships about 50, buildings about 50-80 and so on.10 There is also areasonable expectation that major advances in alternative energy technologies will occur inthe relevant time frame. After all, we are speaking about the next 50–100 years, and theprices, for example, of solar cells for electricity generation, or fuel cells for poweringautomobiles, are already falling in real terms.
The conversion of the economies in the former Soviet Union and Eastern Europe fromcentral planning to markets is also likely to provide a short-term reduction in the ratio ofemissions to GDP. Managers in these countries previously had not paid much attention toenergy efficiency since they had little incentive to do so. In response to new marketpressures, they are likely to improve management practices and adopt more energy-efficienttechnologies.
There are also extremely powerful forces tending the raise the ratio of CO2 emissions toGDP. Developing countries, such as India and China, are turning toward low-costmanufacturing as a basis for development, attracting such industries away from thedeveloped countries. On the one hand, since the technologies and mix of fuels currentlyused in the developing countries tend to produce more emissions per unit of output, a shiftof manufacturing to these countries could increase world per capita emissions of CO2. Onthe other hand, new manufacturing plants could incorporate advances in energy efficiency(which correlates strongly with emission-intensity), and so may contribute to the trend ofdeclining emissions per unit of world GDP.11
Improved standards of living within the developing economies – and in China and India inparticular – are major potential contributors to increased CO2 emissions per capita. Higherincomes lead to increased demand for manufactured goods. Furthermore, newtransportation infrastructure, made possible by economic development, facilitates increasedcommercial and personal use of transportation services.
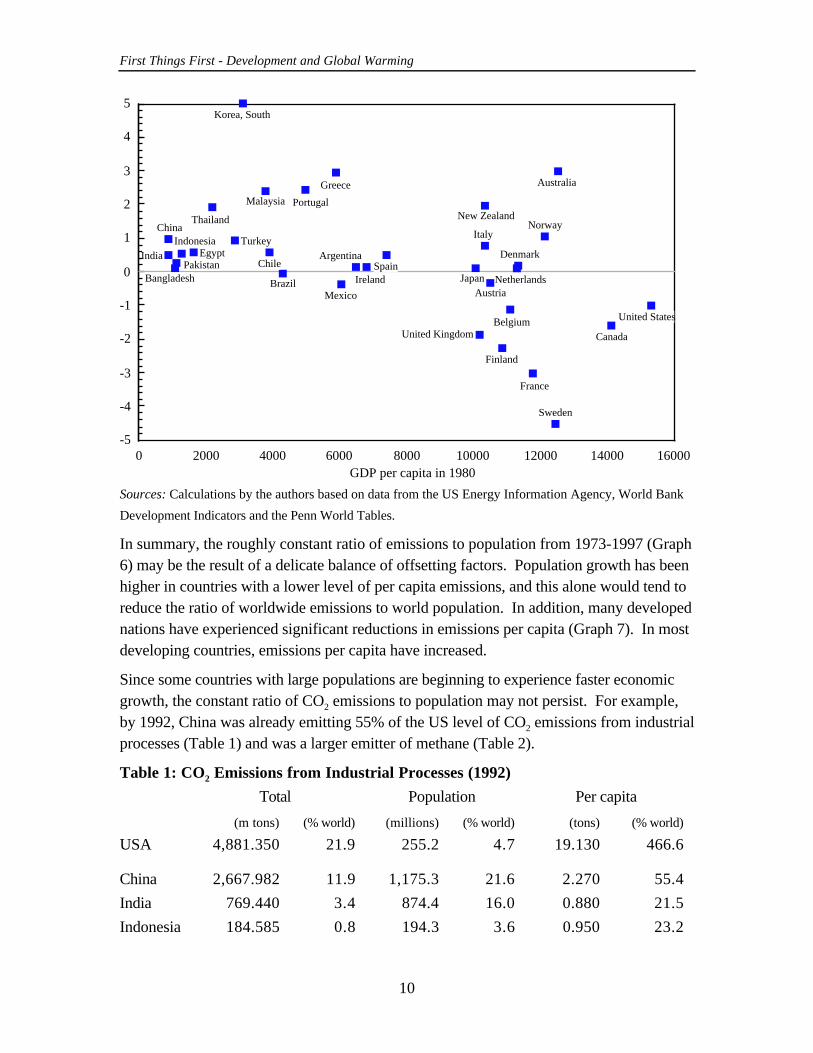
Graph 7: Change in CO2 emissions per capita 1980–1995 (metric tons of CO2)
10 Reinstein, R. (1998) available at http://www.cei.org/gw.html.
11 Pearce, F., ‘Mythical Monster’ New Scientist, 9 January 1999, P.44.
First Things First - Development and Global Warming
10
Sources: Calculations by the authors based on data from the US Energy Information Agency, World Bank
Development Indicators and the Penn World Tables.
In summary, the roughly constant ratio of emissions to population from 1973-1997 (Graph6) may be the result of a delicate balance of offsetting factors. Population growth has beenhigher in countries with a lower level of per capita emissions, and this alone would tend toreduce the ratio of worldwide emissions to world population. In addition, many developednations have experienced significant reductions in emissions per capita (Graph 7). In mostdeveloping countries, emissions per capita have increased.
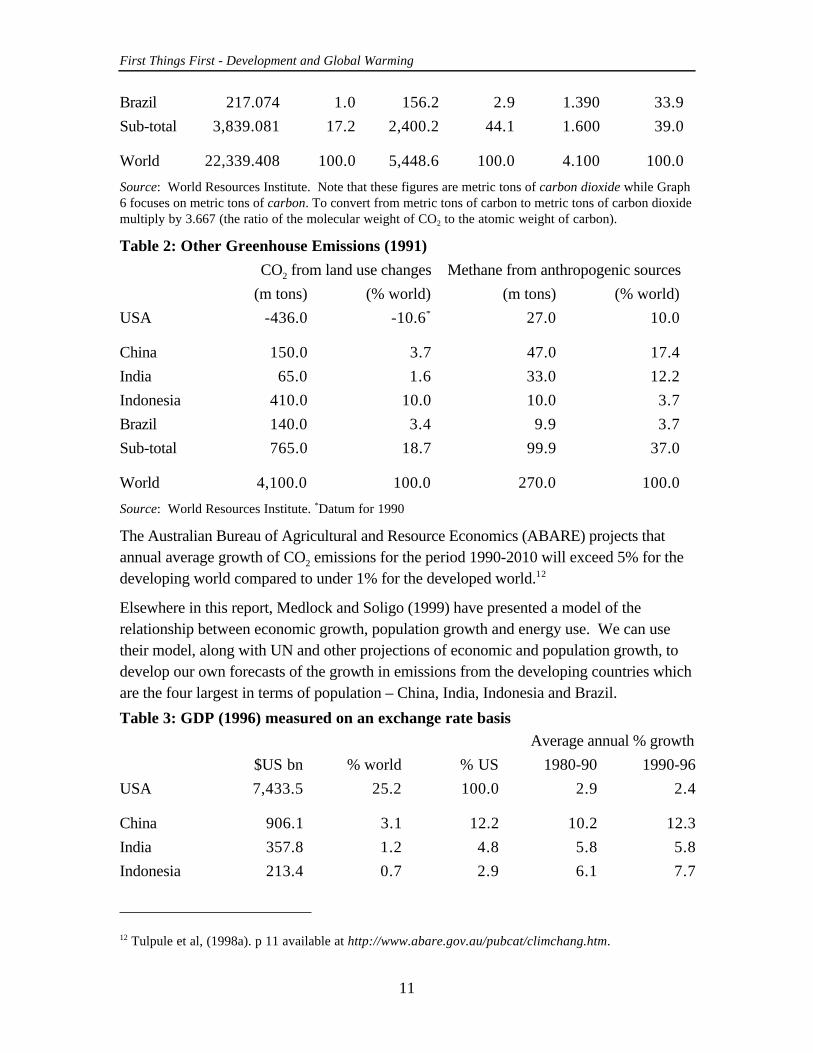
Since some countries with large populations are beginning to experience faster economicgrowth, the constant ratio of CO2 emissions to population may not persist. For example,by 1992, China was already emitting 55% of the US level of CO2 emissions from industrialprocesses (Table 1) and was a larger emitter of methane (Table 2).
Table 1: CO2 Emissions from Industrial Processes (1992)
Total Population Per capita
(m tons) (% world) (millions) (% world) (tons) (% world)
USA 4,881.350 21.9 255.2 4.7 19.130 466.6
China 2,667.982 11.9 1,175.3 21.6 2.270 55.4
India 769.440 3.4 874.4 16.0 0.880 21.5
Indonesia 184.585 0.8 194.3 3.6 0.950 23.2
B
B
B
B
B
B
B
B
B
B
B
B
B
B
B B
B
B
B
B
B
B
B
B
B
B
B
B
B
B
B
B
B
-5
-4
-3
-2
-1
0
1
2
3
4
5
0 2000 4000 6000 8000 10000 12000 14000 16000GDP per capita in 1980
Argentina
Australia
AustriaBangladesh
Belgium
Brazil
Canada
Chile
China
DenmarkEgypt
Finland
France
Greece
IndiaIndonesia
Ireland
Italy
Japan
Korea, South
Malaysia
Mexico
Netherlands
New ZealandNorway
Pakistan
Portugal
Spain
Sweden
Thailand
Turkey
United Kingdom
United States
First Things First - Development and Global Warming
11
Brazil 217.074 1.0 156.2 2.9 1.390 33.9
Sub-total 3,839.081 17.2 2,400.2 44.1 1.600 39.0
World 22,339.408 100.0 5,448.6 100.0 4.100 100.0
Source: World Resources Institute. Note that these figures are metric tons of carbon dioxide while Graph6 focuses on metric tons of carbon. To convert from metric tons of carbon to metric tons of carbon dioxidemultiply by 3.667 (the ratio of the molecular weight of CO2 to the atomic weight of carbon).
Table 2: Other Greenhouse Emissions (1991)
CO2 from land use changes Methane from anthropogenic sources
(m tons) (% world) (m tons) (% world)
USA -436.0 -10.6* 27.0 10.0
China 150.0 3.7 47.0 17.4
India 65.0 1.6 33.0 12.2
Indonesia 410.0 10.0 10.0 3.7
Brazil 140.0 3.4 9.9 3.7
Sub-total 765.0 18.7 99.9 37.0
World 4,100.0 100.0 270.0 100.0
Source: World Resources Institute. *Datum for 1990
The Australian Bureau of Agricultural and Resource Economics (ABARE) projects thatannual average growth of CO2 emissions for the period 1990-2010 will exceed 5% for thedeveloping world compared to under 1% for the developed world.12
Elsewhere in this report, Medlock and Soligo (1999) have presented a model of therelationship between economic growth, population growth and energy use. We can usetheir model, along with UN and other projections of economic and population growth, todevelop our own forecasts of the growth in emissions from the developing countries whichare the four largest in terms of population – China, India, Indonesia and Brazil.
Table 3: GDP (1996) measured on an exchange rate basisAverage annual % growth
$US bn % world % US 1980-90 1990-96
USA 7,433.5 25.2 100.0 2.9 2.4
China 906.1 3.1 12.2 10.2 12.3
India 357.8 1.2 4.8 5.8 5.8
Indonesia 213.4 0.7 2.9 6.1 7.7
12 Tulpule et al, (1998a). p 11 available at http://www.abare.gov.au/pubcat/climchang.htm.
First Things First - Development and Global Warming
12
Brazil 709.6 2.4 9.5 2.7 2.9
Sub-total 2,186.9 7.4 29.4 … …
World 29,510.0 100.0 3.1 2.2
Source: World Development Indicators 1998, World Bank
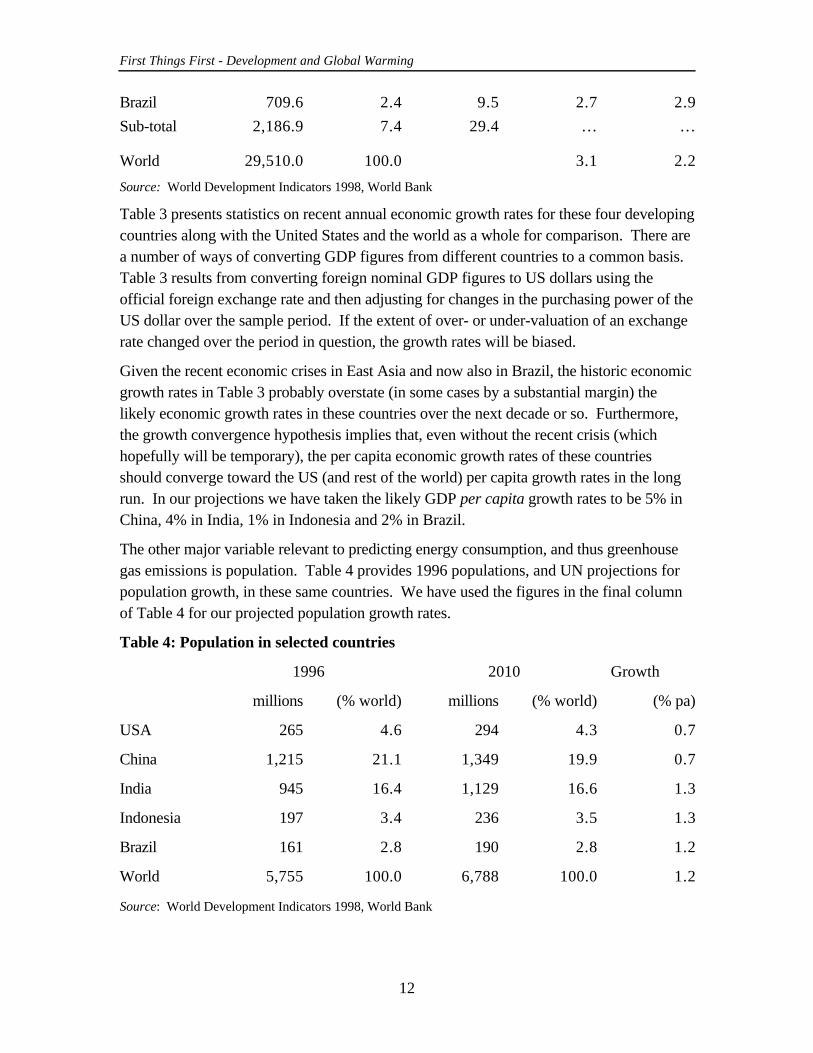
Table 3 presents statistics on recent annual economic growth rates for these four developingcountries along with the United States and the world as a whole for comparison. There area number of ways of converting GDP figures from different countries to a common basis.Table 3 results from converting foreign nominal GDP figures to US dollars using theofficial foreign exchange rate and then adjusting for changes in the purchasing power of theUS dollar over the sample period. If the extent of over- or under-valuation of an exchangerate changed over the period in question, the growth rates will be biased.
Given the recent economic crises in East Asia and now also in Brazil, the historic economicgrowth rates in Table 3 probably overstate (in some cases by a substantial margin) thelikely economic growth rates in these countries over the next decade or so. Furthermore,the growth convergence hypothesis implies that, even without the recent crisis (whichhopefully will be temporary), the per capita economic growth rates of these countriesshould converge toward the US (and rest of the world) per capita growth rates in the longrun. In our projections we have taken the likely GDP per capita growth rates to be 5% inChina, 4% in India, 1% in Indonesia and 2% in Brazil.
The other major variable relevant to predicting energy consumption, and thus greenhousegas emissions is population. Table 4 provides 1996 populations, and UN projections forpopulation growth, in these same countries. We have used the figures in the final columnof Table 4 for our projected population growth rates.
Table 4: Population in selected countries
1996 2010 Growth
millions (% world) millions (% world) (% pa)
USA 265 4.6 294 4.3 0.7
China 1,215 21.1 1,349 19.9 0.7
India 945 16.4 1,129 16.6 1.3
Indonesia 197 3.4 236 3.5 1.3
Brazil 161 2.8 190 2.8 1.2
World 5,755 100.0 6,788 100.0 1.2
Source: World Development Indicators 1998, World Bank
First Things First - Development and Global Warming
13
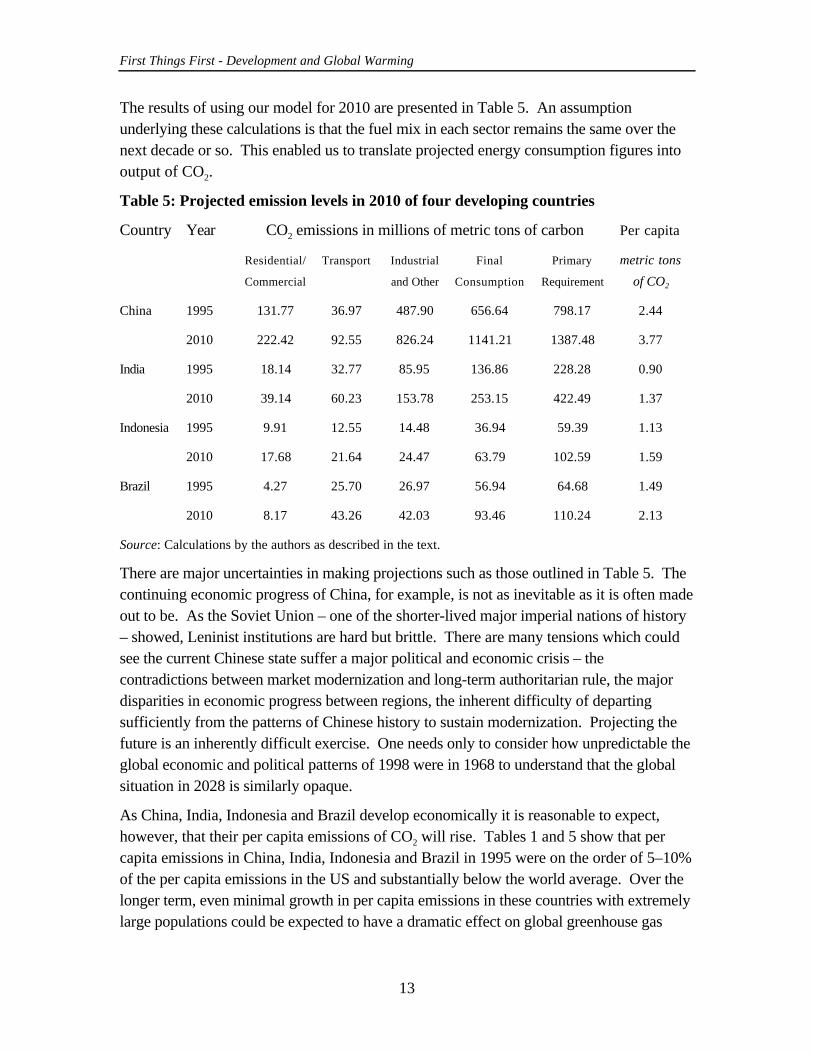
The results of using our model for 2010 are presented in Table 5. An assumptionunderlying these calculations is that the fuel mix in each sector remains the same over thenext decade or so. This enabled us to translate projected energy consumption figures intooutput of CO2.
Table 5: Projected emission levels in 2010 of four developing countries
Country Year CO2 emissions in millions of metric tons of carbon Per capita
Residential/
Commercial
Transport Industrial
and Other
Final
Consumption
Primary
Requirement
metric tons
of CO2
China 1995 131.77 36.97 487.90 656.64 798.17 2.44
2010 222.42 92.55 826.24 1141.21 1387.48 3.77
India 1995 18.14 32.77 85.95 136.86 228.28 0.90
2010 39.14 60.23 153.78 253.15 422.49 1.37
Indonesia 1995 9.91 12.55 14.48 36.94 59.39 1.13
2010 17.68 21.64 24.47 63.79 102.59 1.59
Brazil 1995 4.27 25.70 26.97 56.94 64.68 1.49
2010 8.17 43.26 42.03 93.46 110.24 2.13
Source: Calculations by the authors as described in the text.
There are major uncertainties in making projections such as those outlined in Table 5. Thecontinuing economic progress of China, for example, is not as inevitable as it is often madeout to be. As the Soviet Union – one of the shorter-lived major imperial nations of history– showed, Leninist institutions are hard but brittle. There are many tensions which couldsee the current Chinese state suffer a major political and economic crisis – thecontradictions between market modernization and long-term authoritarian rule, the majordisparities in economic progress between regions, the inherent difficulty of departingsufficiently from the patterns of Chinese history to sustain modernization. Projecting thefuture is an inherently difficult exercise. One needs only to consider how unpredictable theglobal economic and political patterns of 1998 were in 1968 to understand that the globalsituation in 2028 is similarly opaque.
As China, India, Indonesia and Brazil develop economically it is reasonable to expect,however, that their per capita emissions of CO2 will rise. Tables 1 and 5 show that percapita emissions in China, India, Indonesia and Brazil in 1995 were on the order of 5–10%of the per capita emissions in the US and substantially below the world average. Over thelonger term, even minimal growth in per capita emissions in these countries with extremelylarge populations could be expected to have a dramatic effect on global greenhouse gas
First Things First - Development and Global Warming
14
emissions. Each of these countries therefore is a necessary part of any effective regime forcontrolling emissions of greenhouse gases.
The Economics and Politics of Controlling CO2 Concentrations
In order to understand the international relations dimensions of the greenhouse gas issue, itis important to recall that concentrations, not emissions, are the source of the externality.Current increased concentrations of greenhouse gases in the atmosphere are the result ofpast emissions. The developed countries, who currently emit about 60 to 70%13 of totalannual anthropogenic CO2 emissions, also are responsible for the majority of pastanthropogenic emissions (about 80% of human contribution to current concentrations14).
The Framework Convention on Climate Change was opened for signing at the June 1992‘Earth Summit’ held at Rio de Janiero. The Convention divides the world into so-called‘Annex I’ countries, who have direct obligations under the Convention to mitigate theiremission of greenhouse gases, and the developing world, who do not. This division of theworld into Annex I countries and others, recognizes differing national priorities andcapacity to pay. As noted in the previous section, however, CO2 emissions are growingmuch faster in developing, than in developed, countries. On current trends, emissions bythe developing world will exceed those of the Annex I countries during the first half of thenext century (current UN projections are for that to take place by 203515 while ABAREprojections assume equality of emissions by 2010.16) If the developed world takes anyeffective action to reduce emissions, this process will speed up. A process that limitsemissions only of countries that end up producing a minority of annual global emissions isof limited practical value.
The mere fact that anthropogenic emissions from developing countries come to equal, andthen exceed, those from the developed countries does not, of itself, undermine theargument that the developed world should bear the brunt of the cost of control. It merelyincreases the importance, for any effective regime, of gaining developing worldparticipation.Here, the news is bad. If we want to stop the rise in greenhouse gas concentrations, thenanthropogenic global emissions cannot exceed 40% of their 1996 levels (6.518 billion tonsof carbon),17 which amounts to 2.6 billion tons of carbon.18 This implies an emissions
13 Heyhoe, E. et al (1998) available at http://www.abare.gov.au/pubcat/climchang.htm.
14 New Scientist ‘Editorial’, 29 November 1997; New Scientist, ‘Buenos Aires Daily Diary’ 6 November
1998.
15 United Nations (1999), Setting the Record Straight: Global Climate Change.
16 Tulpulé et al (1998a) available at http://www.abare.gov.au/pubcat/climchang.htm.
17 The Carbon Dioxide Information Analysis Center, http://cdiac.esd.ornl.gov/ftp/ndp030/global96.ems.
First Things First - Development and Global Warming
15
reduction on the order of ten times or more the level of emission cuts agreed to at Kyoto (alittle under eight per cent of 1990 emissions by developed countries only).
Suppose we assume continuation of the past trend toward declining carbon-intensity ofproduction and relatively stable per-capita emissions in the face of continuing economicgrowth. Annual per capita emissions from industrial processes would thus remain at 4.1tons of CO2 (Table 1 above). If global population increases in accord with the UN ‘lowvariant’ projection,19 the global population in 2010 would be (see Table 3 above) 6.788billion and annual emissions from industrial processes would be 27.83 billion tons of CO2,which amounts to 7.6 billion tons of carbon. The annual emission reductions required in2010 to stabilize the atmospheric concentration of CO2 would then be about 5 billion tonsof carbon.
Our own forecasts of emissions presented above can be used to derive an alternativeestimate of annual emissions in 2010. The increased per capita emissions in China, India,Indonesia and Brazil as calculated in Table 5 imply that these four countries would produce2.0 billion tons of carbon annually in 2010. Suppose we continue to assume that per capitaemissions elsewhere in the world remain constant at their 1992 level of 6.07 tons of CO2
(calculated from Table 1 above). Total emissions from the rest of the world in 2010 wouldthen be 23.57 billion tons of CO2, which amounts to 6.4 billion tons of carbon. Theannual world total would then be 8.4 rather than 7.6 billion tons of carbon. The annualemission reductions required in 2010 to stabilize the atmospheric concentration of CO2
would then be about 5.8 billion tons of carbon.
The cost per ton of reducing emissions has been estimated in many papers. A recent paper(October, 1998) by the Energy Information Administration (EIA, US Department ofEnergy) summarized the costs of meeting the Kyoto controls for the United States that havebeen calculated using a number of models. Specifically, the EIA examined results obtainedfrom a number of general equilibrium models of the US economy. Each of the models wasused to predict the effects of reductions in emissions to 7% below 1990 levels “without thebenefit of sinks, offsets, international carbon permit trading, or the Clean DevelopmentMechanism”. The projected price in 2010 measured in $US1996 per metric ton of carbonranged from $221 on the low side to $265, $266, $280 and $295 in the middle with theEIA’s own estimate being the highest at $348. The agency researchers noted a number offeatures of the models that explained these differences. These essentially amounted to
18 Tucker (1998), available at http://www.arts.monash.edu.au/ausapec/imppaps.htm. The implicit
assumption is that some emissions are re-absorbed through natural processes – particularly by the oceans
and in increased vegetation growth – so that emissions do not need to be cut 100% to prevent an increase in
ambient concentration levels.
19 United Nations Press Release POP/684, October 27, 1998.
First Things First - Development and Global Warming
16
different judgements about the most likely values for various parameters that cannot beestimated accurately.
Table 6: Projected price of emissions per metric ton of carbon in 2010 in $US1992
Independentabatement
Full trading inAnnex B
Double bubble
United States 346 114 108
Canada 835 114 108
Japan 693 114 108
Australia 455 114 108
New Zealand 396 114 108
European Union 714 114 176
Former Soviet Union 0 114 108
Eastern Europe 40 114 176
Source: Tulpulé et. al. 1998b, Table 6, p15. The ‘double bubble’ involves emissions trading within
Europe on the one hand and the rest of the developed world on the other hand.
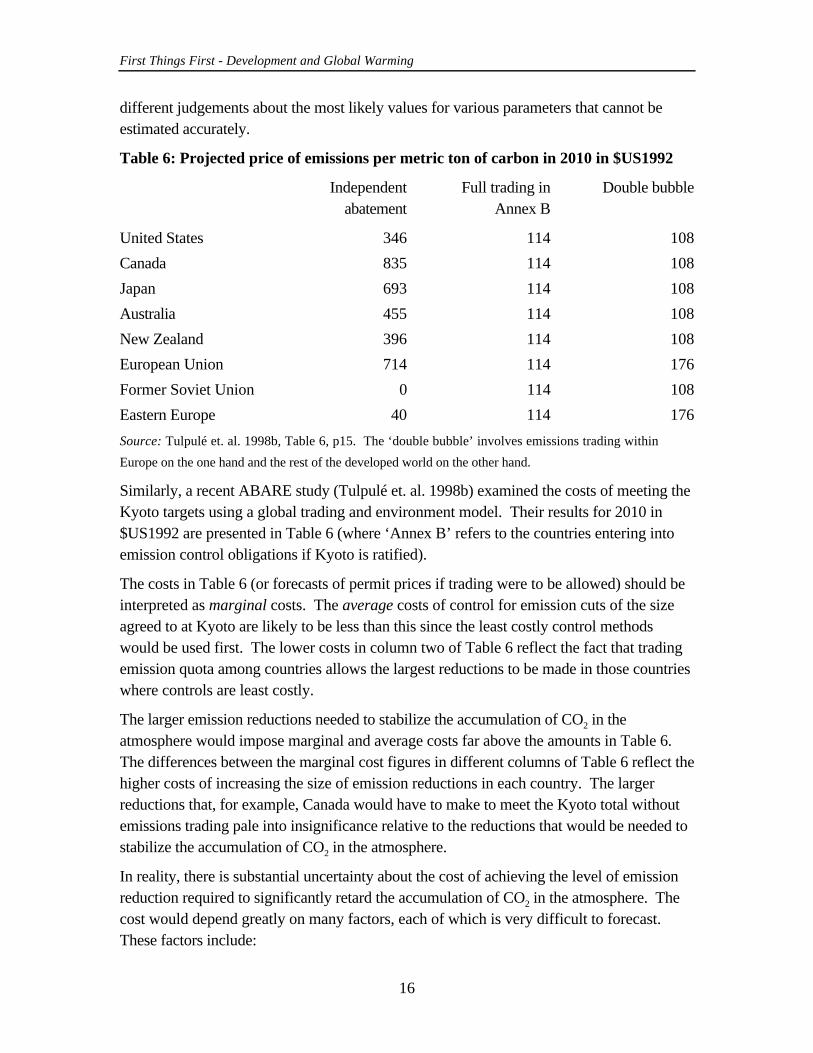
Similarly, a recent ABARE study (Tulpulé et. al. 1998b) examined the costs of meeting theKyoto targets using a global trading and environment model. Their results for 2010 in$US1992 are presented in Table 6 (where ‘Annex B’ refers to the countries entering intoemission control obligations if Kyoto is ratified).
The costs in Table 6 (or forecasts of permit prices if trading were to be allowed) should beinterpreted as marginal costs. The average costs of control for emission cuts of the sizeagreed to at Kyoto are likely to be less than this since the least costly control methodswould be used first. The lower costs in column two of Table 6 reflect the fact that tradingemission quota among countries allows the largest reductions to be made in those countrieswhere controls are least costly.
The larger emission reductions needed to stabilize the accumulation of CO2 in theatmosphere would impose marginal and average costs far above the amounts in Table 6.The differences between the marginal cost figures in different columns of Table 6 reflect thehigher costs of increasing the size of emission reductions in each country. The largerreductions that, for example, Canada would have to make to meet the Kyoto total withoutemissions trading pale into insignificance relative to the reductions that would be needed tostabilize the accumulation of CO2 in the atmosphere.
In reality, there is substantial uncertainty about the cost of achieving the level of emissionreduction required to significantly retard the accumulation of CO2 in the atmosphere. Thecost would depend greatly on many factors, each of which is very difficult to forecast.These factors include:
First Things First - Development and Global Warming
17
• the link between emissions and CO2 accumulation, and hence the size of the reduction;
• future population and economic growth;
• the nature of the control regime, including the possibilities for trading quota;
• incentives the regime generates for the development and adoption of new technologies;
• technological developments that are independent of the control regime;
• elasticities of substitution between energy and other inputs; and
• changes in the mix of industries and the location and age of industrial plant.
Suppose we take $US150 per metric ton of carbon (1996 prices) as an extremelyconservative estimate of the average cost in 2010 of emission reductions needed tosignificantly retard the accumulation of CO2 in the atmosphere. The annual cost ofreductions needed in 2010 to stabilize greenhouse concentrations, therefore, would be atleast $US750 billion under the assumption of constant world per capita emissions, andclose to $US875 billion under the alternative estimates of emissions growth in Table 5.This is more than 2.5% of current world GDP (Table 4), and is of the same order ofmagnitude as the current GDP of China or Brazil, and more than the combined GDP ofIndia and Indonesia.
The Kyoto agreement calls for emissions to be reduced by 2010 by an amount that isapproximately one tenth of the above magnitude below 1990 emissions. The cuts under theKyoto agreement therefore include any increase that otherwise would have occurred.Suppose we assume these lesser emission reductions involve a lower average cost of$US100 per metric ton of carbon (1996 prices). The reductions called for at Kyoto wouldstill involve at least $US50 billion worth of cost, or maybe 0.2% of world GDP in 2010.And what would we be buying for that cost? Calculations using the same models thatpredict global warming suggest that full implementation of the Kyoto Protocol will decreaseaverage world temperatures by about 0.07oC20 to 0.2oC21 – a difference so small that itcould not be reliably detected by ground-based thermometers.22
The magnitude of these costs ought to be enough to make one skeptical that effectivecontrols will be implemented. To even contemplate costs of such magnitude one wouldhave to be very confident that significant global warming is occurring and that it will behighly damaging.
20 Wigley, (1998), quoted in Michaels (1998).
21 Davis and Legates (June 1998).
22 Michaels (1998), Davis and Legates (June 1998).
First Things First - Development and Global Warming
18
One would also need to be convinced that action is urgent. As we noted above, unlikemost other types of air pollution, the flow of emissions is not the problem. Rather, thepotential problem arises only from the long-term accumulation of CO2 in the atmosphere.Reduced emissions in the future are a substitute for reduced emissions today, and theearlier the implementation of controls, the higher the costs. If controls are imposed soonerrather than later, technology will be less advanced, the life of more capital equipment willbe prematurely shortened, and fewer resources will be available to compensate for thelosses (given the continuing tendency of wealth to increase over time).
The case for urgent action requires a careful consideration of the likely costs and benefits.To date, policy has been largely driven by the science with economic considerations givenshort shrift. Yet there is not even a consensus in the scientific community that globalwarming ought to be an urgent national or global concern – as the 1992 WashingtonStatement, the 1996 Leipzig Declaration and the 1998 Oregon Petition by concernedscientists indicate (see Appendices II to IV).
There is also no precedent for countries agreeing to incur costs of such magnitude, let alonefor actually following through with the implementation. To be sure, governments regularlyimpose costs on their society of one form or another. But that is for purposes such asbuying off interest groups, retaining political power or implementing deeply held beliefs.Global warming falls into none of these categories.
Polling in the US, for example, indicates that global warming is a declining concern –according to CNN/Gallup polling, in 1989 about 35% of Americans worried ‘a great deal’about global warming, but in 1997 only 24% did.23 (Given the fall in semi-official andofficial projections for warming from 1988 to 1995 such declining concern can hardly becharacterized as irrational.) As for other reasons for socially destructive government effort– gaining support from interest groups and retaining power – serious attempts to devotemajor extra resources, particularly by developing countries, to cut greenhouse emissionsare likely to conflict strongly with both these goals.
National Priorities
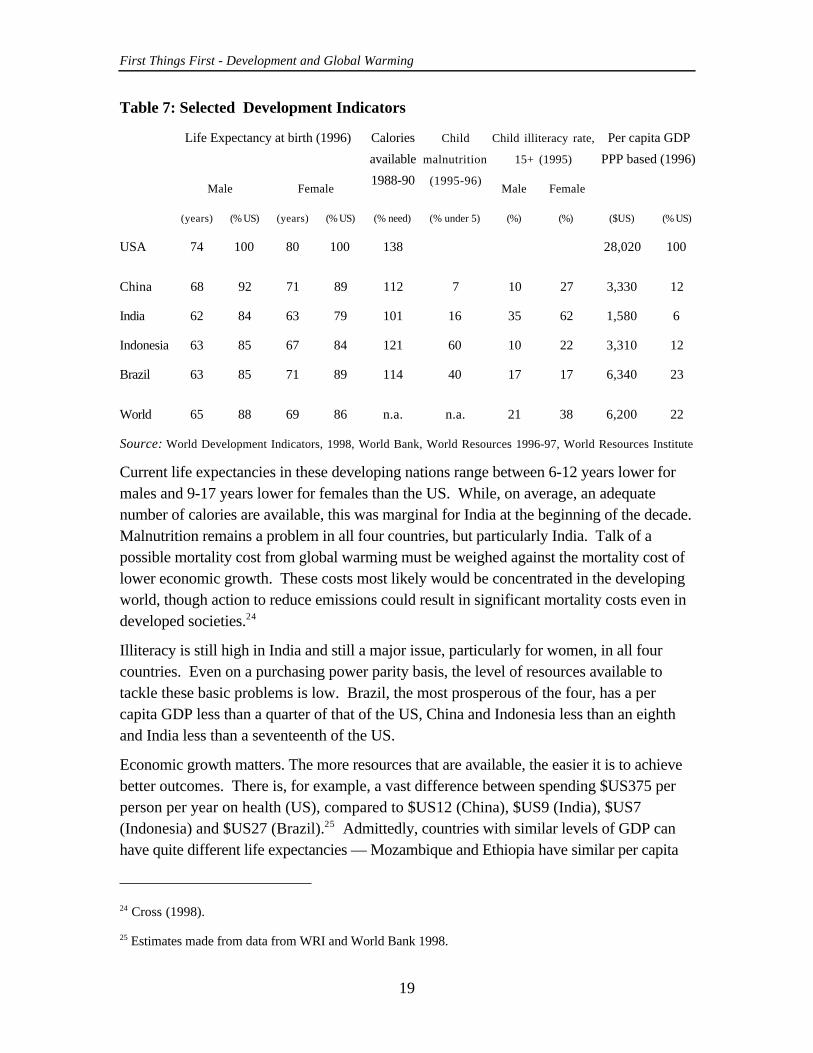
What are the ongoing national priorities for the four most populous non-Annex I nations(China, India, Indonesia and Brazil) with over 40% of the world’s population (Table 4)?Table 7 sets out some selected development indicators for those four nations, with theequivalent figures for the United States for comparison.
23 http://www.cnn.com/SPECIALS/1997/global.warming/hot.air/
First Things First - Development and Global Warming
19
Table 7: Selected Development Indicators
Life Expectancy at birth (1996) Child illiteracy rate,
15+ (1995)
Male Female
Calories
available
1988-90
Child
malnutrition
(1995-96)Male Female
Per capita GDP
PPP based (1996)
(years) (% US) (years) (% US) (% need) (% under 5) (%) (%) ($US) (% US)
USA 74 100 80 100 138 28,020 100
China 68 92 71 89 112 7 10 27 3,330 12
India 62 84 63 79 101 16 35 62 1,580 6
Indonesia 63 85 67 84 121 60 10 22 3,310 12
Brazil 63 85 71 89 114 40 17 17 6,340 23
World 65 88 69 86 n.a. n.a. 21 38 6,200 22
Source: World Development Indicators, 1998, World Bank, World Resources 1996-97, World Resources Institute
Current life expectancies in these developing nations range between 6-12 years lower formales and 9-17 years lower for females than the US. While, on average, an adequatenumber of calories are available, this was marginal for India at the beginning of the decade.Malnutrition remains a problem in all four countries, but particularly India. Talk of apossible mortality cost from global warming must be weighed against the mortality cost oflower economic growth. These costs most likely would be concentrated in the developingworld, though action to reduce emissions could result in significant mortality costs even indeveloped societies.24
Illiteracy is still high in India and still a major issue, particularly for women, in all fourcountries. Even on a purchasing power parity basis, the level of resources available totackle these basic problems is low. Brazil, the most prosperous of the four, has a percapita GDP less than a quarter of that of the US, China and Indonesia less than an eighthand India less than a seventeenth of the US.
Economic growth matters. The more resources that are available, the easier it is to achievebetter outcomes. There is, for example, a vast difference between spending $US375 perperson per year on health (US), compared to $US12 (China), $US9 (India), $US7(Indonesia) and $US27 (Brazil).25 Admittedly, countries with similar levels of GDP canhave quite different life expectancies — Mozambique and Ethiopia have similar per capita
24 Cross (1998).
25 Estimates made from data from WRI and World Bank 1998.
First Things First - Development and Global Warming
20
GDP (the two lowest recorded by the World Bank), yet their average life expectancies arevery different (44 years for Mozambique, 67 for Ethiopia).26 Nevertheless, life expectancyis positively correlated to per capita GDP.27
Development, in its broadest sense, has to be a priority for countries such as China, India,Indonesia and Brazil. Policies that impede economic growth generally can be expected toaffect more than material standards of living. Benefits need to be commensurate with thesacrifice made.
While developing countries no doubt fear lost economic development as the major cost ofclimate change policy, it is not the only potential cost. Within the realm of environmentalpolicy, other issues – including environmental problems that are blighting lives and killingpeople here and now – loom much larger than the future potential costs of even the latestIPCC projected level of global warming.
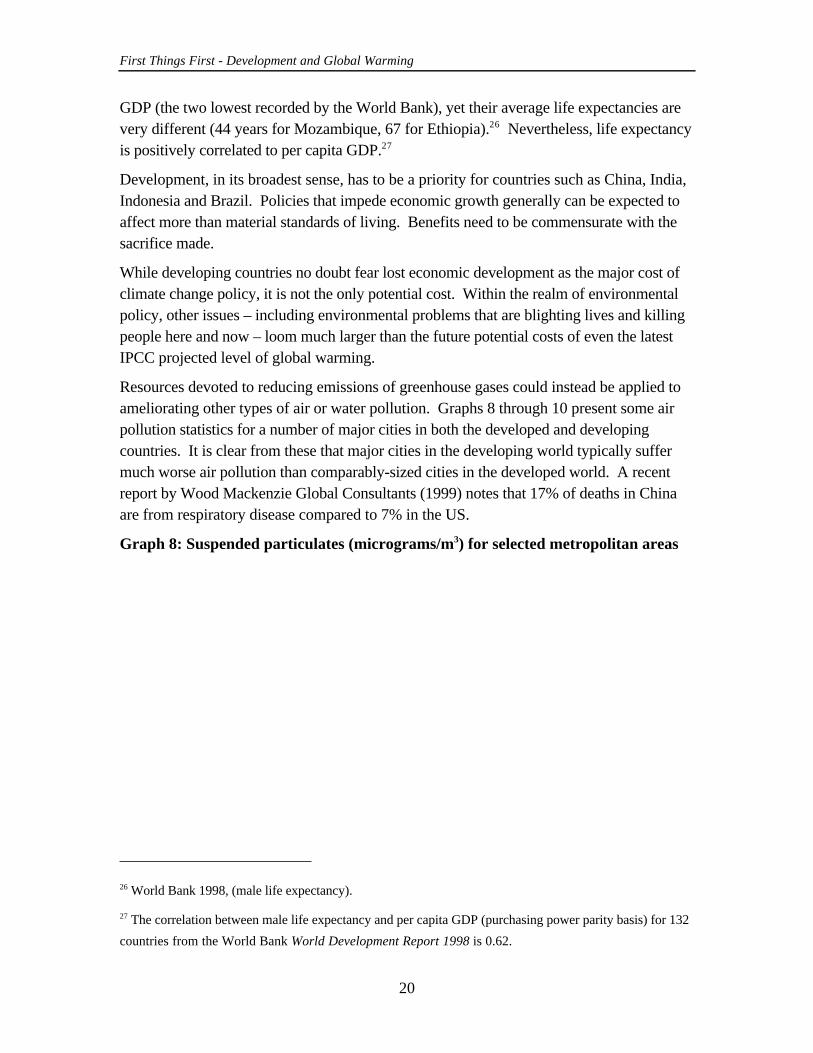
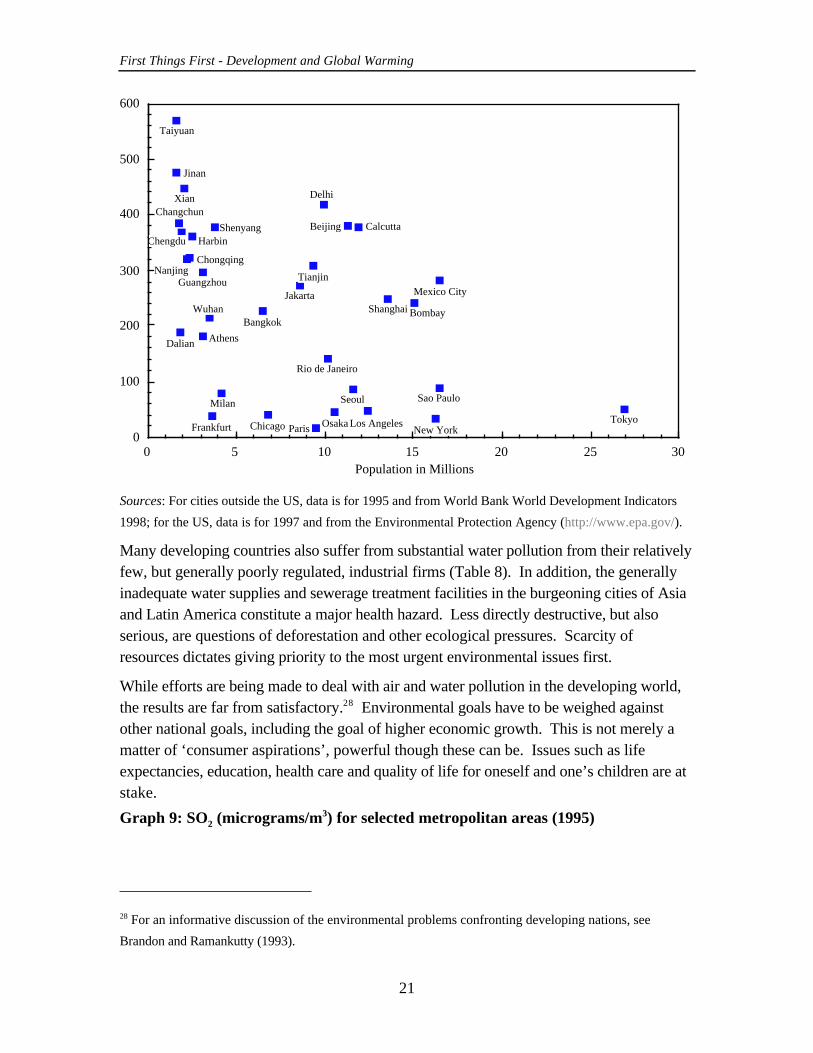
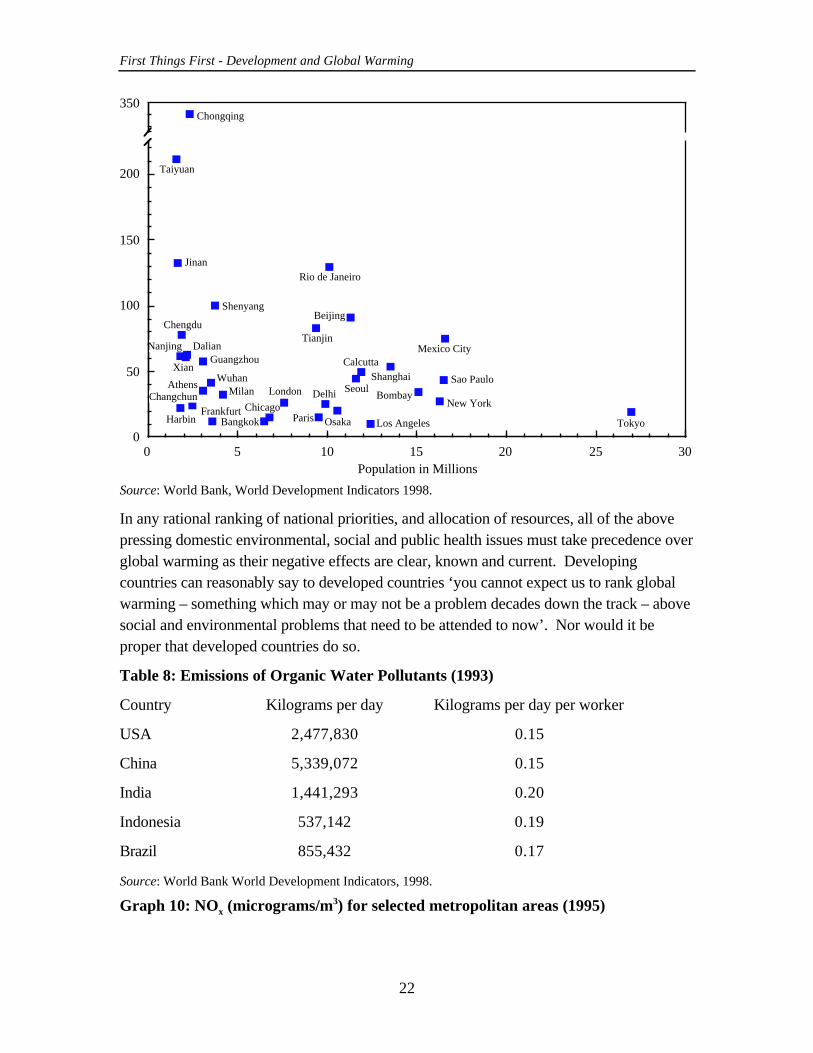
Resources devoted to reducing emissions of greenhouse gases could instead be applied toameliorating other types of air or water pollution. Graphs 8 through 10 present some airpollution statistics for a number of major cities in both the developed and developingcountries. It is clear from these that major cities in the developing world typically suffermuch worse air pollution than comparably-sized cities in the developed world. A recentreport by Wood Mackenzie Global Consultants (1999) notes that 17% of deaths in Chinaare from respiratory disease compared to 7% in the US.
Graph 8: Suspended particulates (micrograms/m3) for selected metropolitan areas
26 World Bank 1998, (male life expectancy).
27 The correlation between male life expectancy and per capita GDP (purchasing power parity basis) for 132
countries from the World Bank World Development Report 1998 is 0.62.
First Things First - Development and Global Warming
21
Sources: For cities outside the US, data is for 1995 and from World Bank World Development Indicators
1998; for the US, data is for 1997 and from the Environmental Protection Agency (http://www.epa.gov/).
Many developing countries also suffer from substantial water pollution from their relativelyfew, but generally poorly regulated, industrial firms (Table 8). In addition, the generallyinadequate water supplies and sewerage treatment facilities in the burgeoning cities of Asiaand Latin America constitute a major health hazard. Less directly destructive, but alsoserious, are questions of deforestation and other ecological pressures. Scarcity ofresources dictates giving priority to the most urgent environmental issues first.
While efforts are being made to deal with air and water pollution in the developing world,the results are far from satisfactory.28 Environmental goals have to be weighed againstother national goals, including the goal of higher economic growth. This is not merely amatter of ‘consumer aspirations’, powerful though these can be. Issues such as lifeexpectancies, education, health care and quality of life for oneself and one’s children are atstake.
Graph 9: SO2 (micrograms/m3) for selected metropolitan areas (1995)
28 For an informative discussion of the environmental problems confronting developing nations, see
Brandon and Ramankutty (1993).
B
B
B
B
B
B
B
BB
B
B
B
B
B
B
B
B
B
B
B
B
B
B
BB
B
B
B
B
B
BB
B
0
100
200
300
400
500
600
0 5 10 15 20 25 30Population in Millions
Shanghai
Beijing
Tianjin
Shenyang
Wuhan
Guangzhou
Harbin
ChongqingNanjing
Xian
Chengdu
Dalian
Changchun
Jinan
Taiyuan
Bombay
Calcutta
Delhi
Jakarta
Sao Paulo
Rio de Janeiro
Mexico City
Bangkok
New YorkLos AngelesChicago ParisFrankfurt
Milan
Athens
TokyoOsaka
Seoul
First Things First - Development and Global Warming
22
Source: World Bank, World Development Indicators 1998.
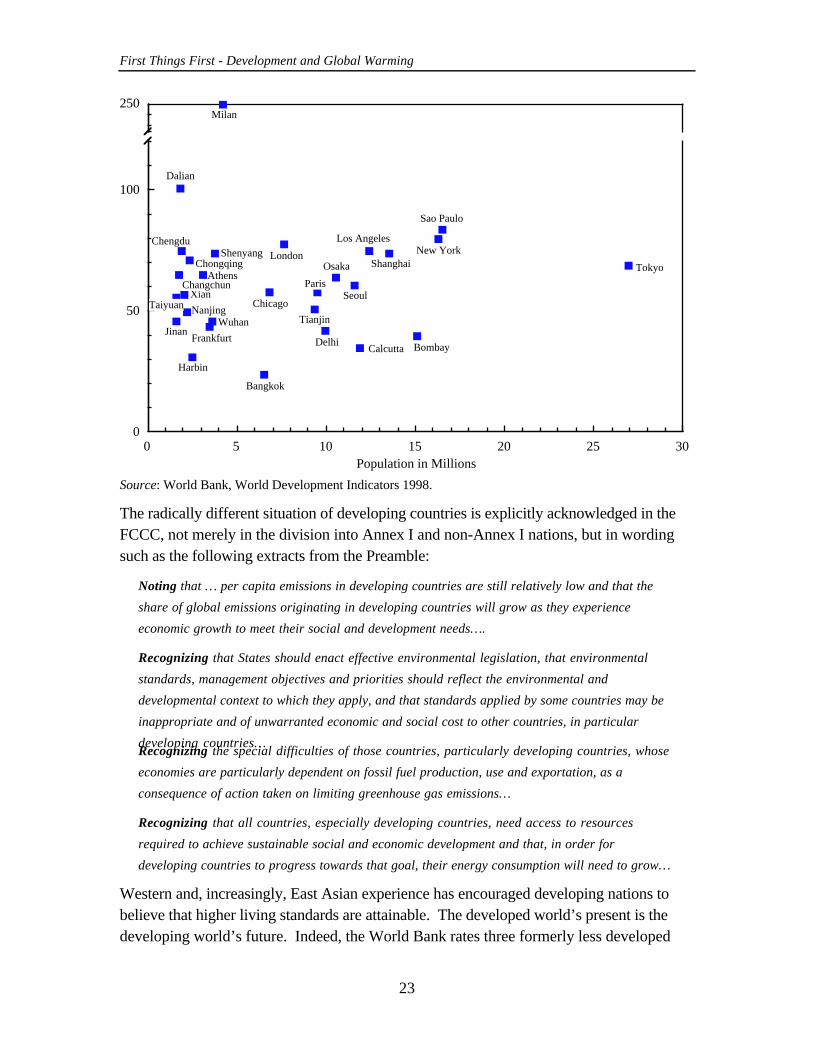
In any rational ranking of national priorities, and allocation of resources, all of the abovepressing domestic environmental, social and public health issues must take precedence overglobal warming as their negative effects are clear, known and current. Developingcountries can reasonably say to developed countries ‘you cannot expect us to rank globalwarming – something which may or may not be a problem decades down the track – abovesocial and environmental problems that need to be attended to now’. Nor would it beproper that developed countries do so.
Table 8: Emissions of Organic Water Pollutants (1993)
Country Kilograms per day Kilograms per day per worker
USA 2,477,830 0.15
China 5,339,072 0.15
India 1,441,293 0.20
Indonesia 537,142 0.19
Brazil 855,432 0.17
Source: World Bank World Development Indicators, 1998.
Graph 10: NOx (micrograms/m3) for selected metropolitan areas (1995)
B
B
B
B
B
B
B
BB
B
B
B
B
B
B
B
B
B
B
B
B
B
BB
B
BB
BB
BB
B
B
0
50
100
150
200
350
0 5 10 15 20 25 30Population in Millions
Shanghai
Beijing
Tianjin
Shenyang
Wuhan
Guangzhou
Harbin
Nanjing
Xian
Chengdu
Dalian
Changchun
Jinan
Taiyuan
Bombay
Calcutta
DelhiSao Paulo
Rio de Janeiro
Mexico City
Bangkok
New York
Los Angeles
Chicago
London
ParisFrankfurt
MilanAthens
TokyoOsaka
Seoul
Chongqing
First Things First - Development and Global Warming
23
Source: World Bank, World Development Indicators 1998.
The radically different situation of developing countries is explicitly acknowledged in theFCCC, not merely in the division into Annex I and non-Annex I nations, but in wordingsuch as the following extracts from the Preamble:
Noting that … per capita emissions in developing countries are still relatively low and that the
share of global emissions originating in developing countries will grow as they experience
economic growth to meet their social and development needs….
Recognizing that States should enact effective environmental legislation, that environmental
standards, management objectives and priorities should reflect the environmental and
developmental context to which they apply, and that standards applied by some countries may be
inappropriate and of unwarranted economic and social cost to other countries, in particular
developing countries…Recognizing the special difficulties of those countries, particularly developing countries, whose
economies are particularly dependent on fossil fuel production, use and exportation, as a
consequence of action taken on limiting greenhouse gas emissions…
Recognizing that all countries, especially developing countries, need access to resources
required to achieve sustainable social and economic development and that, in order for
developing countries to progress towards that goal, their energy consumption will need to grow…
Western and, increasingly, East Asian experience has encouraged developing nations tobelieve that higher living standards are attainable. The developed world’s present is thedeveloping world’s future. Indeed, the World Bank rates three formerly less developed
B
B
B
B
B
B
B
B
B
B
B
B
B
B
B
B
B
B
B
B
B
B
B
B
BB
BB
B
0
50
100
250
0 5 10 15 20 25 30Population in Millions
Shanghai
Tianjin
Shenyang
Wuhan
Harbin
Chongqing
Nanjing
Xian
Chengdu
Dalian
Changchun
Jinan
Taiyuan
BombayCalcuttaDelhi
Sao Paulo
Bangkok
New YorkLos Angeles
Chicago
London
Paris
Frankfurt
AthensTokyoOsaka
Seoul
Milan
First Things First - Development and Global Warming
24
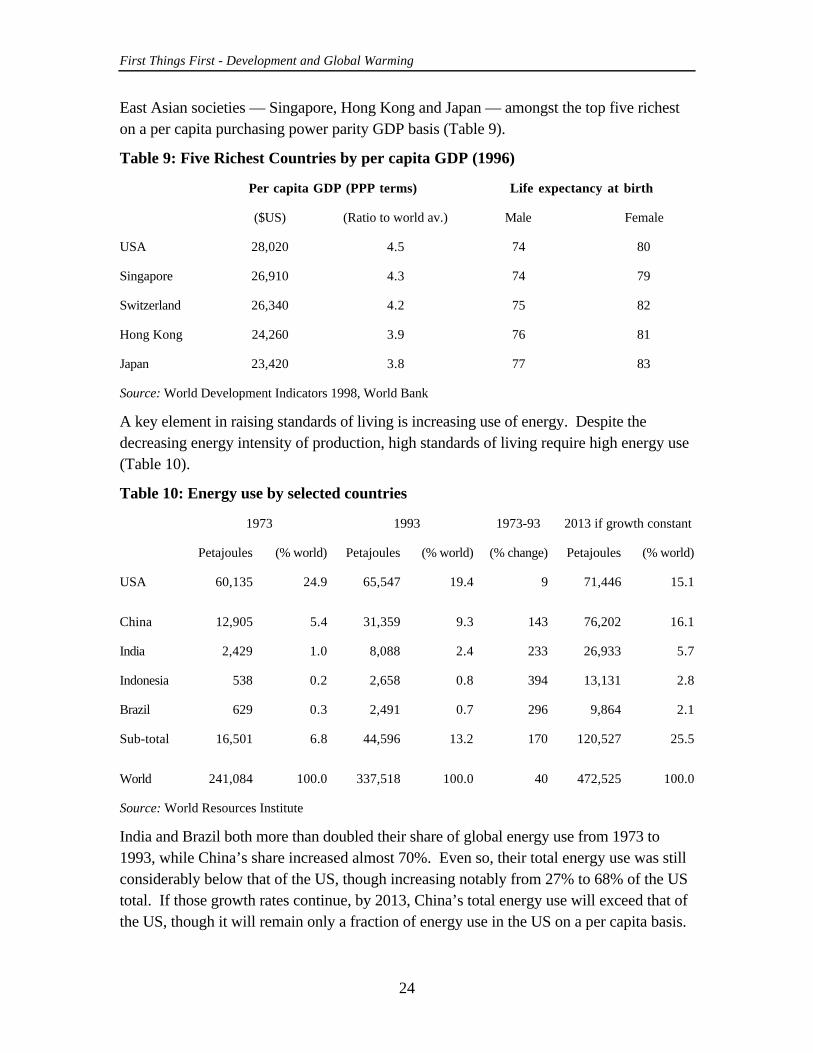
East Asian societies — Singapore, Hong Kong and Japan — amongst the top five richeston a per capita purchasing power parity GDP basis (Table 9).
Table 9: Five Richest Countries by per capita GDP (1996)
Per capita GDP (PPP terms) Life expectancy at birth
($US) (Ratio to world av.) Male Female
USA 28,020 4.5 74 80
Singapore 26,910 4.3 74 79
Switzerland 26,340 4.2 75 82
Hong Kong 24,260 3.9 76 81
Japan 23,420 3.8 77 83
Source: World Development Indicators 1998, World Bank
A key element in raising standards of living is increasing use of energy. Despite thedecreasing energy intensity of production, high standards of living require high energy use(Table 10).
Table 10: Energy use by selected countries
1973 1993 1973-93 2013 if growth constant
Petajoules (% world) Petajoules (% world) (% change) Petajoules (% world)
USA 60,135 24.9 65,547 19.4 9 71,446 15.1
China 12,905 5.4 31,359 9.3 143 76,202 16.1
India 2,429 1.0 8,088 2.4 233 26,933 5.7
Indonesia 538 0.2 2,658 0.8 394 13,131 2.8
Brazil 629 0.3 2,491 0.7 296 9,864 2.1
Sub-total 16,501 6.8 44,596 13.2 170 120,527 25.5
World 241,084 100.0 337,518 100.0 40 472,525 100.0
Source: World Resources Institute
India and Brazil both more than doubled their share of global energy use from 1973 to1993, while China’s share increased almost 70%. Even so, their total energy use was stillconsiderably below that of the US, though increasing notably from 27% to 68% of the UStotal. If those growth rates continue, by 2013, China’s total energy use will exceed that ofthe US, though it will remain only a fraction of energy use in the US on a per capita basis.
First Things First - Development and Global Warming
25
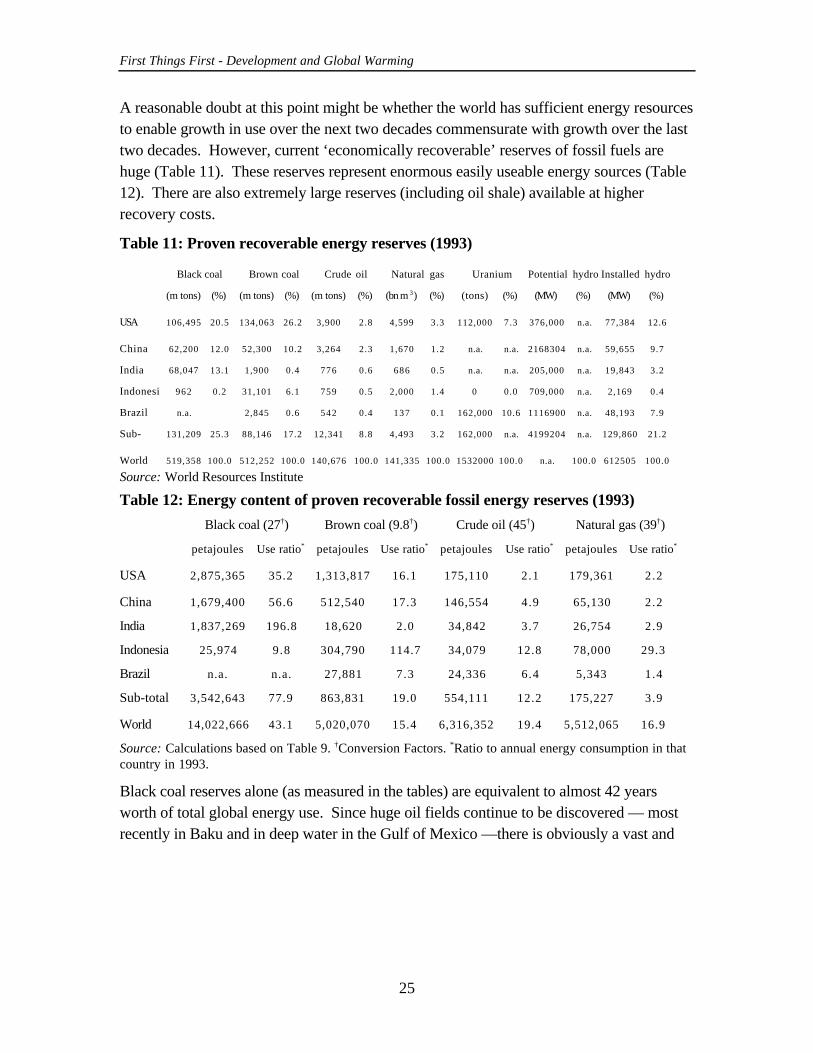
A reasonable doubt at this point might be whether the world has sufficient energy resourcesto enable growth in use over the next two decades commensurate with growth over the lasttwo decades. However, current ‘economically recoverable’ reserves of fossil fuels arehuge (Table 11). These reserves represent enormous easily useable energy sources (Table12). There are also extremely large reserves (including oil shale) available at higherrecovery costs.
Table 11: Proven recoverable energy reserves (1993)
Black coal Brown coal Crude oil Natural gas Uranium Potential hydro Installed hydro
(m tons) (%) (m tons) (%) (m tons) (%) (bn m 3) (%) (tons) (%) (MW) (%) (MW) (%)
USA 106,495 20.5 134,063 26.2 3,900 2.8 4,599 3.3 112,000 7.3 376,000 n.a. 77,384 12.6
China 62,200 12.0 52,300 10.2 3,264 2.3 1,670 1.2 n.a. n.a. 2168304 n.a. 59,655 9.7
India 68,047 13.1 1,900 0.4 776 0.6 686 0.5 n.a. n.a. 205,000 n.a. 19,843 3.2
Indonesi 962 0.2 31,101 6.1 759 0.5 2,000 1.4 0 0.0 709,000 n.a. 2,169 0.4
Brazil n.a. 2,845 0.6 542 0.4 137 0.1 162,000 10.6 1116900 n.a. 48,193 7.9
Sub- 131,209 25.3 88,146 17.2 12,341 8.8 4,493 3.2 162,000 n.a. 4199204 n.a. 129,860 21.2
World 519,358 100.0 512,252 100.0 140,676 100.0 141,335 100.0 1532000 100.0 n.a. 100.0 612505 100.0
Source: World Resources Institute
Table 12: Energy content of proven recoverable fossil energy reserves (1993)
Black coal (27†) Brown coal (9.8†) Crude oil (45†) Natural gas (39†)
petajoules Use ratio* petajoules Use ratio* petajoules Use ratio* petajoules Use ratio*
USA 2,875,365 35.2 1,313,817 16.1 175,110 2.1 179,361 2.2
China 1,679,400 56.6 512,540 17.3 146,554 4.9 65,130 2.2
India 1,837,269 196.8 18,620 2.0 34,842 3.7 26,754 2.9
Indonesia 25,974 9.8 304,790 114.7 34,079 12.8 78,000 29.3
Brazil n.a. n.a. 27,881 7.3 24,336 6.4 5,343 1.4
Sub-total 3,542,643 77.9 863,831 19.0 554,111 12.2 175,227 3.9
World 14,022,666 43.1 5,020,070 15.4 6,316,352 19.4 5,512,065 16.9
Source: Calculations based on Table 9. †Conversion Factors. *Ratio to annual energy consumption in thatcountry in 1993.
Black coal reserves alone (as measured in the tables) are equivalent to almost 42 yearsworth of total global energy use. Since huge oil fields continue to be discovered — mostrecently in Baku and in deep water in the Gulf of Mexico —there is obviously a vast and
First Things First - Development and Global Warming
26
continuing potential for fossil fuels to provide energy for economic development. Theseresources will be used until cheaper forms of energy abound.29
Technological progress in solar cell, fuel cell, nuclear and perhaps other, as yet unknown,technologies is likely to result in fossil fuels being replaced in most energy uses sometimein the next century. While the prospect over the next three decades may be for increasedCO2 emissions from the burning of fossil fuels, there is also a reasonable expectation thatemissions could decline dramatically in the latter half of the next century. Until then,developing countries in Asia and elsewhere will not explicitly forgo the aspirations ofdevelopment by limiting their use of, or increasing the domestic cost of, fossil fuel energysources.
Indeed, developing countries have a positive incentive not to participate in any seriousgreenhouse gas control regime. They can seek to benefit from the relocation of carbon-intensive industries as developed countries raise the cost of such activities. The US Senateis certainly alive to the possibility of a transfer of industries, as the recent ‘Byrd-Hagel’resolution passed 97-0 by the US Senate indicates (Appendix V).
‘Carbon leakage’ — the transfer of carbon-emissions by displacement of industries fromcountries undertaking serious abatement action to those not undertaking such action — isnot a mere theoretical possibility. The first ‘Oil Shock’, which greatly increased the priceof electricity in Japan, resulted in the transfer of aluminum smelting from Japan toAustralia.30 Even an industry as reliant on investment in immobile capital as aluminumsmelting proved to be mobile in a relatively short time period given a sufficientlyunfavorable shift in energy prices. Similarly, the implementation of the Montreal Protocolon Substances that Deplete the Ozone Layer has seen CFC production fall in developedcountries by over 80% but rise in developing countries by about 130% (though globalproduction overall has fallen near 70%).31 Economic models have produced estimates of‘carbon leakage’ ranging from 0 to 70% (ABARE estimates are in the range of 6 to 18%depending on whether emission trading occurs).32
29 Recent world prices for oil – in real terms considerably below those after the 1973 ‘Oil Shock’ – suggest
falling scarcity, relative to demand, of fossil fuels. At about $US12, or even $US20 a barrel, oil prices
contrast markedly with projections – made during the previous energy hysteria of the ‘Energy Crisis’ of
1973-74 – that oil would reach prices of $US100 a barrel – more if we adjust for inflation – by the end of
the century (Mills 1998).
30 Presentation by Dr Vivek Tulpulé, Royal Society of Victoria Symposium, 21 October 1997.
31 Lieberman (1998), available at http://www.cei.org/gw.html#CEI "Costs of Kyoto" Lectures.
32 Tulpulé, et al (1998b).
First Things First - Development and Global Warming
27
Refusing to participate in a global greenhouse gas control regime therefore has a doublebenefit to developing countries. They do not bear the costs of cutting their ownanthropogenic greenhouse gas emissions, and they can increase their own rate of economicdevelopment by the transfer of manufacturing from countries participating in thegreenhouse gas control regime. (They may nevertheless oppose the policy since theywould expect to suffer negative trade effects from reduced economic activity in thedeveloped world.)
Any effective global greenhouse gas regime must confront the very powerful reasonsdeveloping countries have for not expending significant amounts of their own resources insuch an effort. Mere preaching from the developed world — responsible, according tomost estimates, for about 80% of the human contribution to current greenhouse gasconcentrations — will not change this, as has been eloquently expressed in another context:
Social forces have been set in motion that will not be contained … Electricity, telephones, running
water — once humans experience these things, they want more of them … It is easy for outsiders to
warn against the long-term costs of damming Africa’s rivers, ruining its scenery, or destroying its
woodlands, but it is akin to a glutton admonishing a beggar on the evils of carbohydrates — he
lacks a certain moral authority.33
Leaders of developing countries can hardly be expected to be more willing than the USSenate to countenance significant costs for the people they govern. It is unreasonable toexpect the citizens of developing countries to accept a policy that permanently relegatesthem to the status of ‘second class global citizens’ by denying them the chance to achievedeveloped world income levels.
Some in Asia might see in climate change policy echoes of the history of the early twentiethcentury. Prior to the Pacific War, Japan saw Western disapproval of its policy in China asa hypocritical attempt by powers already possessing empires to deny Japan the sameprivilege. Developing countries today similarly are likely – with some justice – to seeenvironmentalism as an excuse by already-developed nations to deny the developingworld’s aspirations to the same status. It is surely hard to see such aspirations as otherthan entirely legitimate. As a matter of practical politics, they will not be explicitly deniedsince no regime is likely to long survive disavowal of them. Whether they will be satisfiedis another matter, but no government is going to have their denial as explicit policy.
33 Mark Hertsgaard, Earth Odyssey quoted in the Australian Financial Review, January 22 1999, Review
6.
First Things First - Development and Global Warming
28
Conclusion
There are so many layers of rational skepticism about climate change policy. Eminentscientist Sir Fred Hoyle has expressed the most basic level of skepticism eloquently (Kstands for degrees Kelvin: degrees above absolute zero):
Given the choice, I imagine nobody would opt for a world without any greenhouse, that is a world
with a mean temperature of about 259K. And probably few would opt for an ice-age world with a
mean temperature of 275K to 280K. To this point, the greenhouse is seen as good. Further still, a
clear majority continues to see the greenhouse as good up to the present-day mean of about 290K.
But, at the next 1.5K a drastic change of opinion sets in: the greenhouse suddenly becomes the
sworn enemy of environmental groups, world-wide, to the extent that they rush off to Rio and
elsewhere and make a great deal of noise about it. I find it difficult to understand why. If I am told
that computer calculations show immensely deleterious consequences would ensure, then I have a
good laugh about it. In private, of course, since I am always careful to be polite in public.34
It will not be a laughing matter, however, if greenhouse theory is translated into policiesthat succeed in stabilizing greenhouse gas concentrations in the atmosphere. Such anoutcome could only be achieved through a massive and very costly reduction in current andprospective greenhouse gas emissions.
An effective regime has to include developing countries. Those countries are likely toproduce a rapidly growing share of world greenhouse gas emissions in coming decades.Furthermore, if developing countries are excluded from emission controls, many energyintensive industries will simply migrate from the developed to the developing world andpossibly increase CO2 emissions per unit of world GDP. Developing countries will notagree to control greenhouse gas emissions, however, unless the costs are low enough to beacceptable given the seriousness and urgency of the other problems such countries face.The only net cost likely to be acceptable (and result in actual action) is close to zero.
The inescapable conclusion is that effective controls over emissions will only beimplemented at enormous cost to the taxpayers of the developed countries. 35 There is a(partial) precedent for this. The 1987 Montreal Protocol on controlling emissions of CFCshas seen significant costs incurred by the US in particular. The US is the major jurisdictioneffectively enforcing the ban on ozone-depleting substances. It is also the major countrymaking compensatory contributions to assistance to developing countries to forgo use of
34 Hoyle (1996), p. 185.
35 Note that the mechanism by which any such payments and transfers might be made is not part of the
ambit of this paper. There may also be serious doubts about whether any type of compensation could lead
developing nations to forgo the burning of more fossil fuel in the coming decades.
First Things First - Development and Global Warming
29
CFCs and other chemicals to be phased out under the protocol.36 But CFCs are far lesscentral to economic processes than greenhouse gases, and the costs involved are farlower.37 Compensating the developing world, and China and India in particular, to acceptsubstantially lower rates of economic growth will require an extraordinary level of resourcetransfer – equivalent to the current GDP of major developing nations.
Perhaps the governments of Western Europe and North America are insincere in theirprofessed desire to implement energy taxes in the name of countering potential globalwarming. Maybe they are placating ‘green’ sentiment within their political support base ofvoters and activists while remaining secure in the knowledge that nothing really is going tohappen. They are merely presenting a façade policy – though a façade that would be veryexpensive if the unfortunate occurs and the Kyoto protocol really is implemented.38
The proposed policies may serve a hidden agenda. Western European governments may beattempting to protect their heavy dependence on fossil fuels as a tax base. Without higherenergy taxes elsewhere (particularly the US), competition from countries with lower energycosts might eventually force the Europeans to reduce their own taxes on energy use.
Alternatively, the attempt to control greenhouse gas emissions, though sincere, will simplyfail. It will be subverted by the aspirations of the developing world to turn the developedworld’s present into their own future. Such an outcome might represent a gain to thedeveloping world at the expense of the developed world. There may also be a net lossoverall, however, since economic growth in the developing world relies largely on accessto the markets of the developed world.
The threat of global warming elicits a primitive fear in many people – a fear not based onsound scientific evidence. The cost of assuaging this fear will be high, and the developedworld will pay the price through increased taxes, lower productivity and a reduced standardof living.
36 Lieberman (1998).
37 CFCs are also, incidentally, manufactured at far fewer places and are far easier to detect than CO2 and
therefore are much easier to include in a formal treaty or protocol aimed at controlling emissions.
38 That implementation dates have been set outside the likely term of office of incumbents signing the
Kyoto Protocol is suggestive of an element of façade building.
First Things First - Development and Global Warming
30
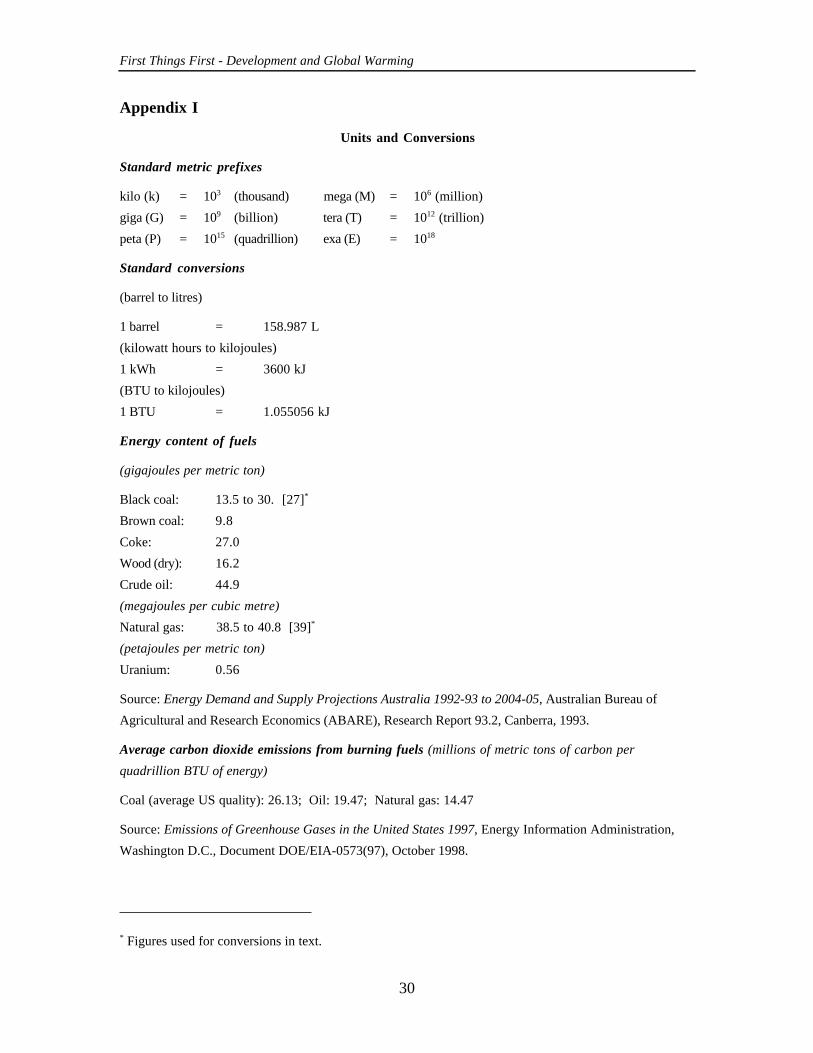
Appendix I
Units and Conversions
Standard metric prefixes
kilo (k) = 103 (thousand) mega (M) = 106 (million)
giga (G) = 109 (billion) tera (T) = 1012 (trillion)
peta (P) = 1015 (quadrillion) exa (E) = 1018
Standard conversions
(barrel to litres)
1 barrel = 158.987 L
(kilowatt hours to kilojoules)
1 kWh = 3600 kJ
(BTU to kilojoules)
1 BTU = 1.055056 kJ
Energy content of fuels
(gigajoules per metric ton)
Black coal: 13.5 to 30. [27]*
Brown coal: 9.8
Coke: 27.0
Wood (dry): 16.2
Crude oil: 44.9
(megajoules per cubic metre)
Natural gas: 38.5 to 40.8 [39]*
(petajoules per metric ton)
Uranium: 0.56
Source: Energy Demand and Supply Projections Australia 1992-93 to 2004-05, Australian Bureau of
Agricultural and Research Economics (ABARE), Research Report 93.2, Canberra, 1993.
Average carbon dioxide emissions from burning fuels (millions of metric tons of carbon per
quadrillion BTU of energy)
Coal (average US quality): 26.13; Oil: 19.47; Natural gas: 14.47
Source: Emissions of Greenhouse Gases in the United States 1997, Energy Information Administration,
Washington D.C., Document DOE/EIA-0573(97), October 1998.
* Figures used for conversions in text.
First Things First - Development and Global Warming
31
Appendix II
Statement by Atmospheric Scientists on Greenhouse Warming
WASHINGTON, D.C., FEBRUARY 27, 1992 — As independent scientists, researching atmospheric and
climate problems, we are concerned by the agenda for UNCED, the United Nations Conference on
Environment and Development, being developed by environmental activist groups and certain political
leaders. This so-called Earth Summit is scheduled to convene in Brazil in June 1992 and aims to impose a
system of global environmental regulations, including onerous taxes on energy fuels, on the population of
the United States and other industrialized nations.
Such policy initiatives derive from highly uncertain scientific theories. They are based on the unsupported
assumption that catastrophic global warming follows from the burning of fossil fuels and requires
immediate action. We do not agree.
A survey of U.S. atmospheric scientists, conducted in the summer of 1991, confirms that there is no
consensus about the cause of the slight warming observed during the past century. A recently published
research paper even suggests that sunspot variability, rather than a rise in greenhouse gases, is responsible
for the global temperature increases and decreases recorded since about 1880.
Furthermore, the majority of scientific participants in the survey agreed that the theoretical climate models
used to predict a future warming cannot be relied upon and are not validated by the existing climate record.
Yet all predictions are based on such theoretical models.
Finally, agriculturalists generally agree that any increase in carbon dioxide levels from fossil fuel burning
has beneficial effects on most crops and on world food supply.
We are disturbed that activists, anxious to stop energy use and economic growth, are pushing ahead with
drastic policies without taking notice of recent changes in the underlying science. We fear that the rush to
impose global regulations will have catastrophic impacts on the world economy, on jobs, standards of
living, and health care, with the most severe consequences falling upon developing countries and the poor.
The statement was signed by 47 physicists, climatologists, meteorologists, environmental scientists and
related specialists. Their names are available at http://www.his.com/~sepp/statment.html (23 Oct. 1997)
First Things First - Development and Global Warming
32
Appendix III
The Leipzig Declaration on Global Climate Change
As scientists, we – along with our fellow citizens – are intensely interested in the possibility that human
activities may affect the global climate; indeed, land clearing and urban growth have been changing local
climates for centuries. Historically, climate has always been a factor in human affairs - with warmer
periods, such as the medieval “climate optimum,” playing an important role in economic expansion and in
the welfare of nations that depend primarily on agriculture. For these reasons we must always remain
sensitive to activities that could affect future climate.
Attention has recently been focused on the increasing emission of “greenhouse” gases into the atmosphere.
International discussions by political leaders are currently underway that could constrain energy use and
mandate reductions in carbon dioxide emissions from the burning of fossil fuels. Although we understand
the motivation to eliminate what are perceived to be the driving forces behind a potential climate change,
we believe this approach may be dangerously simplistic. Based on the evidence available to us, we cannot
subscribe to the so-called “scientific consensus” that envisages climate catastrophes and advocates hasty
actions.
As the debate unfolds, it has become increasingly clear that – contrary to conventional wisdom – there does
not exist today a general scientific consensus about the importance of greenhouse warming from rising
levels of carbon dioxide. On the contrary, most scientists now accept the fact that actual observations from
earth satellites show no climate warming whatsoever. And to match this fact, the mathematical climate
models are becoming more realistic and are forecasting temperature increases that are only 30 percent of
what was considered the “best” value just four years ago.
We consider the Global Climate Treaty concluded in Rio de Janeiro at the 1992 “Earth Summit” to be
unrealistic; its goal is stabilization of atmospheric greenhouse gases, which requires that fuel use be cut by
60-80 percent worldwide! Energy is essential for all economic growth, and fossil fuels provide today's
principal global energy source. In a world in which poverty is the greatest social pollutant, any restriction
on energy use that inhibits economic growth should be viewed with caution. For this reason, we consider
“carbon taxes” and other drastic control policies – lacking credible support from the underlying science – to
be ill-advised, premature, wrought with economic danger, and likely to be counterproductive.
This statement is based on the International Symposium on the Greenhouse Controversy, held in Leipzig,
Germany on November 9-10, 1995, under the sponsorship of the Prime Minister of the State of Saxony.
For further information, contact the Europaeische Akademie fuer Umweltfragen (fax +49-7071-72939) or
The Science and Environmental Policy Project in Fairfax, Virginia (fax +1-703-352-7535). Updated as of
July 16, 1996
The declaration was signed by 80 scientists from around the world. Their names can be found at
http://www.vision.net.au/~daly/leipzig.htm (22 October 1997)
First Things First - Development and Global Warming
33
Appendix IV
Oregon Petition
We urge the United States government to reject the global warming agreement that was written in Kyoto,
Japan, in December 1997, and any other similar proposals. The proposed limits on greenhouse gases
would harm the environment, hinder the advance of science and technology, and damage the health and
welfare of mankind.
There is no convincing scientific evidence that human release of carbon dioxide, methane, or other
greenhouse gases is causing or will, in the foreseeable future, cause catastrophic heating of the Earth's
atmosphere and disruption of the Earth's climate. Moreover, there is substantial scientific evidence that
increases in atmospheric carbon dioxide produce many beneficial effects upon the natural plant and
animal environments of the Earth.
Current list of signers is available at http://zwr.oism.org/pproject/. (These numbered over 17,000 basic
and applied scientists as at 8 April 1998.)
First Things First - Development and Global Warming
34
Appendix V
The Byrd-Hagel Resolution
U.S. Senate, June 12th 1997
105th CONGRESS 1st Session
S. RES. 98
Expressing the sense of the Senate regarding the conditions for the United States becoming a signatory to
any international agreement on greenhouse gas emissions under the United Nations Framework Convention
on Climate Change.
IN THE SENATE OF THE UNITED STATES
June 12, 1997
Mr. BYRD (for himself, Mr. HAGEL, Mr. HOLLINGS, Mr. CRAIG, Mr. INOUYE, Mr. WARNER, Mr.
FORD, Mr. THOMAS, Mr. DORGAN, Mr. HELMS, Mr. LEVIN, Mr. ROBERTS, Mr. ABRAHAM,
Mr. MCCONNELL, Mr. ASHCROFT, Mr. BROWNBACK, Mr. KEMPTHORNE, Mr. THURMOND,
Mr. BURNS, Mr. CONRAD, Mr. GLENN, Mr. ENZI, Mr. INHOFE, Mr. BOND, Mr. COVERDELL,
Mr. DEWINE, Mrs. HUTCHISON, Mr. GORTON, Mr. HATCH, Mr. BREAUX, Mr. CLELAND, Mr.
DURBIN, Mr. HUTCHINSON, Mr. JOHNSON, Ms. LANDRIEU, Ms. MIKULSKI, Mr. NICKLES, Mr.
SANTORUM, Mr. SHELBY, Mr. SMITH of Oregon, Mr. BENNETT, Mr. FAIRCLOTH, Mr. FRIST,
Mr. GRASSLEY, Mr. ALLARD, Mr. MURKOWSKI, Mr. AKAKA, Mr. COATS, Mr. COCHRAN,
Mr. DOMENICI, Mr. GRAMM, Mr. GRAMS, Mr. LOTT, Ms. MOSELEY-BRAUN, Mr. ROBB, Mr.
ROCKEFELLER, Mr. SESSIONS, Mr. SMITH of New Hampshire, Mr. SPECTER, and Mr.
STEVENS) submitted the following resolution; which was referred to the Committee on Foreign
Relations
A RESOLUTION
Expressing the sense of the Senate regarding the conditions for the United States becoming a signatory to
any international agreement on greenhouse gas emissions under the United Nations Framework Convention
on Climate Change.
Whereas the United Nations Framework Convention on Climate Change (in this resolution referred to as
the ‘Convention’), adopted in May 1992, entered into force in 1994 and is not yet fully implemented;
Whereas the Convention, intended to address climate change on a global basis, identifies the former Soviet
Union and the countries of Eastern Europe and the Organization For Economic Co-operation and
Development (OECD), including the United States, as ‘Annex I Parties’, and the remaining 129 countries,
including China, Mexico, India, Brazil, and South Korea, as ‘Developing Country Parties’;
Whereas in April 1995, the Convention’s ‘Conference of the Parties’ adopted the so-called ‘Berlin
Mandate’;
Whereas the ‘Berlin Mandate’ calls for the adoption, as soon as December 1997, in Kyoto, Japan, of a
protocol or another legal instrument that strengthens commitments to limit greenhouse gas emissions by
First Things First - Development and Global Warming
35
Annex I Parties for the post-2000 period and establishes a negotiation process called the ‘Ad Hoc Group on
the Berlin Mandate’;
Whereas the ‘Berlin Mandate’ specifically exempts all Developing Country Parties from any new
commitments in such negotiation process for the post-2000 period;
Whereas although the Convention, approved by the United States Senate, called on all signatory parties to
adopt policies and programs aimed at limiting their greenhouse gas (GHG) emissions, in July 1996 the
Undersecretary of State for Global Affairs called for the first time for ‘legally binding’ emission limitation
targets and timetables for Annex I Parties, a position reiterated by the Secretary of State in testimony before
the Committee on Foreign Relations of the Senate on January 8, 1997;
Whereas greenhouse gas emissions of Developing Country Parties are rapidly increasing and are expected to
surpass emissions of the United States and other OECD countries as early as 2015;
Whereas the Department of State has declared that it is critical for the Parties to the Convention to include
Developing Country Parties in the next steps for global action and, therefore, has proposed that
consideration of additional steps to include limitations on Developing Country Parties’ greenhouse gas
emissions would not begin until after a protocol or other legal instrument is adopted in Kyoto, Japan in
December 1997;
Whereas the exemption for Developing Country Parties is inconsistent with the need for global action on
climate change and is environmentally flawed;
Whereas the Senate strongly believes that the proposals under negotiation, because of the disparity of
treatment between Annex I Parties and Developing Countries and the level of required emission reductions,
could result in serious harm to the United States economy, including significant job loss, trade
disadvantages, increased energy and consumer costs, or any combination thereof; and
Whereas it is desirable that a bipartisan group of Senators be appointed by the Majority and Minority
Leaders of the Senate for the purpose of monitoring the status of negotiations on Global Climate Change
and reporting periodically to the Senate on those negotiations: Now, therefore, be it
Resolved, That it is the sense of the Senate that —
(1) the United States should not be a signatory to any protocol to, or other agreement regarding, the
United Nations Framework Convention on Climate Change of 1992, at negotiations in Kyoto in
December 1997, or thereafter, which would —
(A) mandate new commitments to limit or reduce greenhouse gas emissions for the Annex I Parties, unless
the protocol or other agreement also mandates new specific scheduled commitments to limit or reduce
greenhouse gas emissions for Developing Country Parties within the same compliance period, or
(B) would result in serious harm to the economy of the United States; and
(C) any such protocol or other agreement which would require the advice and consent of the Senate to
ratification should be accompanied by a detailed explanation of any legislation or regulatory actions that
may be required to implement the protocol or other agreement and should also be accompanied by an

First Things First - Development and Global Warming
36
analysis of the detailed financial costs and other impacts on the economy of the United States which
would be incurred by the implementation of the protocol or other agreement.
SEC. 2. The Secretary of the Senate shall transmit a copy of this resolution to the President.
This resolution was passed without dissent.
First Things First - Development and Global Warming
37
References
Australian Bureau of Agricultural and Research Economics (ABARE), “Energy Demandand Supply Projections Australia 1992-93 to 2004-05,” Research Report 93.2, Canberra,1993.
Brandon, C. and Ramankutty, R., “Towards a Sustainable Environmental Strategy forAsia,” World Bank Discussion Paper 224, 1993.
Cross, F.B., Could Kyoto Killl? The Mortality Costs of Climate Policies, CEI October1998.
Crowley, Thomas J., “Remembrance of Things Past: Greenhouse Lessons from theGeologic Record,” Consequences, US Global Change Research Information Office, vol2(1), 1996.
Davis, R. W. and Legates, D., How Reliable are Climate Models?, CEI, June 1998.
Ellsaessar, H.W., What You Never Hear About Global Warming, Paper prepared at therequest of the Center for the Study of American Business, 1997.
Energy Information Administration, Office of Integrated Analysis and Forecasting, U.S.Department of Energy, “Impacts of the Kyoto Protocol on U.S. Energy Markets andEconomic Activity”, Report SR/OIAF/98-03, October 1998.
Energy Information Administration, “Emissions of Greenhouse Gases in the United States1997,” Washington D.C., Document DOE/EIA-0573(97), October 1998.
Heyhoe, E., Anderson, M., Jakeman, G., Brown, S., and Beil, S. Emissions Tradingand the Kyoto Protocol, ABARE October 1998
Houghton, J.T., Jenkins J.G. and Ephraums J.T. (eds) Climate Change: the IPCCScientific Assessment, WMO, UNEP, 1990.
Houghton, J.T., Callander, B.A., and Varney, S.K., (eds) Climate Change 1992: TheSupplementary Report to the IPCC Scientific Assessment, WMO, UNEP, 1992.
Houghton, J. T. et al (eds) Climate Change 1995: The Science of Climate Change,Contribution of WGI to Second Assessment Report of the Intergovernmental Panel onClimate Change, Cambridge University Press, 1996.
Hoyle, F., ‘The Great Greenhouse Controversy’ in Emsley J. (ed.), The Global WarmingDebate, European Science and Environment Forum, March 1996, Pp 179-90.
Idso S. B., ‘Plant Responses to Rising Levels of Atmospheric Carbon Dioxide’ in EmsleyJ. (ed.), The Global Warming Debate, European Science and Environment Forum, March1996, Pp 28-33.
First Things First - Development and Global Warming
38
Lieberman, B., Doomsday Déjà Vu: Ozone Depletion’s Lessons for Global Warming,CEI, October 1998.
Lindzen, R.S., Global Warming: The Origin and Nature of the Alleged ScientificConsensus, Regulation, The Cato Review of Business & Government.
Michaels, P., Long Hot Year: Latest Science Debunks Global Warming Hysteria, CatoPolicy Analysis No. 329, December 31, 1998.
Mills, M. P., “Kyoto Economics: The Costs and Follies of Eco-Energy Planning”, paperpresented at the Cooler Heads Coalition’s Economic Lecture, Washington, July 24, 1998available at http://www.cei.org/pubs/1998/mills%20paper2.PDF
Pearce, F., “Mythical Monster,” New Scientist, 9, January 1999.
Priem, H. ‘The Past is the Key to the Future’ in Emsley J. (ed.), The Global WarmingDebate, European Science and Environment Forum, March 1996, Pp 87-94.
Reinstein, Robert, Emission Credits: The Supply and Demand Gap. CEI, October 1998.
Tucker, Brian, The Scientific Impact, Paper to Kyoto the Impact on Australia Conference12-13 February 1998.
Tulpulé, V., Brown, S., Lim, J., Polidano, C, Pant, H., and Fisher, B. S., TheEconomic Impact of the Kyoto Protocol, ABARE, 1998a.
Tulpulé, V., Brown, S., Lim, J., Polidano, C, Pant, H., and Fisher, B. S., An EconomicAssessment of the Kyoto Protocol using the Global Trade and Environment Model,ABARE, 1998b.
United Nations, Department of Public Information, “Global Climate Change”, Setting theRecord Straight: Facts About the United Nations (http://www.un.org/News/facts/), 1999.
United Nations, “UN Releases 1998 World Population Estimates and Projections,” PressRelease POP/684, 27 October 1998.
WEFA, Inc. “Global Warming: The High Cost of the Kyoto Protocol: National and StateImpacts,” 1998.
Wigley, T., “The Kyoto Protocol: CO2, CH4, and Climate Implications,” GeophysicalResearch Letter 25, 1998, 2715-18.
Wood Mackenzie Global Consultants, Asia Pacific Energy Markets Service: China,January 1999.
World Bank, World Development Indicators, 1998.
World Resources 1996-97, World Resources Institute, 1997.