first south bancorp, inc. and subsidiary fernwood-glendale road ... 2015 and 2014 the accompanying...
TRANSCRIPT

FIRST SOUTH BANCORP, INC. AND SUBSIDIARY
REPORT ON CONSOLIDATED FINANCIAL STATEMENTS
FOR THE YEARS ENDED DECEMBER 31, 2015 AND 2014

Office Locations
Main Office 1450 John B. White, Sr. Blvd.
Spartanburg, S.C. 29306 Telephone (864) 595-0455
Hillcrest Branch
1035 Fernwood-Glendale Road Spartanburg, S.C. 29307
Telephone (864) 573-9955
Columbia Loan Production Office 107 West Park Blvd., Suite 230
Columbia, S.C. 29210 Telephone (803) 343-3435
Hilton Head / Bluffton Branch
7 Arley Way, Suite 100 Bluffton, S.C. 29910
Telephone (843) 706-6672
First South Financial Center 1460 John B. White, Sr. Blvd.
Spartanburg, S.C. 29306 Telephone (864) 595-0455
Greenville Branch
1068 North Church Street Greenville, S.C. 29601
Telephone (864) 254-9900

FIRST SOUTH BANCORP, INC. AND SUBSIDIARY CONSOLIDATED FINANCIAL STATEMENTS
TABLE OF CONTENTS
Page LETTER TO SHAREHOLDERS 5 REPORT OF INDEPENDENT REGISTERED PUBLIC ACCOUNTING FIRM 6 FINANCIAL STATEMENTS Consolidated Balance Sheets 8 Consolidated Statements of Operations 9 Consolidated Statements of Comprehensive Income (Loss) 10 Consolidated Statements of Stockholders’ Equity and Comprehensive Income (Loss) 11 Consolidated Statements of Cash Flows 12 NOTES TO FINANCIAL STATEMENTS 13 – 46 SHAREHOLDER INFORMATION 47 FDIC DISCLOSURE 48

Board of Directors
Roger A. F. Habisreutinger Chairman of the Board
James H. Ratchford
David L. Rinz
Chandrakant V. Shanbhag
Barry L. Slider
David G. White
Herman E. Ratchford, Emeritus
Richard H. Brooks (In Memoriam)
Harold E. Fleming (In Memoriam)
Executive Officers
Barry L. Slider Chief Executive Officer
And Vice Chairman
W. C. “Chip” Lyerly III Executive Vice President
and President
First South Bank
Frank R. Callison Executive Vice President
and Chief Credit Officer
First South Bank
Jeffrey N. Hooper, CPA Executive Vice President
and Chief Financial Officer

Dear Valued Shareholder: We are pleased to report your Company ended 12/31/15 with net profit after tax of
$1,339,000. Profitability was supported by an increase in loans outstanding from 2014 year-end of
$148.6 million to 2015 year-end of $155.1 million; growth of $6.5 million.
Additional support to profitability was the disposal of $11,717,000 of non-performing assets.
We continue to make significant progress in removing the residual of NPA’s created in the “Great
Recession.” Further reduction in NPA’s will continue to improve earnings for the Bank.
Improved earnings bolstered equity moving Tier I Capital ratio up to 4.32%. Regulatory
standards consider a bank with a Tier I Capital ratio above 4% as being adequately capitalized. We
are striving to improve on that ratio and are confident we will in time.
The Board of Directors and Staff continue to be humbled by the tremendous support given to
us during the past six years. Our shareholders and clients have been terrific and we know we would
not be in business today without their positive involvement.
We know we still have much work to do, but are eager to continue moving the Company in a
positive direction.
2016 is the 20 year anniversary of the Bank and as such it is appropriate to celebrate being the
oldest community bank headquartered in Spartanburg. We will be sending out invitations to an event
to be held in August that which we hope you will be able to participate.
Sincerely, Roger A. F. Habisreutinger Barry L. Slider Chairman of the Board Chief Executive Officer Vice Chairman of the Board

Independent Auditor’s Report
To the Board of Directors and Stockholders First South Bancorp, Inc. and Subsidiary Spartanburg, South Carolina Report on the Consolidated Financial Statements We have audited the accompanying consolidated financial statements of First South Bancorp, Inc. and Subsidiary (the Company) which comprise the consolidated balance sheets as of December 31, 2015 and 2014, and the related consolidated statements of operations, comprehensive income, stockholders’ equity and cash flows for the years then ended, and the related notes to the consolidated financial statements.
Management’s Responsibility for the Consolidated Financial Statements Management is responsible for the preparation and fair presentation of these consolidated financial statements in accordance with accounting principles generally accepted in the United States of America; this includes the design, implementation and maintenance of internal control relevant to the preparation and fair presentation of consolidated financial statements that are free from material misstatement, whether due to fraud or error. Auditor’s Responsibility Our responsibility is to express an opinion on these consolidated financial statements based on our audits. We conducted our audits in accordance with auditing standards generally accepted in the United States of America. Those standards require that we plan and perform the audit to obtain reasonable assurance about whether the consolidated financial statements are free from material misstatement. An audit involves performing procedures to obtain audit evidence about the amounts and disclosures in the consolidated financial statements. The procedures selected depend on the auditor’s judgment, including the assessment of the risks of material misstatement of the consolidated financial statements, whether due to fraud or error. In making those risk assessments, the auditor considers internal control relevant to the entity’s preparation and fair presentation of the consolidated financial statements in order to design audit procedures that are appropriate in the circumstances. An audit also includes evaluating the appropriateness of accounting policies used and the reasonableness of significant accounting estimates made by management, as well as evaluating the overall presentation of the consolidated financial statements.
We believe that the audit evidence we have obtained is sufficient and appropriate to provide a basis for our audit opinion.
Opinion In our opinion, the consolidated financial statements referred to above present fairly, in all material respects, the financial position of First South Bancorp, Inc. and Subsidiary as of December 31, 2015 and 2014, and the results of their operations and their cash flows for the years then ended, in accordance with accounting principles generally accepted in the United States of America. Emphasis-of-matter Regarding Non-performing Assets and Capital Levels
The Company and its wholly owned subsidiary, First South Bank (the Bank), continues to have high levels of non-performing assets and continues to be undercapitalized and will need to raise additional capital to meet minimum capital requirements mandated by its primary regulator. The Bank is considered significantly undercapitalized under the prompt corrective action framework as defined by the Federal Deposit Insurance Corporation (FDIC). As discussed in Note 2, the Bank is under a regulatory Consent Order with the FDIC that requires, among other provisions, capital ratios to be maintained at a certain level and failure to comply with the regulatory agreement may result in additional regulatory

enforcement actions. Columbia, South Carolina February 22, 2016

2015 2014Assets
Cash and due from banks 1,280$ 824$
Interest-bearing deposits 302 9,381
Securities available-for-sale 54,250 62,553
Loans, net of allowance for loan losses of $2,530 and $4,409 152,646 139,848
at December 31, 2015 and 2014, respectively
Premises and equipment, net 5,503 5,733
Investment in FSBS Capital Trust I 155 155
Bank owned life insurance 11,898 11,630
Other real estate owned 12,745 19,163
Litigation receivable 2,764 2,764
Other assets 1,522 1,611
Total assets 243,065$ 253,662$
Liabilities and Stockholders' Equity
Liabilities Noninterest-bearing demand 7,837$ 10,536$ Interest bearing demand and savings 83,023 92,817 Time deposits 120,018 125,055
Total deposits 210,878 228,408
Other borrowed funds 21,395 15,000 Junior subordinated debentures 5,155 5,155 Other accrued expenses and liabilities 1,116 1,797
Total liabilities 238,544 250,360
Commitments and contingencies (Notes 5 & 14)Stockholders' equity Preferred stock, no par value; 10,000,000 shares authorized; 155,630 issued and outstanding - - Common stock, no par value; 75,000,000 shares authorized; 10,441,237 issued and outstanding - - Paid-in capital 22,121 22,121 Retained deficit (16,532) (17,871) Accumulated other comprehensive loss (1,068) (948) Total stockholders' equity 4,521 3,302 Total liabilities and stockholders' equity 243,065$ 253,662$
The accompanying notes are an integral part of these consolidated financial statements.
December 31,
FIRST SOUTH BANCORP, INC. AND SUBSIDIARY
(Amounts, except share data, in thousands)CONSOLIDATED BALANCE SHEETS

2015 2014Interest income Loans 7,233$ 8,055$ Securities U. S. Government and agency obligations 952 1,051 Mortgage backed securities 416 603 Other securities 58 53 Deposits with banks 15 44
Total interest income 8,674 9,806
Interest expense Deposits Time 984 1,129 Interest-bearing demand and savings 344 471 Borrowed funds 631 622 Other 184 226
Total interest expense 2,143 2,448
Net interest income 6,531 7,358
Recovery of loan loss provision (2,000) - Net interest income after recovery of loan loss provision 8,531 7,358
Noninterest income
Brokerage fees 182 288 Service charges, fees, and commissions 81 91 Gain on extinguishment of debt 944 - Gain on branch sale - 714 Gain on sale of securities available for sale 289 240 Bank owned life insurance 287 288 Other income 163 393
Total noninterest income 1,946 2,014
Noninterest expenses Salaries and employee benefits 3,839 4,295 Occupancy and equipment 933 1,008 Data processing 326 319 Other outside services 312 344 FDIC assessments 871 1,009 Loan and real estate expenses 394 543 Loss and write downs on sale of other real estate owned 1,368 1,823 Other 1,076 1,252 Total other operating expenses 9,119 10,593 Income (loss) before income taxes 1,358 (1,221)
Income tax expense 19 20 Net income (loss) 1,339 (1,241)
Net income (loss) attributable to preferred shareholders 22 (21) Net income (loss) attributable to common shareholders 1,317$ (1,220)$
Basic earnings (loss) per common share 0.13$ (0.13)$
Diluted earnings (loss) per common share 0.13$ (0.13)$
For the years ended December 31,
FIRST SOUTH BANCORP, INC. AND SUBSIDIARY
(Amounts, except per share data, in thousands)
The accompanying notes are an integral part of these consolidated financial statements.
CONSOLIDATED STATEMENTS OF OPERATIONS

2015 2014Net income (loss) 1,339$ (1,241)$
Other comprehensive income (loss), net of tax:Unrealized gains (losses) on available for sale securities, net of taxes $0 and $0 169 5,234 Less: reclassifcation adjustment for gains included in net income (loss), net of tax benefit of $0 and $0 (289) (240)
Other comprehensive income (loss) (120) 4,994
Comprehensive income 1,219$ 3,753$
The accompanying notes are an integral part of these consolidated financial statements.
For the years ended December 31,
FIRST SOUTH BANCORP, INC. AND SUBISIDIARYCONSOLIDATED STATEMENTS OF COMPREHENSIVE INCOME
For the years ended December 31, 2015 and 2014(Amounts, except share data, in thousands)

Accumulatedother Total
Paid-in Retained comprehensive Stockholders'Preferred Stock Common Stock Capital (deficit) income (loss) equity
Balance at January 1, 2013 155,630 4,166,806 $20,515 (16,630)$ (5,942)$ $2,057
Proceeds from stock offering, net 6,274,431 1,606 1,606
Net loss (1,241) (1,241)
Other comprehensive income 4,994 4,994
Balance at December 31, 2014 155,630 10,441,237 $22,121 (17,871) (948) 3,302
Net income 1,339 1,339
Other comprehensive loss (120) (120)
Balance at December 31, 2015 155,630 10,441,237 22,121$ (16,532)$ (1,068)$ 4,521$
FIRST SOUTH BANCORP, INC. AND SUBISIDIARYCONSOLIDATED STATEMENTS OF STOCKHOLDERS' EQUITY
For the years ended December 31, 2015 and 2014
The accompanying notes are an integral part of these consolidated financial statements.
(Amounts, except share data, in thousands)
Number of Shares

2015 2014OPERATING ACTIVITIES Net income (loss) 1,339$ (1,241)$ Adjustments to reconcile net income (loss) to net cash provided (used) by operating activities Depreciation 326 378 Recovery of loan losses (2,000) - Gain on sale of securities 289 240 Gain on sale of branch - 714 Gain on extinguishment of debt 944 Write downs on other real estate owned 586 1,647 Net amortization of securities 304 299 Increase in cash surrender value of life insurance (268) (270) Decrease in interest receivable 35 180 Decrease in other assets 54 144 Increase (decreas) in accrued expenses and other liabilities (1,625) 331 Net cash provided (used) by operating activities (16) 2,422 INVESTING ACTIVITIES (Increase) decrease in loans, net of principal collected (13,032) 17,232 Proceeds from matured/called securities available-for-sale 3,000 - Proceeds from sale of securities available-for-sale 2,796 12,144 Purchase of securities available-for-sale (51) (5,434) Proceeds from MBS principal paydowns 1,844 2,083 Proceeds from sale of other real estate owned 8,066 5,612 Purchases of premises and equipment (95) (356) Net cash provided by investing activities 2,528 31,281 FINANCING ACTIVITIES Decreases in deposits, net (17,530) (43,619) Proceeds of stock offering, net - 1,606 Proceeds from advances from correspondent relationships 2,664 - Repayment of advances from correspondent relationships (1,269) - Proceeds from advances from FHLB 12,000 3,500 Repayment of advances from FHLB (7,000) (3,500) Net cash used by financing activities (11,135) (42,013) Net decrease in cash and cash equivalents (8,623) (8,310) CASH AND CASH EQUIVALENTS, BEGINNING OF YEAR 10,205 18,515 CASH AND CASH EQUIVALENTS, END OF YEAR 1,582$ 10,205$ CASH PAID FOR:Interest 2,122$ 2,466$ Income taxes 20$ 20$ NON-CASH INVESTING AND FINANCING ACTIVITIES:Unrealized gain (loss) on securities available for sale (120)$ 4,994$ Transfer of loans to other real estate owned 2,234$ 343$
For the years ended December 31,
FIRST SOUTH BANCORP, INC. AND SUBSIDIARY
(Amount in thousands)
The accompanying notes are an integral part of these consolidated financial statements.
CONSOLIDATED STATEMENTS OF CASH FLOWS

13
NOTE 1 - ORGANIZATION Organization First South Bancorp, Inc. (the "Corporation" or the "Company") is a South Carolina corporation organized in 1999 for the purpose of being a holding company for First South Bank (“the Bank”). On September 30, 1999, pursuant to a plan of exchange approved by the shareholders of the Bank, all of the outstanding shares of common stock of the Bank were exchanged for shares of common stock of the Corporation. The Corporation presently engages in no business other than that of owning the Bank and has no employees. The Bank was incorporated on April 23, 1996, and began banking operations on August 19, 1996. The Bank is a South Carolina chartered commercial bank and is engaged in lending and deposit gathering activities from two branches in Spartanburg County, one loan production office in Columbia, South Carolina, one branch in Bluffton, South Carolina, and one branch in Greenville, South Carolina. It operates under the laws of South Carolina and the Rules and Regulations of the Federal Deposit Insurance Corporation and the South Carolina State Board of Financial Institutions. Branch Sale On September 26, 2014, the Bank sold all deposits and selected assets associated with its branch office located in Columbia, South Carolina. The transaction was consummated pursuant to a definitive purchase and assumption agreement with First Community Bank (“FCB”), of Lexington, South Carolina, which was entered into on June 20, 2014 and approved by the FDIC on August 26, 2014. FCB assumed $40.1 million in deposits plus accrued interest of $15 thousand from the Bank. In addition, as part of the agreement, FCB also purchased certain loans from the branch with a carrying value of approximately $8.7 million. The Bank retained all other loans associated with the branch with a carrying value of approximately $21.7 million. The net settlement under the terms of the agreement resulted in a total payment of $30.1 million to FCB by the Bank. The transaction resulted in a gain of approximately $714 thousand. NOTE 2 – REGULATORY ACTIONS AND OTHER CONSIDERATIONS Consent Order On August 18, 2010, the Bank stipulated to the issuance of a Consent Order (the “Order”) issued by the Federal Deposit Insurance Corporation (FDIC) and the South Carolina State Board of Financial Institutions (the “State Board”). The Order was countersigned by the FDIC and State Board and became effective on August 27, 2010. Under the terms of the Order, the Bank is required, among other things, to do the following: increase Board participation in the affairs of the Bank and establish a program to oversee compliance with the Order; ensure that the Bank has and retains qualified management and develop a written management plan based upon the findings of an independent third-party management assessment; achieve and maintain (i) a total risk-based capital ratio of at least 10%, and (ii) a Tier 1 leverage ratio of at least 8%; charge-off all assets classified as “Loss” and the amounts of those assets classified as “Doubtful” in the report of examination preceeding the order considered uncollectable pursuant to generally accepted accounting principles (GAAP) and regulatory accounting requirements and 50% of those assets classified as “doubtful” in any future official report of examination from the FDIC or State Board; make a provision to replenish the Bank’s allowance for loan and lease losses (ALLL) consistent with the recommendations of the report of examination and develop a comprehensive policy for determining the adequacy of the ALLL; formulate a plan to reduce the risk exposure for each asset or relationship in excess of $500,000 classified as “Substandard” or “Doubtful” in the Report; reduce the aggregate balance of assets classified as “Substandard” or “Doubtful” in accordance with a prescribed schedule; refrain from extending credit to any borrower whose extension of credit has been, in whole or in part, charged-off or classified as “Loss,” “Doubtful,” or “Substandard” and is uncollected or listed for “Special Mention” in the Report; perform a risk segmentation analysis on and develop a written plan to systematically reduce any segment of its portfolio deemed to be an undue concentration of credit; correct the deficiencies in any loans cited in the report of examination as “Special Mention;” review and revise its written lending, underwriting, and collection policy; revise its loan review and grading system; review and revise the Bank’s strategic plan and comprehensive budget; review and revise its liquidity, contingent funding and asset liability management plan; develop and

14
NOTE 2 – REGULATORY ACTIONS AND OTHER CONSIDERATIONS (continued) Consent Order (continued) implement a written policy for interest rate management; and eliminate and/or correct all violations of rules and regulations contained in the Report.
The Order further prohibits the Bank from declaring or paying dividends or bonuses or accepting, rolling over or renewing brokered deposits without the prior approval of its regulatory authorities and limits asset growth to less than 5% per year, unless the Bank receives prior approval from the FDIC and State Board. The Company is required to make written disclosure of the Order to its shareholders in connection with the mailing of materials for the next shareholder meeting and in the next written communication sent to the Company’s shareholders. As of December 31, 2015 and 2014, the Bank is not in compliance with Provision 3 – Capital terms of the consent order. The Company intends to take all actions necessary to enable the Bank to comply with the requirements of the Consent Order. There can be no assurance that the Bank will be able to comply fully with the provisions of the Consent Order, and the determination of our compliance will be made by the FDIC and the State Board. Failure to meet the requirements of the Consent Order could result in additional regulatory requirements, which could ultimately lead to the Bank being taken into receivership by the FDIC. The Company has continued to be affected by uncertainty in market conditions since the recession that began in 2007 and ended in 2009. The substantial uncertainties throughout the economy and U.S. banking industry coupled with volatile market conditions have continued to affect the Company’s financial results and capital levels. Significant losses incurred by the Bank, primarily related to credit losses and the disallowance of the deferred tax asset, have reduced the Company’s capital levels. In order to become well capitalized under federal banking agencies’ guidelines, management believes that the Company will need to raise additional capital to absorb the potential future credit losses associated with the disposition of its nonperforming assets. During 2014 and 2013, an additional $2.2 million of equity was raised by the Company, of which $2 million has been contributed to the Bank, and increased regulatory capital. A total 6.274 million shares of common stock were issued in this offering at $0.35 per share. The private offering expired on February 28, 2014. Management has also worked to reduce and restructure its balance sheet to improve capital ratios. This included the sale of the Bank’s Columbia branch, including certain loans of approximately $8.7 million, and all deposits of approximately $40.1 million. The transaction resulted in a gain of approximately $714 thousand. Continued uncertainty surrounding market conditions for banking institutions, the overall uncertainty in the financial markets, and depressed stock prices are significant barriers to the success of any plan to issue additional equity in public or private offerings. An equity financing transaction would result in substantial dilution to the Company's current shareholders and could adversely affect the market price of the Company's common stock. Though the Company has raised $2.2 million of additional equity, there can be no assurance as to whether the efforts to raise additional capital will be successful in the future. Should these efforts be unsuccessful, due to existing regulatory restrictions on cash payments between the Bank and the holding company, the Company may be unable to discharge its liabilities in the normal course of business. Both the parent company and the banking subsidiary actively manage liquidity and cash flow needs. The Company has historically never paid a dividend, but under the Consent Order it is precluded from paying dividends to its common and preferred shareholders until such time as the Company is relieved of regulatory enforcement actions. At December 31, 2015, the Company had $1.582 million of cash and cash equivalents. The Company has no long-term debt maturing in 2016. Liquidity at the bank level is dependent upon the deposit franchise which funds 90% of the Company’s assets. The FDIC’s changes to increase the amount of deposit insurance to $250,000 per deposit relationship has contributed to the stable deposit base. The end of the program did not affect the Bank’s liquidity. Potential loss of deposits would create a primary funding need in a liquidity crisis. Deposit balances which are not covered by FDIC insurance total approximately $9.1 million at December 31, 2015. Thus, the primary deposit-related liquidity risk relates to balances which are not insured. As of December 31, 2015 the Company has liquid assets of approximately $44.2 million to address liquidity needs in a crisis scenario. If a liquidity issue presents itself, deposit promotions would be expected to

15
NOTE 2 – REGULATORY ACTIONS AND OTHER CONSIDERATIONS (continued) Consent Order (continued) yield significant in-flows of cash, but could be limited based on recently approved limitations on maximum interest rates. In addition, certain borrowings, such as brokered CDs and FHLB advances, are dependent on various credit eligibility criteria which may be impacted by changes in the Company’s financial position and/or results of operations. Given the weakened economy, and current market conditions, there is no assurance that the Company will, if it chooses to do so, be able to obtain new borrowings or issue additional equity on terms that are satisfactory. Based on current capital levels and expected liquidity needs and sources, management expects the Company to be able to meet its obligations. If unanticipated market factors emerge, or if the Company is unable to raise additional capital, successfully execute its plans, or comply with regulatory requirements, then its banking regulators could take further action, which could include actions that may have a material adverse effect on the Company’s business, results of operations and financial position. On June 25, 2010, the Federal Reserve notified the Company that the Company would be operating under several restrictions imposed on it by the Federal Reserve. These restrictions include appointment of new directors or changes in the appointment of any senior executive officers, making “golden parachute” payments, paying dividends, common or preferred, and incurring debt. The Company is committed to taking the necessary actions to comply with the Consent Order, and is also committed to continuing to serve the communities in which it operates. As of December 31, 2015, the Bank is in compliance with twenty one articles of the Consent Order and is out of compliance with only one article of the consent order, which is the capital requirement. Emphasis of Other Matters The Company has a history of profitable operations prior to the economic downturn and sufficient sources of liquidity to meet its short-term and long-term funding needs. However, the Bank’s financial condition has continued to suffer during 2015 from the effects of the economic downturn that began in 2008. Since the recession began in 2008, the Company has developed and implemented plans to increase capital which has been reduced because of significant losses by the Bank, primarily related to credit losses. The Company has worked to increase its regulatory capital levels, and during late 2013 and early 2014, raised approximately $2.2 million in a private placement offering of its stock and increased capital by $714 thousand through the sale of one of its branches. The Company’s capital ratios are still considered less than well capitalized under the regulatory framework, and significantly undercapitalized under the the prompt corrective ation framework as defined by the Federal Deposit Insurance Corporation (FDIC). The Company needs additional capital to meet the requirements of the Consent Order described above. The effects of the economic environment continue to be impacted across many industries, with financial services and residential real estate being particularly hard hit. The Bank, with a loan portfolio consisting of a concentration in commercial real estate loans including residential construction and development loans, has seen a decline in the value of the collateral securing its portfolio as well as rapid deterioration in its borrowers’ cash flow and ability to repay their outstanding loans to the Bank. As a result, the Bank’s level of nonperforming assets increased substantially during the recession to a peak of $79 million, and although the balance of nonperforming assets has been reduced substantially, it remains at $19 million, or 7.9% of total assets as of December 31, 2015. The Company and the Bank operate in a highly-regulated industry and must plan for the liquidity needs of each entity separately. A variety of sources of liquidity are available to the Bank to meet its short-term and long-term funding needs. Although a number of these sources have been limited following execution of the Consent Order with the FDIC and the South Carolina Board of Financial Institutions, management has prepared forecasts of these sources of

16
NOTE 2 – REGULATORY ACTIONS AND OTHER CONSIDERATIONS (continued) Emphasis of Other Matters (continued) funds and the Bank’s projected uses of funds during 2016 in an effort to ensure that the sources available are sufficient to meet the Bank’s projected liquidity needs for this period. The Company relies on dividends from the Bank as its primary source of liquidity. The Company is a legal entity separate and distinct from the Bank. Various legal limitations restrict the Bank from lending or otherwise supplying funds to the Company to meet its obligations, including paying dividends. In addition, the terms of the Consent Order described above will further limit the Bank’s ability to pay dividends to the Company to satisfy its funding needs. The Company will also need to raise additional capital to increase capital levels to meet the standards set forth by the FDIC for the Bank. As a result of the recent downturn in the financial markets, the availability of many sources of capital (principally to financial services companies) has become significantly restricted or has become increasingly costly as compared to the prevailing market rates prior to the volatility. Management cannot predict when or if the capital markets will return to more favorable conditions. Management is actively evaluating a number of capital sources, asset reductions, and other balance sheet management strategies to ensure that the Bank’s projected level of regulatory capital can support its balance sheet. There can be no assurances that the Company will be successful in its efforts to raise additional capital during 2016. An equity financing transaction of this type would result in substantial dilution to the Company’s current shareholders and could adversely affect the market price of the Company’s common stock. It is difficult to predict if these efforts will be successful, either on a short-term or long-term basis. Should these efforts be unsuccessful, due to the regulatory restrictions which exist that restrict cash payments between the Bank and the Company, the Company may be unable to realize its assets and discharge its liabilities in the normal course of business. On July 12, 2010, the Company exercised its rights to defer interest payments. In October of 2015 a payment was made by outside but related parties for the accrued interest in the amount of $944 thousand. The payment brought the Company current. The Company now has another twenty period deferral option available. As of December 31, 2015, the Company intends to begin exercising its deferral option on a period by period basis. The amount of accrued interest at December 31, 2015 was $38 thousand. Under the terms of the debenture, the Company may defer interest payments for twenty quarters. After such time, the holders of the junior subordinated debentures may take action which could lead to the Company being forced into bankruptcy. These payments are accrued but unpaid at December 31, 2015. The maximum deferral period is for five years from the notice date. The last deferral period ends on October 7, 2020. If the deferred interest is not paid on this date, the Company will be considered in default on the junior subordinated debentures. The Company is aggressively developing a plan to pay the deferred interest. Although the Company is working to develop a plan for payment, no assurances can be given that it will be successful in its efforts. NOTE 3 - SUMMARY OF SIGNIFICANT ACCOUNTING POLICIES AND ACTIVITIES The following is a description of the significant accounting and reporting policies that First South Bancorp, Inc. and Subsidiary follows in preparing and presenting these consolidated financial statements. Basis of Presentation and Consolidation - The consolidated financial statements include the accounts of the Corporation and its wholly-owned subsidiary, the Bank. All significant intercompany balances and transactions have been eliminated in consolidation. Use of Estimates - The preparation of the consolidated financial statements in conformity with accounting principles generally accepted in the United States of America requires management to make estimates and assumptions that affect reported amounts of assets and liabilities and disclosure of contingent liabilities at the date of the financial statements, as well as the amounts of income and expenses during the reporting period. Actual results could differ from those estimates.

17
NOTE 3 – SUMMARY OF SIGNIFICANT ACCOUNTING POLICIES AND ACTIVITIES (continued) Use of Estimates (continued) Material estimates that are particularly susceptible to significant change relate to the determination of the allowance for loan losses, including valuation allowances for impaired loans, and the carrying amount of real estate acquired in connection with foreclosures or in satisfaction of loans. Management must also make estimates in determining the estimated useful lives and methods for depreciating premises and equipment. While management uses available information to recognize losses on loans and foreclosed real estate, future additions to the allowance may be necessary based on changes in local economic conditions. In addition, regulatory agencies, as an integral part of their examination process, periodically review the Bank’s allowances for losses on loans and foreclosed real estate. Such agencies may require the Bank to recognize additions to the allowances based on their judgments about information available to them at the time of their examination. Because of these factors, it is possible that the allowances for losses on loans and foreclosed real estate may change materially in the near term. Securities - Investments in equity securities that have readily determinable fair values and all investments in debt securities are classified at acquisition into one of three categories and accounted for as follows:
securities held-to-maturity are reported at amortized cost, trading securities are reported at fair value with unrealized gains and losses included in earnings, or; securities available-for-sale are reported at estimated fair value with unrealized gains and losses reported as a
separate component of comprehensive income (net of tax effect). The Company intends to hold the available-for-sale securities for an indefinite period of time but may sell them prior to maturity. There were no securities classified as trading or held-to-maturity at December 31, 2015 and 2014. Gains and losses on sales of securities are recognized when realized on a specific identification, trade date basis. Premiums and discounts are amortized into interest income using a method that approximates the level yield method. Loans and Allowance for Loan Losses - Loans are stated at their unpaid principal balance. Interest income is recorded as earned on an accrual basis. The accrual of interest is discontinued when, in management's opinion, the borrower may be unable to meet payments as they become contractually due, generally when the loan is 90 days delinquent. All interest accrued, but not collected, for loans that are placed on nonaccrual, is reversed against interest income. A commercial loan is considered past due when a payment is not received by the next business day after the due date. A consumer loan is considered past due when a payment is not received within 30 days after the due date. The Company uses the allowance method in providing for loan losses. The provision for loan losses is based upon management's estimate of the amount needed to maintain the allowance for loan losses at an adequate level to cover known and probable losses in the loan portfolio. In determining the provision amount, management gives consideration to current economic conditions, the growth and composition of the loan portfolio, the relationship of the allowance for loan losses to outstanding loans and other factors. Management believes that the allowance for loan losses is adequate. While management uses the best information available to make evaluations, future adjustments may be necessary if economic and other conditions differ substantially from the assumptions used. Management considers loans to be impaired when, based on current information and events, it is probable that the Company will be unable to collect all amounts due according to the contractual terms of the loan agreement. Factors that influence management's judgments include, but are not limited to, loan payment pattern, source of repayment, and value of collateral. A loan would not be considered impaired if an insignificant delay in loan payment occurs and management expects to collect all amounts due. The major sources for identification of loans to be evaluated for impairment include past due and nonaccrual reports, internally generated lists of loans with certain risk grades, and
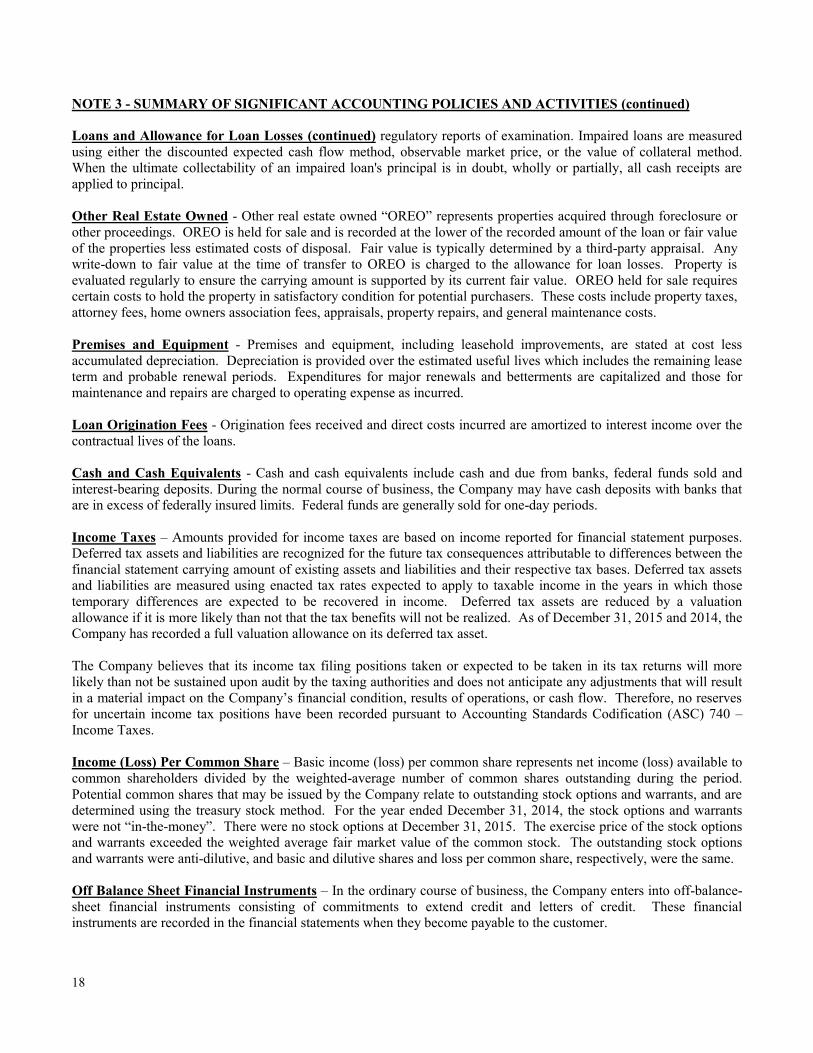
18
NOTE 3 - SUMMARY OF SIGNIFICANT ACCOUNTING POLICIES AND ACTIVITIES (continued) Loans and Allowance for Loan Losses (continued) regulatory reports of examination. Impaired loans are measured using either the discounted expected cash flow method, observable market price, or the value of collateral method. When the ultimate collectability of an impaired loan's principal is in doubt, wholly or partially, all cash receipts are applied to principal. Other Real Estate Owned - Other real estate owned “OREO” represents properties acquired through foreclosure or other proceedings. OREO is held for sale and is recorded at the lower of the recorded amount of the loan or fair value of the properties less estimated costs of disposal. Fair value is typically determined by a third-party appraisal. Any write-down to fair value at the time of transfer to OREO is charged to the allowance for loan losses. Property is evaluated regularly to ensure the carrying amount is supported by its current fair value. OREO held for sale requires certain costs to hold the property in satisfactory condition for potential purchasers. These costs include property taxes, attorney fees, home owners association fees, appraisals, property repairs, and general maintenance costs. Premises and Equipment - Premises and equipment, including leasehold improvements, are stated at cost less accumulated depreciation. Depreciation is provided over the estimated useful lives which includes the remaining lease term and probable renewal periods. Expenditures for major renewals and betterments are capitalized and those for maintenance and repairs are charged to operating expense as incurred. Loan Origination Fees - Origination fees received and direct costs incurred are amortized to interest income over the contractual lives of the loans. Cash and Cash Equivalents - Cash and cash equivalents include cash and due from banks, federal funds sold and interest-bearing deposits. During the normal course of business, the Company may have cash deposits with banks that are in excess of federally insured limits. Federal funds are generally sold for one-day periods. Income Taxes – Amounts provided for income taxes are based on income reported for financial statement purposes. Deferred tax assets and liabilities are recognized for the future tax consequences attributable to differences between the financial statement carrying amount of existing assets and liabilities and their respective tax bases. Deferred tax assets and liabilities are measured using enacted tax rates expected to apply to taxable income in the years in which those temporary differences are expected to be recovered in income. Deferred tax assets are reduced by a valuation allowance if it is more likely than not that the tax benefits will not be realized. As of December 31, 2015 and 2014, the Company has recorded a full valuation allowance on its deferred tax asset. The Company believes that its income tax filing positions taken or expected to be taken in its tax returns will more likely than not be sustained upon audit by the taxing authorities and does not anticipate any adjustments that will result in a material impact on the Company’s financial condition, results of operations, or cash flow. Therefore, no reserves for uncertain income tax positions have been recorded pursuant to Accounting Standards Codification (ASC) 740 – Income Taxes. Income (Loss) Per Common Share – Basic income (loss) per common share represents net income (loss) available to common shareholders divided by the weighted-average number of common shares outstanding during the period. Potential common shares that may be issued by the Company relate to outstanding stock options and warrants, and are determined using the treasury stock method. For the year ended December 31, 2014, the stock options and warrants were not “in-the-money”. There were no stock options at December 31, 2015. The exercise price of the stock options and warrants exceeded the weighted average fair market value of the common stock. The outstanding stock options and warrants were anti-dilutive, and basic and dilutive shares and loss per common share, respectively, were the same. Off Balance Sheet Financial Instruments – In the ordinary course of business, the Company enters into off-balance-sheet financial instruments consisting of commitments to extend credit and letters of credit. These financial instruments are recorded in the financial statements when they become payable to the customer.

19
NOTE 3 - SUMMARY OF SIGNIFICANT ACCOUNTING POLICIES AND ACTIVITIES (continued) Stock-Based Compensation – The Company accounts for stock options in accordance with generally accepted accounting principles. Compensation expense is recognized as salaries and employee benefits in the statement of operations. No options were granted in 2015 and 2014, and no options existed at December 31, 2015. Recent Accounting Pronouncements - The following is a summary of recent authoritative pronouncements: In January 2014, the FASB amended Receivables topic of the Accounting Standards Codification. The amendments are intended to resolve diversity in practice with respect to when a creditor should reclassify a collateralized consumer mortgage loan to other real estate owned (OREO). In addition, the amendments require a creditor reclassify a collateralized consumer mortgage loan to OREO upon obtaining legal title to the real estate collateral, or the borrower voluntarily conveying all interest in the real estate property to the lender to satisfy the loan through a deed in lieu of foreclosure or similar legal agreement. The amendments were effective for the Company for annual periods beginning after December 15, 2014, and interim periods within annual periods beginning after December 15, 2015. In implementing this guidance, assets that are reclassified from real estate to loans are measured at the carrying value of the real estate at the date of adoption. Assets reclassified from loans to real estate are measured at the lower of the net amount of the loan receivable or the fair value of the real estate less costs to sell at the date of adoption. The Company applied the amendments prospectively. These amendments did not have a material effect on the Company’s financial statements. In May 2014, the FASB issued guidance to change the recognition of revenue from contracts with customers. The core principle of the new guidance is that an entity should recognize revenue to reflect the transfer of goods and services to customers in an amount equal to the consideration the entity receives or expects to receive. The guidance will be effective for the Company for annual periods beginning after December 15, 2018, and interim periods within annual reporting periods beginning after December 15, 2019. In August 2015, the FASB deferred the effective date of ASU 2014-09, Revenue from Contracts with Customers. As a result of the deferral, the guidance in ASU 2014-09 will be effective for the Company for annual periods beginning after December 15, 2018, and interim periods within annual reporting periods beginning after December 15, 2019. The Company will apply the guidance using a full retrospective approach. The Company does not expect these amendments to have a material effect on its financial statements. In June 2014, the FASB issued guidance which makes limited amendments to the guidance on accounting for certain repurchase agreements. The new guidance (1) requires entities to account for repurchase-to-maturity transactions as secured borrowings (rather than as sales with forward repurchase agreements), (2) eliminates accounting guidance on linked repurchase financing transactions, and (3) expands disclosure requirements related to certain transfers of financial assets that are accounted for as sales and certain transfers (specifically, repos, securities lending transactions, and repurchase-to-maturity transactions) accounted for as secured borrowings. The amendments were effective for the Company for annual periods beginning after December 15, 2014, and interim periods beginning after December 15, 2015. The Company applied the guidance by making a cumulative-effect adjustment to retained earnings as of January 1, 2015. These amendments did not have a material effect on the Company’s financial statements. In January 2016, the FASB amended the Financial Instruments topic of the Accounting Standards Codification to address certain aspects of recognition, measurement, presentation, and disclosure of financial instruments. The amendments will be effective for fiscal years beginning after December 15, 2018, and interim periods within fiscal years beginning after December 15, 2019. The Company will apply the guidance by means of a cumulative-effect adjustment to the balance sheet as of the beginning of the fiscal year of adoption. The amendments related to equity securities without readily determinable fair values will be applied prospectively to equity investments that exist as of the date of adoption of the amendments. The Company does not expect these amendments to have a material effect on its financial statements. Other accounting standards that have been issued or proposed by the FASB or other standards-setting bodies are not expected to have a material impact on the Company’s financial position, results of operations or cash flows.
20
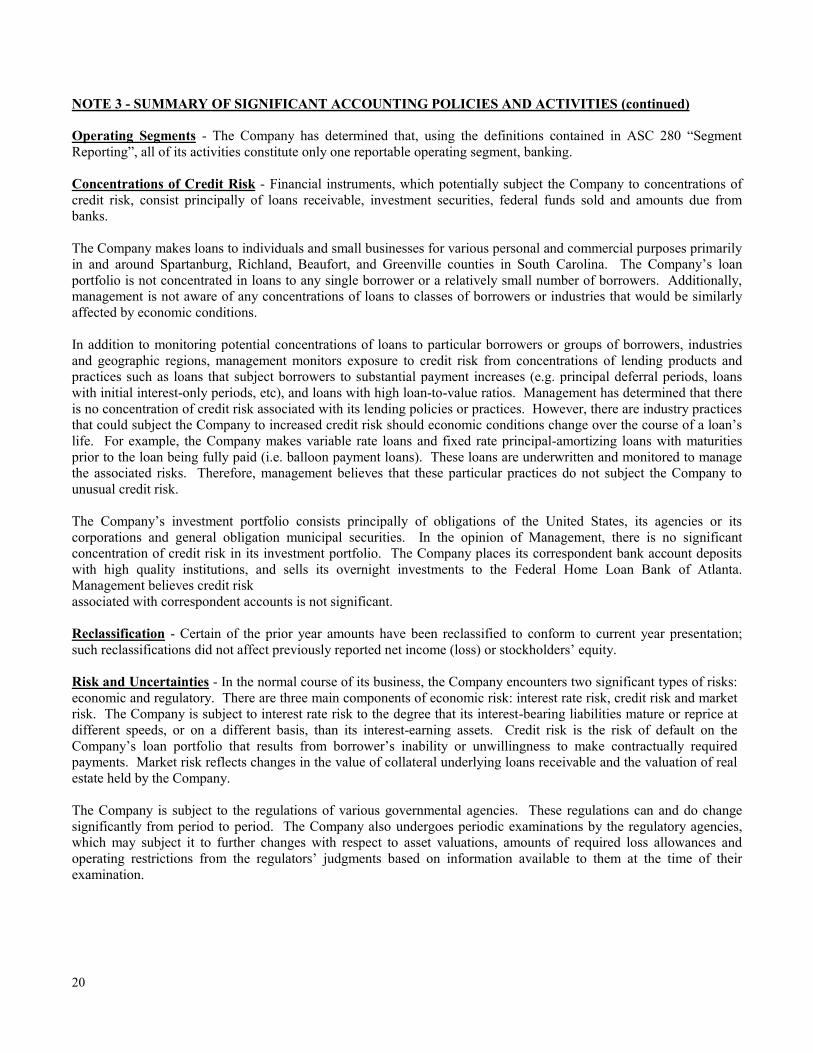
NOTE 3 - SUMMARY OF SIGNIFICANT ACCOUNTING POLICIES AND ACTIVITIES (continued) Operating Segments - The Company has determined that, using the definitions contained in ASC 280 “Segment Reporting”, all of its activities constitute only one reportable operating segment, banking. Concentrations of Credit Risk - Financial instruments, which potentially subject the Company to concentrations of credit risk, consist principally of loans receivable, investment securities, federal funds sold and amounts due from banks. The Company makes loans to individuals and small businesses for various personal and commercial purposes primarily in and around Spartanburg, Richland, Beaufort, and Greenville counties in South Carolina. The Company’s loan portfolio is not concentrated in loans to any single borrower or a relatively small number of borrowers. Additionally, management is not aware of any concentrations of loans to classes of borrowers or industries that would be similarly affected by economic conditions. In addition to monitoring potential concentrations of loans to particular borrowers or groups of borrowers, industries and geographic regions, management monitors exposure to credit risk from concentrations of lending products and practices such as loans that subject borrowers to substantial payment increases (e.g. principal deferral periods, loans with initial interest-only periods, etc), and loans with high loan-to-value ratios. Management has determined that there is no concentration of credit risk associated with its lending policies or practices. However, there are industry practices that could subject the Company to increased credit risk should economic conditions change over the course of a loan’s life. For example, the Company makes variable rate loans and fixed rate principal-amortizing loans with maturities prior to the loan being fully paid (i.e. balloon payment loans). These loans are underwritten and monitored to manage the associated risks. Therefore, management believes that these particular practices do not subject the Company to unusual credit risk. The Company’s investment portfolio consists principally of obligations of the United States, its agencies or its corporations and general obligation municipal securities. In the opinion of Management, there is no significant concentration of credit risk in its investment portfolio. The Company places its correspondent bank account deposits with high quality institutions, and sells its overnight investments to the Federal Home Loan Bank of Atlanta. Management believes credit risk associated with correspondent accounts is not significant. Reclassification - Certain of the prior year amounts have been reclassified to conform to current year presentation; such reclassifications did not affect previously reported net income (loss) or stockholders’ equity. Risk and Uncertainties - In the normal course of its business, the Company encounters two significant types of risks: economic and regulatory. There are three main components of economic risk: interest rate risk, credit risk and market risk. The Company is subject to interest rate risk to the degree that its interest-bearing liabilities mature or reprice at different speeds, or on a different basis, than its interest-earning assets. Credit risk is the risk of default on the Company’s loan portfolio that results from borrower’s inability or unwillingness to make contractually required payments. Market risk reflects changes in the value of collateral underlying loans receivable and the valuation of real estate held by the Company. The Company is subject to the regulations of various governmental agencies. These regulations can and do change significantly from period to period. The Company also undergoes periodic examinations by the regulatory agencies, which may subject it to further changes with respect to asset valuations, amounts of required loss allowances and operating restrictions from the regulators’ judgments based on information available to them at the time of their examination.

21
NOTE 4 - SECURITIES A summary of the amortized cost and estimated fair value of securities available-for-sale follows:
There were sales of available-for-sale securities in 2015 of $2.796 million resulting in gross realized gains of $289 thousand. There were sales of available-for-sale securities in 2014 of $12.144 million resulting in gross realized gains of $240 thousand.
(Amounts in thousands) Amortized EstimatedCost Gains Losses Fair Value
December 31, 2015 U.S. government agency obligations $ 2,890 $ 4 $ 15 $ 2,879 Government sponsored enterprises 28,468 - 827 27,641 Mortgage-backed securities 22,366 6 233 22,139 Municipal taxable securities 515 - 2 513 Restricted FHLB stock 1,078 - - 1,078
Total $ 55,317 $ 10 $ 1,077 $ 54,250
December 31, 2014 U.S. government agency obligations $ 4,786 $ 175 $ 18 $ 4,943 Government sponsored enterprises 31,482 - 877 30,605 Mortgage-backed securities 25,689 9 232 25,466 Municipal taxable securities 517 - 5 512 Restricted FHLB stock 1,027 - - 1,027
Total $ 63,501 $ 184 $ 1,132 $ 62,553
Gross Unrealized

22
NOTE 4 – SECURITIES (continued) The following table shows gross unrealized losses and fair value, aggregated by investment category, and length of time that individual securities have been in a continuous unrealized loss position, at December 31, 2015 and 2014. Securities Available-for-Sale
Securities classified as available-for-sale are recorded at fair market value. The Company believes, based on industry analyst reports and credit ratings, that deterioration in security values is attributable to changes in market interest rates and not in the credit quality of the issuers and therefore, the losses are considered temporary.
(Amounts in thousands)
Unrealized Unrealized UnrealizedDecember 31, 2015 Fair Value Losses Fair Value Losses Fair Value Losses
Government sponsored enterprises $ 9,738 $ 238 $ 18,880 $ 604 $ 28,618 $ 842 Mortgage backed securities 16,315 191 3,006 42 19,321 233 Municipal taxable securities 513 2 - - 513 2
Total $ 26,566 $ 431 $ 21,886 $ 646 $ 48,452 $ 1,077
Unrealized Unrealized UnrealizedDecember 31, 2014 Fair Value Losses Fair Value Losses Fair Value Losses
Government sponsored enterprises $ - $ - $ 31,577 $ 895 $ 31,577 $ 895 Mortgage backed securities 1,240 6 16,769 226 18,009 232 Municipal taxable securities - - 513 5 513 5
Total $ 1,240 $ 6 $ 48,859 $ 1,126 $ 50,099 $ 1,132
Less Than Twelve MonthsTwelve Months or More Total
TotalLess Than
Twelve MonthsTwelve Months
or More

23
NOTE 4 – SECURITIES (continued) Securities Available-for-Sale (continued) The scheduled maturities of securities available-for-sale at December 31, 2015 were as follows:
At December 31, 2015, securities with a book value of approximately $9.312 million, and market value of $9.166 million were pledged to the Federal Home Loan Bank of Atlanta, the Federal Reserve Bank of Richmond, Treasury, AloStar Bank, and at the Senior Housing Crime Prevention Foundation. NOTE 5 - LOANS AND ALLOWANCE FOR LOAN LOSSES Loans at December 31, 2015 and 2014 are summarized as follows:
MATURITIES AND SENSITIVITY OF LOANS TO CHANGES IN INTEREST RATES The information in the following tables summarizes the loan maturity distribution by type based on the contractual maturities of individual loans, including loans which may be subject to renewal at their contractual maturity. Renewal of such loans is subject to review and credit approval, as well as modification of terms upon maturity. Actual repayments of loans may differ from the maturities reflected below, because borrowers have the right to prepay obligations with or without prepayment penalties.
(Amounts in thousands)Amortized Estimated
Cost Fair Value
Due in one year or less $ - $ - Due from one to five years - - Due from five to ten years 27,306 26,492 Due after ten years 4,052 4,028 Mortgage backed securities 22,366 22,139 Municipal taxable securities 515 513 Restricted FHLB Stock 1,078 1,078
$ 55,317 $ 54,250
Available-For-Sale
(Amounts in thousands)2015 2014
Real Estate: Construction and land development 20,214$ 28,716$ 1-4 family residential properties 23,264 9,125 Multifamily residential properties 4,138 1,704 Non-farm nonresidential properties 73,675 80,623 Other real estate loans 404 414 Commercial and industrial, non-real estate 33,010 23,313 Consumer 434 326 Total loans 155,139 144,221 Less allowance for loans losses (2,530) (4,409) Net deferred loan expenses 37 36
152,646$ 139,848$
December 31,

24
NOTE 5 - LOANS AND ALLOWANCE FOR LOAN LOSSES (continued)
Portfolio Segment Methodology Loans are assessed for estimated losses by segmenting loans using various risk factors identified through periodic reviews. We apply historic pool-specific loss factors to each funded loan. In the development of our loan pool loss factors, we observe historical losses over a relevant period for each loan pool. These loss estimates are adjusted as appropriate based on additional analysis of external loss data or other risks identified from current economic conditions and credit quality trends. The allowance also includes an amount for estimated impairment on nonaccrual loans and loans modified in a troubled debt restructuring, whether on accrual or nonaccrual status.
December 31, 2015
(Amounts in thousands)One year or
less
After one but within five
yearsAfter five
years TotalReal Estate: Construction and land development 6,865$ 13,349$ -$ 20,214$ 1-4 family residential properties 1,913 8,464 12,887 23,264 Multifamily residential properties 150 3,578 410 4,138 Non-farm nonresidential properties 10,088 53,382 10,205 73,675 Other real estate loans 404 - - 404 Commercial and industrial, non-real estate 17,070 11,799 4,141 33,010 Consumer 11 423 - 434 Total loans 36,501 90,995 27,643 155,139
Loans maturing after one year with:Fixed interest rates 62,555$ Floating interest rates 56,083
December 31, 2014
(Amounts in thousands)One year or
less
After one but within five
yearsAfter five
years TotalReal Estate: Construction and land development 8,630$ 19,651$ 435$ 28,716$ 1-4 family residential properties 345 2,407 6,373 9,125 Multifamily residential properties - 1,704 - 1,704 Non-farm nonresidential properties 17,297 52,432 10,894 80,623 Other real estate loans - 414 - 414 Commercial and industrial, non-real estate 11,539 11,658 116 23,313 Consumer 15 311 - 326 Total loans 37,826 88,577 17,818 144,221
Loans maturing after one year with:Fixed interest rates 60,154$ Floating interest rates 46,241

25
NOTE 5 - LOANS AND ALLOWANCE FOR LOAN LOSSES (continued) Credit Quality Indicators and Nonperforming assets We manage a consistent process for assessing loan credit quality by monitoring our loan grading trends and past due statistics. All loans are subject to individual risk assessment. Our categories include Exceptional, Above Average Quality, Average Quality, Below Average but Acceptable, Lowest Acceptable Relationship Grade, Special Mention, Substandard, Doubtful, and Loss, each of which are defined by banking regulatory agencies. Delinquency statistics are also an important indicator of credit quality in the establishment of our allowance for credit losses. The tables below provide a breakdown of outstanding loans by risk category.
The following tables provide past due information for outstanding loans, loans on non-accrual, nonperforming assets, and the related percentage of nonperforming assets to total assets and gross loans. Generally, a loan is placed on nonaccrual status when it becomes 90 days past due to principal or interest, or when we believe, after considering economic and business conditions and collection efforts, that the borrower’s financial condition is such that collection of the contractual interest on the loan is doubtful. A payment of interest on a loan that is classified as nonaccrual is recognized as a reduction in principal when received.
December 31, 2015
(Amounts in thousands) Exceptional
Above Average Quality
Average Quality
Below Average but Acceptable
Lowest Acceptable Relationship
GradeSpecial Mention Substandard Doubtful Loss Total
Real Estate: Construction and land development -$ -$ 5,058$ 5,958$ 3,863$ 42$ 5,293$ -$ -$ 20,214$ 1-4 family residential properties 150 171 6,369 14,204 1,080 616 674 - - 23,264 Multifamily residential properties - - 2,057 2,081 - - - - - 4,138 Non-farm nonresidential properties - 339 16,309 39,186 12,304 3,406 2,131 - - 73,675 Other real estate loans - - - 404 - - - - - 404 Commercial and industrial, non-real estate 317 2,741 9,827 13,819 4,553 248 1,505 - - 33,010 Consumer 11 119 304 - - - - - - 434 Total loans 478$ 3,370$ 39,924$ 75,652$ 21,800$ 4,312$ 9,603$ -$ -$ 155,139$
December 31, 2014
(Amounts in thousands) Exceptional
Above Average Quality
Average Quality
Below Average but Acceptable
Lowest Acceptable Relationship
GradeSpecial Mention Substandard Doubtful Loss Total
Real Estate: Construction and land development 11$ -$ 4,542$ 9,393$ 5,456$ 4,183$ 5,131$ -$ -$ 28,716$ 1-4 family residential properties - 233 3,385 4,131 33 206 1,137 - - 9,125 Multifamily residential properties - - 1,704 - - - - - - 1,704 Non-farm nonresidential properties 2 357 20,410 35,729 15,954 4,403 3,768 - - 80,623 Other real estate loans - - - 414 - - - - - 414 Commercial and industrial, non-real estate 31 2,211 7,427 5,543 7,860 227 14 - - 23,313 Consumer 15 - 311 - - - - - - 326 Total loans 59$ 2,801$ 37,779$ 55,210$ 29,303$ 9,019$ 10,050$ -$ -$ 144,221$

26
NOTE 5 - LOANS AND ALLOWANCE FOR LOAN LOSSES (continued)
Loans 90 days past due and still accruing interest requires that such loans are both adequately secured and in process of collection.
December 31, 2015
(Amounts in thousands) Current
30-89 past due and accruing
Greater than 90 and
accruing Nonaccruing TotalReal Estate: Construction and land development 15,363$ -$ 3,095$ 1,756$ 20,214$ 1-4 family residential properties 22,878 386 - - 23,264$ Multifamily residential properties 4,138 - - - 4,138 Non-farm nonresidential properties 72,016 - - 1,659 73,675 Other real estate loans 404 - - - 404 Commercial and industrial, non-real estate 33,010 - - - 33,010 Consumer 434 - - - 434 Total loans 148,243$ 386$ 3,095$ 3,415$ 155,139$
Other real estate owned 12,745 Total nonperforming assets 19,255$
Nonperforming assets as a percentage of: Total assets 7.9% Gross loans 14.4%
Current accruing troubled debt restructurings 9,410$
December 31, 2014
(Amounts in thousands) Current
30-89 past due and accruing
Greater than 90 and
accruing Nonaccruing TotalReal Estate: Construction and land development 23,585$ 35$ -$ 5,096$ 28,716$ 1-4 family residential properties 8,565 - - 560 9,125 Multifamily residential properties 1,704 - - - 1,704 Non-farm nonresidential properties 77,324 254 - 3,045 80,623 Other real estate loans 414 - - - 414 Commercial and industrial, non-real estate 23,299 - - 14 23,313 Consumer 326 - - - 326 Total loans 135,217$ 289$ -$ 8,715 144,221$
Other real estate owned 19,163 Total nonperforming assets 27,878$
Nonperforming assets as a percentage of: Total assets 11.0% Gross loans 19.3%
Current accruing troubled debt restructurings 7,913$

27
NOTE 5 - LOANS AND ALLOWANCE FOR LOAN LOSSES (continued) The $3.095 million in loans in 90 days and accruing at December 31, 2015 represented one loan that was 102 days past due as of December 31, 2015. However, the loan was considered well secured by real estate and was in the process of collection. On January 29, 2016, the borrower made principal payments of $50 thousand and interest payments of $43 thousand. These payments brought the loan current on the outstanding principal and interest balance. Impaired Loans The tables below summarize key information for impaired loans. Our impaired loans include loans on nonaccrual status and loans modified in a TDR, whether on accrual or nonaccrual status. These impaired loans may have estimated impairment which is included in the allowance for loan losses.
(Amounts in thousands)
Unpaid Principal Balance
Impaired Loans
Impaired Loans with
related allowance for
loan losses
Related allowance for loan losses
Interest Income
recognized on impaired
loans
Interest Income
recognized on a cash
basisReal Estate: Construction and land development 7,057$ 6,705$ 1,813$ 172$ 368$ -$ 1-4 family residential properties 1,121 1,121 119 3 76 - Multifamily residential properties 332 238 238 23 18 - Non-farm nonresidential properties 8,423 7,877 4,542 255 329 - Other real estate loans - - - - - - Commercial and industrial, non-real estate 245 231 35 1 25 - Consumer - - - - - - Total 17,178$ 16,172$ 6,747$ 454$ 816$ -$
Unpaid Principal Balance
Impaired Loans
Impaired Loans with
related allowance for
loan losses
Related allowance for loan losses
Interest Income
recognized on impaired
loans
Interest Income
recognized on a cash
basisReal Estate: Construction and land development 8,724$ 7,182$ 1,983$ 236$ 98$ -$ 1-4 family residential properties 828 739 - - 7 127 Multifamily residential properties - - - - - - Non-farm nonresidential properties 10,033 9,054 3,087 272 311 41 Other real estate loans - - - - - - Commercial and industrial, non-real estate 107 93 93 3 7 - Consumer - - - - - - Total 19,692$ 17,068$ 5,163$ 511$ 423$ 168$
Recorded investment
Recorded investment
December 31, 2014
December 31, 2015

28
NOTE 5 - LOANS AND ALLOWANCE FOR LOAN LOSSES (continued) The following table disaggregates our allowance for loan losses and recorded investment in loans by impairment methodology.
Troubled Debt Restructurings The following table summarizes the carrying balance of troubled debt restructurings (“TDRs”) as of December 31, 2015 and 2014:
Loans classified as TDRs may be removed from this status for disclosure purposes after a specified period of time if the restructured agreement specifies an interest rate equal to or greater than the rate that the lender was willing to accept at the time of the restructuring for a new loan with comparable risk, the loan is performing in accordance with the terms specified by the restructured agreement, and certain other conditions are met.
(Amounts in thousands) 2015 2014Individually evaluated $ 454 $ 511 Collectively evaluated 2,076 3,898 Balance, end of year $ 2,530 $ 4,409
December 31,
(Amounts in thousands, except contract data)Troubled Debt Restructurings Performing Nonperforming TotalReal Estate: Construction and land development 1,813 148 1,961 1-4 family residential properties 1,036 - 1,036 Multifamily residential properties 238 - 238 Non-farm nonresidential properties 6,092 1,659 7,751 Other real estate loans - - - Commercial and industrial, non-real estate 231 - 231 Consumer - - - Total 9,410$ 1,807$ 11,217$
Troubled Debt Restructurings Performing Nonperforming TotalReal Estate: Construction and land development 2,086 807 2,893 1-4 family residential properties 89 429 518 Multifamily residential properties - - - Non-farm nonresidential properties 5,659 3,012 8,671 Other real estate loans - - - Commercial and industrial, non-real estate 79 14 93 Consumer - - - Total 7,913 4,262$ 12,175$
December 31, 2015
December 31, 2014

29
NOTE 5 - LOANS AND ALLOWANCE FOR LOAN LOSSES (continued) The following is an analysis of TDRs identified during the year ended December 31, 2015 and 2014:
During the year ended December 31, 2015, we modified five loans that were considered to be troubled debt restructurings. We extended the terms for one of these loans, and for four of these loans we extended the time and reduced the rate.
(Amounts in thousands, except contract data)
Troubled Debt RestructuringsNumber of Contracts
Pre-Modification Outstanding Recorded
Investment
Post-Modification Outstanding Recorded
InvestmentReal Estate: Construction and land development - - - 1-4 family residential properties 3 436 430 Multifamily residential properties - - - Non-farm nonresidential properties 1 1,305 1,295 Other real estate loans - - - Commercial and industrial, non-real estate 1 337 155 Consumer - - - Total 5 2,078$ 1,880$
Troubled Debt RestructuringsNumber of Contracts
Pre-Modification Outstanding Recorded
Investment
Post-Modification Outstanding Recorded
InvestmentReal Estate: Construction and land development - - - 1-4 family residential properties 2 135 119 Multifamily residential properties - - - Non-farm nonresidential properties 3 2,116 2,100 Other real estate loans - - - Commercial and industrial, non-real estate - - - Consumer - - - Total 5 2,251$ 2,219$
December 31, 2015
December 31, 2014

30
NOTE 5 - LOANS AND ALLOWANCE FOR LOAN LOSSES (continued) The following is an analysis of TDRs that subsequently defaulted during the years ended December 31, 2015 and 2014, respectively.
During the year ended December 31, 2015 and 2014, 2 and 1 loans, respectively, that had previously been restructured were in default. Allowance for Loan Losses The allowance for loan losses is management’s estimate of credit losses inherent in the loan portfolio at the balance sheet date. We have an established process to determine the adequacy of the allowance for loan losses that assesses the losses inherent in our portfolio. While we attribute portions of the allowance to specific portfolio segments, the entire allowance is available to absorb credit losses inherent in the total loan portfolio. Our process involves procedures to appropriately consider the unique risk characteristics of our loan portfolio segments. For each portfolio segment, impairment is measured collectively for groups of smaller loans with similar characteristics and individually for larger impaired loans. Our allowance levels are influenced by loan volumes, loan grade migration or delinquency status, historic loss experience, other economic conditions, and historical loss rates. Included in the allowance for loan losses is a component that reflects the margin of imprecision inherent in the underlying assumptions used in the methodologies for estimating specific and general losses in the portfolio. Uncertainties and subjective issues such as changes in lending policies and procedures, changes in local/national economy, changes in volume or type of credits, changes in volume/severity or problem loans, quality of loan review and board of director oversight, concentrations of credit, and peer group comparisons are factors considered.
(Amounts in thousands, except contract data)Troubled Debt Restructurings That Subsequently Defaulted During the Period:
Number of Contracts
Recorded Investments
Real Estate: Construction and land development 1 522$ 1-4 family residential properties - - Multifamily residential properties - - Non-farm nonresidential properties 1 202 Other real estate loans - - Commercial and industrial, non-real estate - - Consumer - - Total 2 724$
Troubled Debt Restructurings That Subsequently Defaulted During the Period:
Number of Contracts
Recorded Investments
Real Estate: Construction and land development - -$ 1-4 family residential properties - - Multifamily residential properties 1 399 Non-farm nonresidential properties - - Other real estate loans - - Commercial and industrial, non-real estate - - Consumer - - Total 1 399$
December 31, 2015
December 31, 2014

31
NOTE 5 - LOANS AND ALLOWANCE FOR LOAN LOSSES (continued) The following table summarizes the activity related to our allowance for loan losses.
In the normal course of business the Company makes loans to its executive officers and directors and their related interests. Such loans are made on substantially the same terms, including interest rates and collateral, as those prevailing at the time for comparable transactions with other persons and do not involve more than normal risk of collectability or present other unfavorable features. Activity with respect to such loans is summarized as follows:
(Amounts in thousands)2015 2014
Balance, beginning of period 4,409$ 5,069$ Recovery of loan loss provision (2,000) - Loan charge-offs:Real Estate: Construction and land development 133$ 682$ 1-4 family residential properties 112 89 Multifamily residential properties - 103 Non-farm nonresidential properties 179 20 Other real estate loans - - Commercial and industrial, non-real estate 197 6 Consumer - - Total loan charge-offs 621 900 Loan recoveries:Real Estate: Construction and land development 264$ -$ 1-4 family residential properties 297 99 Multifamily residential properties - - Non-farm nonresidential properties 90 - Other real estate loans - - Commercial and industrial, non-real estate 91 141 Consumer - - Total recoveries 742 240 Net loan charge-offs (recoveries) (121) 660 Balance, end of period 2,530$ 4,409$ Net charge-offs (recoveries) to average loans (0.08%) 0.41%Allowance for loan losses to gross loans 1.63% 3.06%Allowance for loan losses to nonperforming loans 38.86% 50.59%
December 31,
32
NOTE 5 - LOANS AND ALLOWANCE FOR LOAN LOSSES (continued)
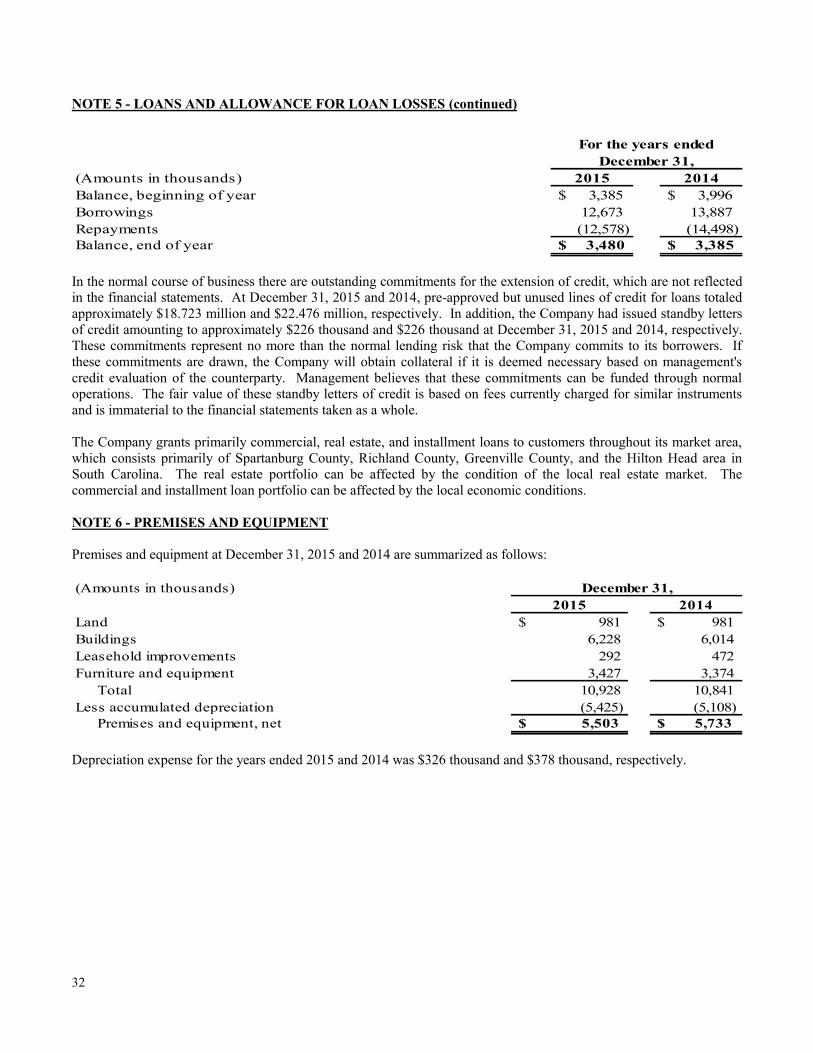
In the normal course of business there are outstanding commitments for the extension of credit, which are not reflected in the financial statements. At December 31, 2015 and 2014, pre-approved but unused lines of credit for loans totaled approximately $18.723 million and $22.476 million, respectively. In addition, the Company had issued standby letters of credit amounting to approximately $226 thousand and $226 thousand at December 31, 2015 and 2014, respectively. These commitments represent no more than the normal lending risk that the Company commits to its borrowers. If these commitments are drawn, the Company will obtain collateral if it is deemed necessary based on management's credit evaluation of the counterparty. Management believes that these commitments can be funded through normal operations. The fair value of these standby letters of credit is based on fees currently charged for similar instruments and is immaterial to the financial statements taken as a whole. The Company grants primarily commercial, real estate, and installment loans to customers throughout its market area, which consists primarily of Spartanburg County, Richland County, Greenville County, and the Hilton Head area in South Carolina. The real estate portfolio can be affected by the condition of the local real estate market. The commercial and installment loan portfolio can be affected by the local economic conditions. NOTE 6 - PREMISES AND EQUIPMENT Premises and equipment at December 31, 2015 and 2014 are summarized as follows:
Depreciation expense for the years ended 2015 and 2014 was $326 thousand and $378 thousand, respectively.
(Amounts in thousands) 2015 2014Balance, beginning of year $ 3,385 $ 3,996 Borrowings 12,673 13,887 Repayments (12,578) (14,498)Balance, end of year $ 3,480 $ 3,385
For the years ended December 31,
(Amounts in thousands)2015 2014
Land $ 981 $ 981 Buildings 6,228 6,014 Leasehold improvements 292 472 Furniture and equipment 3,427 3,374 Total 10,928 10,841 Less accumulated depreciation (5,425) (5,108) Premises and equipment, net $ 5,503 $ 5,733
December 31,

33
NOTE 7 – OTHER REAL ESTATE OWNED The following summarizes the activity in other real estate owned:
NOTE 8 - DEPOSITS A summary of deposit accounts at December 31, 2015 and 2014 follows:
At December 31, 2015 and 2014, respectively, the Company had no brokered deposits. Under the terms of the Consent Order the Company cannot renew or accept brokered deposits, and it must also operate under rate restrictions that limit deposit rates to no more than 75 basis points above the average rates in the markets in which the Company operates. At December 31, 2015, the scheduled maturities of time deposits are as follows:
Directors and executive officers were customers of and had transactions with the Bank in the ordinary course of business. Included in such transactions are deposit accounts, all of which were made under normal terms. The aggregate amount of these deposit accounts was $1.322 million and $1.809 million at December 31, 2015 and 2014, respectively.
(Amounts in thousands)2015 2014
Balance, beginning of year $ 19,163 $ 26,079 Additions 2,234 309 Sales (8,066) (5,612)Write-downs (586) (1,613)Balance, end of year $ 12,745 $ 19,163
For the years ended December 31,
(Amounts in thousands)2015 2014
Demand Non-interest bearing $ 7,837 $ 10,536 Interest bearing 18,378 19,725 Savings 64,645 73,092 Time, $250,000 and over 14,446 14,774 Other time, less than $250,000 105,572 110,281
$ 210,878 $ 228,408
December 31,
(Amounts in thousands)2016 $ 94,323 2017 23,845 2018 1,449 2019 401 2020 -
$ 120,018

34
NOTE 9 – OTHER BORROWED FUNDS Other borrowed funds consisted of advances from the FHLB and borrowings from AloStar. Advances from the FHLB and borrowings from AloStar consisted of the following at December 31, 2015 and 2014:
As collateral for all outstanding advances, the Company pledges securities and loan collateral. At December 31, 2015 the Company had pledged securities and loan collateral at the FHLB with a lendable collateral value of $1.884 million and $23.564 million, respectively, with a remaining availability of $4.318 million, and at the Federal Reserve Discount window the Company had pledged securities with a market value of $179 thousand with a remaining availability of $179 thousand to be used only for daylight overdrafts only in the event of the Bank being taken into receivership. The Consent Order agreed to between the Bank and its primary regulators gave rise to the inability of the Bank to create a daily overdraft position at the Federal Reserve. The securities pledged are intended to prevent an overdraft occurrence. Availability at the FHLB and the Discount Window is affected by bank regulatory capital ratios and an official enforcement action from a bank regulator. These restrictions have limited future advances from the FHLB to the excess of pledged securities over the current advances outstanding less the fair market value adjustment of those advances. The Bank also has a Secured Federal Funds Accommodation Agreement with AloStar Bank of Commerce in the amount of $4 million and at a rate of 75 basis points with a remaining availability of $2.605 million. At December 31, 2015 the Bank had securities pledged against this line with a market value of $6.513 million to cover the line and the overnight balances the Bank holds with AloStar for overnight clearing. During 2015 the Company borrowed and repaid short-term advances from the Federal Home Loan Bank in the amount of $12 million and $7 million, respectively, at a range of 20 basis points to 54 basis points, and during 2014 the Company borrowed and repaid $3.5 million at a range of 16 basis points to 21 basis points. The Company also borrowed and repaid short-term advances from AloStar Bank of Commerce during 2015 in the amount of $2.664 million and $1.269 million, respectively, at a range of 50 basis points to 75 basis points. NOTE 10 – JUNIOR SUBORDINATED DEBENTURES In January 2004, the Company formed a wholly-owned Delaware statutory business trust, FSBS Capital Trust I (the "Trust"), which issued $5 million of guaranteed preferred beneficial interests in the Company's junior subordinated deferrable interest debentures (the "Trust Preferred Securities"). These debentures qualify as Tier I capital. All of the common securities of the Trust are owned by the Company. The proceeds from the issuance of the common securities and the Trust Preferred Securities were used by the Trust to purchase from the Company $5.155 million of junior subordinated debentures of the Company which carry a variable interest rate of 3 Month LIBOR plus 2.8 percent per annum. The junior subordinated debentures represent the sole asset of the Trust. In accordance with ASC 810 - Consolidation, the Trust is not consolidated with the financial statements of the Company.
(Amounts in thousands) Interest Interest Description Rate Balance Rate Balance
Fixed rate, convertible advances maturing: April 5, 2017 4.115% $ 10,000 4.115% $ 10,000 April 5, 2017 4.060% 5,000 4.060% 5,000 Daily rate credit advances: Various 0.540% 5,000 - AloStar 0.750% 1,395 -
$ 21,395 $ 15,000
2015 2014

35
NOTE 10 – JUNIOR SUBORDINATED DEBENTURES (continued) The Company has entered into contractual arrangements which, taken collectively, fully guarantee payment of (i) accrued and unpaid distributions required to be paid on the Trust Preferred Securities; (ii) the redemption price with respect to any Trust Preferred Securities called for redemption by the Trust, and (iii) payments due upon a voluntary or involuntary dissolution, winding up or liquidation of the Trust. The Trust Preferred Securities are mandatorily redeemable upon maturity of the debentures in January 2034 or upon earlier redemption as provided in the indenture. The Company has the right to redeem the debentures purchased by the Trust in whole or in part, at any time, however if they are redeemed before the fifth anniversary, the cost would be 105 percent of the par value of the securities. The debentures may be redeemed after the fifth anniversary at par. On October 6, 2015, the deferred interest of $944 thousand, which has accumulated over the past twenty quarters, was paid on behalf of the Company by a group of individuals who are also considered related parties. There is no obligation by the Company to reimburse these individuals for the amount of accrued interest paid. On October 26, 2015, the Company invoked its right to defer the interest payment due. The Company has a right to defer for 20 quarters. The notice to defer on the 26th of October will expire January 7, 2016. After this, the Company will have nineteen remaining periods to defer. NOTE 11 – STOCKHOLDERS’ EQUITY Preferred Stock – The Series A Preferred Stock has senior rights over common stock with regards to dividends and rights upon liquidation. Unlike common stock, the Series A Preferred Stock will not have voting rights except under very limited circumstances. Holders of Series A Preferred Stock are entitled to receive, when and if declared by the Company, a dividend premium of 5% on any cash dividends declared. Stock Offering – On November 30, 2013, the Company initiated a stock offering in the form of a Private Placement Memorandum. The Company offered up to 11,428,572 shares of its common stock at a purchase price of $0.35 per share for an aggregate offering amount of up to $4 million. The offering expired on February 28, 2014 and resulted in gross proceeds of $2.196 million for subscriptions of 6,274,431 shares. The Company anticipates another stock offering in 2016 or 2017 to meet the capital requirements as set forth under the Consent Order. NOTE 12 - REGULATORY CAPITAL REQUIREMENTS The Company and the Bank are subject to various regulatory capital requirements administered by the federal banking agencies. Failure to meet minimum capital requirements can initiate certain mandatory and possibly additional discretionary actions by regulators that, if undertaken, could have a material effect on the Company’s financial statements. Under capital adequacy guidelines and the regulatory framework for prompt corrective action, the Company and the Bank must meet specific capital guidelines that involve quantitative measures of the Company’s and the Bank’s assets, liabilities, and certain off-balance-sheet items as calculated under regulatory accounting practices. The Company’s and the Bank’s capital amounts and classifications are also subject to qualitative judgments by the regulators about components, risk weightings, and other factors. Quantitative measures established by regulation to ensure capital adequacy require the Bank to maintain minimum ratios (set forth in the table below) of Tier 1, Common Equity Tier 1 (CET1), and total capital as a percentage of assets and off-balance-sheet exposures, adjusted for risk-weights ranging from 0% to 150%. Tier 1 capital of the Bank consists of common stockholders’ equity, excluding the unrealized gain or loss on securities available-for-sale, minus certain intangible assets, while CET1 is comprised of Tier 1 capital, adjusted for certain regulatory deductions and limitations. Tier 2 capital consists of the allowance for loan losses subject to certain limitations. Total capital for purposes of computing the capital ratios consists of the sum of Tier 1 and Tier 2 capital. The Company and the Bank are also required to maintain capital at a minimum level based on average assets (as defined), which is known as the leverage ratio. Only the strongest institutions are allowed to maintain capital at the minimum requirement. All others are subject to maintaining ratios 1% to 2% above the minimum.

36
NOTE 12 - REGULATORY CAPITAL REQUIREMENTS (continued) Effective March 31, 2015, quantitative measures established by applicable regulatory standards, including the newly implemented Basel III revised capital adequacy standards and relevant provisions of the Dodd-Frank Wall Street Reform and Consumer Protection Act (“Dodd Frank Act”), require the Bank to maintain (i) a minimum ratio of Tier 1 capital to average total assets, after certain adjustments, of 4.00%, (ii) a minimum ratio of Tier 1 capital to risk-weighted assets of 6.00%, (iii) a minimum ratio of total-capital to risk-weighted assets of 8.00% and (iv) a minimum ratio of CET1 to risk-weighted assets of 4.50%. A “well-capitalized” institution must generally maintain capital ratios 2% higher than the minimum guidelines. In order to avoid restrictions on capital distributions or discretionary bonus payments to executives, the Bank will also be required to maintain a “capital conservation buffer” in addition to its minimum risk-based capital requirements. This buffer will be required to consist solely of CET1, but the buffer will apply to all three risk-based measurements (CET1, Tier 1 and total capital). The capital conservation buffer will be phased in incrementally over time, beginning January 1, 2016 and becoming fully effective on January 1, 2019, and will ultimately consist of an additional amount of Tier 1 capital equal to 2.5% of risk-weighted assets. As of December 31, 2015, the Bank’s Tier 1 capital ratios were “adequately capitalized”, and it’s Risk Weighted Asset Ratio was “significantly undercapitalized”. In addition, due to the impact of the current economic environment on the Bank, in accordance with the Consent Order, we have developed a capital plan through which we intend to regain our “well-capitalized” designation. Our capital plan outlines how we intend to regain our “well-capitalized” capital position by raising additional capital. Although we raised some capital in 2013 and 2014, we are continuing to explore a number of alternatives to strengthen the capital levels of the Bank. However, if we fail to maintain these required capital levels, then the FDIC may deem noncompliance to be an unsafe and unsound banking practice which may make the Bank subject to additional regulatory requirements. To be categorized well capitalized, the Bank must maintain total risk-based, Tier 1 risk-based, and Tier 1 leverage ratios as set forth in the table below.
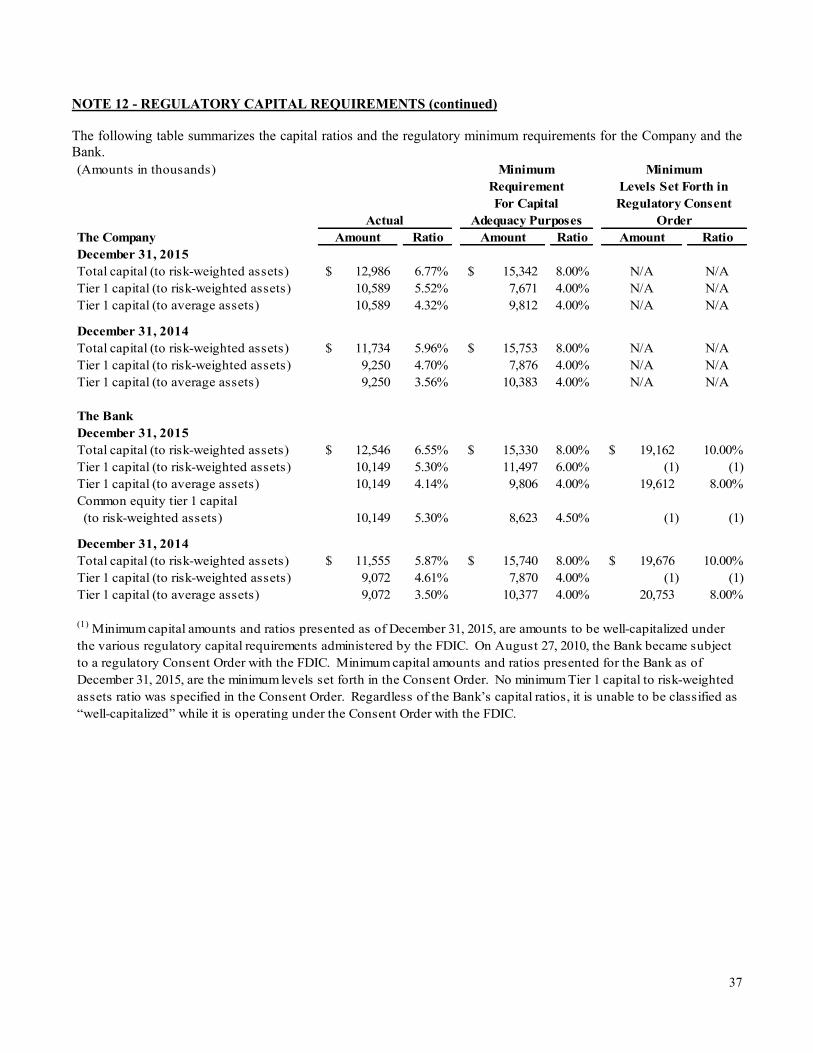
37
NOTE 12 - REGULATORY CAPITAL REQUIREMENTS (continued) The following table summarizes the capital ratios and the regulatory minimum requirements for the Company and the Bank.
(Amounts in thousands)
The Company Amount Ratio Amount Ratio Amount RatioDecember 31, 2015Total capital (to risk-weighted assets) 12,986$ 6.77% 15,342$ 8.00% N/A N/ATier 1 capital (to risk-weighted assets) 10,589 5.52% 7,671 4.00% N/A N/ATier 1 capital (to average assets) 10,589 4.32% 9,812 4.00% N/A N/A
December 31, 2014Total capital (to risk-weighted assets) 11,734$ 5.96% 15,753$ 8.00% N/A N/ATier 1 capital (to risk-weighted assets) 9,250 4.70% 7,876 4.00% N/A N/ATier 1 capital (to average assets) 9,250 3.56% 10,383 4.00% N/A N/A
The BankDecember 31, 2015Total capital (to risk-weighted assets) 12,546$ 6.55% 15,330$ 8.00% 19,162$ 10.00%Tier 1 capital (to risk-weighted assets) 10,149 5.30% 11,497 6.00% (1) (1) Tier 1 capital (to average assets) 10,149 4.14% 9,806 4.00% 19,612 8.00%Common equity tier 1 capital (to risk-weighted assets) 10,149 5.30% 8,623 4.50% (1) (1)
December 31, 2014Total capital (to risk-weighted assets) 11,555$ 5.87% 15,740$ 8.00% 19,676$ 10.00%Tier 1 capital (to risk-weighted assets) 9,072 4.61% 7,870 4.00% (1) (1) Tier 1 capital (to average assets) 9,072 3.50% 10,377 4.00% 20,753 8.00%
(1) Minimum capital amounts and ratios presented as of December 31, 2015, are amounts to be well-capitalized under the various regulatory capital requirements administered by the FDIC. On August 27, 2010, the Bank became subject to a regulatory Consent Order with the FDIC. Minimum capital amounts and ratios presented for the Bank as of December 31, 2015, are the minimum levels set forth in the Consent Order. No minimum Tier 1 capital to risk-weighted assets ratio was specified in the Consent Order. Regardless of the Bank’s capital ratios, it is unable to be classified as “well-capitalized” while it is operating under the Consent Order with the FDIC.
MinimumLevels Set Forth inRegulatory Consent
Actual Adequacy PurposesFor Capital
Order
RequirementMinimum

38
NOTE 13 - INCOME TAXES The provision (benefit) for income taxes is summarized below:
The reasons for the difference between the statutory federal income tax rates and the effective tax rates are summarized as follows for:
(Amounts in thousand) 2015 2014Current Federal $ - $ - State 19 20
19 20 Deferred Federal - - State - -
- -
Total income taxes $ 19 $ 20
December 31,
2015 2014Statutory rates 34.0% 34.0%Increase (decrease) resulting from:State taxes, net of federal benefit 0.80% (1.1%)Life insurance (6.7%) 7.50%Valuation allowance on deferred income taxes (29.4%) (41.6%)Other, net 2.50% (0.5%)
1.2% (1.70%)
For the years ended December 31,

39
NOTE 13 - INCOME TAXES (continued) The tax effects of temporary differences result in deferred tax assets and liabilities as presented below:
Deferred tax assets represent the future tax benefit of deductible items. The Company, under the current Internal Revenue Code, is allowed an up to two year carryback and a twenty year carryforward of these timing items. A valuation allowance is established if it is more likely than not that a tax asset will not be realized. The valuation allowance reduces the recorded deferred tax assets to a net realizable value. As of December 31, 2015, management has established a valuation allowance of approximately $12 million to reflect the portion of the deferred income tax asset that is not able to be offset against refundable income taxes and reversals of net future taxable temporary differences projected to occur in 2016. When the Company generates future taxable income, it will be able to reevaluate the amount of the valuation allowance. The Company has a federal net operating losses for income tax purposes of $31.0 million and a net operating loss for state income tax purposes of $188 thousand, respectively at December 31, 2015. These net operating losses will begin to expire in the year 2031. Tax returns for 2012 and subsequent years are subject to examination by taxing authorities. The Company has analyzed the tax positions taken or expected to be taken in its tax returns and concluded it has no liability related to uncertain tax positions in accordance with ASC 740 – Income Taxes.
(Amounts in thousand) 2015 2014Deferred tax assets Net operating loss carryforward $ 10,574 $ 9,741 Allowance for loan losses - 69 Non-accrual loans - 8 Deferred compensation 274 254 Available for sale securities 363 322 Other real estate 1,709 2,351 Tax credits 83 90 Other 11 8
Gross deferred tax assets 13,014 12,843
Less valuation allowance 11,415 11,773
Net deferred tax assets 1,599 1,070 Deferred tax liabilities Allowance for loan losses (611) - Depreciation (106) (147) Settlement receivable (794) (794) Prepaid expenses (88) (129)
Gross deferred liabilities (1,599) (1,070)
Net $ - $ -
December 31,

40
NOTE 14 - COMMITMENTS AND CONTINGENCIES The Company leases the land and building for certain branches under operating leases. Future minimum lease payments at December 31, 2015, are as follows:
Total lease expense was $93 thousand and $168 thousand for 2015 and 2014, respectively. The Company is subject to legal proceedings and claims which arise in the ordinary course of business. In the opinion of management, the disposition of these claims will not have a material adverse impact on the financial position or results of operations of the Company. NOTE 15 - RESTRICTIONS ON DIVIDENDS, LOANS AND ADVANCES Federal and state banking regulations place certain restrictions on dividends paid and loans or advances made by the Bank to the Corporation. The total amount of cash dividends, which may be paid at any date without prior regulatory consent, is generally limited to the year's net income of the Bank provided the Bank received a composite rating of one or two at the last examination conducted by the federal or state regulatory authority, and loans or advances are limited to 10 percent of the Bank's common stock and surplus on a secured basis. In addition, cash dividends paid by the Bank to the Corporation would be prohibited if the effect would cause the Bank's capital to be reduced below applicable minimum regulatory capital requirements. South Carolina banking regulations require that cash dividends paid to shareholders receive the prior written approval of the Commissioner of Banking. However, the Bank is authorized to pay cash dividends up to 100% of net income in any calendar year without obtaining the prior approval of the Commissioner of Banking provided that the Bank received a composite rating of one or two at the last Federal or State regulatory examination. Under Federal Reserve Board regulations, the amounts of loans or advances from the Bank to the parent company are also restricted. No dividends were paid in 2015 or 2014. NOTE 16 - EMPLOYEE BENEFIT PLANS 401(k) Plan - All employees of the Company who meet certain eligibility criteria are permitted to participate in a 401(k) plan. For each employee's contribution up to 6 percent of compensation, the Company makes a 100 percent matching contribution. Expense related to this plan was $153 thousand and $159 thousand in 2015 and 2014, respectively. Salary Continuation Plan - During 1999 and 2008, the Company entered into a salary continuation agreement with certain officers and directors of the Company. The 1999 plan provides for a series of payments over a specified number of periods to these employees upon their retirement or termination as stated in the plan. The amount of accrued benefit expense for the 1999 plan included in other liabilities was $804 thousand at December 31, 2015 and $747 thousand at December 31, 2014.
(Amounts in thousands)2016 $ 76 2017 70 2018 26
172$

41
NOTE 17 - STOCK OPTIONS The Company has issued incentive stock options to certain officers and employees. The following is a summary of stock option activity and related information for the years ended December 31, 2015 and 2014:
Exercise prices for options outstanding as of December 31, 2014 ranged from $12.98 to $15.83. The weighted average remaining contractual life of those options is approximately 0.47 years at December 31, 2014. All options expired or were forfeited in 2015. No shares vested during the years ended December 31, 2015 and 2014. As of December 31, 2015 there were no options outstanding. NOTE 18 - FAIR VALUE OF FINANCIAL INSTRUMENTS The Company follows ASC 820 “Fair Value Measurements,” which defines fair value, establishes a framework for measuring fair value under accounting principles generally accepted in the United States, and enhances disclosures about fair value measurements. The Company elected to delay the application of ASC 820 to nonfinancial assets and nonfinancial liabilities, as allowed by Financial Accounting Standards Board Staff Position SFAS 157-2. ASC 820 applies whenever other standards require (or permit) assets or liabilities to be measured at fair value and, therefore, does not expand the use of fair value in any new circumstances. Fair value is defined as the exchange price that would be received to sell an asset or paid to transfer a liability in the principal or most advantageous market for the asset or liability in an orderly transaction between market participants on the measurement date. ASC 820 clarifies that fair value should be based on the assumptions market participants would use when pricing an asset or liability and establishes a fair value hierarchy that prioritizes the information used to develop those assumptions. The fair value hierarchy gives the highest priority to quoted prices in active markets and the lowest priority to unobservable data. ASC 820 requires fair value measurements to be separately disclosed by level within the fair value hierarchy. Under ASC 820, the Company bases fair values on the price that would be received to sell an asset or paid to transfer a liability in an orderly transaction between market participants at the measurement date. For assets and liabilities recorded at fair value, it is the Company’s policy to maximize the use of observable inputs and minimize the use of unobservable inputs when developing fair value measurements, in accordance with the fair value hierarchy in ASC 820. Fair value measurements for assets and liabilities where there exists limited or no observable market data and, therefore, are based primarily upon estimates, are often calculated based on the economic and competitive environment, the characteristics of the asset or liability and other factors. Therefore, the results cannot be determined with precision and may not be realized in an actual sale or immediate settlement of the asset or liability. Additionally, there may be inherent weaknesses in any calculation technique, and changes in the underlying assumptions used, including discount rates and estimates of future cash flows, could significantly affect the results of current or future values.
Weighted WeightedAverage AverageExercise Exercise
Options Price Options PriceOutstanding at beginning of year 1,692 14.71$ 2,172 14.25$ Granted - - - - Forfeited (1,692) 14.05 (480) 12.66 Exercised - - - - Outstanding at end of year - -$ 1,692 14.71$
Exercisable, end of period - -$ 1,692 14.71$
2015 2014

42
NOTE 18 - FAIR VALUE OF FINANCIAL INSTRUMENTS (continued) The Company utilizes fair value measurements to record fair value adjustments to certain assets and liabilities and to determine fair value disclosures. Securities available-for-sale are recorded at fair value on a recurring basis. Additionally, from time to time, the Company may be required to record at fair value other assets on a nonrecurring basis, such as loans held for sale, loans held for investment and certain other assets. These nonrecurring fair value adjustments typically involve application of lower of cost or market accounting or write-downs of individual assets. Under ASC 820, the Company groups assets and liabilities at fair value in three levels, based on the markets in which the assets and liabilities are traded and the reliability of the assumptions used to determine fair value. These levels are: Level 1 — Valuations for assets and liabilities traded in active exchange markets, such as the New York Stock Exchange. The Company has no Level 1 assets or liabilities at December 31, 2015 and 2014. Level 2 — Valuations are obtained from readily available pricing sources via independent providers for market transactions involving similar assets or liabilities. The Company’s principal market for these securities is the secondary institutional markets and valuations are based on observable market data in those markets. Level 2 securities include U. S. Government agency obligations, state and local obligations and mortgage-backed securities. Level 3 — Valuations for assets and liabilities that are derived from other valuation methodologies, including option pricing models, discounted cash flow models and similar techniques, and not based on market exchange, dealer, or broker traded transactions. Level 3 valuations incorporate certain assumptions and projections in determining the fair value assigned to such assets or liabilities. Investment Securities Available-for-Sale Investment securities available-for-sale are recorded at fair value on a recurring basis. Fair value measurement is based upon quoted prices, if available. If quoted prices are not available, fair values are measured using independent pricing models or other model-based valuation techniques such as the present value of future cash flows, adjusted for the security’s credit rating, prepayment assumptions and other factors such as credit loss assumptions. Level 1 securities include those traded on an active exchange, such as the New York Stock Exchange, U.S. Treasury securities that are traded by dealers or brokers in active over-the-counter markets and money market funds. Level 2 securities include mortgage-backed securities issued by government sponsored entities, municipal bonds and corporate debt securities. Securities classified as Level 3 include asset-backed securities in less liquid markets. Loans The Company does not record loans at fair value on a recurring basis. However, from time to time, a loan is considered impaired and the established allowance for loan losses is evaluated for what portion of the allowance should be identified with the impaired loan. Loans for which it is probable that payment of interest and principal will not be made in accordance with the contractual terms of the loan agreement are considered impaired. Once a loan is identified as individually impaired, management measures impairment in accordance with ASC 310, “Accounting by Creditors for Impairment of a Loan.” The fair value of impaired loans is estimated using one of several methods, including collateral value, market value of similar debt, enterprise value, liquidation value and discounted cash flows. Those impaired loans not requiring an allowance represent loans for which the fair value of the expected repayments or collateral exceed the recorded investments in such loans. At December 31, 2015, substantially all of the total impaired loans were evaluated based on the fair value of the collateral or using discounted cash flow methods. In accordance with ASC 820, impaired loans, where an allowance is established based on the fair value of collateral, require classification in the fair value hierarchy. When the fair value of the collateral is based on an observable market price or a current appraised value, the Company records the impaired loan as nonrecurring Level 2. When an appraised value is not available or management determines the fair value of the collateral is further impaired below the appraised value and there is no observable market price, the Company records the impaired loan as nonrecurring Level 3. As of December 31, 2015 the Company

43
NOTE 18 – FAIR VALUE OF FINANCIAL INSTRUMENTS (continued) had $3.415 million of loans in nonaccrual status. The following table summarizes the Company’s financial instruments that were measured at fair value as of December 31, 2015 and 2014, respectively. Recurring:
Nonrecurring:
(Dollars in thousands)Description of Financial Instrument December 31, 2015 Level 1 Level 2 Level 3
U.S. government agency obligations $ 2,879 $ - $ 2,879 $ - Government sponsored enterprises 27,641 - 27,641 - Mortgage-backed securities 22,139 - 22,139 - Municipal taxable securities 513 - 513 - Restricted FHLB stock 1,078 - 1,078 -
Securities Available for Sale $ 54,250 $ - $ 54,250 $ -
(Dollars in thousands)Description of Financial Instrument December 31, 2014 Level 1 Level 2 Level 3
U.S. government agency obligations $ 4,943 $ - $ 4,943 $ - Government sponsored enterprises 30,605 - 30,605 - Mortgage-backed securities 25,466 - 25,466 - Municipal taxable securities 512 512 Restricted FHLB stock 1,027 - 1,027 -
Securities Available for Sale $ 62,553 $ - $ 62,553 $ -
(Dollars in thousands)Description of Financial Instrument December 31, 2015 Level 1 Level 2 Level 3
Impaired loans $ 16,172 $ - $ 16,172 $ - Other real estate owned 12,745 - - 12,745
(Dollars in thousands)Description of Financial Instrument December 31, 2014 Level 1 Level 2 Level 3
Impaired loans $ 17,068 $ - $ 17,068 $ - Other real estate owned 19,163 - - 19,163

44
NOTE 19 – EARNINGS (LOSS) PER COMMON SHARE (EPS) The schedule below shows the allocation of earnings to each class of stock.
The reconciliation of the numerators and denominators of the earnings per common share and diluted EPS computation follows.
There were no options to purchase shares of common stock outstanding as of December 31 2015. Options to purchase 1,680 shares of common stock with prices ranging from $11.77 to $15.83 per share were not included in the computation of diluted earnings per share for 2014 because the options' exercise price was greater than the average market price of common shares.
(Dollars in thousands, except share information)
For the year ended December 31, 2015
Weighted Average Shares
Percent of Total
Net income allocable to each class
Weighted average of Common shares outstanding 10,441,237 98.4% $ 1,317 Weighted average of Series A Preferred shares outstanding 155,630 1.6% 22 Total 10,596,867 1,339
For the year ended December 31, 2014
Weighted Average Shares
Percent of Total
Net Loss allocable to each class
Weighted average of Common shares outstanding 9,715,189 98.4% $ (1,221)Weighted average of Series A Preferred shares outstanding 155,630 1.6% (20) Total 9,870,819 (1,241)
Income (Loss)
Weighted Average Shares Per Share
For the year ending December 31, 2015 (Numerator)* (Denominator) AmountIncome per common share:Income available to common stockholders $ 1,317 10,441,237 $ 0.13 Dilutive effect of stock options - - - Diluted EPS:Income available to common stockholders and assumed conversions $ 1,317 10,441,237 $ 0.13
For the year ending December 31, 2014Income per common share:Income available to common stockholders $ (1,220) 9,715,189 $ (0.13)Dilutive effect of stock options - - - Diluted EPS:Income available to common stockholders and assumed conversions $ (1,220) 9,715,189 $ (0.13)
* (Dollars in thousands)

45
NOTE 20 - CONDENSED FINANCIAL STATEMENTS OF PARENT COMPANY Financial information pertaining to First South Bancorp, Inc. is as follows:
(Amounts in thousands) 2015 2014Assets Cash 363$ 862$ Investment in Trust (Note 10) 155 155 Investment in common stock of the Bank 9,082 8,123 Other assets 116 116
Total assets 9,716$ 9,256$
Liabilities and Stockholders’ Equity Junior subordinated debentures (Note 10) 5,155$ 5,155$ Accrued interest on junior subordinated debentures 40 799 Stockholders’ equity 4,521 3,302
Total liabilities and stockholders' equity 9,716$ 9,256$
(Amounts in thousands) 2015 2014
Operating income - gain on extinguishment of debt 944$ -$
Other expense 183 226
Income (Loss) before equity in undistributed net income (loss) of the Bank 761 (226)
Equity in undistributed net income (loss) of the Bank 578 (1,015)
Net income (loss) 1,339 (1,241)
Net income (loss) attributable to preferred shareholders 22 (21) Net income (loss) attributable to common shareholders 1,317$ (1,220)$
For the years ended December 31,
Condensed Balance Sheets
Condensed Statements of Operations
December 31,

46
NOTE 20 - CONDENSED FINANCIAL STATEMENTS OF PARENT COMPANY (continued)
NOTE 21 – SETTLEMENT OF LITIGATION On September 30, 2013, a civil judgment was awarded in favor of First South Bank in the amount of $2,368,232.46 in actual damages, $396,000.00 in punitive damages, and $24,000 in taxable costs. The total judgment entered with costs is $2,788,232.46, with post judgment interest at the rate of .11%. The Bank brought suit against a third party (the “Lead Bank”) for breach of contract and fraud arising from misrepresentations and wrongful conduct committed by the Lead Bank. The lawsuit concerned a participation interest of an $11,000,000 residential development loan between the Bank and the Lead Bank. The third party was the lead bank and the Bank was the participant bank. On January 8, 2016, the Company collected $2,803,157 in full settlement of this suit. NOTE 22 – SUBSEQUENT EVENTS Subsequent events are events or transactions that occur after the balance sheet date but before financial statements are issued. Recognized subsequent events are events or transactions that provide additional evidence about conditions that existed at the date of the balance sheet, including the estimates inherent in the process of preparing financial statements. Nonrecognized subsequent events are events that provide evidence about conditions that did not exist at the date of the balance sheet but arose after that date. Management has reviewed events occurring through the date of the auditor’s opinion, and no subsequent events have occurred requiring accrual or disclosure in addition to that included herein. As noted above, the Company collected $2,803,157 in full settlement of the litigation receivable on the balance sheet on January 8, 2016.
(Amounts in thousands) 2015 2014Operating ActivitiesNet income (loss) 1,339$ (1,241)$ Equity in undistributed income (loss) ofthe Bank (578) 1,015 Net change in other accrued expenses (760) 226 Proceeds of stock offering, net - 2,196 Capital contributions to Bank (500) (1,500) Net cash provided (used) by operating activities (499) 696 Net increase (decrease) in cash and cash equivalents (499) 696 Cash and cash equivalents, beginning of year 862 166 Cash and cash equivalents, end of year 363$ 862$
For the years ended December 31,
Condensed Statements of Cash Flows

47
SHAREHOLDER INFORMATION Market for Common Stock First South Bancorp, Inc. common stock is traded on the OTC Bulletin Board under the symbol FSBS. As of March 14, 2016, there were approximately 267 shareholders of record of the Company’s common stock. The number of shareholders of record does not reflect the number of person or entities who hold the stock in nominee or “street” name through various brokerage firms.
There is currently no well-established public trading market in the common stock and the trading and quotations of the common stock have been limited. To the extent to which management is aware, during 2015 the Company’s stock had a low and high bid price of $0.65 and $1.78, respectively. However, management has not ascertained that these bid prices were indicative of the market value of the common stock.
The Company has never paid any cash dividends, and to support its continued capital growth, does not expect to pay cash dividends in the near future. The ability of the Company to pay cash dividends is dependent on receiving cash in the form of dividends from our Bank. However, all of the Bank’s cash dividends to shareholders are subject to the prior approval of the South Carolina Commissioner of Banking. Registered Market Makers Stock Transfer Agent and Registrar Janney Montgomery Scott, Inc. Computershare FIG Partners, LLC 480 Washington Boulevard, 29th Floor Jersey City, New Jersey 07310 1-800-942-5909 Annual Meeting
The Annual Meeting of Shareholders will be held at the Company’s First South Center offices (next to the Bank’s Main Office) located at 1460 John B. White, Sr. Blvd., Spartanburg, S.C. 29306 at 1:00 P.M. on Wednesday, April 27, 2016. All common shareholders of record as of March 14, 2016, are eligible to attend and vote. All preferred shareholders are invited to attend the meeting.

48
FDIC DISCLOSURE
This statement has not been reviewed, or confirmed for accuracy or relevance, by the Federal Deposit Insurance Corporation.