first quarter · the market for nbsk pulp remained strong in the quarter with benchmark prices...
TRANSCRIPT

2014FIRST QUARTER
CA
TALY
ST P
APE
R 20
14 F
IRST
QU
ART
ER R
EPO
RT

Headquartered in Richmond, British Columbia (B.C.), Catalyst Paper employs 1,611 people and operates three mills and a distribution facility on Canada’s Pacific coast. Our combined annual production capacity of 1.5 million tonnes meets the needs of customers, including retailers, publishers, commercial printers, and manufacturers who use our pulp, in North America, Latin America, the Pacific Rim and Europe.
We have earned a reputation for environmental stewardship based on our commitment to certified fibre sourcing, manufacturing efficiency, verified chain of custody and environmentally responsible paper operations. A public company, Catalyst’s shares trade on the Toronto Stock Exchange (TSX) under the symbol CYT.

PRESIDENT’S MESSAGE
We achieved strong operating results in the first quarter of 2014 due to gains in machine productivity, higher pulp prices, and further depreciation of the Canadian dollar. Adjusted earnings before interest, tax, depreciation and amortization (EBITDA) were $25.7 million compared to $19.1 million in Q4 2013. We generated positive free cash flow for the third consecutive quarter of $11.6 million and ended Q1 with total liquidity of $160.7 million.
Revenues for the quarter of $273.9 million were negatively impacted by an extended container truck driver strike at Port Metro Vancouver. The strike resulted in lower paper sales of approximately 8,000 tonnes and incremental distribution costs of $0.8 million. I was impressed by the resourcefulness of our delivery teams in identifying alternative transportation routes to ensure timely product delivery to our customers and minimize the sales impact for the quarter.
We realized an annual interest savings of approximately US$3.0 million by refinancing our highest cost debt and repurchasing US$14.5 million secured debt in the open market.
OPERATIONAL EXCELLENCE
Our commitment to achieving operational excellence in areas within our control was rewarded by measurable progress in safety, productivity and cost control:
• Safety: We reduced our medical incident rate by 34% and our lost time incident rate by 27% for the quarter compared to the prior year average.
• Productivity: Production volumes increased by more than 2% compared to the prior year average, by optimizing the speed and efficiency of our paper machines.
• Cost Control: SG&A savings are also starting to be realized, with year over year savings currently estimated at $3.0 million.
MARKET CONDITIONS
North American demand for our paper grades, and directory in particular, declined from the first quarter of 2013. Paper inventories rose and benchmark prices for our specialty grades weakened during the seasonally slow start of the year. While North American paper demand continues to contract, business conditions remain favourable in emerging world markets including South and Central America.
The market for NBSK pulp remained strong in the quarter with benchmark prices increasing 2.2% from Q4 2013, while shipments slipped 3.2% compared to the first quarter of 2013.
OUTLOOK
We expect our results to continue to benefit from the tailwind of a weak Canadian dollar. Paper markets are forecasted to remain challenging with contraction in demand continuing for all grades. This supports our continued focus upon gaining market share in Latin America and other freight-logical export markets. For pulp, we expect to see downward pressure on price due to a softening Chinese economy and a widening price gap between hardwood and softwood pulp.
Second quarter earnings will be negatively impacted by a hydroelectricity rate increase as well as a scheduled maintenance shut on Crofton’s recovery boiler.
Joe Nemeth President and Chief Executive Officer
May 6, 2014
CATALYST PAPER 2014 FIRST QUARTER REPORT 1
MANAGEMENT’S DISCUSSION AND ANALYSIS ..................................... 3
1. OVERVIEW AND HIGHLIGHTS ............................................................................................................................ 5 2. SEGMENTED RESULTS ..................................................................................................................................... 11 3. LIQUIDITY AND CAPITAL RESOURCES ............................................................................................................ 17 4. CONTINGENT LIABILITIES ................................................................................................................................. 19 5. SUMMARY OF QUARTERLY RESULTS ............................................................................................................. 20 6. NON-GAAP MEASURES ..................................................................................................................................... 20 7. CRITICAL ACCOUNTING POLICIES AND ESTIMATES ..................................................................................... 23 8. CHANGES IN ACCOUNTING POLICIES ............................................................................................................ 24 9. IMPACT OF ACCOUNTING PRONOUNCEMENTS AFFECTING FUTURE PERIODS ...................................... 24 10. RISKS AND UNCERTAINTIES ............................................................................................................................ 24 11. SENSITIVITY ANALYSIS ..................................................................................................................................... 25 12. OUTLOOK ............................................................................................................................................................ 25 13. DISCLOSURE CONTROLS AND INTERNAL CONTROL OVER FINANCIAL REPORTING ............................. 26
CONSOLIDATED FINANCIAL STATEMENTS ......................................... 28
2 CATALYST PAPER 2014 FIRST QUARTER REPORT │ MANAGEMENT’S DISCUSSION AND ANALYSIS

MANAGEMENT’S DISCUSSION AND ANALYSIS The following management’s discussion and analysis (MD&A) of Catalyst Paper Corporation (the company, we, us, and our) should be read in conjunction with our interim consolidated financial statements for the three month periods ended March 31, 2014 and March 31, 2013 and our audited annual consolidated financial statements for the year ended December 31, 2013 and the notes thereto, which have been prepared in accordance with generally accepted accounting principles (GAAP) in the United States (U.S.). Additional information about the company, including our most recent Annual Information Form is available on our website at www.catalystpaper.com, or the Canadian Securities Administrator’s electronic filing website at www.sedar.com.
Throughout this discussion, references are made to certain measures that are not measures of performance under U.S. GAAP, including operating earnings, adjusted EBITDA, adjusted EBITDA before restructuring costs, average delivered cash costs per tonne before specific items, net earnings (loss) attributable to the company before specific items, net earnings (loss) per share attributable to the company’s common shareholders before specific items, and free cash flow. We believe that these non-GAAP measures are useful in evaluating our performance. These non-GAAP measures are defined and reconciled to their nearest GAAP measure in section 6, Non-GAAP measures.
In this MD&A, unless otherwise indicated, all dollar amounts are expressed in Canadian dollars. The term “dollars” and the symbols “$” and “CDN$” refer to Canadian dollars and the term “U.S. dollars” and the symbol “US$” refer to United States dollars.
In this MD&A, the term “tonne” and the symbol “MT” refer to a metric tonne and the term “ton” or the symbol “ST” refer to a short ton, a measure of weight equal to 0.9072 metric tonne. Use of these symbols is in accordance with industry practice.
The information in this report is as of May 6, 2014 which is the date of filing in conjunction with our press release announcing our results for the first quarter of 2014. Disclosure contained in this document is current to May 6, 2014 unless otherwise stated.
CATALYST PAPER 2014 FIRST QUARTER REPORT │ MANAGEMENT’S DISCUSSION AND ANALYSIS 3

CAUTIONARY STATEMENT REGARDING FORWARD-LOOKING STATEMENTS Certain statements and information in this MD&A are not based on historical facts and constitute forward-looking statements or forward-looking information within the meaning of Canadian securities laws and the U.S. Private Securities Litigation Reform Act of 1995 (forward-looking statements), including but not limited to, statements about our strategy, plans, future operating performance, contingent liabilities and outlook.
Forward-looking statements:
• Are statements that address or discuss activities, events or developments that we expect or anticipate may occur in the future;
• Can be identified by the use of words such as “believe”, “expect”, “anticipate”, “intend”, “plan”, “likely”, “predicts”, “estimates”, “forecasts”, and similar words or phrases or the negative of such words or phrases;
• Reflect our current beliefs, intentions or expectations based on certain assumptions and estimates, including those identified below, which could prove to be significantly incorrect:
– Our ability to develop, manufacture and sell new products and services that meet the needs of our customers and gain commercial acceptance;
– Our ability to continue to sell our products and services in the expected quantities at the expected prices and expected times;
– Our ability to successfully obtain cost savings from our cost reduction initiatives;
– Our ability to implement business strategies and pursue opportunities;
– Expected cost of goods sold;
– Expected component supply costs and constraints;
– Expected foreign exchange and tax rates.
• While considered reasonable by management, are inherently subject to known and unknown risks and uncertainties and other factors that could cause actual results or events to differ from historical or anticipated results or events. These risk factors and others are discussed in the MD&A. Certain of these risks are:
– The impact of general economic conditions in the countries in which we do business;
– Conditions in the capital markets and our ability to obtain financing and refinance existing debt;
– Market conditions and demand for our products (including declines in advertising and circulation);
– The implementation of trade restrictions in jurisdictions where our products are marketed;
– Fluctuations in foreign exchange or interest rates;
– Raw material prices (including wood fibre, chemicals and energy);
– The effect of, or change in, environmental and other governmental regulations;
– Uncertainty relating to labour relations;
– The availability of qualified personnel;
– Legal proceedings;
– The effects of competition from domestic and foreign producers;
– The risk of natural disaster and other factors many of which are beyond our control.
As a result, no assurance can be given that any of the events or results anticipated by such forward-looking statements will occur or, if they do occur, what benefit they will have on our operations or financial condition. Readers are cautioned not to place undue reliance on these forward-looking statements. We disclaim any intention or obligation to update or revise any forward-looking statements, whether as a result of new information, future events or otherwise, except as required by law.
4 CATALYST PAPER 2014 FIRST QUARTER REPORT │ MANAGEMENT’S DISCUSSION AND ANALYSIS

1. OVERVIEW AND HIGHLIGHTS BUSINESS OVERVIEW We are the largest producer of mechanical printing papers in western North America. We also produce NBSK pulp which is marketed primarily in Asia. Our business is comprised of three business segments: specialty printing papers, newsprint, and pulp. Specialty printing papers include coated mechanical, uncoated mechanical, and directory paper. We are the only producer of coated mechanical paper and soft calender (SC) paper in western North America. We operate three paper mills in British Columbia (B.C.) in Crofton, Port Alberni, and Powell River. Our Crofton mill includes a two-line kraft pulp operation.
More information about our business segments, product profile and our geographic sales distribution is provided on pages 6 to 7 of our 2013 Annual Report. Our production capacity by mill and product line is summarized in the following chart:
2014 Capacity by Mill Location and Product Line 1 Specialty printing papers 1 Newsprint 1 Pulp 2 Total
Mill location
Number of paper
machines Uncoated
mechanical Coated
mechanical Directory Newsprint NBSK pulp
Crofton, B.C. 3 2 – – – 349,000 355,000 704,000 Port Alberni, B.C. 2 – 224,000 116,000 – – 340,000 Powell River, B.C. 3 469,000 – – – – 469,000 Total capacity
(tonnes) 7 469,000 224,000 116,000 349,000 355,000 1,513,000
% of total capacity 31% 15% 8% 23% 23% 100% 1 Capacities expressed in the above table can vary as we are able to switch production between products, particularly newsprint, directory and
machine-finished uncoated grades. 2 Total pulp capacity at Crofton is 393,000 tonnes, of which 355,000 tonnes are designated as market pulp with the remainder 38,000 tonnes being
consumed internally. 3 No. 1 paper machine at Crofton remains indefinitely curtailed.
FIRST QUARTER OVERVIEW
Business Overview We had a strong first quarter for 2014 with improved operating results due to higher pulp prices, the positive impact of a weaker Canadian dollar and better production. This was partly offset by lower transaction prices for all paper segments, higher manufacturing costs, and lower sales volumes partly due to the extended container truck driver strike at Port Metro Vancouver.
We achieved strong production results in the quarter for both our paper and pulp operations. Our production volumes for the quarter of 352.8 thousand tonnes were 2.1% higher than average quarterly production for 2013 of 345.7 thousand tonnes and 4.9% higher than Q1 2013 production of 336.3 thousand tonnes. Manufacturing costs were higher mostly due to increased fibre, natural gas and chemical costs and higher distribution costs attributable to the port strike and the weak Canadian dollar.
We improved our capital structure in the quarter by completing a refinancing on favourable terms and repurchasing a portion of our long-term debt in the open market which will result in an annual interest saving of approximately US$3.0 million.
Financial Performance We recorded a net loss of $3.8 million and net earnings before specific items of $6.5 million in Q1. This compared to a net loss of $95.0 million and net earnings before specific items of $1.7 million, respectively, in Q4. Significant specific items in Q1 included a net gain on the repurchase of debt and a foreign exchange loss on the translation of U.S. dollar denominated debt. Significant specific items in the prior quarter included an impairment charge on goodwill and fixed assets, restructuring costs and a foreign exchange loss on the translation of U.S. dollar denominated debt.
CATALYST PAPER 2014 FIRST QUARTER REPORT │ MANAGEMENT’S DISCUSSION AND ANALYSIS 5

Adjusted EBITDA and adjusted EBITDA before restructuring costs was $25.7 million in Q1 compared to adjusted EBITDA of $19.1 million and adjusted EBITDA before restructuring costs of $20.2 million in Q4. Refer to section 6, Non-GAAP measures, for additional information on specific items in the reported financial results.
SELECTED FINANCIAL INFORMATION 2014 2013 (In millions of Canadian dollars, except where otherwise stated) Q1 Total Q4 Q3 Q2 Q1
Sales $ 273.9 $ 1,051.4 $ 272.1 $ 268.8 $ 263.4 $ 247.1 Operating earnings (loss) 14.8 (87.8) (79.5) 4.9 (12.0) (1.2) Depreciation and amortization 10.9 47.0 11.7 11.5 11.4 12.4
Adjusted EBITDA 1 25.7 46.1 19.1 16.4 (0.6) 11.2 – before restructuring costs 1 25.7 47.3 20.2 16.4 (0.5) 11.2
Net earnings (loss) attributable to the company (3.8) (127.6) (95.0) 5.2 (28.0) (9.8)
– before specific items 1 6.5 (31.5) 1.7 (3.5) (18.1) (11.6) Adjusted EBITDA margin 1 9.4% 4.4% 7.0% 6.1% (0.2%) 4.5%
– before restructuring costs 1 9.4% 4.5% 7.4% 6.1% (0.2%) 4.5% Net earnings (loss) per share attributable to the company’s common shareholders (in dollars) 9.4% 4.5% 7.4% 6.1% (0.2%) 4.5%
– basic and diluted from continuing operations $ (0.26) $ (9.01) $ (6.55) $ 0.36 $ (1.93) $ (0.89)
– basic and diluted from discontinued operations – 0.21 – – – 0.21
– before specific items 1 0.45 (2.17) 0.12 (0.24) (1.25) (0.80)
(In thousands of tonnes) Sales 335.7 1,373.3 346.5 350.6 346.6 329.6 Production 352.8
1,382.6 350.2 357.6 338.5 336.3
1 Refer to section 6, Non-GAAP measures.
6 CATALYST PAPER 2014 FIRST QUARTER REPORT │ CONSOLIDATED FINANCIAL STATEMENTS

Market Overview
* Uncoated mechanical is comprised of high-gloss and standard grades.
Overall, market conditions remained challenging in the first quarter of 2014. North American demand for our paper grades decreased from the first quarter of 2013 and inventory levels rose from Q4 levels. The decline in demand was most notable for directory at 20.0%, while lightweight coated and newsprint declined by 6.5% and 7.0% respectively. Reduced demand and rising inventories resulted in weaker operating rates, with benchmark prices declining for all specialty paper grades and remaining flat for newsprint in the quarter.
NBSK pulp shipments declined 3.2% compared to the first quarter of 2013. Pulp benchmark prices for China increased in the first quarter of 2014.
Completion of Term Loan and Redemption of Floating Rate Senior Secured Notes
On March 20, 2014, the company entered into a $20.0 million term loan (Term Loan) that matures on July 31, 2017 and bears interest, payable monthly, at the Canadian Prime Rate plus 3% per year. The Term Loan provides for quarterly principal repayments of $0.5 million and can be prepaid in whole or in part at any time without premium. The Term Loan was provided by the same lenders who participate in our asset based loan facility (ABL Facility) and is secured by a senior charge on the assets of the company and its subsidiaries that secures the PIK Toggle Senior Secured Notes due 2017 (2017 Notes).
The proceeds of the Term Loan were used to redeem the US$19.4 million outstanding balance on the Floating Rate Senior Secured Notes due 2016 (Floating Rate Notes). The effective settlement date of the redemption of the Floating Rate Notes was April 19, 2014. The replacement of the Floating Rate Notes with the Term Loan resulted in a net reduction to our outstanding secured debt of approximately US$1.4 million and a reduction in annual interest cost of approximately US$1.4 million.
Reduction of Secured Debt
We repurchased for cancellation an aggregate principal amount of US$14.5 million of our outstanding 2017 Notes on the open market, thereby reducing our annual interest costs by approximately US$1.6 million. The debt was repurchased in two tranches, US$9.5 million with an effective settlement date of March 27, 2014, and US$5.0 million with an effective settlement date of April 1, 2014.
CATALYST PAPER 2014 FIRST QUARTER REPORT │ CONSOLIDATED FINANCIAL STATEMENTS 7

Successful Appeal of Sales Tax Reassessment
On January 28, 2014, the Supreme Court of British Columbia ruled in favour of Catalyst Paper in our action against the Province of British Columbia involving a reassessment of the amount of sales tax payable under the Social Services Tax Act on electricity purchased from Powell River Energy Inc. (PREI) in 2001 through 2010. We estimate that we will receive a sales tax refund of $5.8 million including interest. The Province of British Columbia has applied to the British Columbia Court of Appeal for leave to appeal this decision. The hearing has been scheduled for May 8, 2014.
STRATEGY UPDATE Our objective is to return to profitability and maximize cash flows by focusing on reducing manufacturing costs and optimizing our brands and customer base. Additional information related to our corporate strategy, including key performance drivers and indicators, can be found on pages 12 to 18 of our 2013 Annual Report.
2014 Key Objectives The following is an update on our first quarter progress towards our 2014 key objectives:
Social:
• Safety: 20% reduction in medical incidents (MIs) and lost time incidents (LTIs) vs. 2013, with the long term goal of achieving top quartile performance (MIR < 1.0) – LTI frequency of 1.02 improved 27% compared to the prior year and the number of LTIs improved 30%
compared to the 2013 quarterly average. – MIR of 2.54 improved 34% compared to the prior year and the number of MIs improved 35% compared to
the 2013 quarterly average.
• Establish Catalyst as an employer of choice and develop best in class employee recruitment and retention programs – Continued success in attracting talent to all areas of the company. – Hired 49 employees during the quarter to fill key vacancies and to manage pending retirements. We have
recruitment, hiring, and training programs in place to manage the significant impact attrition continues to have on staffing at our operations due to the age demographics of our mills.
Financial:
• Deliver cash flow positive results in 2014 – Free cash flow for the quarter was $11.6 million. Liquidity increased by $38.1 million from Q4 2013 due to
an increase in the borrowing base, a decrease in the amount drawn on the ABL Facility, and an increase in restricted cash, partially offset by a reduction in cash on hand.
– Capital expenditures in the current quarter of $3.1 million were primarily invested in maintenance of business.
• Reduce interest cost and debt levels – Reduced debt level by US$1.4 million and annual interest by US$1.4 million by entering into Term Loan and
redeeming Floating Rate Notes. – Reduced debt level by US$14.5 million and annual interest by US$1.6 million through repurchase of 2017
Notes.
• Mitigate the impact of energy cost rate increases – Discussions with BC Hydro and the Provincial Government continue on programs that will mitigate a portion
of the rate increases.
• Continuously reduce costs and improve productivity in all of our operations through identifying and implementing opportunities for operational improvement and efficiency, capital planning and cost reviews – Continuing to drive a formal program to identify, analyze and implement opportunities for operational
improvement throughout the organization. To date, more than 560 potential opportunities have been identified.
– Our focus on streamlining Catalyst’s organizational structure has resulted in a reduction in the annualized run-rate of selling, general and administrative costs of $3.0 million.
– Achieved improved productivity for the quarter compared to average production volumes in the prior year.
8 CATALYST PAPER 2014 FIRST QUARTER REPORT │ CONSOLIDATED FINANCIAL STATEMENTS

Commercial:
• Expand geographic reach of Catalyst Paper into emerging world markets of Latin America and Asia – Sales efforts continue to penetrate freight logical markets in South and Central America with more
favourable business conditions.
• Continue growth of new value added paper products (Marathon Lite and Ascent as the top two priorities) – Marathon Lite, our 40-gram newsprint product, continues to receive excellent reviews for its opacity,
bulk and runnability. Marathon Lite has the same print characteristics as many competitive 45-gram products while offering the environmental and economic benefits of being 11% lighter.
– Ascent has also garnered positive reviews from customers for its bulk and print qualities. The addition of Ascent, a coated three paper and the highest value grade we now produce, has widened our coated paper line up offered to customers to range from coated three to coated five.
• Increase breadth of product range and solidify position as the most flexible and diverse producer and marketer of paper in the West – The company produces grades ranging from newsprint as the lowest cost printing substrate through to
Ascent coated paper with a wide selection of grades in between these two ‘bookends’. We have expanded our product offerings to meet the evolving needs of printers and publishers.
Environmental:
• Work with community stakeholders to identify and implement sustainable watershed management solutions – Participation in three meetings with the province and written feedback was provided on the drafted Water
Sustainability Act.
• Adhere to high international standards for transparency and reporting of performance on social, governance and environmental factors – Completion of the 2013 Sustainability Report which was prepared in accordance with the Global Reporting
Initiative G4 guidelines.
CONSOLIDATED RESULTS OF OPERATIONS
Sales Q1 2014 vs. Q4 2013
Sales revenues remained flat as a result of the positive impact of a weaker Canadian dollar, higher sales volumes achieved for newsprint and lightweight coated, and higher transaction prices for pulp, offset by lower transaction prices for all paper segments, and lower sales volumes for directory, uncoated mechanical and pulp.
Q1 2014 vs. Q1 2013
Sales revenues increased by 10.8% due to the positive impact of a weaker Canadian dollar, higher transaction prices for pulp and increased sales volumes for pulp and all paper segments except directory, partially offset by lower transaction prices for all paper segments, and lower sales volumes for directory.
CATALYST PAPER 2014 FIRST QUARTER REPORT │ CONSOLIDATED FINANCIAL STATEMENTS 9

Adjusted EBITDA and adjusted EBITDA before Restructuring Costs The following table provides variances between periods for adjusted EBITDA and adjusted EBITDA before restructuring costs:
(In millions of Canadian dollars) Q4 2013 Q1 2013 Adjusted EBITDA in comparative period 1 $ 19.1 $ 11.2
Restructuring costs 1.1 – Adjusted EBITDA before restructuring costs in comparative period 1 20.2 11.2
Paper prices (3.2) (5.7) Pulp prices 2.6 8.2 Impact of Canadian dollar 8.9 16.0 Volume and mix 2.6 7.1 Distribution costs (1.2) (0.7) Furnish mix and costs (3.2) (5.9) Power and fuel costs (0.1) (3.0) Labour costs (2.0) (1.5) Maintenance costs 5.3 4.2 De-recognition of interest in PREI – (4.3) Power generation (0.8) 0.9 Other, net (3.4) (0.8)
Adjusted EBITDA before restructuring costs in Q1 2014 1 25.7 25.7 Restructuring costs – –
Adjusted EBITDA in Q1 2014 1 $ 25.7 $ 25.7 1 Refer to section 6, Non-GAAP measures.
Operating Earnings (Loss) Q1 2014 vs. Q4 2013
Operating earnings increased by $94.3 million due to an impairment write-down in the prior quarter of $86.9 million, higher adjusted EBITDA of $6.6 million and lower depreciation and amortization expense of $0.8 million.
Q1 2014 vs. Q1 2013
Operating earnings increased by $16.0 million due to higher adjusted EBITDA of $14.5 million and lower depreciation and amortization expense of $1.5 million.
Net Earnings (Loss) Attributable to the Company Q1 2014 vs. Q4 2013
Net earnings attributable to the company increased by $91.2 million primarily due to higher after-tax operating earnings of $94.3 million and an after-tax gain on the repurchase of debt of $0.9 million, partly offset by a higher after-tax foreign exchange loss on the translation of U.S. dollar denominated debt of $1.8 million and a lower after-tax foreign exchange gain on the translation of U.S. dollar working capital balances of $1.2 million.
Q1 2014 vs. Q1 2013
Net earnings attributable to the company increased by $6.0 million primarily due to higher after-tax operating earnings of $16.0 million, lower after-tax interest expense of $1.6 million and after-tax reorganization costs incurred in Q1 2013 of $1.2 million, partially offset by a higher after-tax foreign exchange loss on the translation of U.S. dollar denominated debt of $5.3 million, and an after-tax gain on the sale of non-core assets in Q1 2013 of $9.4 million consisting of our interest in Powell River Energy for $5.3 million and the discontinued Snowflake mill for $4.1 million.
10 CATALYST PAPER 2014 FIRST QUARTER REPORT │ CONSOLIDATED FINANCIAL STATEMENTS

2. SEGMENTED RESULTS SPECIALTY PRINTING PAPERS
Three months
ended March 31, (In millions of Canadian dollars, except where otherwise stated) 2014 2 2013 2 Change Sales $ 153.5 $ 149.6 $ 3.9 Operating earnings (loss) (2.7) (2.9) 0.2 Depreciation and amortization 8.6 10.6 (2.0) Adjusted EBITDA 1 5.9 7.7 (1.8)
– before restructuring costs 1 5.9 7.7 (1.8) Adjusted EBITDA margin 1 3.8% 5.1% (1.3%)
– before restructuring costs 1 3.8% 5.1% (1.3%)
(In thousands of tonnes) Sales 175.9 180.0 (4.1) Production 177.8 185.3 (7.5) 1 Refer to section 6, Non-GAAP measures. 2 Numbers exclude the Snowflake mill’s results from operations which have been reclassified as discontinuing operations in the consolidated
statements of earnings (loss) in the interim consolidated financial statements for the three months ended March 31, 2014.
Segment Overview North American demand for coated mechanical decreased by 6.5% from the first quarter of 2013 due to reduced advertising pages in magazines and a decrease in catalogues being mailed out. Demand for uncoated mechanical remained flat. Uncoated mechanical demand was buoyed by increased demand for high-gloss grades as customers sought lower cost alternatives to coated mechanical. Operating rates were lower in the seasonally slower first quarter of the year. The average benchmark prices for lightweight coated decreased 3.8% to US$810 per short ton, and for soft-calendered A grade (SC-A) decreased 2.7% to US$803 per short ton compared to the previous quarter.
North American directory demand fell 20.0% in Q1 compared to the prior year due to ongoing pressure to reduce or eliminate white pages, smaller books, lower circulation, and the continued migration from printed books to the Internet. The average Q1 directory benchmark price decreased 2.7% to US$730 per short ton compared to the previous quarter. Operating rates for directory paper remain strong despite declining demand due to continued capacity reduction in the directory marketplace.
CATALYST PAPER 2014 FIRST QUARTER REPORT │ CONSOLIDATED FINANCIAL STATEMENTS 11

Operational Performance The following chart summarizes the operating performance of our specialty printing papers segment:
* Average delivered cash costs per tonne consist of cost of sales, excluding depreciation and amortization, and including the impact of SG&A and
restructuring costs. Average delivered cash costs per tonne before specific items consist of cost of sales, excluding depreciation and amortization, and including the impact of SG&A, but excluding the impact of restructuring costs.
Q1 2014 vs. Q1 2013
• Sales volume decreased by 4,100 tonnes reflecting lower sales volumes in directory, partially offset by increased sales of uncoated mechanical and lightweight coated. Paper sales in the quarter were negatively impacted by the extended container truck driver strike at Port Metro Vancouver. Significantly lower directory production continues to be replaced with increased newsprint production.
• Average sales revenue increased $42 per tonne due to the positive impact of a weaker Canadian dollar, partially offset by lower average transaction prices for all specialty paper grades.
• Average delivered cash costs increased by $50 per tonne due to the de-recognition of our interest in PREI and increased cost of fibre, kraft, chemicals, coating and electric power. The inclusion in Q1 2013 results of PREI’s operating earnings generated from power sales up to the sale of our interest on March 20, 2013 contributed $24 per tonne to the increase in average delivered cash costs. Fibre cost increased due to higher pulp pricing, while the strong US dollar drove distribution, chemicals and coating costs higher.
12 CATALYST PAPER 2014 FIRST QUARTER REPORT │ CONSOLIDATED FINANCIAL STATEMENTS

NEWSPRINT
Three months
ended March 31,
(In millions of Canadian dollars, except where otherwise stated) 2014 2 2013 2 Change Sales $ 54.4 $ 46.6 $ 7.8 Operating earnings (loss) 3.8 0.7 3.1 Depreciation and amortization 1.7 1.4 0.3 Adjusted EBITDA 1 5.5 2.1 3.4 – before restructuring costs 1 5.5 2.1 3.4 Adjusted EBITDA margin 1 10.1% 4.5% 5.6% – before restructuring costs 1 10.1% 4.5% 5.6%
(In thousands of tonnes)
Sales 77.6 69.3 8.3 Production 90.6 71.5 19.1
1 Refer to section 6, Non-GAAP measures. 2 Numbers exclude the Snowflake mill’s results from operations which have been reclassified as discontinuing operations in the consolidated
statements of earnings (loss) in the interim consolidated financial statements for the three months ended March 31, 2014.
CATALYST PAPER 2014 FIRST QUARTER REPORT │ CONSOLIDATED FINANCIAL STATEMENTS 13
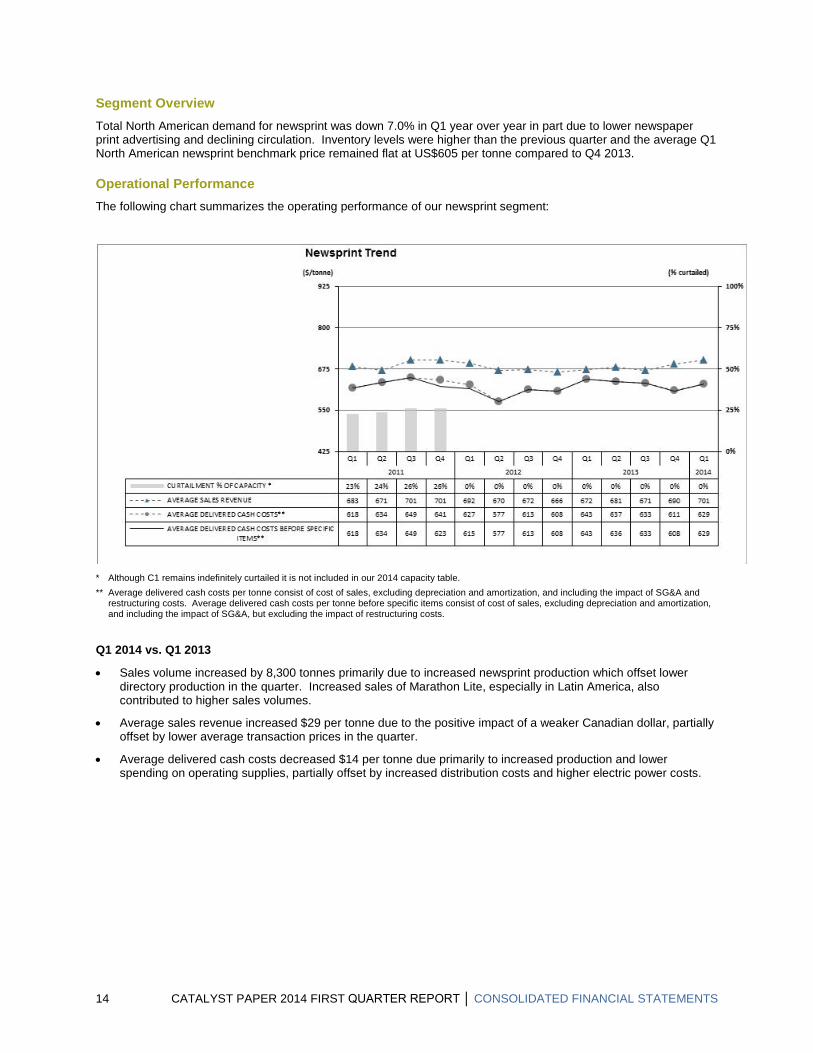
Segment Overview Total North American demand for newsprint was down 7.0% in Q1 year over year in part due to lower newspaper print advertising and declining circulation. Inventory levels were higher than the previous quarter and the average Q1 North American newsprint benchmark price remained flat at US$605 per tonne compared to Q4 2013.
Operational Performance The following chart summarizes the operating performance of our newsprint segment:
* Although C1 remains indefinitely curtailed it is not included in our 2014 capacity table. ** Average delivered cash costs per tonne consist of cost of sales, excluding depreciation and amortization, and including the impact of SG&A and
restructuring costs. Average delivered cash costs per tonne before specific items consist of cost of sales, excluding depreciation and amortization, and including the impact of SG&A, but excluding the impact of restructuring costs.
Q1 2014 vs. Q1 2013
• Sales volume increased by 8,300 tonnes primarily due to increased newsprint production which offset lower directory production in the quarter. Increased sales of Marathon Lite, especially in Latin America, also contributed to higher sales volumes.
• Average sales revenue increased $29 per tonne due to the positive impact of a weaker Canadian dollar, partially offset by lower average transaction prices in the quarter.
• Average delivered cash costs decreased $14 per tonne due primarily to increased production and lower spending on operating supplies, partially offset by increased distribution costs and higher electric power costs.
14 CATALYST PAPER 2014 FIRST QUARTER REPORT │ CONSOLIDATED FINANCIAL STATEMENTS

PULP
Three months
ended March 31, (In millions of Canadian dollars, except where otherwise stated) 2014 2 2013 2 Change Sales $ 66.0 $ 50.9 $ 15.1 Operating earnings (loss) 13.7 1.0 12.7 Depreciation and amortization 0.6 0.4 0.2 Adjusted EBITDA 1 14.3 1.4 12.9 – before restructuring costs 1 14.3 1.4 12.9 Adjusted EBITDA margin 1 21.7% 2.8% 18.9% – before restructuring costs 1 21.7% 2.8% 18.9%
(In thousands of tonnes)
Sales 82.2 80.3 1.9 Production 84.4 79.5 4.9
1 Refer to section 6, Non-GAAP measures. 2 Numbers exclude the Snowflake mill’s results from operations which have been reclassified as discontinuing operations in the consolidated
statements of earnings (loss) in the interim consolidated financial statements for the three months ended March 31, 2014.
Segment Overview Global NBSK demand declined 3.2% from a strong first quarter in 2013. The average NBSK benchmark pulp price for China increased 2.2% to US$753 per tonne reflecting the impact of price increases announced in the fourth quarter of 2013.
CATALYST PAPER 2014 FIRST QUARTER REPORT │ CONSOLIDATED FINANCIAL STATEMENTS 15
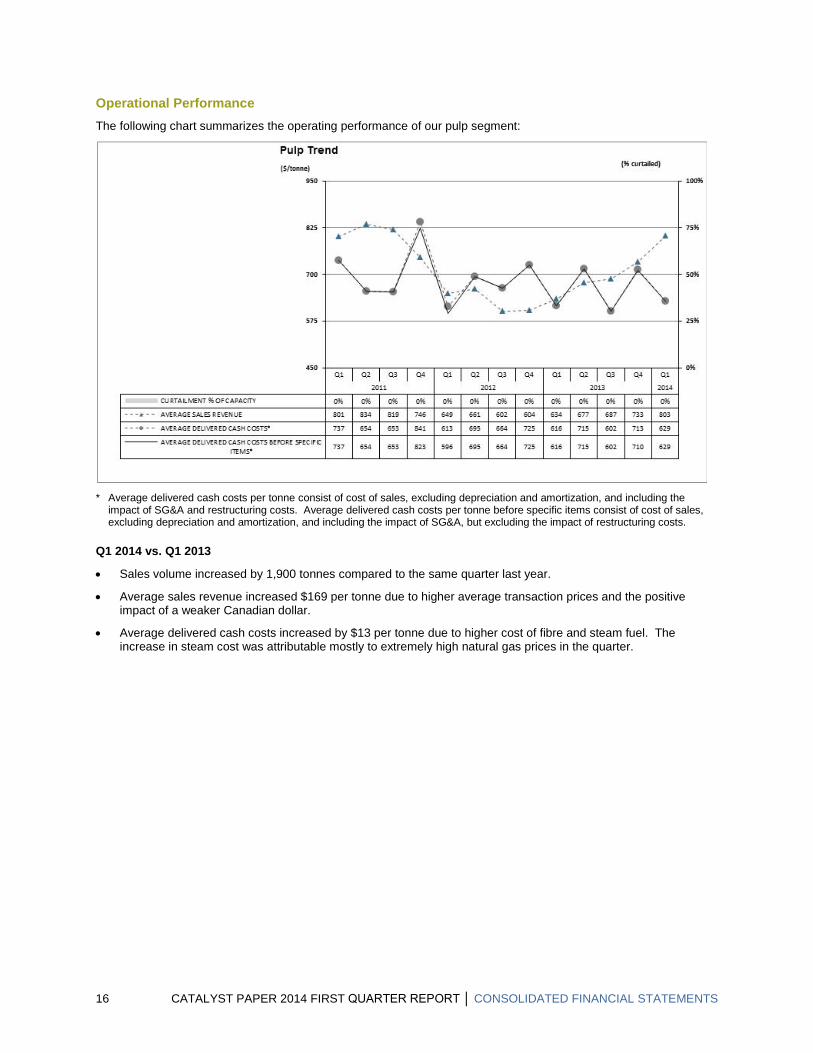
Operational Performance The following chart summarizes the operating performance of our pulp segment:
* Average delivered cash costs per tonne consist of cost of sales, excluding depreciation and amortization, and including the
impact of SG&A and restructuring costs. Average delivered cash costs per tonne before specific items consist of cost of sales, excluding depreciation and amortization, and including the impact of SG&A, but excluding the impact of restructuring costs.
Q1 2014 vs. Q1 2013
• Sales volume increased by 1,900 tonnes compared to the same quarter last year.
• Average sales revenue increased $169 per tonne due to higher average transaction prices and the positive impact of a weaker Canadian dollar.
• Average delivered cash costs increased by $13 per tonne due to higher cost of fibre and steam fuel. The increase in steam cost was attributable mostly to extremely high natural gas prices in the quarter.
16 CATALYST PAPER 2014 FIRST QUARTER REPORT │ CONSOLIDATED FINANCIAL STATEMENTS

3. LIQUIDITY AND CAPITAL RESOURCES SELECTED FINANCIAL INFORMATION
Three months
ended March 31,
(In millions of Canadian dollars, except where otherwise stated) 2014 2013 Change
Cash flows provided (used) by operations before changes in non-cash working capital $ 16.4 $ (2.2) $ 18.6
Changes in non-cash working capital 7.3 1.0 6.3
Cash flows provided (used) by
Operations 23.7 (1.2) 24.9
Investing activities (25.8) 16.4 (42.2)
Financing activities (0.1) (19.6) 19.5
Capital spending 3.1 5.9 (2.8)
Depreciation and amortization 10.9 12.4 (1.5)
Capital spending as % of depreciation and amortization 28% 48% (20%)
Net debt to net capitalization at March 311 97% 2 73% 24% 1 Net debt ratio equals net debt (total debt less cash) divided by net capitalization (shareholder’s equity attributable to the company and total debt
less cash). 2 Reflects a temporarily inflated debt level at March 31, 2014 due to the recognition of the redemption of the Floating Rate Notes of US$19.4
million in the second quarter.
Refer to pages 32 to 33 of our 2013 Annual Report for a discussion of the nature and sources of funding for our principal cash requirements.
OPERATING ACTIVITIES Cash flows from operating activities increased by $24.9 million in Q1 from the same quarter in the previous year, primarily due to a favourable change in non-cash working capital of $7.3 million compared to $1.0 million in Q1 2013 and increased EBITDA of $14.5 million. The favourable change in non-cash working capital related to an increase in accounts payable and accrued liabilities, partially offset by an increase in accounts receivable and inventories.
INVESTING ACTIVITIES Cash used by investing activities was $25.8 million in Q1 compared to cash provided of $16.4 million in the same quarter last year. Cash used in the current quarter included an increase in restricted cash of $22.5 million related to the timing of settlement of the redemption of the Floating Rate Notes. Cash provided in Q1 2013 included the sale of the Snowflake mill and our interest in Powell River Energy for $37.5 million, partially offset by an increase in restricted cash of $17.2 million.
FINANCING ACTIVITIES Cash used by financing activities in Q1 was $0.1 million compared to $19.6 million in the same quarter last year. Cash used in the current quarter included net repayment on the ABL Facility of $9.3 million and repurchase of 2017 Notes of $9.5 million, offset by the Term Loan entered into of $20.0 million. Cash used in Q1 2013 included net repayment on the ABL Facility of $19.3 million.
CATALYST PAPER 2014 FIRST QUARTER REPORT │ CONSOLIDATED FINANCIAL STATEMENTS 17
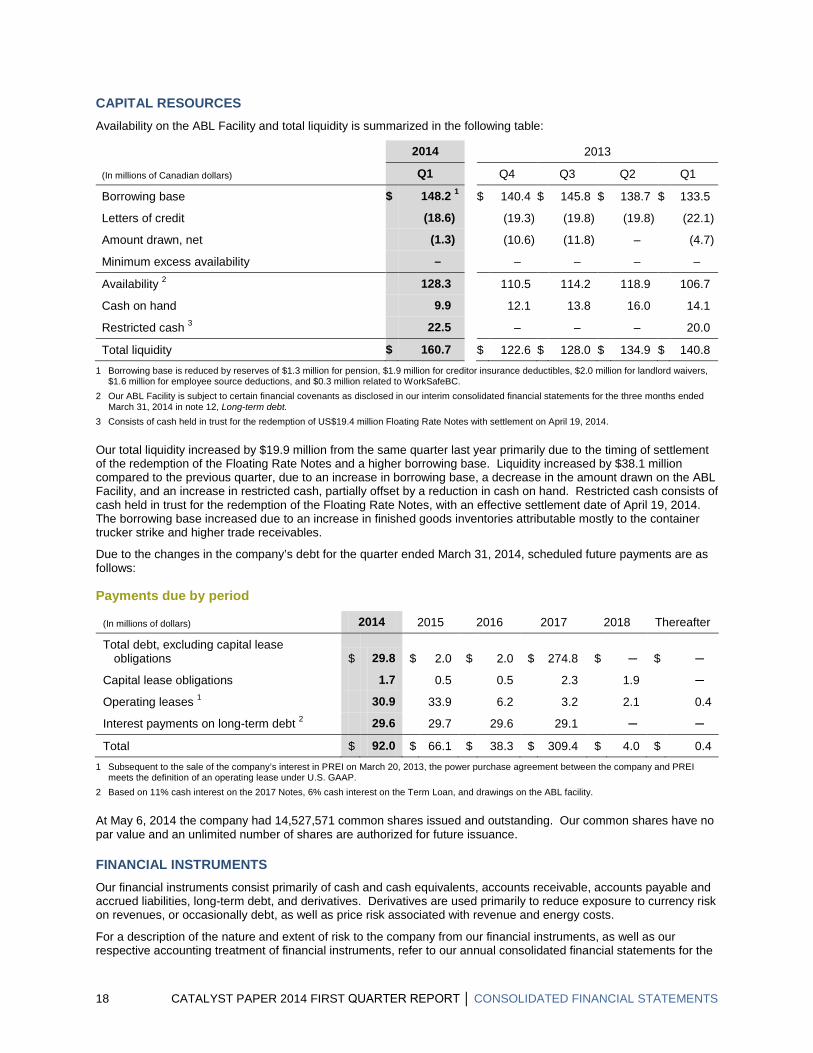
CAPITAL RESOURCES Availability on the ABL Facility and total liquidity is summarized in the following table:
(In millions of Canadian dollars)
2014 2013
Q1 Q4 Q3 Q2 Q1
Borrowing base $ 148.2 1 $ 140.4 $ 145.8 $ 138.7 $ 133.5
Letters of credit (18.6) (19.3) (19.8) (19.8) (22.1)
Amount drawn, net (1.3) (10.6) (11.8) – (4.7)
Minimum excess availability – – – – –
Availability 2 128.3 110.5 114.2 118.9 106.7
Cash on hand 9.9 12.1 13.8 16.0 14.1
Restricted cash 3 22.5 – – – 20.0
Total liquidity $ 160.7 $ 122.6 $ 128.0 $ 134.9 $ 140.8 1 Borrowing base is reduced by reserves of $1.3 million for pension, $1.9 million for creditor insurance deductibles, $2.0 million for landlord waivers,
$1.6 million for employee source deductions, and $0.3 million related to WorkSafeBC. 2 Our ABL Facility is subject to certain financial covenants as disclosed in our interim consolidated financial statements for the three months ended
March 31, 2014 in note 12, Long-term debt. 3 Consists of cash held in trust for the redemption of US$19.4 million Floating Rate Notes with settlement on April 19, 2014.
Our total liquidity increased by $19.9 million from the same quarter last year primarily due to the timing of settlement of the redemption of the Floating Rate Notes and a higher borrowing base. Liquidity increased by $38.1 million compared to the previous quarter, due to an increase in borrowing base, a decrease in the amount drawn on the ABL Facility, and an increase in restricted cash, partially offset by a reduction in cash on hand. Restricted cash consists of cash held in trust for the redemption of the Floating Rate Notes, with an effective settlement date of April 19, 2014. The borrowing base increased due to an increase in finished goods inventories attributable mostly to the container trucker strike and higher trade receivables.
Due to the changes in the company’s debt for the quarter ended March 31, 2014, scheduled future payments are as follows:
Payments due by period
(In millions of dollars) 2014 2015 2016 2017 2018 Thereafter
Total debt, excluding capital lease obligations $ 29.8 $ 2.0 $ 2.0 $ 274.8 $ ─ $ ─
Capital lease obligations 1.7 0.5 0.5 2.3 1.9 ─
Operating leases 1 30.9 33.9 6.2 3.2 2.1 0.4
Interest payments on long-term debt 2 29.6 29.7 29.6 29.1 ─ ─
Total $ 92.0 $ 66.1 $ 38.3 $ 309.4 $ 4.0 $ 0.4 1 Subsequent to the sale of the company’s interest in PREI on March 20, 2013, the power purchase agreement between the company and PREI
meets the definition of an operating lease under U.S. GAAP. 2 Based on 11% cash interest on the 2017 Notes, 6% cash interest on the Term Loan, and drawings on the ABL facility.
At May 6, 2014 the company had 14,527,571 common shares issued and outstanding. Our common shares have no par value and an unlimited number of shares are authorized for future issuance.
FINANCIAL INSTRUMENTS Our financial instruments consist primarily of cash and cash equivalents, accounts receivable, accounts payable and accrued liabilities, long-term debt, and derivatives. Derivatives are used primarily to reduce exposure to currency risk on revenues, or occasionally debt, as well as price risk associated with revenue and energy costs.
For a description of the nature and extent of risk to the company from our financial instruments, as well as our respective accounting treatment of financial instruments, refer to our annual consolidated financial statements for the
18 CATALYST PAPER 2014 FIRST QUARTER REPORT │ CONSOLIDATED FINANCIAL STATEMENTS

year ended December 31, 2013 note 27, Financial instruments. For the methods and assumptions we use to determine the fair value of financial instruments, refer to note 26, Fair value measurement, of those statements. Our methods and assumptions for determining the fair value of financial instruments have not changed materially since those used in the preparation of our consolidated financial statements for the year ended December 31, 2013.
At March 31, 2014 the company had foreign currency options and forward contracts with a notional principal of US$55.0 million with major financial institutions. At March 31, 2014 period-end exchange rates, these instruments were reported at their fair value of $0.2 million. At March 31, 2014, commodity swap agreements with a fair value of negative $0.3 million were outstanding to fix the sales price of 5,000 metric tonnes of NBSK pulp within the next 10 months.
The following table reconciles the average spot exchange rate to our effective exchange rate:
US$/CDN$ FOREIGN EXCHANGE
2014 2013
Q1 Q4 Q3 Q2 Q1
Average Bank of Canada noon spot rate 0.906 0.953 0.963 0.977 0.992
Average effective rate included in adjusted EBITDA 0.906 0.953 0.963 0.977 0.992
(Favourable)/unfavourable impact of derivatives, other than those designated as effective hedges for accounting purposes, included in other expenses 1 (0.001) – – – –
Foreign exchange (gain)/loss, on working capital balances, included in other expenses 2 (0.005) (0.011) – (0.011) (0.005)
Average effective rate in net earnings/(loss) before income taxes 3 0.900 0.942 0.963 0.966 0.987
(In millions of Canadian dollars)
1 Favourable/(unfavourable) impact of derivatives included in other expenses $ 0.2 $ – $ – $ – $ –
2 Foreign exchange gain/(loss) on working capital balances included in other expenses 1.2 2.5 – 2.2 0.8
3 Excludes foreign exchange gain/(loss) on long term debt and $US interest expense
4. CONTINGENT LIABILITIES We are not aware of any significant contingent liabilities outstanding as of May 6, 2014.
CATALYST PAPER 2014 FIRST QUARTER REPORT │ CONSOLIDATED FINANCIAL STATEMENTS 19

5. SUMMARY OF QUARTERLY RESULTS The following table highlights selected financial information for the eight consecutive quarters ending March 31, 2014:
(In millions of Canadian dollars, except per share amounts)
2014 2013 2012
Q1 Q4 Q3 Q2 Q1 Q4 Q3 Q2
Sales 2 $ 273.9 $ 272.1 $ 268.8 $ 263.4 $ 247.1 $ 260.5 $ 265.7 $ 264.8
Adjusted EBITDA 1, 2 25.7 19.1 16.4 (0.6) 11.2 7.2 13.8 17.0
Net earnings (loss) attributable to the company (3.8) (95.0) 5.2 (28.0) (9.8) (35.2) 655.7 (11.7)
Net earnings (loss) per share attributable to the company’s common shareholders
– basic and diluted from continuing operations $ (0.26) $ (6.55) $ 0.36 $ (1.93) $ (0.89) $ (1.55) $ 1.73 $ (0.03)
– basic and diluted from discontinued operations – – – – 0.21 (0.89) (0.01) –
1 Refer to section 6, Non-GAAP measures. 2 Numbers exclude the Snowflake mill’s results from operations which have been reclassified as discontinued operations in the consolidated
statements of earnings (loss) in the interim consolidated financial statements for the three months ended March 31, 2014
Refer to section 1, Overview and highlights, and the discussion on Consolidated results of operations, for details of Q1 2014 results compared to Q4 2013.
6. NON-GAAP MEASURES Management uses certain measures that are not defined by U.S. GAAP to evaluate our performance and, as a result, the measures as employed by management may not be comparable to similarly titled measures reported by other entities. These non-GAAP measures should not be considered by an investor as an alternative to their nearest respective GAAP measure. Our non-GAAP measures include operating earnings (loss), adjusted EBITDA (earnings before interest, taxes, depreciation and amortization, impairment and other closure costs, and before other non-operating income and expenses), adjusted EBITDA before restructuring costs, adjusted EBITDA margin, adjusted EBITDA margin before restructuring costs, average delivered cash costs per tonne before specific items, net earnings (loss) attributable to the company before specific items, net earnings (loss) per share attributable to the company’s common shareholders before specific items, and free cash flow.
Specific items are items that do not arise from the company’s day-to-day operating, investing and financing activities, or items that are subject to material volatility based on factors outside of management’s control. Specific items include: foreign exchange gain or loss on long-term debt; gain or loss on cancellation of long-term debt; asset-impairment and other closure costs; restructuring costs; unusual non-recurring items; and certain income tax adjustments.
20 CATALYST PAPER 2014 FIRST QUARTER REPORT │ CONSOLIDATED FINANCIAL STATEMENTS

ADJUSTED EBITDA AND ADJUSTED EBITDA BEFORE RESTRUCTURING COSTS Adjusted EBITDA as defined equates to operating earnings (loss) plus depreciation and amortization and impairment and other closure costs. Adjusted EBITDA margin and adjusted EBITDA margin before restructuring costs are defined as adjusted EBITDA and adjusted EBITDA before restructuring costs as a percentage of sales.
These measures enable comparison of consolidated and segment operating results between periods without regard to debt service, income taxes, capital expenditure requirements, and specific items. These measures are provided to improve comparability between periods by eliminating the impact of financing (interest) and accounting (depreciation) items on our results.
Reconciliation to Net Earnings (Loss) Attributable to the Company:
2014 2013
(In millions of Canadian dollars) Q1 Total Q4 Q3 Q2 Q1
Net earnings (loss) attributable to the company $ (3.8) $ (127.6) $ (95.0) $ 5.2 $ (28.0) $ (9.8)
Net earnings (loss) attributable to non-controlling interest – 0.3 – – – 0.3
Net earnings (loss) (3.8) (127.3) (95.0) 5.2 (28.0) (9.5)
Depreciation and amortization 1 10.9 47.0 11.7 11.5 11.4 12.4
Impairment – 86.9 86.9 – – –
Foreign exchange (gain) loss on long-term debt 1 11.2 18.8 9.4 (6.1) 9.6 5.9
Other (income) expense 1 (2.1) (14.9) (3.0) (2.8) (2.3) (6.8)
Interest expense, net 1 9.5 37.4 9.1 8.5 8.7 11.1
Income tax expense (recovery) 1 – 0.1 – 0.1 – –
Reorganization items, net 1 – 1.2 – – – 1.2
Earnings from discontinued operations net of tax – (3.1) – – – (3.1)
Adjusted EBITDA $ 25.7 $ 46.1 $ 19.1 $ 16.4 $ (0.6) $ 11.2
Restructuring costs
Specialty printing papers – 0.6 0.6 – – –
Newsprint – 0.4 0.3 – 0.1 –
Pulp – 0.2 0.2 – – –
Total restructuring costs – 1.2 1.1 – 0.1 –
Adjusted EBITDA before restructuring costs $ 25.7 $ 47.3 $ 20.2 $ 16.4 $ (0.5) $ 11.2 1 Numbers exclude the Snowflake mill’s results from operations which have been reclassified as discontinued operations in the consolidated
statements of earnings (loss) in the interim consolidated financial statements for the three months ended March 31, 2014.
CATALYST PAPER 2014 FIRST QUARTER REPORT │ CONSOLIDATED FINANCIAL STATEMENTS 21

NET EARNINGS (LOSS) ATTRIBUTABLE TO THE COMPANY BEFORE SPECIFIC ITEMS Specific items are defined previously, and the exclusion of such items from net earnings (loss) attributable to the company facilitates the comparison of financial results between periods.
Reconciliation to Net Earnings (Loss) Attributable to the Company:
(In millions of Canadian dollars and after-taxes, except where otherwise stated)
2014 2013
Q1 Total Q4 Q3 Q2 Q1
Net earnings (loss) attributable to the company $ (3.8) $ (127.6) $ (95.0) $ 5.2 $ (28.0) $ (9.8)
Specific items:
Foreign exchange loss (gain) on long-term debt 11.2 18.8 9.4 (6.1) 9.6 5.9
Settlement gain on special pension portability election – (2.6) – (2.6) – –
Impairment and other closure costs 1 – 87.1 86.9 – – 0.2
Restructuring costs 1 – 1.6 1.1 – 0.1 0.4
Reorganization items, net – 1.1 – – – 1.1
Loss (gain) on purchase of debt (0.9) 2.3 – – 2.3 –
Net gain on sale of non-core assets – (12.2) (0.7) – (2.1) (9.4)
Net earnings (loss) attributable to the company before specific items $ 6.5 $ (31.5) $ 1.7 $ (3.5) $ (18.1) $ (11.6)
Net earnings (loss) per share attributable to the company’s common shareholders in dollars:
As reported (continuing operations) $ (0.26) $ (9.01) $ (6.55) $ 0.36 $ (1.93) $ (0.89)
Before specific items 0.45 (2.17) 0.12 (0.24) (1.25) (0.80) 1 Included in discontinued operations, net of tax in the consolidated statements of earnings (loss) in the interim consolidated financial statements for
the three months ended March 31, 2014.
22 CATALYST PAPER 2014 FIRST QUARTER REPORT │ CONSOLIDATED FINANCIAL STATEMENTS

FREE CASH FLOW Free cash flow excludes working capital and certain other sources and uses of cash, which are disclosed in the consolidated statements of cash flows. This measure allows us to assess our ability to generate funds to repay debt and assists in cash flow forecasting.
Reconciliation to Cash Provided by Operating Activities less Cash Used by Investing Activities:
2014 2013
(In millions of Canadian dollars) Q1 Total Q4 Q3 Q2 Q1
Cash provided (used) by operating activities $ 23.7 $ (7.5) $ 3.7 $ (13.0) $ 3.0 $ (1.2)
Cash provided (used) by investing activities (25.8) 31.4 (4.0) (0.7) 19.7 16.4
Proceeds from the sale of property, plant and equipment and other assets – (52.2) (0.3) (5.0) (8.6) (38.3)
Other investing activities 0.2 0.5 0.6 0.6 0.5 (1.2)
Non-cash working capital changes except change in taxes and interest 0.1 8.6 1.3 26.1 (18.6) (0.2)
Other 13.4 (2.2) 4.6 (7.2) (15.3) 15.7
Free cash flow $ 11.6 $ (21.4) $ 5.9 $ 0.8 $ (19.3) $ (8.8)
Management’s Calculation of Free Cash Flow:
2014 2013
(In millions of Canadian dollars) Q1 Total Q4 Q3 Q2 Q1
Adjusted EBITDA $ 25.7 $ 46.1 $ 19.1 $ 16.4 $ (0.6) $ 11.2
Interest expense, excluding amortization (9.1) (35.5) (8.7) (8.0) (8.2) (10.6)
Capital expenditures (3.1) (23.4) (3.7) (5.3) (8.5) (5.9)
Reorganization costs – (0.6) – – – (0.6)
Income taxes received (paid) – – – – – –
Employee future benefits, expense under cash contributions 1 (1.9) (7.0) (0.8) (2.3) (2.0) (1.9)
Net operating cash flow from discontinued operations – (1.0) – – – (1.0)
Free cash flow $ 11.6 $ (21.4) $ 5.9 $ 0.8 $ (19.3) $ (8.8)
1 Free cash flow is adjusted to reflect the cash impact of employee future benefits rather than the accounting expense which is included in adjusted EBITDA.
7. CRITICAL ACCOUNTING POLICIES AND ESTIMATES The preparation of financial statements in conformity with U.S. GAAP requires companies to establish accounting policies and to make estimates that affect both the amount and timing of recording of assets, liabilities, revenues and expenses. Some of these estimates require judgments about matters that are inherently uncertain and actual results could differ from estimates.
On an ongoing basis, we review our estimates based upon currently available information. The discussion on the accounting policies that require management's most difficult, subjective and complex judgments, and which are subject to a fair degree of measurement uncertainty can be found on pages 40 to 44 of the company's 2013 Annual Report.
CATALYST PAPER 2014 FIRST QUARTER REPORT │ CONSOLIDATED FINANCIAL STATEMENTS 23
8. CHANGES IN ACCOUNTING POLICIES There were no new pronouncements issued by the FASB that impacted our consolidated financial statements in Q1 2014.
9. IMPACT OF ACCOUNTING PRONOUNCEMENTS AFFECTING FUTURE PERIODS
There were no new pronouncements issued by the FASB that may impact our consolidated financial statements for future periods.
10. RISKS AND UNCERTAINTIES We face risks and uncertainties which fall into the general business areas of markets, international commodity prices, currency exchange rates, environmental issues, fibre supply, government regulation and policy, and for Canadian companies, trade barriers and potential impacts of aboriginal rights, including unresolved aboriginal land claims in B.C.
In order to address these risks and effectively manage them, we have developed a process for managing risk and the interrelationship between risks and our strategic plan. We provide regular updates to the Audit Committee, work with corporate and operational management to identify, measure, and prioritize the critical risks facing the company, and manage these risks by ensuring that they are adequately addressed through mitigating procedures where appropriate. The objectives of the risk-management function include developing a common framework for understanding what constitutes principal business risks, ensuring that risk management activities are aligned with business strategies, and providing an effective mechanism for governance in the area of risk management.
A description of our risks and uncertainties can be found on pages 45 to 52 of our 2013 Annual Report.
The following updates to risks and uncertainties under the headings “We may not be able to generate sufficient cash to service all of our indebtedness and may be forced to take other actions to satisfy our obligations under our indebtedness, which may not be successful”, “Our degree of leverage may limit our financial and operating activities”, “We are subject to exchange rate fluctuations”, and “A change in our legal control could be materially adverse” in our 2013 Annual Report are noted below:
We may not be able to generate sufficient cash to service all of our indebtedness and may be forced to take other actions to satisfy our obligations under our indebtedness, which may not be successful Future debt service obligations were impacted by a number of transactions in the quarter. On March 20, 2014, we entered into a $20.0 million Term Loan that matures on July 31, 2017 and used the proceeds to redeem the US$19.4 million outstanding balance on the Floating Rate Notes. The replacement of the Floating Rate Notes with the Term Loan resulted in a reduction to our outstanding secured debt of approximately US$1.4 million, a reduction in annual interest costs of approximately US$1.4 million, and quarterly principal repayments of $0.5 million on the new Term Loan as opposed to full principal repayment at maturity under the former Floating Rate Notes. The credit agreement that governs the Term Loan restricts our ability to dispose of assets and use the proceeds from any such dispositions and may also restrict our ability to raise debt or equity capital to be used to repay other indebtedness when it becomes due. We repurchased for cancellation US$14.5 million of our outstanding 2017 Notes, thereby reducing annual interest costs by approximately US$1.6 million and the balance of future principal payments.
Our degree of leverage may limit our financial and operating activities As described above, future debt obligations were impacted by a number of transactions in the quarter, resulting in a moderate reduction to the company’s financial leverage. The level of indebtedness of the company remains substantial and may impose a limit on future financial and operating activities.
We are subject to exchange rate fluctuations We entered into a Term Loan that is denominated in Canadian dollars and redeemed our U.S. dollar denominated Floating Rate Notes, thereby moderately reducing the exposure of our reported earnings to exchange rate fluctuations.
24 CATALYST PAPER 2014 FIRST QUARTER REPORT │ CONSOLIDATED FINANCIAL STATEMENTS
A change in our legal control could be materially adverse The credit agreement for the Term Loan entered into on March 20, 2014 contains a provision whereby the loan will be deemed to be in default in the case of a change in legal control. On the occurrence of an event of default the Term Loan becomes due and payable in whole together with any accrued interest. The Floating Rate Notes that were redeemed in the quarter contained a requirement that, if a change of control occurred, we were required to make an offer to purchase all outstanding notes at a price equal to 101% of their principal amount, plus accrued and unpaid interest to the date of payment.
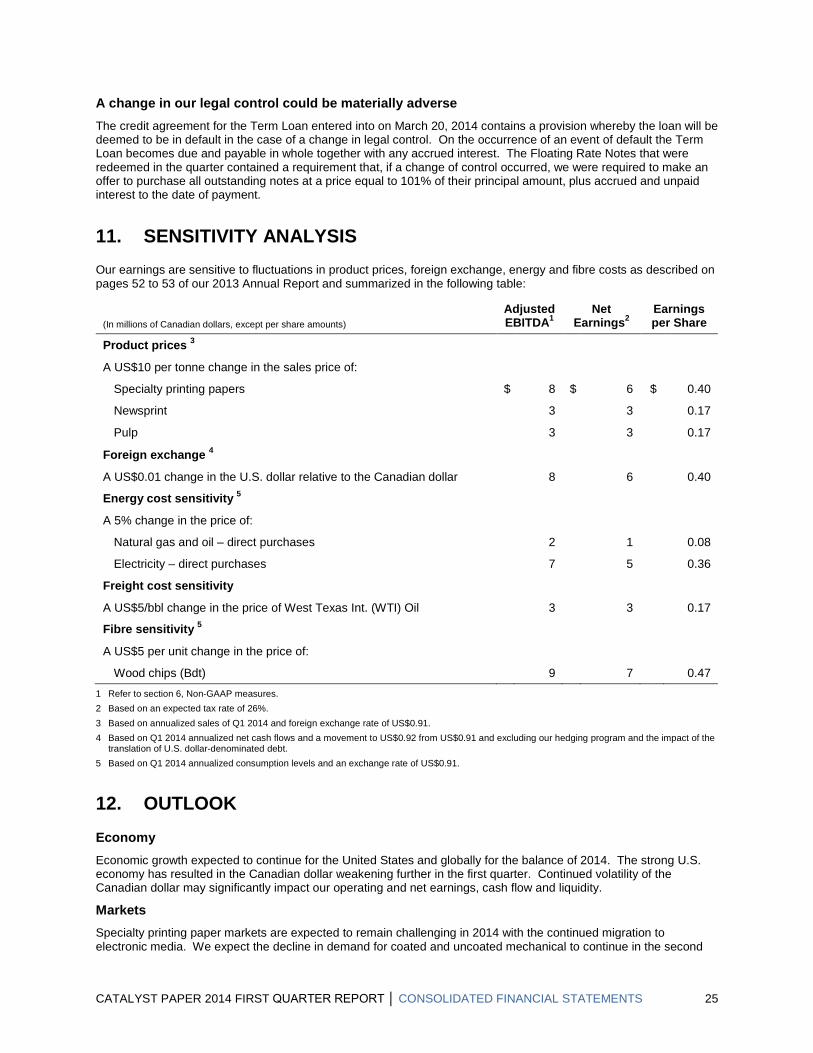
11. SENSITIVITY ANALYSIS Our earnings are sensitive to fluctuations in product prices, foreign exchange, energy and fibre costs as described on pages 52 to 53 of our 2013 Annual Report and summarized in the following table:
(In millions of Canadian dollars, except per share amounts) Adjusted EBITDA1
Net Earnings2
Earnings per Share
Product prices 3
A US$10 per tonne change in the sales price of:
Specialty printing papers $ 8 $ 6 $ 0.40
Newsprint 3 3 0.17
Pulp 3 3 0.17
Foreign exchange 4
A US$0.01 change in the U.S. dollar relative to the Canadian dollar 8 6 0.40
Energy cost sensitivity 5
A 5% change in the price of:
Natural gas and oil – direct purchases 2 1 0.08
Electricity – direct purchases 7 5 0.36
Freight cost sensitivity
A US$5/bbl change in the price of West Texas Int. (WTI) Oil 3 3 0.17
Fibre sensitivity 5
A US$5 per unit change in the price of:
Wood chips (Bdt) 9 7 0.47 1 Refer to section 6, Non-GAAP measures. 2 Based on an expected tax rate of 26%. 3 Based on annualized sales of Q1 2014 and foreign exchange rate of US$0.91. 4 Based on Q1 2014 annualized net cash flows and a movement to US$0.92 from US$0.91 and excluding our hedging program and the impact of the
translation of U.S. dollar-denominated debt. 5 Based on Q1 2014 annualized consumption levels and an exchange rate of US$0.91.
12. OUTLOOK Economy Economic growth expected to continue for the United States and globally for the balance of 2014. The strong U.S. economy has resulted in the Canadian dollar weakening further in the first quarter. Continued volatility of the Canadian dollar may significantly impact our operating and net earnings, cash flow and liquidity.
Markets Specialty printing paper markets are expected to remain challenging in 2014 with the continued migration to electronic media. We expect the decline in demand for coated and uncoated mechanical to continue in the second
CATALYST PAPER 2014 FIRST QUARTER REPORT │ CONSOLIDATED FINANCIAL STATEMENTS 25

quarter. Operating rates and prices for coated and uncoated mechanical are expected to weaken in the first half of 2014 before the seasonally stronger second half of the year. Demand for directory paper will continue to decline due to paper conservation moves by publishers and migration to electronic media.
While newsprint demand is expected to contract further due to declining circulation, page count reductions and other conservation measures by publishers, export markets are expected to remain strong due to capacity conversions and closures. Newsprint prices are expected to remain flat in the second quarter.
The NBSK market improved in the first quarter due to the momentum of price increases in the prior year carrying into 2014. Although pulp inventories in China are at the low end, we expect that short-term destocking will put downward pressure on pulp prices. Hardwood pulp capacity increases drove the difference between hardwood and softwood pulp prices wider in the quarter to approximately $200 per tonne.
Operations
Second quarter earnings are expected to be negatively impacted by higher power costs due to an announced hydroelectricity rate increase, higher maintenance costs and reduced pulp production due to a scheduled maintenance shut on Crofton’s recovery boiler, increased fibre cost due to higher pulp pricing, and higher chemical, coating and distribution costs driven by the strong US dollar. As of April 1, hydroelectricity rates increased 9% which will result in higher annualized electricity costs of approximately $14 million.
The following table summarizes major planned maintenance shutdown costs and related production downtime for 2014: 2014 Q1 Q2 Q3 Q4 Total
Mill Location Tonnage
Impact
Mtce Cost
($mm) Tonnage
Impact
Mtce Cost
($mm) Tonnage
Impact
Mtce Cost
($mm) Tonnage
Impact
Mtce Cost
($mm) Tonnage
Impact
Mtce Cost
($mm) Alberni
TMO – – – – – – – – – – Boilers – – – 0.2 – 1.6 – 0.2 – 2.0
Crofton TMO – – – – – – – – – – Pulp – – 6,100 6.3 – – 7,800 6.5 13,900 12.8 Boilers – – – – – 3.6 – – – 3.6
Powell TMO – – – – 9,800 1.0 – – 9,800 1.0 Capital – – – – – – – – – – Boilers – – – – – 3.1 – – – 3.1
Total – – 6,100 6.5 9,800 9.3 7,800 6.7 23,700 22.5
The Crofton No. 1 machine will continue to be indefinitely curtailed in 2014.
Capital spending is expected to be approximately $20 million in 2014.
Liquidity, Debt Maturities and Covenants We do not currently anticipate any significant uses of cash in Q2 other than for our operations, working capital fluctuations, interest payments, and pension funding contributions.
13. DISCLOSURE CONTROLS AND INTERNAL CONTROL OVER FINANCIAL REPORTING
A summary of our regulatory requirements for the evaluation of internal controls and subsequent reporting of the results of that evaluation can be found on page 55 of our 2013 Annual Report. Based on an evaluation of the design and operation of the company’s disclosure controls and procedures conducted under the supervision and with the participation of management, our chief executive officer and chief financial officer concluded that such disclosure controls and procedures (as defined in Canada under National Instrument 52-109 and in Rules 13a-15(e) and 15d-15(e) under the United States Securities Exchange Act of 1934), were effective as at December 31, 2013.
26 CATALYST PAPER 2014 FIRST QUARTER REPORT │ CONSOLIDATED FINANCIAL STATEMENTS

We did not make any significant changes in internal controls over financial reporting during the most recent three month period ended March 31, 2014 that have materially affected, or are reasonably likely to materially affect, our internal control over financial reporting.
The company's Audit Committee, as part of its oversight role, has reviewed and recommended the approval of this MD&A to the Board of directors. The Board of directors has read and approved this MD&A.
CATALYST PAPER 2014 FIRST QUARTER REPORT │ CONSOLIDATED FINANCIAL STATEMENTS 27

CONSOLIDATED FINANCIAL STATEMENTS CONSOLIDATED BALANCE SHEETS March 31, December 31, (In millions of Canadian dollars) 2014 2013 (unaudited) Assets Current assets
Cash and cash equivalents $ 9.9 $ 12.1 Restricted cash (note 12) 22.5 – Accounts receivable (note 6) 118.5 116.5 Inventories (note 7) 146.8 140.2 Prepaids and other (note 8) 4.2 4.5 Assets held for sale (note 5) 5.7 5.7
307.6 279.0 Property, plant and equipment (note 9) 404.3 412.2 Other assets (note 10) 9.8 8.9
$ 721.7 $ 700.1
Liabilities Current liabilities
Accounts payable and accrued liabilities (note 11) $ 135.3 $ 119.7 Current portion of long-term debt (note 12) 1.8 2.0
137.1 121.7 Long-term debt (note 12) 313.3 301.8 Employee future benefits (note 13) 253.1 254.9 Other long-term obligations 9.2 8.8
712.7 687.2
Equity Shareholders’ equity
Common stock: no par value; unlimited shares authorized; issued and outstanding: 14,527,571 shares (December 31, 2013 – 14,527,571 shares) 144.9 144.9
Preferred stock: par value determined at time of issue; authorized 100,000,000 shares; issued and outstanding: nil shares – –
Deficit (166.6) (162.8) Accumulated other comprehensive income 30.7 30.8
9.0 12.9
$ 721.7 $ 700.1
Subsequent events (note 12)
Gain contingencies (note 19)
The accompanying notes are an integral part of the consolidated financial statements.
On behalf of the Board:
Joe Nemeth Walter Jones Director Director
28 CATALYST PAPER 2014 FIRST QUARTER REPORT │ CONSOLIDATED FINANCIAL STATEMENTS

CONSOLIDATED STATEMENTS OF LOSS
Three months
ended March 31, (Unaudited and in millions of Canadian dollars, except where otherwise stated) 2014 2013
Sales $ 273.9 $ 247.1
Operating expenses Cost of sales, excluding depreciation and amortization 240.1 227.6 Depreciation and amortization 10.9 12.4 Selling, general and administrative 8.1 8.3
259.1 248.3 Operating earnings (loss) 14.8 (1.2) Interest expense, net (9.5) (11.1) Foreign exchange loss on long-term debt (11.2) (5.9) Other income, net (note 15) 2.1 6.8
Loss before reorganization items and income taxes (3.8) (11.4) Reorganization items, net – (1.2)
Loss before income taxes (3.8) (12.6) Income tax expense (recovery) (note 16) – –
Loss from continuing operations (3.8) (12.6) Earnings from discontinued operations, net of tax (note 5) – 3.1
Net loss (3.8) (9.5) Net earnings attributable to non-controlling interest – (0.3)
Net loss attributable to the company $ (3.8) $ (9.8)
Basic and diluted net loss per share attributable to the company’s common shareholders (in dollars) $ (0.26) $ (0.89)
Basic and diluted net earnings per share from discontinued operations attributable to the company’s common shareholders (in dollars) – 0.21
Weighted average number of company common shares outstanding (in millions) 14.5 14.5
The accompanying notes are an integral part of the consolidated financial statements.
CATALYST PAPER 2014 FIRST QUARTER REPORT │ CONSOLIDATED FINANCIAL STATEMENTS 29
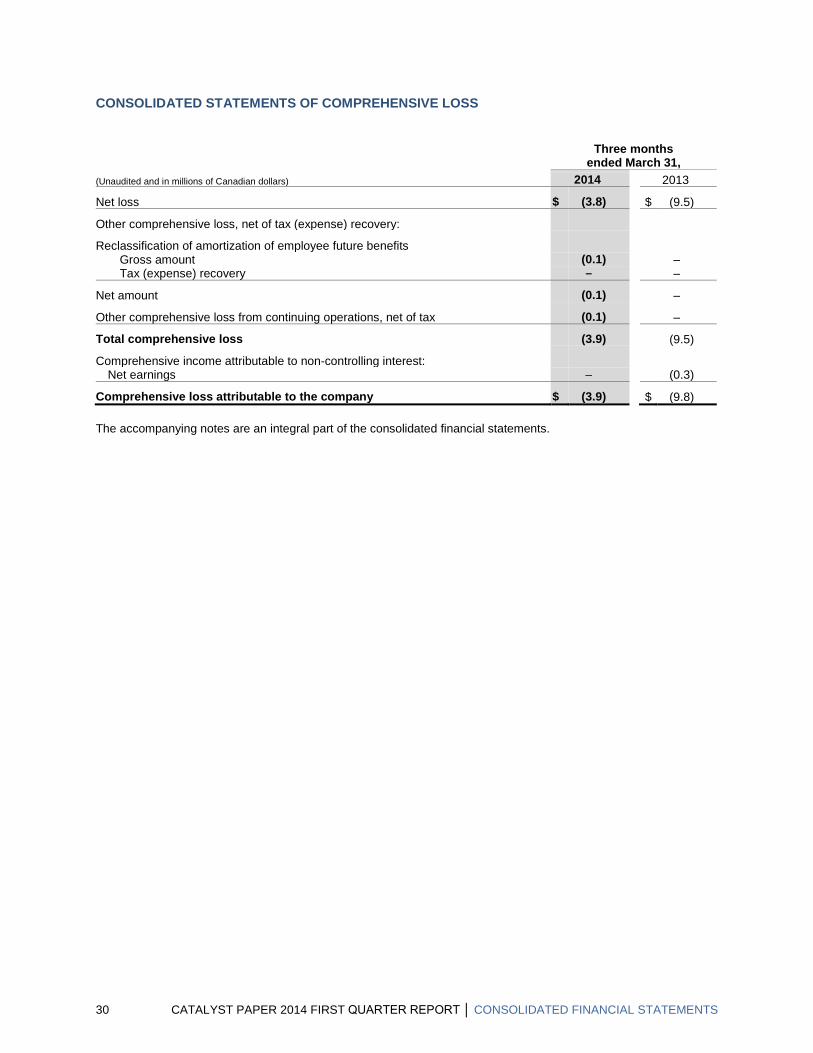
CONSOLIDATED STATEMENTS OF COMPREHENSIVE LOSS
Three months
ended March 31, (Unaudited and in millions of Canadian dollars) 2014 2013
Net loss $ (3.8) $ (9.5)
Other comprehensive loss, net of tax (expense) recovery:
Reclassification of amortization of employee future benefits Gross amount (0.1) – Tax (expense) recovery – –
Net amount (0.1) –
Other comprehensive loss from continuing operations, net of tax (0.1) –
Total comprehensive loss (3.9) (9.5)
Comprehensive income attributable to non-controlling interest: Net earnings – (0.3)
Comprehensive loss attributable to the company $ (3.9) $ (9.8)
The accompanying notes are an integral part of the consolidated financial statements.
30 CATALYST PAPER 2014 FIRST QUARTER REPORT │ CONSOLIDATED FINANCIAL STATEMENTS

CONSOLIDATED STATEMENTS OF EQUITY
Equity attributable to the Company Common stock
(Unaudited in millions of Canadian dollars) Number
of shares $ Deficit
Accumulated other comprehensive
income
Non-controlling
interest Total Balance as at December 31, 2012 14,527,571 $ 144.9 $ (35.2) $ 6.6 $ 6.3 $ 122.6
Net loss – – (127.6) – 0.3 (127.3)
De-recognition of non-controlling interest – – – – (6.6) (6.6)
Other comprehensive income, net of tax – – – 24.2 – 24.2
Balance as at December 31, 2013 14,527,571 $ 144.9 $ (162.8) $ 30.8 $ – $ 12.9
Net loss – – (3.8) – – (3.8)
Other comprehensive loss, net of tax – – – (0.1) – (0.1)
Balance as at March 31, 2014 14,527,571 $ 144.9 $ (166.6) $ 30.7 $ – $ 9.0
The accompanying notes are an integral part of the consolidated financial statements.
CATALYST PAPER 2014 FIRST QUARTER REPORT │ CONSOLIDATED FINANCIAL STATEMENTS 31

CONSOLIDATED STATEMENTS OF CASH FLOWS
Three months
ended March 31, (Unaudited and in millions of Canadian dollars) 2014 2013
Cash flows provided (used) by:
Operations Net loss $ (3.8) $ (9.5) Items not requiring (providing) cash
Depreciation and amortization 10.9 12.4 Foreign exchange loss on long-term debt 11.2 5.9 Non-cash reorganization items – 0.5 Employee future benefits, expense under cash contributions (1.9) (1.9) Gain on disposal of property, plant and equipment – (0.7) Gain on disposal of non-core assets1 – (9.4) Increase in other long-term obligations 0.5 – Gain on purchase of senior secured notes (0.9) – Other 0.4 0.5
Changes in non-cash working capital Accounts receivable (2.1) 0.6 Inventories (6.6) (6.4) Prepaids and other 0.3 2.1 Accounts payable and accrued liabilities 15.7 4.7
Cash flows provided (used) by operating activities 23.7 (1.2)
Investing Additions to property, plant and equipment (3.1) (5.9) Proceeds from sale of property, plant and equipment – 0.8 Proceeds from sale of non-core assets1 – 37.5 Increase in restricted cash (note 12) (22.5) (17.2) (Increase) decrease in other assets (0.2) 1.2
Cash flows provided (used) by investing activities (25.8) 16.4
Financing Decrease in revolving loan (9.3) (19.3) Proceeds from secured term loan 20.0 – Deferred financing costs (note 12) (1.0) – Purchase of senior secured notes (9.5) – Decrease in other long-term debt (0.3) (0.3)
Cash flows used by financing activities $ (0.1) $ (19.6)
Cash and cash equivalents, decrease in the period (2.2) (4.4) Cash and cash equivalents, beginning of the period 12.1 18.5
Cash and cash equivalents, end of the period $ 9.9 $ 14.1
Supplemental disclosures: Income taxes paid $ – $ – Net interest paid 9.1 10.6
1 Non-core assets disposed of during the period ended March 31, 2013 included the Snowflake mill and the company’s interest in Powell River Energy Inc.
The accompanying notes are an integral part of the consolidated financial statements.
32 CATALYST PAPER 2014 FIRST QUARTER REPORT │ CONSOLIDATED FINANCIAL STATEMENTS

CONSOLIDATED BUSINESS SEGMENTS (Unaudited and in millions of Canadian dollars)
Three months ended March 31, 2014
Specialty Printing Papers Newsprint Pulp
Corporate Adjustments Total
Sales to external customers $ 153.5 $ 54.4 $ 66.0 $ – $ 273.9 Inter-segment sales – – 8.0 (8.0) – Depreciation and amortization 8.6 1.7 0.6 – 10.9 Operating earnings (loss) (2.7) 3.8 13.7 – 14.8 Additions to property, plant and equipment 2.0 0.6 0.5 – 3.1
Three months ended March 31, 2013
Specialty Printing Papers Newsprint Pulp
Corporate Adjustments Total
Sales to external customers $ 149.6 $ 46.6 $ 50.9 $ – $ 247.1 Inter-segment sales – – 6.0 (6.0) – Depreciation and amortization 10.6 1.4 0.4 – 12.4 Operating earnings (loss) (2.9) 0.7 1.0 – (1.2) Additions to property, plant and equipment 4.1 0.5 1.3 – 5.9
The accompanying notes are an integral part of the consolidated financial statements.
CATALYST PAPER 2014 FIRST QUARTER REPORT │ CONSOLIDATED FINANCIAL STATEMENTS 33

NOTES TO THE CONSOLIDATED FINANCIAL STATEMENTS (Unaudited and in millions of Canadian dollars, except where otherwise stated)
TABLE OF CONTENTS
Note 1 Basis of Presentation 35
Note 2 Segmented Information 35
Note 3 Significant Accounting Policies 35
Note 4 Variable Interest Entities 35
Note 5 Assets Held for Sale and Discontinued Operations 35
Note 6 Accounts Receivable 36
Note 7 Inventories 36
Note 8 Prepaids and Other 37
Note 9 Property, Plant and Equipment 37
Note 10 Other Assets 37
Note11 Accounts Payable and Accrued Liabilities 38
Note 12 Long-Term Debt 38
Note 13 Employee Future Benefits 40
Note 14 Restructuring 41
Note 15 Other Income, Net 41
Note 16 Income Taxes 42
Note 17 Fair Value Measurement 42
Note 18 Financial Instruments 42
Note 19 Gain Contingencies 43
Note 20 Comparative Figures 44
34 CATALYST PAPER 2014 FIRST QUARTER REPORT │ CONSOLIDATED FINANCIAL STATEMENTS

1. BASIS OF PRESENTATION
The consolidated financial statements include the accounts of Catalyst Paper Corporation and, from their respective dates of acquisition of control or formation, its wholly owned subsidiaries and partnerships (collectively, the company). All inter-company transactions and amounts have been eliminated on consolidation.
The accompanying unaudited interim consolidated financial statements have been prepared in accordance with United States generally accepted accounting principles (U.S. GAAP), on a basis consistent with those followed in the December 31, 2013 audited annual consolidated financial statements. These unaudited interim consolidated financial statements do not include all information and note disclosures required by U.S. GAAP for annual financial statements, and therefore should be read in conjunction with the December 31, 2013 audited consolidated financial statements and the notes thereto. In the opinion of the company, the unaudited interim consolidated financial statements contained herein contain all the information and note disclosures necessary to fairly present the results of the interim periods included. The results for the periods included herein may not be indicative of the results for the entire year.
2. SEGMENTED INFORMATION
The company is a significant specialty mechanical printing papers and newsprint producer in North America. The company operates in three business segments:
Specialty printing papers – Manufacture and sale of mechanical specialty printing papers
Newsprint – Manufacture and sale of newsprint
Pulp – Manufacture and sale of long-fibre Northern Bleached Softwood Kraft (NBSK) pulp
The company owns and operates three manufacturing facilities in the province of British Columbia (B.C.), Canada.
The primary market for the company’s paper products is North America. The primary markets for the company’s pulp products are Asia and Australasia.
3. SIGNIFICANT ACCOUNTING POLICIES
Recently implemented accounting changes
There were no new pronouncements issued by the FASB that impacted our consolidated financial statements in Q1 2014.
Changes in future accounting standards
There were no new pronouncements issued by the FASB that may materially impact the company’s consolidated financial statements for future periods.
4. VARIABLE INTEREST ENTITIES
The company has identified one potential VIE, but has not been able to obtain the financial information necessary to evaluate whether the entity is a VIE, or, if the entity is a VIE, whether the company is the primary beneficiary. The company has entered into a building lease agreement with this potential VIE whereby the company has agreed to continue making the prescribed lease payments directly to the financial institution holding the mortgage on the building in the event the lessor is no longer able to meet its contractual obligations. As at March 31, 2014, the principal amount of the mortgage was $0.5 million (December 31, 2013 - $1.0 million). This agreement does not increase the company’s liability beyond the obligation under the building lease.
5. ASSETS HELD FOR SALE AND DISCONTINUED OPERATIONS
Other assets held for sale
The company will settle the mortgage receivable from PRSC Limited Partnership and sell its interest in PRSC Land Developments Ltd. for proceeds of approximately $3.0 million. The company continues to actively market the remaining poplar plantation land. These assets were reported as held for sale in the consolidated balance sheets as of March 31, 2014.
CATALYST PAPER 2014 FIRST QUARTER REPORT │ CONSOLIDATED FINANCIAL STATEMENTS 35
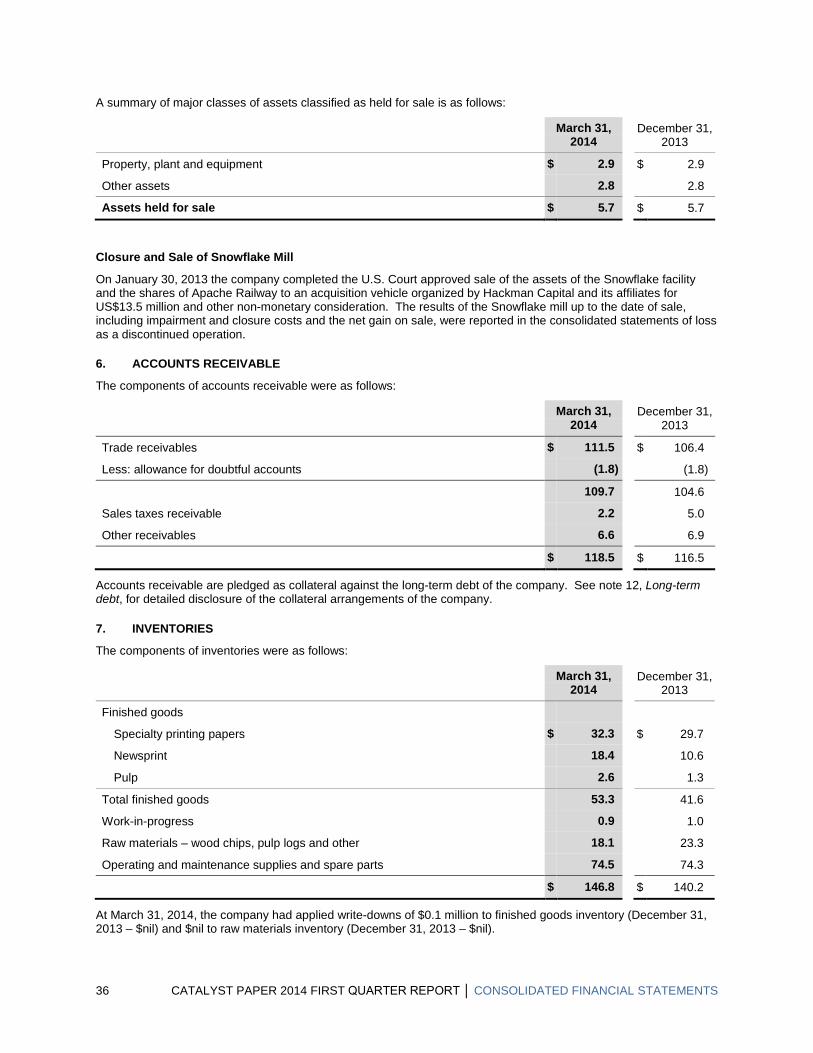
A summary of major classes of assets classified as held for sale is as follows:
March 31,
2014 December 31,
2013
Property, plant and equipment $ 2.9 $ 2.9
Other assets 2.8 2.8
Assets held for sale $ 5.7 $ 5.7
Closure and Sale of Snowflake Mill
On January 30, 2013 the company completed the U.S. Court approved sale of the assets of the Snowflake facility and the shares of Apache Railway to an acquisition vehicle organized by Hackman Capital and its affiliates for US$13.5 million and other non-monetary consideration. The results of the Snowflake mill up to the date of sale, including impairment and closure costs and the net gain on sale, were reported in the consolidated statements of loss as a discontinued operation.
6. ACCOUNTS RECEIVABLE
The components of accounts receivable were as follows:
March 31,
2014 December 31,
2013
Trade receivables $ 111.5 $ 106.4
Less: allowance for doubtful accounts (1.8) (1.8)
109.7 104.6
Sales taxes receivable 2.2 5.0
Other receivables 6.6 6.9
$ 118.5 $ 116.5
Accounts receivable are pledged as collateral against the long-term debt of the company. See note 12, Long-term debt, for detailed disclosure of the collateral arrangements of the company.
7. INVENTORIES
The components of inventories were as follows:
March 31,
2014 December 31,
2013
Finished goods
Specialty printing papers $ 32.3 $ 29.7
Newsprint 18.4 10.6
Pulp 2.6 1.3
Total finished goods 53.3 41.6
Work-in-progress 0.9 1.0
Raw materials – wood chips, pulp logs and other 18.1 23.3
Operating and maintenance supplies and spare parts 74.5 74.3
$ 146.8 $ 140.2
At March 31, 2014, the company had applied write-downs of $0.1 million to finished goods inventory (December 31, 2013 – $nil) and $nil to raw materials inventory (December 31, 2013 – $nil).
36 CATALYST PAPER 2014 FIRST QUARTER REPORT │ CONSOLIDATED FINANCIAL STATEMENTS

Inventories are pledged as collateral against the long-term debt of the company. See note 12, Long-term debt, for detailed disclosure of the collateral arrangements of the company.
8. PREPAIDS AND OTHER
The components of prepaids and other were as follows:
March 31,
2014 December 31,
2013
Property taxes, insurance and licenses $ 2.3 $ 3.5
Other 1.9 1.0
$ 4.2 $ 4.5
Prepaids and other assets are pledged as collateral against the long-term debt of the company. See note 12, Long-term debt, for detailed disclosure of the collateral arrangements of the company.
9. PROPERTY, PLANT AND EQUIPMENT
The components of property, plant and equipment were as follows:
March 31,
2014 December 31,
2013
Cost $ 501.7 $ 498.7
Accumulated depreciation, amortization and impairment 97.4 86.5
Net book value $ 404.3 $ 412.2
Property, plant and equipment are pledged as collateral against the long-term debt of the company. See note 12, Long-term debt, for detailed disclosure of the collateral arrangements of the company.
10. OTHER ASSETS
The components of other assets were as follows:
March 31,
2014 December 31,
2013
Deferred financing costs $ 5.5 $ 4.9
Deferred charges and other 4.2 3.9
Accrued benefit asset – pension plan (note 13) 0.1 0.1
$ 9.8 $ 8.9
Other assets are pledged as collateral against the long-term debt of the company. See note 12, Long-term debt, for detailed disclosure of the collateral arrangements of the company.
CATALYST PAPER 2014 FIRST QUARTER REPORT │ CONSOLIDATED FINANCIAL STATEMENTS 37
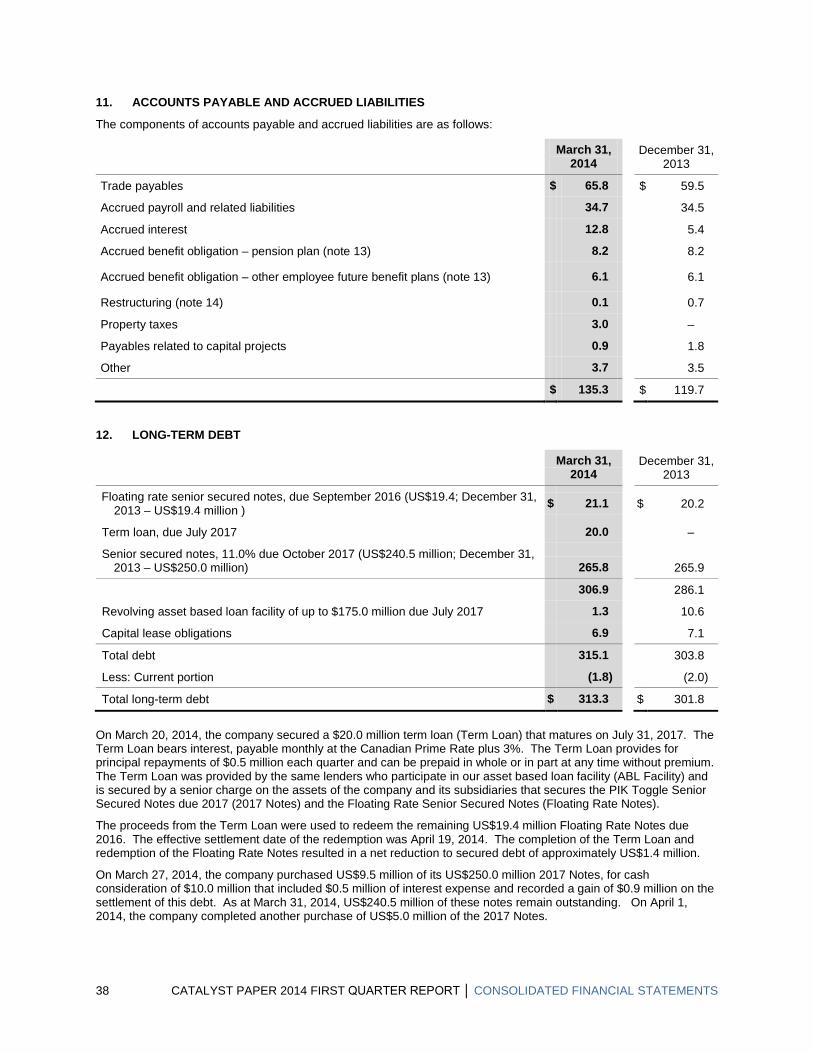
11. ACCOUNTS PAYABLE AND ACCRUED LIABILITIES
The components of accounts payable and accrued liabilities are as follows:
March 31, 2014
December 31, 2013
Trade payables $ 65.8 $ 59.5
Accrued payroll and related liabilities 34.7 34.5
Accrued interest 12.8 5.4
Accrued benefit obligation – pension plan (note 13) 8.2 8.2
Accrued benefit obligation – other employee future benefit plans (note 13) 6.1 6.1
Restructuring (note 14) 0.1 0.7
Property taxes 3.0 –
Payables related to capital projects 0.9 1.8
Other 3.7 3.5
$ 135.3 $ 119.7
12. LONG-TERM DEBT
March 31,
2014 December 31,
2013
Floating rate senior secured notes, due September 2016 (US$19.4; December 31, 2013 – US$19.4 million ) $ 21.1 $ 20.2
Term loan, due July 2017 20.0 –
Senior secured notes, 11.0% due October 2017 (US$240.5 million; December 31, 2013 – US$250.0 million) 265.8 265.9
306.9 286.1
Revolving asset based loan facility of up to $175.0 million due July 2017 1.3 10.6
Capital lease obligations 6.9 7.1
Total debt 315.1 303.8
Less: Current portion (1.8) (2.0)
Total long-term debt $ 313.3 $ 301.8
On March 20, 2014, the company secured a $20.0 million term loan (Term Loan) that matures on July 31, 2017. The Term Loan bears interest, payable monthly at the Canadian Prime Rate plus 3%. The Term Loan provides for principal repayments of $0.5 million each quarter and can be prepaid in whole or in part at any time without premium. The Term Loan was provided by the same lenders who participate in our asset based loan facility (ABL Facility) and is secured by a senior charge on the assets of the company and its subsidiaries that secures the PIK Toggle Senior Secured Notes due 2017 (2017 Notes) and the Floating Rate Senior Secured Notes (Floating Rate Notes).
The proceeds from the Term Loan were used to redeem the remaining US$19.4 million Floating Rate Notes due 2016. The effective settlement date of the redemption was April 19, 2014. The completion of the Term Loan and redemption of the Floating Rate Notes resulted in a net reduction to secured debt of approximately US$1.4 million.
On March 27, 2014, the company purchased US$9.5 million of its US$250.0 million 2017 Notes, for cash consideration of $10.0 million that included $0.5 million of interest expense and recorded a gain of $0.9 million on the settlement of this debt. As at March 31, 2014, US$240.5 million of these notes remain outstanding. On April 1, 2014, the company completed another purchase of US$5.0 million of the 2017 Notes.
38 CATALYST PAPER 2014 FIRST QUARTER REPORT │ CONSOLIDATED FINANCIAL STATEMENTS

The indentures governing the company’s Term Loan, Floating Rate Notes and 2017 Notes, contain customary restrictive covenants, including restrictions on incurring additional indebtedness, certain restricted payments, including dividends and investments in other persons, the creation of liens, sale and leaseback transactions, certain amalgamations, mergers, consolidations and the use of proceeds arising from certain sales of assets and certain transactions with affiliates.
The Term Loan is secured by a first charge on substantially all of the fixed assets and real property of the company that ranks senior to the lien securing the 2017 Notes and Floating Rate Notes. The Term Loan is also secured by a second charge over the company’s current assets. The Floating Rate Notes are secured by a charge on the assets of the company that ranks senior to the lien securing the 2017 Notes (Floating Rate Notes Charge Collateral) but second to the charge securing the Term Loan. Collateral provided on the 2017 Notes consists of a charge on substantially all of the assets of the company, other than (i) a senior collateral charge on the Term Loan and Floating Rate Notes, and (ii) the ABL Charge Collateral, as described below (2017 Notes Charge Collateral), and a charge on the senior collateral charge on the Term Loan, Floating Rate Notes and the ABL Charge Collateral. The indentures governing the Term Loan, Floating Rate Notes and 2017 Notes limit the ability of the company to incur debt, other than permitted debt, while the company cannot meet a fixed charge coverage ratio of 2.0:1.0 for the Floating Rate Notes and 2017 Notes and is required to exceed a fixed charge coverage ratio of 1.0:1.0 for the Term Loan. The company’s fixed charge coverage ratio under these indentures, calculated on a 12-month trailing average, was 1.8:1.0 at March 31, 2014 (December 31, 2013 – 1.0:1.0).
The company cannot make any restricted payments including paying any dividends, except to the extent the balance in its restricted payments basket is positive. The restricted payments basket under the 2017 Notes was negative $40.5 million as at March 31, 2014 (December 31, 2013 – negative $45.8 million).
The security for the ABL Facility consists of a charge on accounts receivable, inventory and cash of the company (ABL Charge Collateral) and a charge on the 2017 Notes Charge Collateral. Availability under the ABL Facility is determined by a borrowing base calculated primarily on eligible accounts receivable and eligible inventory, less certain reserves. The borrowing base at March 31, 2014, is reduced by reserves for a landlord waiver reserve in respect of rent of approximately $2.0 million, a pension reserve not exceeding the sum of normal cost pension contributions, special and catch-up payments and any other payments in respect of a Canadian pension plan that are past due of approximately $1.3 million, a reserve for credit insurance deductibles of $1.9 million, a reserve of $1.6 million for employee source deductions, and a reserve for workers compensation of $0.3 million. On March 31, 2014 the company had $128.3 million available under the ABL Facility after deducting outstanding drawings of $1.3 million and outstanding letters of credit of $18.6 million, before potential application of the springing fixed charge coverage ratio. The company also had cash on hand of $9.9 million and restricted cash of $22.5 million on March 31, 2014. Restricted cash consists of cash held in trust for the redemption of the Floating Rate Notes on April 19, 2014.
The company was in compliance with its covenants under the ABL Facility and under each of the indentures governing its outstanding senior notes on March 31, 2014.
The company’s long-term debt is recorded at amortized cost. The following table contains information about management’s best estimate of the fair value of the company’s debt:
March 31, 2014 December 31, 2013
Carrying
Value Fair
Value Carrying
Value Fair
Value
Total debt $ 315.1 $ 288.5 303.8 212.5
The fair value of the company’s long-term debt related to its senior notes is determined based on quoted market prices of identical debt instruments (level 1 fair value measurement). The fair value of the company’s debt related to the ABL Facility is measured by discounting the respective cash flows at quoted market rates for similar debt having the same maturity (level 2 fair value measurement). In measuring fair value, the company incorporates credit valuation adjustments to reflect its own non-performance risk, where applicable.
CATALYST PAPER 2014 FIRST QUARTER REPORT │ CONSOLIDATED FINANCIAL STATEMENTS 39
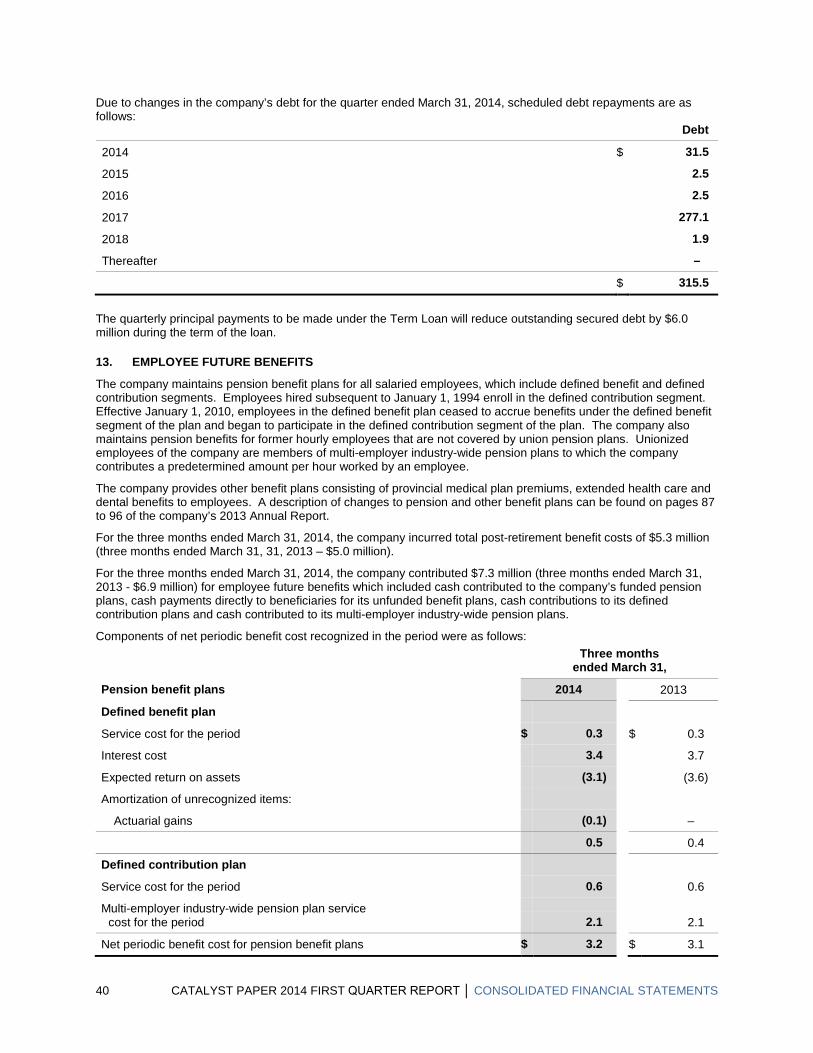
Due to changes in the company’s debt for the quarter ended March 31, 2014, scheduled debt repayments are as follows: Debt
2014 $ 31.5
2015 2.5
2016 2.5
2017 277.1
2018 1.9
Thereafter –
$ 315.5
The quarterly principal payments to be made under the Term Loan will reduce outstanding secured debt by $6.0 million during the term of the loan.
13. EMPLOYEE FUTURE BENEFITS
The company maintains pension benefit plans for all salaried employees, which include defined benefit and defined contribution segments. Employees hired subsequent to January 1, 1994 enroll in the defined contribution segment. Effective January 1, 2010, employees in the defined benefit plan ceased to accrue benefits under the defined benefit segment of the plan and began to participate in the defined contribution segment of the plan. The company also maintains pension benefits for former hourly employees that are not covered by union pension plans. Unionized employees of the company are members of multi-employer industry-wide pension plans to which the company contributes a predetermined amount per hour worked by an employee.
The company provides other benefit plans consisting of provincial medical plan premiums, extended health care and dental benefits to employees. A description of changes to pension and other benefit plans can be found on pages 87 to 96 of the company’s 2013 Annual Report.
For the three months ended March 31, 2014, the company incurred total post-retirement benefit costs of $5.3 million (three months ended March 31, 31, 2013 – $5.0 million).
For the three months ended March 31, 2014, the company contributed $7.3 million (three months ended March 31, 2013 - $6.9 million) for employee future benefits which included cash contributed to the company’s funded pension plans, cash payments directly to beneficiaries for its unfunded benefit plans, cash contributions to its defined contribution plans and cash contributed to its multi-employer industry-wide pension plans.
Components of net periodic benefit cost recognized in the period were as follows:
Three months
ended March 31,
Pension benefit plans 2014 2013
Defined benefit plan
Service cost for the period $ 0.3 $ 0.3
Interest cost 3.4 3.7
Expected return on assets (3.1) (3.6)
Amortization of unrecognized items:
Actuarial gains (0.1) –
0.5 0.4
Defined contribution plan
Service cost for the period 0.6 0.6
Multi-employer industry-wide pension plan service cost for the period 2.1 2.1
Net periodic benefit cost for pension benefit plans $ 3.2 $ 3.1
40 CATALYST PAPER 2014 FIRST QUARTER REPORT │ CONSOLIDATED FINANCIAL STATEMENTS
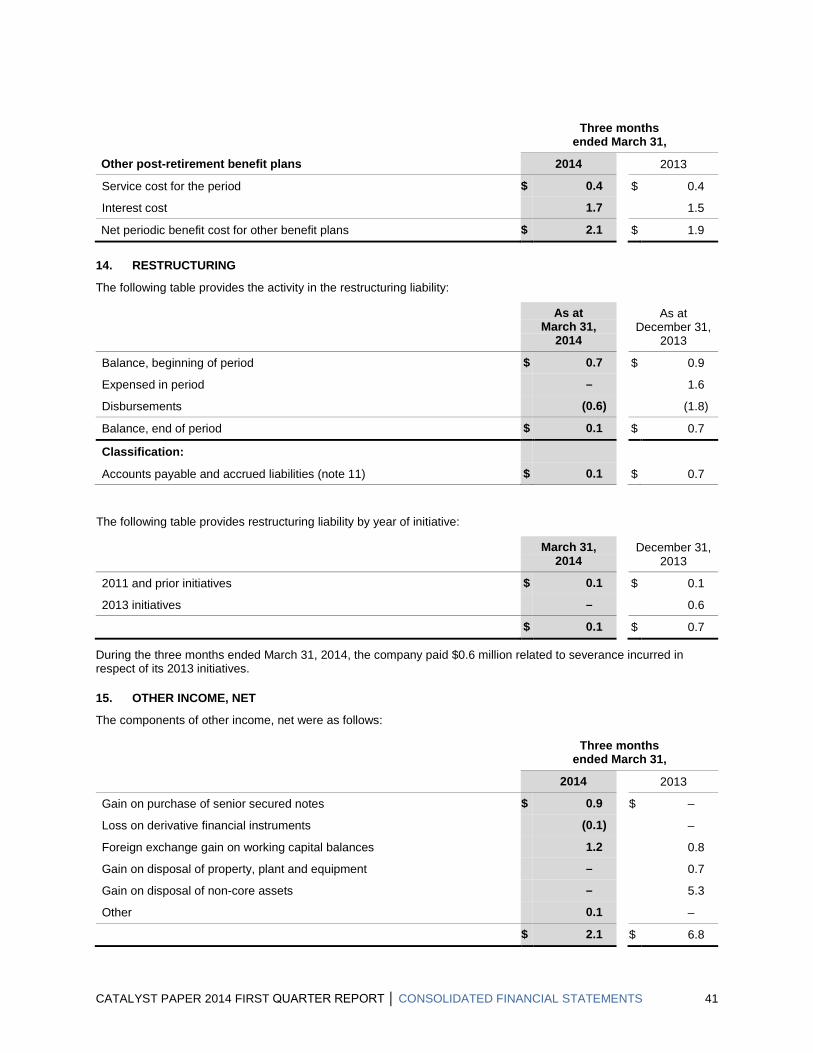
Three months
ended March 31,
Other post-retirement benefit plans 2014 2013
Service cost for the period $ 0.4 $ 0.4
Interest cost 1.7 1.5
Net periodic benefit cost for other benefit plans $ 2.1 $ 1.9
14. RESTRUCTURING
The following table provides the activity in the restructuring liability:
As at
March 31, 2014
As at December 31,
2013
Balance, beginning of period $ 0.7 $ 0.9
Expensed in period – 1.6
Disbursements (0.6) (1.8)
Balance, end of period $ 0.1 $ 0.7
Classification:
Accounts payable and accrued liabilities (note 11) $ 0.1 $ 0.7
The following table provides restructuring liability by year of initiative:
March 31,
2014 December 31,
2013
2011 and prior initiatives $ 0.1 $ 0.1
2013 initiatives – 0.6
$ 0.1 $ 0.7
During the three months ended March 31, 2014, the company paid $0.6 million related to severance incurred in respect of its 2013 initiatives.
15. OTHER INCOME, NET
The components of other income, net were as follows:
Three months
ended March 31,
2014 2013
Gain on purchase of senior secured notes $ 0.9 $ –
Loss on derivative financial instruments (0.1) –
Foreign exchange gain on working capital balances 1.2 0.8
Gain on disposal of property, plant and equipment – 0.7
Gain on disposal of non-core assets – 5.3
Other 0.1 –
$ 2.1 $ 6.8
CATALYST PAPER 2014 FIRST QUARTER REPORT │ CONSOLIDATED FINANCIAL STATEMENTS 41

16. INCOME TAXES
As at March 31, 2014, the company has a valuation allowance on its deferred tax assets of $245.3 million (December 31, 2013 - $245.9 million). The effective rate for the quarter ended March 31, 2014 was nil%. The effective rate is less than the statutory rate primarily due to non-recognition of the tax benefit of the losses for the quarter. A description of the company’s income taxes can be found on pages 97 to 100 of the company’s 2013 Annual Report.
17. FAIR VALUE MEASUREMENT
An established fair value hierarchy requires the company to maximize the use of observable inputs and minimize the use of unobservable inputs when measuring fair value. A financial instrument’s categorization within the fair value hierarchy is based upon the lowest level of input that is available and significant to the fair value measurement. There are three levels of inputs that may be used to measure fair value.
Level 1
Quoted prices in active markets for identical assets or liabilities.
Level 2
Observable inputs other than quoted prices in active markets for identical assets and liabilities, such as quoted prices for identical or similar assets or liabilities in markets that are not active, or other inputs that are observable or can be corroborated by observable market data for substantially the full term of the assets or liabilities.
Level 3
Inputs that are generally unobservable and are supported by little or no market activity and that are significant to the fair value determination of the assets or liabilities.
The following table presents information about the fair value of the company’s derivative financial instruments measured at fair value on a recurring basis:
March 31,
2014 Fair value hierarchy
Balance sheet classification
Assets
Currency contracts $ 0.2 2 (1) Prepaids and other
Liabilities
Commodity contracts $ 0.3 2 (2) Accounts payable and accrued liabilities
Fair value of the company’s derivatives are classified under Level 2 as they are measured as follows: 1 The fair value of forward currency contracts is measured using the discounted difference between contractual rates and market future rates.
Interest rates, forward market rates, and volatility are used as inputs for such valuation techniques. The company incorporates credit valuation adjustments to appropriately reflect both its own non-performance risk and the counterparty’s non-performance risk in the fair value measurements.
2 The fair value of commodity swap contracts is measured using the discounted difference between contractual rates and market rates. The company incorporates credit valuation adjustments to appropriately reflect both its own non-performance risk and the counterparty’s non-performance risk in the fair value measurements.
The carrying value of the company’s other financial instruments, namely cash and cash equivalents, accounts receivable, accounts payable and accrued liabilities approximate their fair values because of the short-term maturity of these instruments.
18. FINANCIAL INSTRUMENTS
(a) Financial Risk Management
Financial instruments of the company consist primarily of cash and cash equivalents, accounts receivable, accounts payable and accrued liabilities and long-term debt.
The company has exposure to risk from its financial instruments, specifically credit risk, market risk (including currency, price and interest rate risk) and liquidity risk. A summary of the company’s financial risk management objectives can be found on page 104 to 106 of the company’s 2013 Annual Report.
42 CATALYST PAPER 2014 FIRST QUARTER REPORT │ CONSOLIDATED FINANCIAL STATEMENTS

The company is exposed to credit risk on accounts receivable from its customers who are mainly in the newspaper publishing, commercial printing businesses and paper manufacturing businesses. Aging of receivables were as follows:
March 31,
2014 December 31,
2013
Trade receivables
Current $ 94.9 $ 96.3
Past due 1-30 days 10.4 7.5
Past due 31-90 days 3.5 1.2
Past due over 90 days 2.7 1.4
111.5 106.4
Allowance for doubtful accounts (1.8) (1.8)
Trade receivables, net 109.7 104.6
Other receivables, including sales tax recoverables 8.8 11.9
Accounts receivable (note 6) $ 118.5 $ 116.5
The movement in the allowance for doubtful accounts in respect of trade receivables was as follows:
March 31,
2014 December 31,
2013
Balance, beginning of period $ 1.8 $ 2.2
Decrease in provision – (0.4)
Balance, end of period $ 1.8 $ 1.8
(b) Revenue Risk Management Instruments
Foreign currency options and forward contracts outstanding to sell U.S. dollars were as follows:
Options
Purchased US$ put Sold US$ call
Term US$ millions Average rate
US$/CDN$ US$ millions Average rate
US$/CDN$
As at March 31, 2014
0 to 12 months $ 55 0.9190 $ 55 0.8701
At period-end exchange rates, the net amount the company would receive to settle the above contracts and options is $0.2 million (December 31, 2013 - $ nil). At March 31, 2014, instruments having a notional principal of US$55.0 million are marked to market, and the related gains and losses are recognized in other income.
At March 31, 2014, commodity swap agreements are outstanding to fix the sales price of 5,000 metric tonnes of NBSK pulp within the next ten months. These contracts are reported at their fair value which was negative $0.3 million at March 31, 2014 (December 31, 2013 - $nil), with related gains and losses recognized in other income.
19. GAIN CONTINGENCIES
The company is subject to a gain contingency for successfully appealing a sales tax reassessment. This contingency is not reflected in the financial results of the company as of March 31, 2014. On January 28, 2014, the Supreme Court of British Columbia ruled in favour of Catalyst Paper in the company’s action against the Province of British Columbia involving a reassessment of the amount of sales tax payable under the Social Services Tax Act on electricity purchased from PREI in 2001 through 2010. The company estimates that it will receive a sales tax refund
CATALYST PAPER 2014 FIRST QUARTER REPORT │ CONSOLIDATED FINANCIAL STATEMENTS 43

of $5.8 million including interest. The Province of British Columbia has applied to the British Columbia Court of Appeal for leave to appeal this decision. The hearing has been scheduled for May 8, 2014.
20. COMPARATIVE FIGURES
Certain comparative figures presented in the interim consolidated financial statements have been reclassified to conform to the current period presentation.
44 CATALYST PAPER 2014 FIRST QUARTER REPORT │ CONSOLIDATED FINANCIAL STATEMENTS

Brian BaardaVice-President, Finance and Chief Financial OfficerTel: 604-247-4710
Common Shares(symbol: CYT)The Toronto Stock Exchange
ANNUAL AND QUARTERLY REPORTS
For copies of annual and quarterly reports contact:Tel: 604-247-4400Fax: 604-247-0512
SHAREINFORMATION
INVESTORRELATIONS

Catalyst Paper Corporation2nd Floor, 3600 Lysander Lane
Richmond, B.C. V7B 1C3604-247-4400
www.catalystpaper.com