first quarter 2018 may 3, 2018 results - solvay.com · safe harbor may 3, 2018 2 first quarter 2018...
TRANSCRIPT

First Quarter 2018 Results
May 3, 2018

Safe harbor
May 3, 2018
First Quarter 2018 Results 2
This presentation may contain forward-looking information. Forward-
looking statements describe expectations, plans, strategies, goals,
future events or intentions. The achievement of forward-looking
statements contained in this presentation is subject to risks and
uncertainties relating to a number of factors, including general
economic factors, interest rate and foreign currency exchange rate
fluctuations, changing market conditions, product competition, the
nature of product development, impact of acquisitions and
divestitures, restructurings, products withdrawals, regulatory approval
processes, all-in scenario of R&D projects and other unusual items.
Consequently, actual results or future events may differ materially
from those expressed or implied by such forward-looking statements.
Should known or unknown risks or uncertainties materialize, or
should our assumptions prove inaccurate, actual results could vary
materially from those anticipated. The Company undertakes no
obligation to publicly update or revise any forward-looking statements
This document does not constitute an offer to sell, or the solicitation
of an offer to subscribe for or buy, any securities.
Forenote
Following the announcement in September 2017 of plans to divest
the Polyamide business, these have been reclassified as
discontinued operations and as assets held for sale. For comparative
purposes, the first quarter of the 2017 income statement has been
restated.
Besides IFRS accounts, Solvay also presents underlying Income
Statement performance indicators to provide a more consistent and
comparable indication of the Group’s financial performance. The
underlying performance indicators adjust IFRS figures for the non-
cash Purchase Price Allocation (PPA) accounting impacts related to
acquisitions, for the coupons of perpetual hybrid bonds, classified as
equity under IFRS but treated as debt in the underlying statements,
and for other elements that would distort the analysis of the Group’s
underlying performance.

OVERVIEW
• Executing our plan
• Financial highlights
• Priorities and outlook
• Appendices
3 May 3, 2018
First Quarter 2018 Results

Strong volume growth counters forex headwinds
Sustained EBITDA margin
May 3, 2018
First Quarter 2018 Results 4
Strong organic EBITDA growth of 9%
Foreign exchange headwinds, as expected
EBITDA margin sustained at 21%

2018 first quarter results Strong volume growth counters adverse forex
May 3, 2018
First Quarter 2018 Results 5
EBITDA -3%
(+9% organically)
Volume/Mix
Strong volumes across Advanced
Materials and Advanced Formulations
Pricing power
Net pricing stable in higher raw material
and energy context
Fixed costs
Operational excellence and synergies
mostly offset inflation
Resulting from
Lower EBITDA
Phasing in working capital
Capex discipline maintained
Underlying net debt at €5.3 billion
Leverage ratio stable at 2.2x
Free cash flow[1]
€105 million
EBITDA margin
sustained at 21%
FCF to Solvay shareholders[1][2]
€99 million
[1] Free cash flow from continuing operations
[2] Free cash flow after financing payments and minority interests
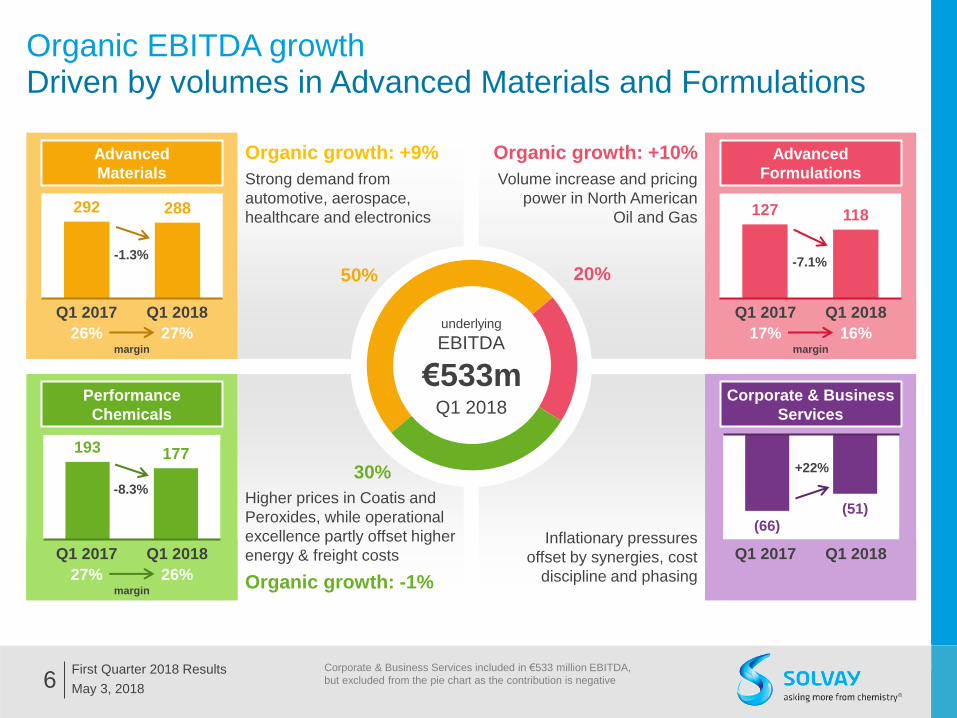
Organic growth: +9%
Strong demand from
automotive, aerospace,
healthcare and electronics
Higher prices in Coatis and
Peroxides, while operational
excellence partly offset higher
energy & freight costs
Organic growth: -1%
Organic growth: +10%
Volume increase and pricing
power in North American
Oil and Gas
Inflationary pressures
offset by synergies, cost
discipline and phasing
underlying
EBITDA
Q1 2018
6
Organic EBITDA growth Driven by volumes in Advanced Materials and Formulations
Advanced
Formulations
Advanced
Materials
Performance
Chemicals
May 3, 2018
First Quarter 2018 Results
margin
26% 27%
Q1 2017 Q1 2018
margin
27% 26%
Q1 2017 Q1 2018
margin
17% 16%
Q1 2017 Q1 2018
Corporate & Business Services included in €533 million EBITDA,
but excluded from the pie chart as the contribution is negative
Corporate & Business
Services
Q1 2017 Q1 2018
127 118
-7.1%
(66) (51)
+22%
193 177
-8.3%
292 288
-1.3%
50% 20%
30%
€533m

OVERVIEW
• Executing our plan
• Financial highlights
• Priorities and outlook
• Appendices
May 3, 2018 7 First Quarter 2018 Results

May 3, 2018
First Quarter 2018 Results 8
Sales impacted by forex & scope Strong organic growth
Volume growth
Advanced Materials: good demand, mainly
from automotive and aerospace markets
Advanced Formulations: continued recovery
in the North American shale Oil & Gas
market
Adverse forex & scope[1]
US dollar depreciation
Scope reduction from smaller divestments
Net sales in € million
[1] Scope effects include acquisitions and divestments of smaller businesses not leading to the
restatement of previous periods: polyolefin cross-linkable compounds and formulated resins
businesses in June 2017, and to a lesser extent the phosphorous business in February 2018.
Q1 2017
Scope -1.5%
Forex conversion
-7.1%
Volume & mix +5.1%
Price +0.3%
Q1 2018
2,574 (38) (183) 131 8 2,492
-3.2%
+5.9%
9
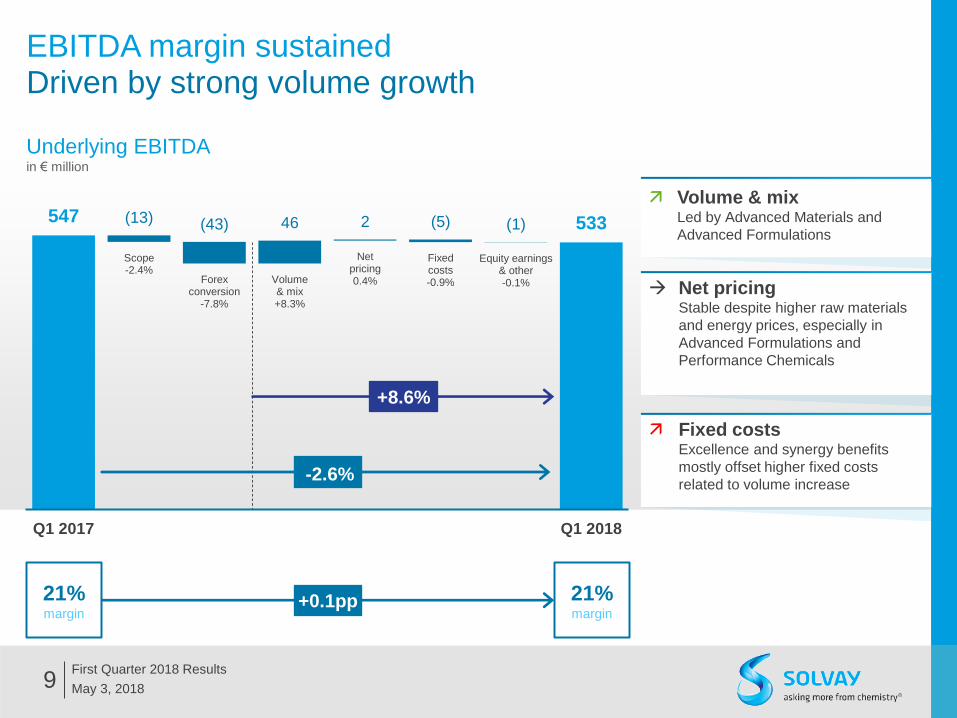
EBITDA margin sustained Driven by strong volume growth
May 3, 2018
First Quarter 2018 Results
Net pricing Stable despite higher raw materials
and energy prices, especially in
Advanced Formulations and
Performance Chemicals
+0.1pp 21% margin
21% margin
Underlying EBITDA in € million
Fixed costs Excellence and synergy benefits
mostly offset higher fixed costs
related to volume increase
Volume & mix Led by Advanced Materials and
Advanced Formulations
Q1 2017
Scope -2.4%
Forex conversion
-7.8%
Volume & mix +8.3%
Net pricing 0.4%
Fixed costs -0.9%
Equity earnings & other -0.1%
Q1 2018
547 (13) (43) 46 2 (5) (1) 533
-2.6%
+8.6%

May 3, 2018
First Quarter 2018 Results 10
Underlying profit from continuing operations up EBITDA reduction more than offset by lower financial charges
[1] Adjustments are made to IFRS figures to obtain underlying figures. This presentation
reconstructs the IFRS from the underlying and therefore the adjustment are presented with the
opposite sign.
in € million Q1 2018 Q1 2017 % yoy
Net sales 2,492 2,574 -3%
EBITDA 533 547 -3%
EBITDA margin 21% 21% -
Depreciation & amortization (163) (167) +3%
EBIT 370 379 -2%
EBIT margin 15% 15% -
Net financial charges (86) (111) +22%
Income taxes (67) (68) +2%
Tax rate (ytd) 25% 26% -2pp
Profit, continuing operations 216 200 +8%
Discontinued operations 41 72 -44%
Non-controlling interests (-) (10) (16) +40%
Profit, Solvay share 247 256 -3%
EPS 2.39 2.48 -3.5%
EPS, continuing operations 2.00 1.82 +9.8%
Underlying profit (Solvay share) slightly
down (3%)
Lower contribution form discontinued
operations, after finalisation of Acetow
divestment
Underlying P&L
Underlying profit from continuing
operations up 8%
Lower net financial charges thanks to
improved capital structure
Lower depreciation year on year
Higher tax base offset by anticipated lower tax
rate

11 May 3, 2018
First Quarter 2018 Results
Free cash flow from continuing
operations at €105 million
Lower EBITDA
Phasing in working capital
Capex discipline maintained
[1] Underlying net debt reclassifies hybrid perpetual bonds (considered as equity under IFRS)
as debt
Cash generation in € million
Focus on cash maintained
Free cash flow to Solvay shareholders at €141 million,
of which €99 million on a continuing basis
Lower financing payments
Largely stable on a continuing basis versus Q1 2017 (€102 million)
Underlying EBITDA
Capex
Working capital Taxes
Provision payments: Employee
benefits -41 Environment -20
Other -27
Other FCF
FCF continuing operations
FCF
Financing payments:
Net interests -5
Dividends to non-controlling
interests
FCF Solvay
shareholders
533 -159
-137
-35 -88
-8 105 +42 147 -5 -1 141

12 May 3, 2018
First Quarter 2018 Results
Efficient capital structure Leading to reduced cost of debt
Underlying financial debt [1]
evolution in € billion
at weighted average
interest rate
EUR perpetual
hybrid bonds
USD bonds
EU bonds
& major debt
Other debt
Cash
Underlying
31/12/2017 31/03/2018
Net debt [1] €5.3 bn stable €5.3 bn
Leverage [2] 2.2x 2.2x
Pro forma impact
from announced
Polyamide divestment
Underlying net debt €4.2 bn
Underlying leverage 1.9x
Baa2 BBB
[1] Underlying debt includes perpetual hybrid bonds (considered as equity under IFRS)
[2] Net debt / underlying EBITDA of last 12 months

OVERVIEW
• Executing our plan
• Financial highlights
• Priorities and outlook
• Appendices
13 May 3, 2018
First Quarter 2018 Results

14
Our priorities Deliver mid-term objectives and prepare the future
Organic volume growth
Earnings and cash flow growth
Optimize organization
Sustainable value
May 3, 2018
First Quarter 2018 Results

Free cash flow[2] to exceed 2017
level of €782 million
15
Outlook Full year 2018
May 3, 2018
Underlying EBITDA to grow
5% to 7% organically[1]
[1] Excluding forex conversion and scope efffects
[2] Free cash flow from continuing operations
First Quarter 2018 Results
APPENDICES
• Additional first quarter 2018
financial data
• General information
• Other financial considerations for 2018
16 May 3, 2018
First Quarter 2018 Results
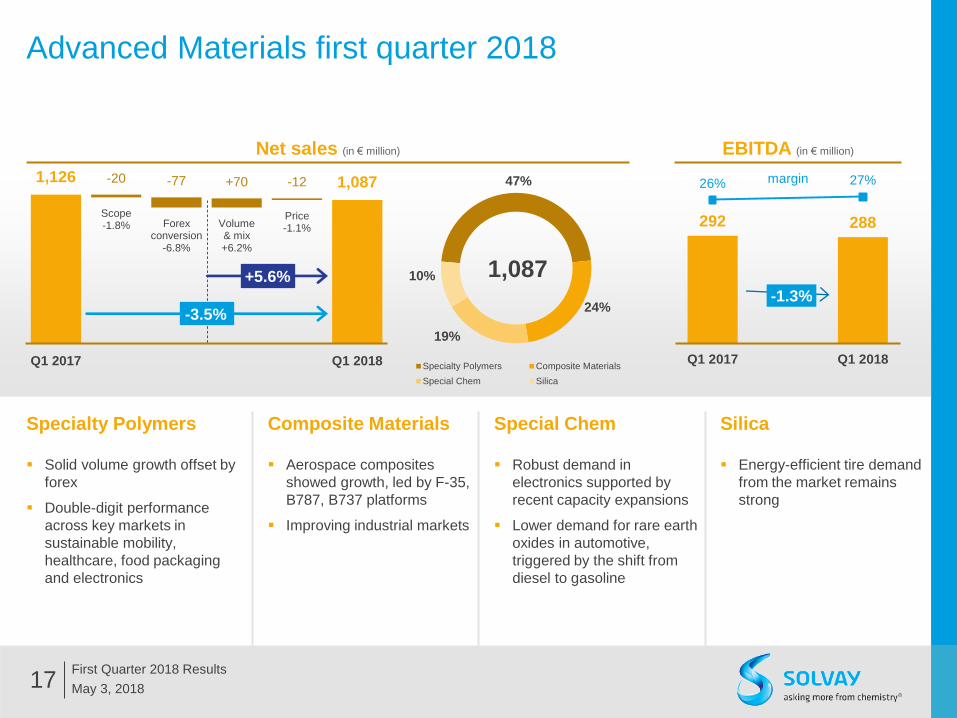
Advanced Materials first quarter 2018
17
Specialty Polymers
Solid volume growth offset by
forex
Double-digit performance
across key markets in
sustainable mobility,
healthcare, food packaging
and electronics
Composite Materials
Aerospace composites
showed growth, led by F-35,
B787, B737 platforms
Improving industrial markets
Special Chem
Robust demand in
electronics supported by
recent capacity expansions
Lower demand for rare earth
oxides in automotive,
triggered by the shift from
diesel to gasoline
Silica
Energy-efficient tire demand
from the market remains
strong
May 3, 2018
First Quarter 2018 Results
margin
Net sales (in € million) EBITDA (in € million)
Q1 2017
Scope -1.8% Forex
conversion -6.8%
Volume & mix +6.2%
Price -1.1%
Q1 2018
1,126 -20 -77 +70 -12 1,087
-3.5%
292 288
26% 27%
Q1 2017 Q1 2018
-1.3%
+5.6%
47%
24%
19%
10% 1,087
Specialty Polymers Composite Materials
Special Chem Silica

Advanced Formulations first quarter 2018
18
Novecare
• Strong volumes led by Oil & Gas, with
good demand from diversified markets
• Agro faced a slow start to the year
Technology Solutions
• Strong demand for phosphine
specialties
• Polymer additives were stable at a
high level
• Mining volumes flat on phasing effects
following inventory replenishment by
customers in the fourth quarter of 2017
Aroma Performance
• Stable volumes in vanillin ingredients
and chemical applications
• Prices edged higher after last year’s
competitive pressure
May 3, 2018
First Quarter 2018 Results
margin
Net sales (in € million) EBITDA (in € million)
127 118
17% 16%
Q1 2017 Q1 2018
-7.1%
Q1 2017
Scope -2.5% Forex
conversion -8.1%
Volume & mix +7.9%
Price +1.2%
Q1 2018
741 -19 -60 +58 +9 730
-1.5%
+10%
68%
19% 13%
730
Novecare Technology Solutions
Aroma Performance

Performance Chemicals first quarter 2018
19
Soda Ash & Derivatives
Solid demand continued in
a context of limited margin
erosion
Stable bicarbonate
volumes, better product
mix
Peroxides
Higher volumes and
prices
The new plant in China
ramped up to full
capacity in a positive
local market context
Coatis
Double-digit growth
thanks to both volumes
and prices
Better domestic market
for solvents and phenols
complemented by
exports
May 3, 2018
First Quarter 2018 Results
margin
Net sales (in € million) EBITDA (in € million)
Functional Polymers
Stable environment, both
in the Latin American
polyamide textile
business and Russian
PVC activity
55%
23% 19%
3%
671
Soda Ash & Derivatives Peroxides
Coatis Functional Polymers
193 177
27% 26%
Q1 2017 Q1 2018
-8.3%
Q1 2017
Scope - Forex
conversion -6.5%
Volume & mix +0.3%
Price +1.6%
Q1 2018
703 - -46 +2 +11 671
-4.6%
+2.1%
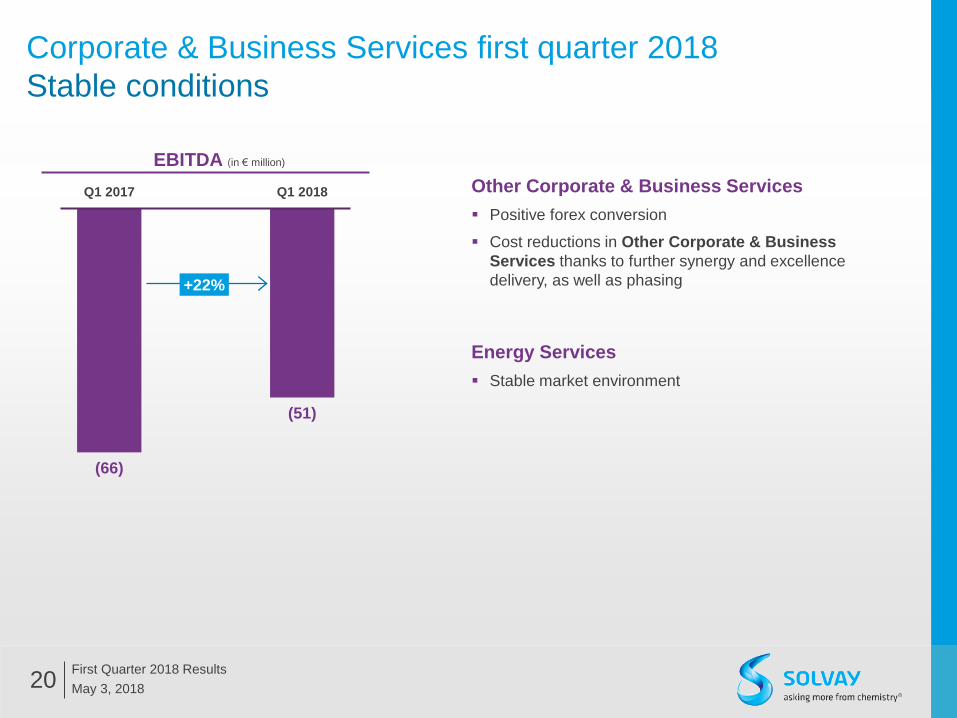
Corporate & Business Services first quarter 2018
Stable conditions
20
Other Corporate & Business Services
Positive forex conversion
Cost reductions in Other Corporate & Business
Services thanks to further synergy and excellence
delivery, as well as phasing
Energy Services
Stable market environment
May 3, 2018
First Quarter 2018 Results
EBITDA (in € million)
(66)
(51)
Q1 2017 Q1 2018
+22%

ANNEXES
• Additional first quarter 2018 financial data
• General information
• Other financial considerations for 2018
21 May 3, 2018
First Quarter 2018 Results

May 3, 2018 22
Solvay A sustainable investment
Providing mission critical solutions in fast-growth end-markets
Supporting blue chip manufacturers & brands globally
Technology focused in Advanced Materials & Advanced Formulations
Powered by innovation & market leadership positons
Highest EBITDA margin within diversified chemical companies
Propelled by volumes, underpinned by efficiency
Dividend growth over 30 years and strong cash generation
Driven by focus on cash returns
Futureproofing the business with sustainability at its core
Deliver more value that stands the test of time
First Quarter 2018 Results

We are a world leader
In the chemical industry
May 3, 2018
First Quarter 2018 Results 23
~26,800 Employees[2]
61 countries
135 Industrial sites
21 Major R&I sites
€10.1billion
net sales
€2.2billon
underlying EBITDA
[1] Applicable to ~90% of portfolio
[2] The headcounts and the number of sites stated in this document include those of the Polyamide
business that has been accounted for in discontinued operations
22% EBITDA margin
Top 3 Market position [1]
1 2
3
2017

Upgraded portfolio
May 3, 2018
First Quarter 2018 Results 24
Enhancing
customized
solution
offerings
Reducing
cyclical &
low-growth
businesses
exposure
2011 2012 2013 2014 2015 2016
Ryton
Inovyn Eco
Services
Chem-
logics
Cytec
PCC
Refri-
gerants
Indupa
Pipe-
life
Rhodia
global sustainable specialty resilient innovative MORE
Acetow
Viny-
thai
Form.
resins
2017
XL
comp
ounds
ACQUISITIONS
DIVESTMENTS
[1] Divestment in progress, expected to be finalized by the end of 2018
Polyamide [1]
Dakarto
Benvic
LT-CF
plant Ener-
gain
Phos-
phorous
Benvic

Significantly enhanced portfolio
More global, more specialty
May 3, 2018
First Quarter 2018 Results 25
>50% in
Europe
Europe
Asia & RoW
Latin America
North America
MORE
GLOBAL
Automotive & aerospace
Resources & environment
Electrical & electronics
Agro, feed & food
Consumer goods & healthcare
Building & construction
Industrial applications
~33% in each
main region
~20% in GDP+
markets
>50% in GDP+
markets
<20% sustainable
solutions
~50% sustainable
solutions
MORE
DIVERSIFIED
MORE
SUSTAINABLE
Sustainable solutions
Neutral impact
Challenged applications
(according to SPM methodology)
2010
€6.5 billon
2017
€10.1 billon
Net
Sales
>70% specialty
products
~25% specialty
products
MORE
SPECIALTY
Advanced Materials
Advanced Formulations
Performance Chemicals

Enabling tomorrow
Attractive growth markets
May 3, 2018
First Quarter 2018 Results 26
Strategic & Superior Growth Markets
4.5% annual growth
in aircraft passengers to 2025
Lightweight composites
aircraft exteriors & interiors
Specialty polymers
aircraft exteriors & interiors,
onboard electronics
Functional materials
engine and fuel systems
20% CAGR[1]
Electric & Hybrid vehicles
on the road by 2030[1]
Resources scarcity
Chemical Solutions:
improve yield of mining and
Oil & Gas exploration
Energy storage and
photovoltaic panels
High-performance polymers
vehicle bodies
Silica technology
more durable tires
Various active materials
longer-life EV batteries
[1] Source BCG: 30 million by 2030
May 3, 2018
First Quarter 2018 Results 27
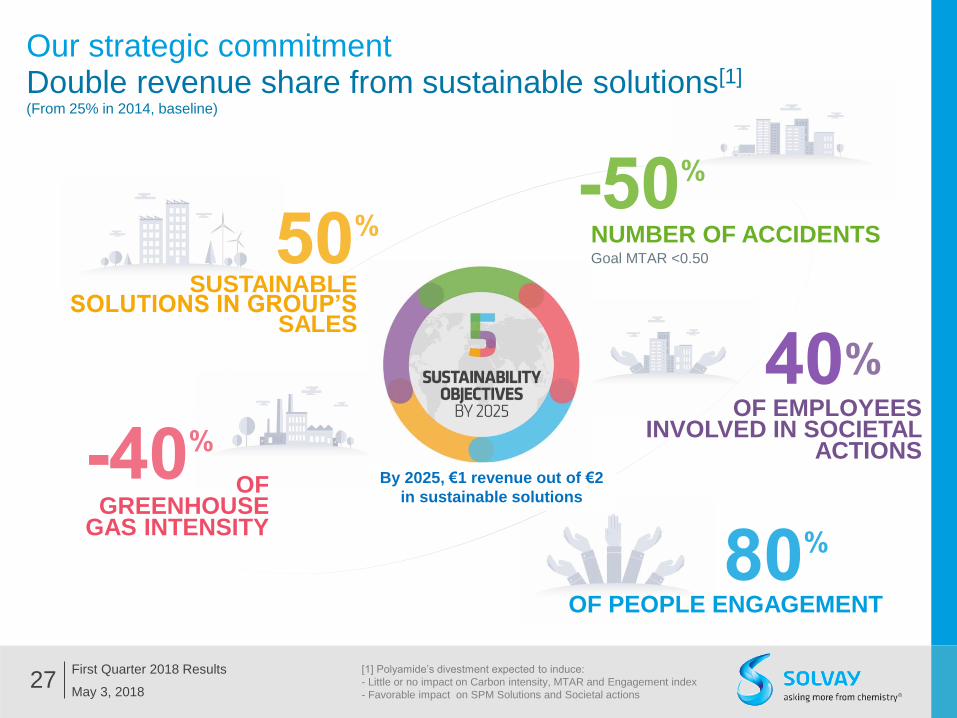
OF PEOPLE ENGAGEMENT
OF GREENHOUSE
GAS INTENSITY
SUSTAINABLE SOLUTIONS IN GROUP’S
SALES
OF EMPLOYEES INVOLVED IN SOCIETAL
ACTIONS
NUMBER OF ACCIDENTS Goal MTAR <0.50
[1] Polyamide’s divestment expected to induce:
- Little or no impact on Carbon intensity, MTAR and Engagement index
- Favorable impact on SPM Solutions and Societal actions
By 2025, €1 revenue out of €2
in sustainable solutions
Our strategic commitment Double revenue share from sustainable solutions[1] (From 25% in 2014, baseline)
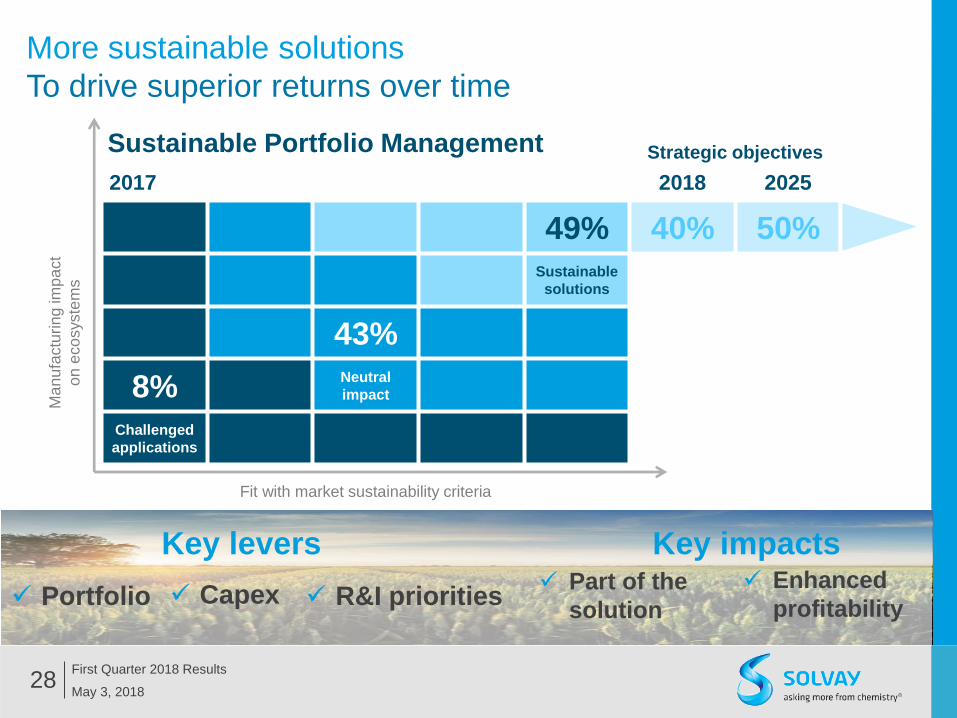
More sustainable solutions
To drive superior returns over time
May 3, 2018
First Quarter 2018 Results 28
Strategic objectives
2017 2018 2025
Ma
nu
factu
ring im
pa
ct
on
eco
syste
ms
49% 40% 50%
Sustainable
solutions
43%
8% Neutral
impact
Challenged
applications
Fit with market sustainability criteria
Portfolio
Key levers
Capex R&I priorities Part of the
solution
Key impacts Enhanced
profitability
Sustainable Portfolio Management

Growth engines deliver 70% of EBITDA
May 3, 2018
First Quarter 2018 Results 29
#
#
Global market position in main markets addressed
Regional market position in main markets addressed
Market positions:
Customized specialty
formulations for surface
chemistry & liquid behavior,
maximizing yield & efficiency
& minimizing
eco-impact
Advanced
Formulations
Technology Solutions
Novecare
Aroma Performance
#1
#1
#1
Leading positions
in chemical intermediates
through scale & technology,
developing applications &
industrial innovation for
optimized costs
Performance
Chemicals
Soda Ash & Derivatives
Peroxides
#1
Coatis #1
#1
Functional Polymers #1
Providing solutions for
sustainable mobility,
lightweighting,
C02 and energy
efficiency
Advanced
Materials
Silica
Specialty Polymers
Composite Materials
#1
Special Chem
#2
#1
#1
Underlying
EBITDA
2017
49%
21%
30%
Net sales €10,125m €4,370m €2,966m €2,766m
Underlying EBITDA €2,230m €1,202m €524m €749m
EBITDA growth +7.5% +8.2% +8.1% +4.3%
EBITDA margin 22% 27% 18% 27%
CFROI 6.9% 10.3% 6.7% 8.4%

30 May 3, 2018
First Quarter 2018 Results
Efficient Capital structure Deleveraging continues
[1] Underlying debt includes perpetual hybrid bonds (considered as equity under IFRS)
[2] Net debt / underlying EBITDA of last 12 months
Underlying financial debt [1]
evolution in € billion
at weighted average interest rate
EUR perpetual
hybrid bonds
USD bonds
EU bonds
& major debt
Other debt
Cash
Underlying
31/12/2016 31/12/2017
Net debt[1] € 6.6 bn € 5.3 bn
Leverage[2] 2.6x 2.2x Baa2 BBB
Redeemed or
Repurchased
-26%
-41%

Provisions Gradual operational deleveraging
May 3, 2018
First Quarter 2018 Results 31
Net pension liabilities (31/12/2017) in € billion
All presented figures are for continuing operations only
Euro-zone
70%
United Kingdom
16%
Other
2%
United States
12%
Movements
in provisions in € million
December 31, 2016
Payments Net new provisions
Discounting costs
Remeasu- rements
[1]
Changes in scope & other
December 31, 2017
(4,269) +408 -216 -100 +232
+55 (3,890)
Operational deleverage +92
[1] Impact of index, mortality, forex & discount rate changes
December
31, 2016Payments
Net new
provisions
Discounting
costs
Remeasu-
rements
[1]
Changes
in scope
& other
December
31, 2017
Employee benefits (3,118) 217 (51) (64) 174 26 (2,816)
Environment (737) 81 (54) (33) 36 5 (702)
Other (414) 110 (111) (3) 22 24 (372)
Total (4,269) 408 (216) (100) 232 55 (3,890)
Complemented by positive impact of discount rate changes

Rewarding shareholders Delivery on commitments over 35 years
May 3, 2018
First Quarter 2018 Results 32
Committed to stable / growing dividend
Gross dividend in €/share
Full year dividend
recommendation of
€3.60 per share payable
May 23, 2018
0.00
1.00
2.00
3.00
4.00
1982 1987 1992 1997 2002 2007 2012 2017
Adjusted gross dividend (for rights issue)
~5.6% CAGR

Appendices
• Additional first quarter 2018 financial data
• General information
• Other financial considerations for
2018
33 May 3, 2018
First Quarter 2018 Results

P&L considerations for 2018
May 3, 2018
First Quarter 2018 Results 34
EBITDA to grow 5% to 7% organically, excluding forex
conversion an scope effects
Forex conversion impact estimated at €(125) million
based on rates prevailing in Q1 2018 (and US$/€ 1.25)
Scope impact expected of €(30) million
Depreciation/Amortization
Underlying D&A expected at ~€(700)m, in line with 2017
Excludes ~€(240)m PPA amortization
PPA impacts related to Rhodia, Cytec and other
smaller acquisitions (e.g. Chemlogics, Ryton)
Underlying EBITDA
Discontinued operations consist of Polyamide
planned to be sold to BASF
expected to be completed in H2 2018
Scope effects include acquisitions and divestments of
smaller businesses not leading to the restatement of
previous periods, mainly:
Polyolefin cross-linkable compounds in June 2017
Formulated resins businesses in June 2017
Phosphorous business in February 2018.
Scope effects
Underlying tax rate expected at ~26%
versus 27.5% in 2017
Tax rate
Underlying net financial charges expected at ~€(350)m,
excluding forex impact
Underlying net cost of borrowings at ~€(150)m
Coupons from perpetual hybrid bonds of €(111)m
• considered as dividends under IFRS
• €(84)m in Q2 and €(27)m in Q4
Non-cash recurring discounting costs at ~€(80)m
Underlying net financial charges
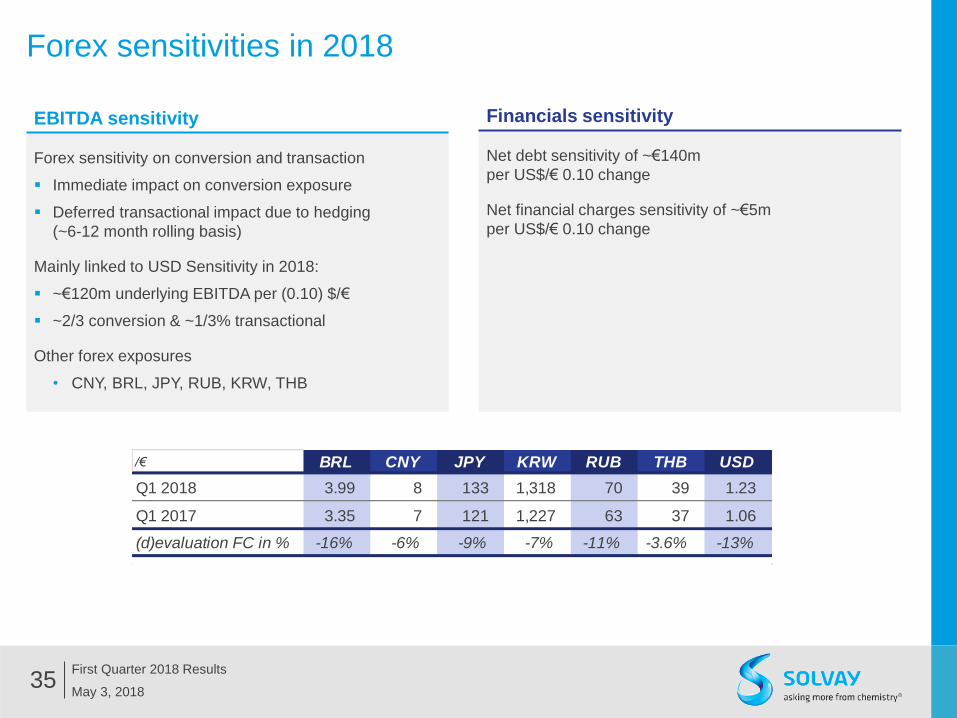
Forex sensitivities in 2018
May 3, 2018
First Quarter 2018 Results 35
Forex sensitivity on conversion and transaction
Immediate impact on conversion exposure
Deferred transactional impact due to hedging
(~6-12 month rolling basis)
Mainly linked to USD Sensitivity in 2018:
~€120m underlying EBITDA per (0.10) $/€
~2/3 conversion & ~1/3% transactional
Other forex exposures
• CNY, BRL, JPY, RUB, KRW, THB
EBITDA sensitivity
/€ BRL CNY JPY KRW RUB THB USD
Q1 2018 3.99 8 133 1,318 70 39 1.23
Q1 2017 3.35 7 121 1,227 63 37 1.06
(d)evaluation FC in % -16% -6% -9% -7% -11% -3.6% -13%
Net debt sensitivity of ~€140m
per US$/€ 0.10 change
Net financial charges sensitivity of ~€5m
per US$/€ 0.10 change
Financials sensitivity
Cash considerations for 2018
May 3, 2018
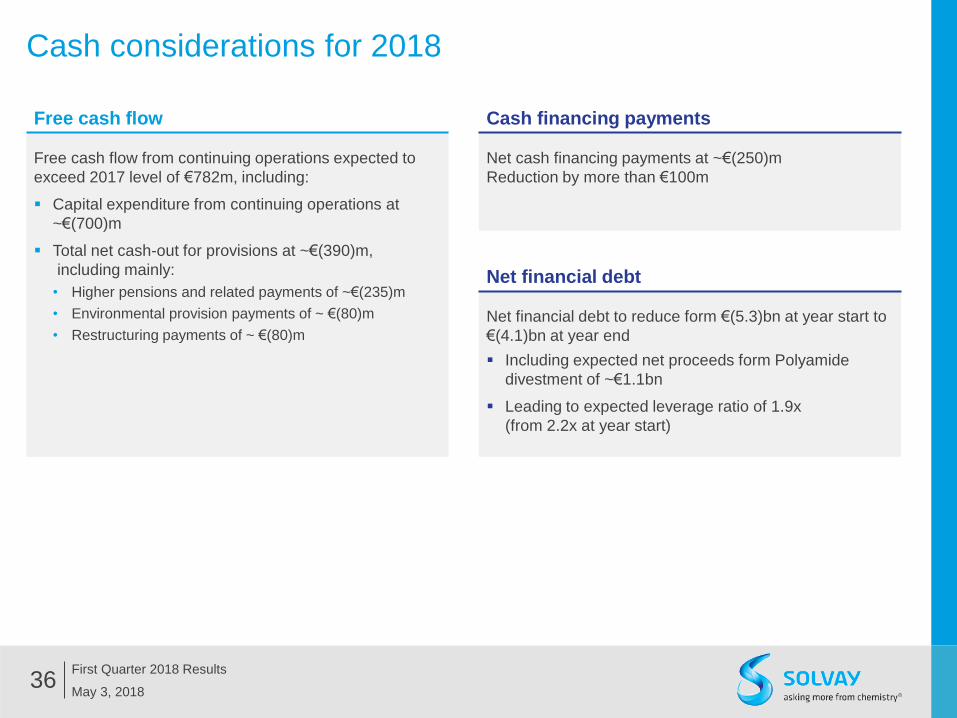
First Quarter 2018 Results 36
Free cash flow from continuing operations expected to
exceed 2017 level of €782m, including:
Capital expenditure from continuing operations at
~€(700)m
Total net cash-out for provisions at ~€(390)m,
including mainly:
• Higher pensions and related payments of ~€(235)m
• Environmental provision payments of ~ €(80)m
• Restructuring payments of ~ €(80)m
Free cash flow
Net cash financing payments at ~€(250)m
Reduction by more than €100m
Cash financing payments
Net financial debt to reduce form €(5.3)bn at year start to
€(4.1)bn at year end
Including expected net proceeds form Polyamide
divestment of ~€1.1bn
Leading to expected leverage ratio of 1.9x
(from 2.2x at year start)
Net financial debt

Debt profile Balanced maturities allowing flexibility
May 3, 2018
First Quarter 2018 Results 37
[1] Major debt only, excluding cost of currency swaps
[2] At first call date
[3] USD 1,960 million
Major financial debt [1] December 31, 2017 March 31, 2018
Face
value
Average
maturity
Average
cost
Face
value
Average
maturity
Average
cost
EUR bonds 1,632 5.5 2.67% 1,632 5.2 2.67%
EUR perpetual hybrid bonds [2] 2,200 4.1 5.07% 2,200 3.8 5.07%
USD bonds 1,634 [3] 5.7 3.88% 1,591 [3] 5.4 3.88%
Total major debt 5,465 5.0 4.00% 5,423 4.7 4.00%
in € million in years in € million in years
€1,000 @Euribor
+82bp
€382 @4.63%
€750 @1.63%
€500 @2.75%
€700 @4.20%
€500 @5.12%
€500 @5.43%
€500 @5.87%
$800 @3.40%
$800 @4.45%
$196 @3.50%
$163 @3.95%
$82 @8.95%
€118 @4.63%
$204 @3.50%
$87 @3.95%
2017 2018 2019 2020 2021 2022 2023 2024 2025 2026 2027
Major financial debt in million
Repaid in
December 2017
Repaid
in July 2017
Repaid in
October 2017
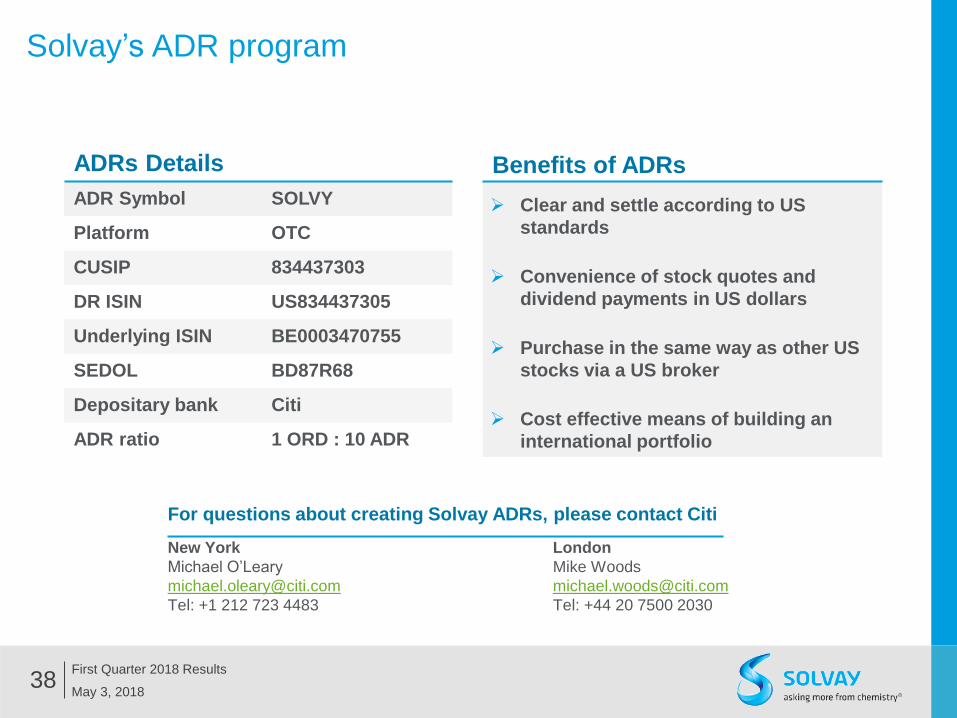
Solvay’s ADR program
May 3, 2018
First Quarter 2018 Results 38
ADR Symbol SOLVY
Platform OTC
CUSIP 834437303
DR ISIN US834437305
Underlying ISIN BE0003470755
SEDOL BD87R68
Depositary bank Citi
ADR ratio 1 ORD : 10 ADR
Clear and settle according to US
standards
Convenience of stock quotes and
dividend payments in US dollars
Purchase in the same way as other US
stocks via a US broker
Cost effective means of building an
international portfolio
Benefits of ADRs ADRs Details
For questions about creating Solvay ADRs, please contact Citi
New York London
Michael O’Leary Mike Woods
[email protected] [email protected]
Tel: +1 212 723 4483 Tel: +44 20 7500 2030

An expanded executive committee
More diverse & customer-centric
May 3, 2018
First Quarter 2018 Results 39
Jean-Pierre
Clamadieu
CEO
Vincent
De Cuyper
COMEX
Augusto
Di Donfrancesco
COMEX
Hua
Du
COMEX
Karim
Hajjar
CFO
Pascal
Juéry
COMEX
Cécile Tandeau
de Marsac
COMEX
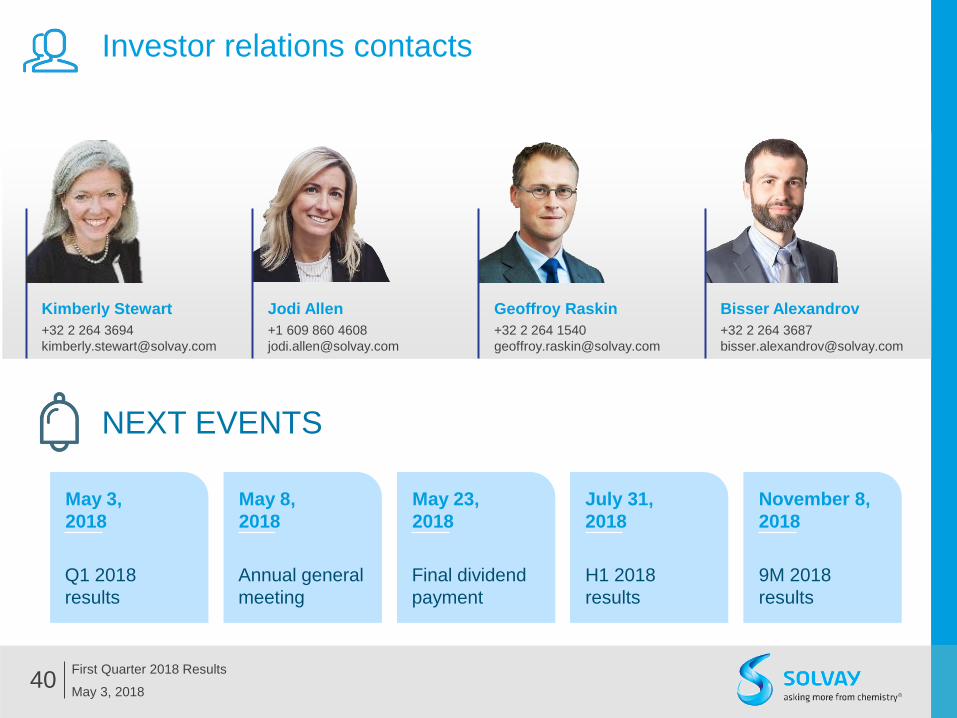
Investor relations contacts
May 3, 2018
First Quarter 2018 Results 40
Kimberly Stewart
+32 2 264 3694
Jodi Allen
+1 609 860 4608
Geoffroy Raskin
+32 2 264 1540
Bisser Alexandrov
+32 2 264 3687
NEXT EVENTS
May 23,
2018
July 31,
2018
H1 2018
results
Final dividend
payment
November 8,
2018
9M 2018
results
May 3,
2018
Q1 2018
results
May 8,
2018
Annual general
meeting