first quarter 2007/8 results presentationresults presentation three months ended 30 june 2007 the...
TRANSCRIPT

3 months ended 30 June 2007
We are real estate investors and create value by actively managing, financing and developing prime commercial property to provide the environment in which modern business can thrive.
First Quarter 2007/8Results Presentation
Three months ended 30 June 2007
The Broadgate Tower

3 months ended 30 June 2007
NAV per share1 up 3% to 1730p– NNNAV per share up 7% to 1801p – Underlying pre-tax profit2 £76m, up 4% on Q1 2006– Underlying EPS2 14p, up 27% on Q1 2006
Portfolio valuation increase of 1.3%– 1.5% Capital Return3 ahead of IPD (1.2%)4 due to rental growth– Valuation uplift led by London Offices (including developments) and Out of Town Retail
Activist portfolio and asset management strategy delivering results– Underlying rental growth (ERV) of 2.2%, ahead of market at 1.2%4
– £2bn asset turnover since March, largely sales (£1.6bn at 3.4% above March valuation)– Investment focused on 5m sq ft committed developments - £500m to spend in 2007/8– Good occupancy demand driving rents forward in both Office and Retail segments
Increased cash for Shareholders– 2007/8 dividends expected at 35p (Q1 8.75p) – up over 100% pre-REITs– £250m share buyback programme announced and underway (£65m to date)
1
Highlights
1 EPRA (European Public Real Estate Association) basis 2 Underlying pre-tax profit and EPS excludes gains on property revaluations and disposals, intangible asset movements, refinancing
charges and £30m of the Songbird dividend3 IPD Capital Return differs from BL Valuation Uplift as based on average capital employed and excludes capitalised interest and Europe4 IPD Quarterly Benchmark
3 months ended 30 June 2007
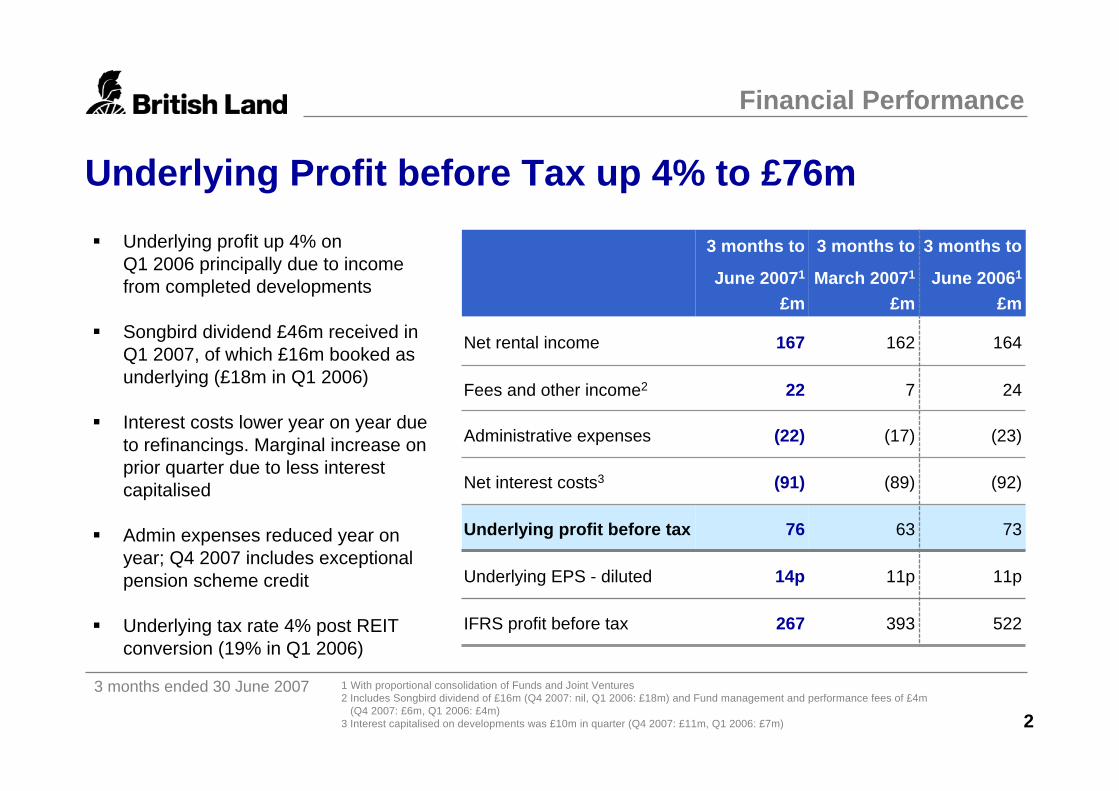
Underlying Profit before Tax up 4% to £76m
267
14p
76
(91)
(22)
22
167
3 months to
June 20071
£m
11p11pUnderlying EPS - diluted
522393IFRS profit before tax
73
(92)
(23)
24
164
3 months to
June 20061
£m
63
(89)
(17)
7
162
3 months to
March 20071
£m
Administrative expenses
Fees and other income2
Net interest costs3
Underlying profit before tax
Net rental income
1 With proportional consolidation of Funds and Joint Ventures2 Includes Songbird dividend of £16m (Q4 2007: nil, Q1 2006: £18m) and Fund management and performance fees of £4m
(Q4 2007: £6m, Q1 2006: £4m)3 Interest capitalised on developments was £10m in quarter (Q4 2007: £11m, Q1 2006: £7m)
Financial Performance
2
Underlying profit up 4% on Q1 2006 principally due to income from completed developments
Songbird dividend £46m received in Q1 2007, of which £16m booked as underlying (£18m in Q1 2006)
Interest costs lower year on year due to refinancings. Marginal increase on prior quarter due to less interest capitalised
Admin expenses reduced year on year; Q4 2007 includes exceptional pension scheme credit
Underlying tax rate 4% post REIT conversion (19% in Q1 2006)

3 months ended 30 June 2007
Net Asset Value per share up 3% to 1730p
Financial Performance
1 Before charges for REIT conversion and refinancings2 EPRA (European Public Real Estate Association) basis3 Comprising 4.25p (subject to withholding tax of 22% for relevant shareholders) and 4.50p non PID4 Increase in EPRA NAV plus dividends paid
£21.3bn
£16.9bn
£8.7bn
£8.9bn
1683p
1682p
March 2007
£19.4bn
£15.2bn
£6.5bn
£8.4bn
1236p
1592p
June 2006
£20.4bn
£16.3bn
£9.1bn
£9.1bn
1801p
1730p
June 2007
IFRS net assets
NNNAV per share
Total properties
Total properties under management
Net assets2
NAV per share2
3
NAV per share up 3% to 1730p principallydue to valuation gains
- Up 9% over last 12 months, 15%pre-charges1
NNNAV per share up 7% to 1801p- Adjusts debt and derivatives to market
value and deducts deferred tax- Highlights exceptional balance
sheet resilience with debt 100% fixed at average 5.3%
Q1 Dividend of 8.75p3, payable November
Total return for quarter 3.3%4
Total properties down due to asset sales

3 months ended 30 June 2007
Prudent financial ratios, especially given low income risk
– Leases average 14.6 yrs to first break– Occupancy rate of 96.9% (98.6%
underlying1)
Gearing lower at 43%3 due to sales (down from peak of 59% post-Pillar). Average interest rate lowered to 5.3%, interest cover improved to 1.8x
Average debt maturity increased to 13.1 yrs Interest profile 100% fixed rate
£174m£519mPositive mark to market on debt and derivatives
(£7,741m)(£6,864m)Net Debt – book value
43%40%LTV – Group3
Key Financial Ratios2
£2,482m
13.1 yrs
5.30%
1.8x
43%
June 2007
£1,855m
12.7 yrs
5.36%
1.7x
47%
March 2007
Weighted average debt maturity
Average interest rate
Cash and undrawn facilities - Group
Interest cover4
LTV – inc. share of Funds & JVs3
1 Underlying occupancy rate including asset management initiatives and units under offer2 With proportional consolidation of Funds and Joint Ventures (unless stated as Group)3 Proforma for payment of REIT conversion charge in July 20074 Underlying profit before interest and tax (UPBIT) / net interest excluding refinancing charges
Secure & Attractive Risk Profile
Finance and Capital Structure
4

3 months ended 30 June 2007
Activist Portfolio and Asset Management Strategy Underlying rental growth (ERV) of 2.2% in quarter, ahead of market at 1.2%1
– Driven by London Offices 4.0% and Retail Warehouses 1.9%
£1.6bn disposals, on average 3.4% above March valuation– Unlocking capital from sale of high quality ‘mature’ assets (e.g. EBRD and retail parks) and
continued disposal of weaker rental growth properties (e.g. East Kilbride and industrial)– Recycling capital into £182m new purchases, £114m development spend, and €350m acquisition
of Murcia retail complex2 in Spain also completed
Continued progress on lettings and interest levels still good– Over 700,000 sq ft of Central London offices let/under offer. Including 590,000 sq ft development
pre-lets agreed3 and new high rent achieved at York House (£70 psf), enhancing rental values– 370,000 sq ft of out of town retail lettings and a further 700,000 sq ft under offer post quarter end,
65% to high street retailers (including M&S, Asda Living, New Look, Next and River Island)
Portfolio Reshaping & Pro-active Asset Management
5
1 IPD Quarterly Benchmark2 Jointly with PREF: completed July 2007, following conditional exchange in March 2007 (as per year end report) 3 Of which 435,000 sq ft let and 155,000 sq ft under offer

3 months ended 30 June 2007
Over £2bn Capital Recycling
Portfolio Reshaping
5.37620950% share of New Mersey Shopping Park4
2.11121397 retail warehouse properties
3.087878 High Street shops
9.99090Castle Vale Retail Park5
6.062625 Industrial properties
-22Others
-8724050% share of Fort Kinnaird Shopping Park3
(2.8)193387East Kilbride Shopping Centre2
1,622
406
Price
£m
3.41,115Total
5.6406One Exchange Square
Gain
%1
BL Share
£m
Sales
6
118237Nueva Condomina, Murcia, Spain6
1527Others
285550% share of Whiteley Village factory outlet centre7
419
100
Price £m
197Total
3650% share of Gallagher and The Shires retail parks3
BL Share
£m
Purchases
1 Sale price above last year end valuation (March 2007)2 Scottish Retail Property Limited Partnership (SRPLP)3 Hercules Unit Trust (HUT) – JV with The Crown Estate4 Hercules Unit Trust (HUT) – JV with Bank of Ireland Private
Banking Limited
+ £114m development spend + £65m share buybacks
5 Completed after 30 June 2007 6 Jointly with PREF: completed July 2007, following conditional
exchange in March 2007 (as per year end report) 7 JV development with Universities Superannuation Scheme

3 months ended 30 June 2007
5m sq ft Committed Developments Progressing Well
7
Developments
Ropemaker (0.6m sq ft)
201 Bishopsgate & The Broadgate Tower (0.8m sq ft)
The Leadenhall Building (0.6m sq ft)
Puerto Venecia, Zaragoza (2.2m sq ft)
Strong interest in London developments and rents rising – construction still on time and budgetTopped-out Broadgate Tower – 201 now fully pre-let to Henderson and Mayer Brown; Tower 39% under offer –reflecting good growth in City rentsLudgate West due for completion Q4 2007 – 88,000 sq ft pre-let to Charles Russell Demolition of existing Leadenhall building progressing well – construction to commence in September43% of Ropemaker, Osnaburgh Street & Leadenhallconstruction contracts already locked-in
… and further progress with retail developmentZaragoza – retail park on schedule to complete Q3 2008 with 79% pre-let/under offer and IKEA now open –shopping/leisure centre to complete Q4 2009JV agreed with USS for redevelopment of 170,000 sq ft Whiteley Village factory outlet centre in Fareham 199,000 sq ft Giltbrook redevelopment progressing well - with 82% of the new area already under offer

3 months ended 30 June 2007
1.3% Uplift in 3 Months
Valuation
Portfolio yields now 4.7% net equivalent3, 4.2% gross initial yield4
(4.5%4 adding back rent frees) and 5.0% gross reversionary yield4
All RetailRetail Warehouses
SuperstoresShopping Centres
Department Stores
High StreetAll Offices
City Offices
Business Parks & Provincial
West End Offices
3 months to 30 June 2007
8
1
1 Includes valuation movements in developments, purchases and sales, net of capital expenditure
2 Absolute uplift on Developments 5.1% (City 5.6%, West End 4.2%)3 After purchaser’s costs4 Gross yields to British Land (without notional purchaser’s costs)
5 Source: IPD – British Land vs IPD for the 3 months to 30 June 2007. IPD Capital Return differs from BL Valuation Uplift as based on average capital employed and excludes capitalised interest and Europe
6 ERV growth based on Standing Investments
2.63.9All Offices
1.21.5Total Portfolio
Of which rental growth6:
0.61.1All Retail
All Offices
All Retail
Capital Return
(ungeared)5
IPD
%
British
Land %0.20.3
2.93.1
Including developments2
3.1%
0.3%
0.8%
0.9%
0.1%
2.9%
4.6%
-0.7%
-0.1%
-0.2%

3 months ended 30 June 2007
-10%
-5%
0%
5%
10%
15%
20%
Q1 00 Q4 01 Q3 03 Q2 05 Q1 07
Qua
rterly
Ren
tal G
row
th (%
)
City West End
-1%
1%
3%
5%
7%
9%
1998 2000 2002 2004 2006 2008 2010R
etai
l Sal
es g
row
th p
a (%
)Out of Town Town Centre All Retail
Retail Offices
9
Investment market mixed, adjusting to reflect relative growth prospects.Occupier market remains resilient
Retail sales up 3.8% year on year1; forecast to grow at 2.9% pa over next 5 years2
– OOT sales expected to grow 3.4% pa2 vs In Town 1.1% pa2
Retailers are net acquirers ofspace. Good demand continuesfor Open A1 retail parks andsuperstores
BL leadership in Open A1 Out ofTown Retail positioned to reflectcustomer demand
– HUT ERV growth of 4.2% over last12 months, significantly ahead ofmarket at 2.2%3
Retail Sales Growth Positive2
Retail & Office Outlook
London Office Rents Growing4
Investment market healthy. Favourable rental growthexpectations keeping yields low
London’s international service industry strength driving occupancyand rents
Strong City take up of 2.1m sq ftin Q2 2007; 28% higher than long-term average4
– Vacancy rates reduced to 5.5%, Grade A 2.7%4
6.8m sq ft4 of speculative supplycurrently under construction in Citybetween now and 2009, butwith good occupier demand, no sign yet of cycle peaking
BL London ERV up 4.0% in quarter; 6.4% in West End, 3.4% in City
BL leadership in London offices a key asset, and leveraging cycle well through development
1 ONS – Total sales volume in the 3 months to June 2007 compared to the 3 months to June 20062 Verdict – Retail Sales by Location3 IPD Retail Warehouse Benchmark4 Jones Lang LaSalle

3 months ended 30 June 2007
Well placed for Customer-led Growth
Distinctive leadership in the two sectors most favoured for growth over next 5 years
– London Offices – Out of Town “Open A1” Retail
Outstanding development programme
Greatest downside protection in the market
– Longest leases, most prime, advantaged portfolio
Leveraging OOT Retail expertise in Europe
Sector & market selection
Asset selection & creation
Asset management
Balance sheet management
Deal-doing
Property Activist Value Added
Summary
10

3 months ended 30 June 2007
The information contained in this presentation has been extracted largely from the First Quarter Results Announcement for the three months ended 30 June 2007. General property market data has been extracted from Jones Lang LaSalle, PMA, Verdict and other agents’ reports (please note that their definitions may differ slightly).
Data includes share of Funds and Joint Ventures, unless otherwise stated. ‘Group’ excludes share of Funds and Joint Ventures. Underlying profit and EPS principally exclude gains on disposal of assets and revaluations. EPRA NAV excludes the deferred tax on revaluations and mark to market on effective cash flow hedges and related debt adjustments.
This presentation may contain certain “forward-looking” statements. By their nature, forward-looking statements involve risk and uncertainty because they relate to future events and circumstances. Actual outcomes and results may differ materially from any outcomes or results expressed or implied by such forward-looking statements. Any forward-looking statements made by or on behalf of British Land speak only as of the date they are made and no representation or warranty is given in relation to them, including as to their completeness or accuracy or the basis on which they were prepared. British Land does not undertake to update forward-looking statements to reflect any changes in British Land’s expectations with regard thereto or any changes in events, conditions or circumstances on which any such statement is based.
This presentation is made only to investment professionals as defined in Article 19 of the Financial Services and Markets Act 2000 (Financial Promotion) Order 2005 ('the FP Order'). The content of this presentation has not been approved by a person authorised under the Financial Services and Markets Act 2000 (“FSMA”). Accordingly, this presentation may only be communicated in the UK with the benefit of an exemption set out in the FP Order. An investment professional includes:(i) a person who is authorised or exempt under FSMA; and(ii) a person who invests, or can reasonably be expected to invest, on a professional basis for the purposes of a business carried on by him; and(iii) a government, local authority (whether in the United Kingdom or elsewhere) or an international organisation; and(iv) any director, officer, executive or employee of any such person when acting in that capacity.
This presentation is published solely for information purposes. This presentation does not constitute an offer to sell or the solicitation of an offer to subscribe for or buy any security, nor a solicitation of any vote or approval in any jurisdiction, nor shall there be any sale, issuance or transfer of the securities referred to in this presentation in any jurisdiction in contravention of applicable law. No representation or warranty, either express or implied, is provided in relation to the accuracy, completeness or reliability of the information contained herein.
The distribution of this presentation in jurisdictions other than the UK may be restricted by law and therefore any persons who are subject to the laws of any jurisdiction other than the UK should inform themselves about, and observe, any applicable requirements. This presentation has been prepared for the purpose of complying with English law and the City Code and the information disclosed may not be the same as that which would have been disclosed if this presentation had been prepared in accordance with the laws of jurisdictions outside the UK.
All opinions expressed in this presentation are subject to change without notice and may differ from opinions expressed elsewhere.
Disclaimer