first puerto rico - santander.pr puerto rico target maturity income opportunities fund i, inc....
TRANSCRIPT

FIRST PUERTO RICOTARGET MATURITY INCOME OPPORTUNITIES FUND I, INC.
Annual Reportand Investment PerformanceReview for the Year Ended
September 30, 2015

December 14, 2015
Dear Shareholder,
We are pleased to present the Annual Report to shareholders of First Puerto Rico Target Maturity IncomeOpportunities Fund I, Inc. (the Fund) for the year ended September 30, 2015. During this year, we continued to facerecurrent challenges in managing the Fund’s portfolio, including a volatile interest-rate environment, adverse creditconditions in Puerto Rico, fluctuating oil prices, and global political and economic challenges. Despite thesechallenges, we have continued to work diligently towards achieving the Fund’s investment objectives.
PERFORMANCE OF THE FUND
For the year ended September 30, 2015 the Fund’s net asset value (NAV) per share decreased from $5.50 to $3.70which, considering the dividend payments made to shareholders during the period, represented an NAV total rate ofreturn of (26.37)%. (These returns assume the reinvestment of dividends.)
The Fund made twelve dividend payments during the 12-month period ended September 30, 2015, and subsequentlydeclared tax-exempt and taxable dividends to shareholders of record as of September 30, 2015, October 30, 2015 andNovember 30, 2015, paid on October 15, 2015, November 16, 2015 and December 15, 2015, respectively.
FACTORS AFFECTING THE FUND’S PERFORMANCE
Global markets endured moments of prominent price swings and extraordinary volatility for the reporting period.Despite such environment, the U.S. economy continued to expand at moderate pace. According to the Bureau ofEconomic Analysis, the Real Gross Domestic Product (GDP) in the United States expanded at an annual rate of 2% forthe third quarter 2015. Personal consumption advanced 3.2%, while gross private domestic investment increased by2.4%.
In October 2014, the Federal Reserve Board (Fed) concluded the Long Term Asset Purchase (LSAP) program, as thecentral bank initiated the course towards policy normalization, and an eventual raise in interest rates. Nonetheless, theFederal Open Market Committee (FOMC) maintained the benchmark rate at the 0%-0.25% range and monetary policyremained accommodative throughout the period. Despite low inflation, Fed officials cited improvement in labormarkets, housing, and consumer spending as factors supporting an optimistic outlook for the U.S. economy.
Outside the United States, however, the economic landscape was not as favorable. Weakening economic prospects andlow inflation outlook for Japan and most countries in the European periphery prompted central banks to expand theiralready unprecedented monetary stimulus programs and pledged to maintain them as long as needed in order to spureconomic growth and combat low inflation. Foreign geopolitical events, such as the conflict in Ukraine and the Greekdebt crisis, showed signs of becoming relevant to the financial markets once again. By the end of the period, fears ofworsening economic conditions in China, as well as the perceived consequential slowdown on global industrialdemand, also prompted notable price fluctuations. The sequence of events came along with a sharp yet divergentreaction in commodities, currency markets, and interest rates. Commodity prices, such as gold and crude oil, suffered asharp drop during the period. Currencies such as the euro and Japanese yen dropped to notably low levels relative to theU.S. dollar. In addition, bond yields in both sides of the Atlantic dropped to remarkably low levels, with the 10-yearU.S. Treasury note trading below 2.00% and the German Bund as low as 0.074%.
During the 12 months ended September 30, 2015, the S&P 500 and the Dow Jones Industrial Average registered lossesof 0.62% and 2.11%, respectively. Outside the United States, the Euro Stoxx 600 Index declined by 7.32%, whileJapan’s Nikkei gained 0.28% in U.S. dollar terms, during the 12 months ended September 30, 2015.
U.S. fixed-income markets, as measured by the Barclays Aggregate Bond Index, returned 2.9% over the period. U.STreasuries—especially long-duration bonds—outperformed major sectors as investors flew towards safety duringequity sell-offs and expectations of an upcoming rate hike waned to some extent. The Barclays U.S. Treasury Indeximproved 3.76% over the period. Treasury yields flattened as the 2-year note dropped by 0.062% to 0.63% and the10-year note declined nearly 0.45% to 2.04%. Corporate bonds, as measured by the Barclays U.S. CorporateInvestment Grade Index, gained 1.66% over the period, underperforming treasuries. Investment-grade credit spreads, asmeasured by the Markit CDX Investment Grade Index, widened by 0.294% for the period. Taxable municipal bondsoutperformed most sectors, posting 12-month gains of 4.13%.
Puerto Rico Government municipal bond investors received an important pronouncement on June 29, 2015 from PuertoRico Governor Alejandro García Padilla. Citing a study commissioned by the Commonwealth and performed, amongothers, by ex-First Deputy Managing Director of the International Monetary Fund, Anne Krueger, Mr. García Padillaindicated that Puerto Rico’s debt burden had become unsustainable and suggested that a broad debt restructuring wasinevitable. Although credit conditions in Puerto Rico already were challenging, the market was not expecting such abroad statement from the Governor of Puerto Rico, and the general perception was not favorable. Puerto Rico has over

$70 billion in debt outstanding, and its economy has been affected by high unemployment and budget deficits for thepast 10 years. Puerto Rico municipal bonds have been increasingly under pressure over the last few years and priceswere already deeply discounted prior to the announcement; however, yields further spiked on the news.
On August 1, 2015, a Puerto Rico municipal bond defaulted for the first time ever as the Government missed a$58 million principal and interest payment of bonds of the Public Finance Corporation (PFC). On November 6, 2015,the Government of Puerto Rico released an unaudited report on financial condition and operating data for theCommonwealth. In the filing, the Government stressed the frailty of its fiscal condition, with emphasis on its poorliquidity and possible lack of cash flow available to meet upcoming obligations.
Puerto Rico does not have access to bankruptcy protection under federal law. Public corporations in U.S. states,however, do have access to Chapter 9 of the U.S. Bankruptcy Code, subject to multiple conditions. A recent attempt tocreate a local bankruptcy law applicable to Puerto Rico public corporations was struck down in U.S. federal court.Several efforts to get Congress to take action and allow Puerto Rico access to Chapter 9 of the U.S. Bankruptcy Codeare underway; nonetheless, for the time being, all restructuring efforts may have to take place through directnegotiations between the territory’s dozens of issuers and their thousands of institutional and retail creditors. Manycompeting views exist regarding the optimal path and nature of the potential debt negotiations, and certain marketparticipants as well as members of the U.S. Congress have noted the potential benefit to both Puerto Rico and creditorsalike of a strong U.S. federal role in any debt restructuring—be it a federal financial control board, a special masterappointed by a federal court of competent jurisdiction, or federal agency assistance to the local government.
Santander Asset Management, LLC (SAM) will continue to monitor the investment portfolios on a daily basis in orderto seize opportunities that may arise due to market inefficiencies. SAM remains vigilant of any changes in the interestrate, legal, and geopolitical environment in order to make appropriate adjustments that are consistent with long-termobjectives.
On behalf of all of us associated with First Puerto Rico Target Maturity Income Opportunities Fund I, Inc., we thankyou for your investment. We look forward to meeting your investment needs.
Sincerely,
Freddy MolfinoChairman of the Boardand President
Dennis WilliamsSenior Vice President & Chief Investment OfficerSantander Asset Management, LLC
This document is not intended for distribution to prospective investors, and does not constitute an offer to sell or inducethe sale of securities of the Fund. Performance figures do not reflect the effect of income taxes or sales charges. Theperformance quoted is past performance and is not a guarantee of future results. The investment return and principalvalue of an investment in the Fund will fluctuate so that shares, when redeemed, may be worth more or less than theiroriginal cost. Performance changes over time and currently may be lower or higher than performance data shownabove. The Fund is subject to certain market risks as described in the prospectus. Market volatility can significantlyimpact short-term performance. For a prospectus, or performance current to the most recent month-end period, pleasecall 1 (888) 756-0003.
NOT FDIC INSURED | NOT BANK GUARANTEED | MAY LOSE VALUE | FOR RESIDENTS OF PUERTO RICO ONLY

Growth of a $10,000 investment since inception (December 29, 2003) ofFirst Puerto Rico Target Maturity Income Opportunities Fund I, Inc.
(7.39)%(11.55)%
$8,845**NAV
$9,261***NAV
Cumulative Returns*1 Year: (29.68)%**Life of Shares: (11.55)%**1 Year: (26.37)%***Life of Shares: (7.39)%***
Dec
-03
Mar
-05
Jun-
06
Sep
-07
Mar
-08
Aug
-08
Jan-
09
Jun-
09
Nov
-09
Apr
-10
Sep
-10
Feb
-11
Jul-
11
Dec
-11
May
-12
Oct
-12
Mar
-13
Aug
-13
Jan-
14
Jun-
14
Nov
-14
Apr
-15
Sep
-15
$7,000
$8,500
$10,000
$11,500
$13,000
$14,500
$16,000
$17,500
* The total returns assume reinvestment of all dividends at the net asset value (“NAV”) of the Fund’s shares and an initialinvestment of $10,000 since commencement of operations on December 29, 2003. All of the data in this report represents pastperformance which cannot be used to predict the Fund’s future returns. Share price and return can fluctuate widely. An invest-or’s shares, when sold, could be worth more or less than their original cost. The returns shown do not reflect taxes that a share-holder would pay on Fund distributions or on the sale of Fund shares.
** Performance based on NAV including the front end sales charge of 4.50%.
*** Performance based on NAV without including the front end sales charge of 4.50%.

First Puerto Rico Target Maturity Income Opportunities Fund I, Inc.Investment PortfolioSeptember 30, 2015
FaceAmount Issuer Coupon
MaturityDate
FairValue
Puerto Rico Securities—72.0%(a)Puerto Rico Commonwealth Agencies Bonds and Notes—67.6%
$ 524,000 Puerto Rico Government Development Bank Senior Note,Series A* 5.50% 08/01/2020 $ 218,482
338,000 Puerto Rico Government Development Bank Senior Note,Series C* 5.40% 08/01/2019 144,529
40,000 Puerto Rico Government Development Bank Senior Note,Series H* 4.15% 08/01/2017 17,922
415,000 Puerto Rico Government Development Bank Senior Note,Series H* 4.50% 08/01/2019 171,652
773,000 Puerto Rico Government Development Bank Senior Note,Series H* 4.90% 08/01/2021 293,841
1,135,000 Puerto Rico Public Finance Corporation Revenue Bonds, Series A* 0.00%** 08/01/2036 122,262540,000 Puerto Rico Public Finance Corporation Revenue Bonds, Series A* 0.00%** 08/01/2040 111,602
10,530,000 Puerto Rico Public Finance Corporation Revenue Bonds, Series A* 0.00%** 08/01/2041 2,042,3992,955,000 Puerto Rico Public Finance Corporation Revenue Bonds, Series A* 0.00%** 08/01/2042 537,8991,000,000 Puerto Rico Sales Tax Financing Revenue Bonds, Series A* 6.13% 08/01/2029 605,6701,125,000 Puerto Rico Sales Tax Financing Revenue Bonds, Series C* 0.00%** 08/01/2038 118,9242,360,000 Puerto Rico Sales Tax Financing Revenue Bonds, Series C* 6.00% 08/01/2038 1,425,5342,500,000 Puerto Rico Sales Tax Financing Revenue Bonds, Series C* 6.00% 08/01/2031 1,513,700
11,215,000 Puerto Rico Sales Tax Financing Revenue Bonds, Series 2009-B* 0.00%*** 08/01/2025 5,865,4452,345,000 Puerto Rico Sales Tax Financing Revenue Bonds, Series 2009-B* 0.00%*** 08/01/2026 1,191,2602,485,000 Puerto Rico Sales Tax Financing Revenue Bonds, Series 2009-B* 6.05% 08/01/2029 1,077,844
855,000 Puerto Rico Sales Tax Financing Revenue Corporation Bonds,Series B* 6.35% 08/01/2039 359,228
Total Puerto Rico Commonwealth Agencies Bonds and Notes (cost $24,099,939) 15,818,193
Collateralized Mortgage Obligations(b)—2.9%
514,594 Credit Suisse Mortgage Capital Certificates, Series 2007-5Class 8-A2 6.00% 10/25/2024 538,027
21,624 Deutsche Mortgage Securities, Series 2006-PR1, Class 2AF 0.47%^ 04/15/2036 21,385129,972 Deutsche Mortgage Securities, Series 2006-PR1, Class 4AF2 0.55%+ 04/15/2036 107,77112,804 Prime Mortgage Trust, Series 2006-DR1, Class 1A1 5.50% 05/25/2035 12,9124,881 Prime Mortgage Trust, Series 2006-DR1, Class 1A2 6.00% 05/25/2035 4,956
Total Collateralized Mortgage Obligations (cost $683,875) 685,051
Fannie Mae(c)—1.5%
1,699,531 Fannie Mae 2009-12 CI 6.42% 03/25/2036 347,003
Total Fannie Mae (cost $361,569) 347,003
Total Puerto Rico Securities (cost $25,145,383) 16,850,247
U.S. Securities—61.5%(a)Government Agencies and Instrumentalities—8.7%
920,000 # Federal Farm Credit Bank Bonds* 2.72% 09/19/2022 958,7871,000,000 # Federal Home Loan Bank Bonds* 3.30% 12/01/2026 1,062,556
Total Government Agencies and Instrumentalities (cost $1,916,440) 2,021,343
Treasury Note—14.5%
3,200,000 # U.S. Treasury Note 2.63% 08/15/2020 3,386,541
Total Treasury Note (cost $3,121,233) 3,386,541
The accompanying notes are an integral part of the financial statements.
4

First Puerto Rico Target Maturity Income Opportunities Fund I, Inc.Investment PortfolioSeptember 30, 2015
(concluded)
Face/NotionalAmount Issuer/Counterparty Coupon
MaturityDate
FairValue
U.S. Securities (continued)—61.5%(a)State and Municipal Obligations—38.2%
$1,570,000 # Connecticut State Housing Finance Authority Revenue Bonds 3.30% 11/15/2037 $ 1,464,3702,500,000 # Illinois State General Obligation Bonds 6.88% 07/01/2025 2,768,051
45,000 Illinois State General Obligation Bonds 5.83% 04/01/2021 48,75075,000 Illinois State General Obligation Bonds* 6.63% 02/01/2035 80,537
185,000 New Hampshire State Turnpike System Revenue Bonds* 6.26% 11/01/2029 205,9091,505,000 # Philadelphia Authority Retirement System, Series B 0.00% 04/15/2018 1,409,9142,000,000 # Sacramento County Pension Obligation 6.63% 08/01/2024 2,317,960
535,000 # University of California Medical Center Revenue Bonds 6.46% 05/15/2029 647,002
Total State and Municipal Obligations (cost $8,332,605) 8,942,493
Collateralized Mortgage Obligation(b)—0.1%
23,928 Bear Stearns Adjustable Rate Mortgage Trust, Series 2004-8,Class 14A1 3.02%< 11/25/2034 22,844
Total Collateralized Mortgage Obligations (cost $23,928) 22,844
Total U.S. Securities (cost $13,394,206) 14,373,221
Total Investment Portfolio (cost $38,539,589)(d), 133.5% 31,223,468
Interest Rate Swaps—(2.4)%(a)3,300,000 JP Morgan Chase Bank, N.A.* 09/01/2024 (553,930)
Total Interest Rate Swaps (553,930)
Other Assets and Liabilities, net (31.1)% (7,286,273)
Net Assets, 100.0% $23,383,265
(a) Percentages are based on net assets.
(b) Collateralized Mortgage Obligations—Represents obligations guaranteed by the underlying mortgage backed securities, whichin turn are guaranteed by mortgage loans. These obligations are subject to principal paydowns as a result of prepayments orrefinancing of the underlying collateral. As a result, the average life of these securities may be substantially less than theiroriginal maturity.
(c) Fannie Mae—Mortgage-backed securities guaranteed by the Federal National Mortgage Association. These obligations aresubject to principal paydowns as a result of prepayments or refinancing of the underlying mortgage instruments. As a result, theaverage life of these securities may be substantially less than their original maturity.
(d) The aggregate identified cost for income tax purposes is substantially the same. Fair value includes net unrealized depreciationin which there was an excess of tax cost over fair value of $7,316,121.
# This security, or a portion thereof, has been pledged as collateral for reverse repurchase agreements, short-term notes, marginloans or swaps.
* Security or agreement may be called before its maturity date.
** Zero coupon bonds.
^ Variable interest based on one-month U.S. dollar LIBOR Index plus 27 basis points.
+ Variable interest based on one-month U.S. dollar LIBOR Index plus 35 basis points.
*** Convertible to fixed-rate coupon bond after 08/01/2016.
< Variable interest based on the weighted average coupon of the collateral.
The accompanying notes are an integral part of the financial statements.
5

First Puerto Rico Target Maturity Income Opportunities Fund I, Inc.Statement of Assets and Liabilities
September 30, 2015
Assets:
Investments, at fair value (identified cost $38,539,589) . . . . . . . . . . . . . . . . . . . . . . . . . . . . . . . . . . $ 31,223,468
Cash . . . . . . . . . . . . . . . . . . . . . . . . . . . . . . . . . . . . . . . . . . . . . . . . . . . . . . . . . . . . . . . . . . . . . . . . . . 40,661
Interest and dividends receivable . . . . . . . . . . . . . . . . . . . . . . . . . . . . . . . . . . . . . . . . . . . . . . . . . . . . 187,006
Prepaid expenses . . . . . . . . . . . . . . . . . . . . . . . . . . . . . . . . . . . . . . . . . . . . . . . . . . . . . . . . . . . . . . . . 10,994
Total assets . . . . . . . . . . . . . . . . . . . . . . . . . . . . . . . . . . . . . . . . . . . . . . . . . . . . . . . . . . . . . 31,462,129
Liabilities:
Accounts payable . . . . . . . . . . . . . . . . . . . . . . . . . . . . . . . . . . . . . . . . . . . . . . . . . . . . . . . . . . . . . . . . $ 1,376
Securities sold under agreements to repurchase . . . . . . . . . . . . . . . . . . . . . . . . . . . . . . . . . . . . . . . . . 5,024,000
Interest payable on securities sold under agreements to repurchase . . . . . . . . . . . . . . . . . . . . . . . . . 1,004
Margin loans . . . . . . . . . . . . . . . . . . . . . . . . . . . . . . . . . . . . . . . . . . . . . . . . . . . . . . . . . . . . . . . . . . . . 2,406,493
Interest payable on margin loans . . . . . . . . . . . . . . . . . . . . . . . . . . . . . . . . . . . . . . . . . . . . . . . . . . . . 682
Swap contracts, at fair value . . . . . . . . . . . . . . . . . . . . . . . . . . . . . . . . . . . . . . . . . . . . . . . . . . . . . . . 553,930
Interest payable on swap contracts . . . . . . . . . . . . . . . . . . . . . . . . . . . . . . . . . . . . . . . . . . . . . . . . . . . 9,042
Accrued investment advisory fees . . . . . . . . . . . . . . . . . . . . . . . . . . . . . . . . . . . . . . . . . . . . . . . . . . . 10,318
Accrued administration fees . . . . . . . . . . . . . . . . . . . . . . . . . . . . . . . . . . . . . . . . . . . . . . . . . . . . . . . . 3,282
Accrued directors’ fees . . . . . . . . . . . . . . . . . . . . . . . . . . . . . . . . . . . . . . . . . . . . . . . . . . . . . . . . . . . . 7,748
Other accrued expenses . . . . . . . . . . . . . . . . . . . . . . . . . . . . . . . . . . . . . . . . . . . . . . . . . . . . . . . . . . . 60,989
Total liabilities . . . . . . . . . . . . . . . . . . . . . . . . . . . . . . . . . . . . . . . . . . . . . . . . . . . . . . . . . . 8,078,864
Net Assets . . . . . . . . . . . . . . . . . . . . . . . . . . . . . . . . . . . . . . . . . . . . . . . . . . . . . . . . . . . . . . . . . . . . . . $ 23,383,265
Net Assets:
Net assets consist of :
Par value of common stock . . . . . . . . . . . . . . . . . . . . . . . . . . . . . . . . . . . . . . . . . . . . . . . . . . . . . . $ 63,120
Paid-in capital in excess of par value . . . . . . . . . . . . . . . . . . . . . . . . . . . . . . . . . . . . . . . . . . . . . . . 67,067,493
Undistributed net investment income . . . . . . . . . . . . . . . . . . . . . . . . . . . . . . . . . . . . . . . . . . . . . . . 4,881,377
Accumulated net realized loss from investment transactions . . . . . . . . . . . . . . . . . . . . . . . . . . . . (25,998,256)
Net unrealized depreciation on investments . . . . . . . . . . . . . . . . . . . . . . . . . . . . . . . . . . . . . . . . . . (7,316,121)
Net realized loss on swap contracts . . . . . . . . . . . . . . . . . . . . . . . . . . . . . . . . . . . . . . . . . . . . . . . . (8,940,365)
Net unrealized depreciation on swap contracts . . . . . . . . . . . . . . . . . . . . . . . . . . . . . . . . . . . . . . . (553,930)
Net realized loss on options (including floor contract) . . . . . . . . . . . . . . . . . . . . . . . . . . . . . . . . . (2,188,706)
Net realized loss on futures contracts . . . . . . . . . . . . . . . . . . . . . . . . . . . . . . . . . . . . . . . . . . . . . . . (3,631,347)
Net Assets . . . . . . . . . . . . . . . . . . . . . . . . . . . . . . . . . . . . . . . . . . . . . . . . . . . . . . . . . . . . . . . . . . . . . . $ 23,383,265
Net asset value ($23,383,265 divided by 6,311,976 shares of common stockoutstanding, $0.01 par value) . . . . . . . . . . . . . . . . . . . . . . . . . . . . . . . . . . . . . . . . . . . . . . . . . . . . . $ 3.70
The accompanying notes are an integral part of the financial statements.
6
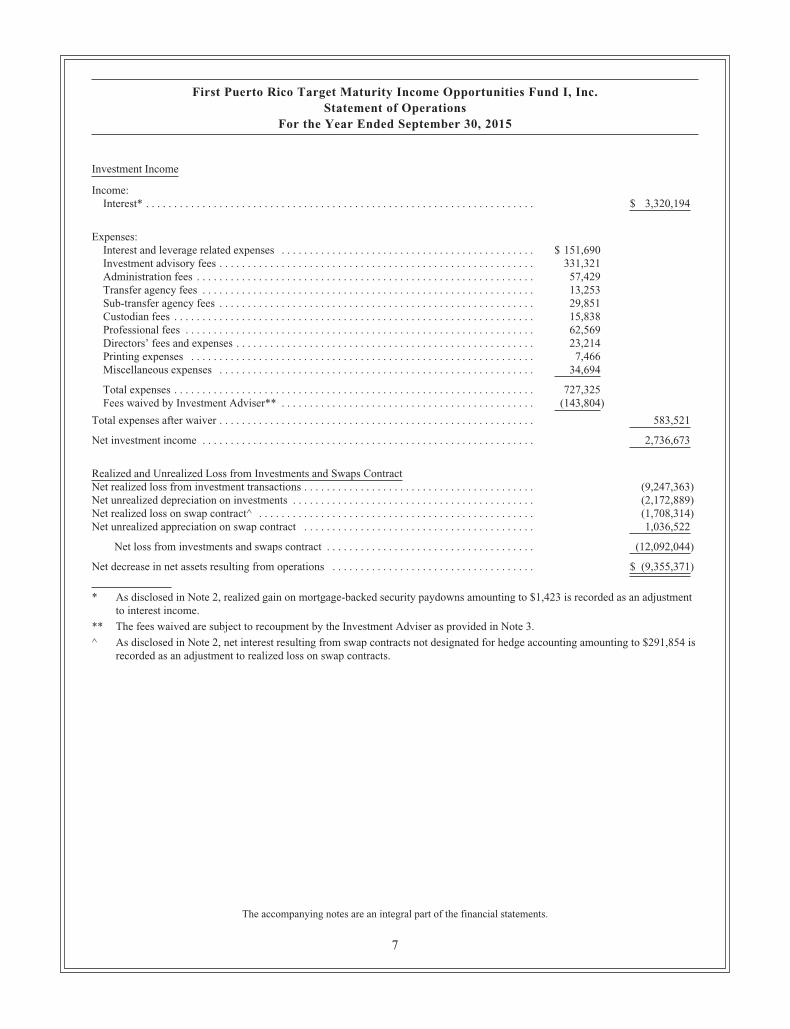
First Puerto Rico Target Maturity Income Opportunities Fund I, Inc.Statement of Operations
For the Year Ended September 30, 2015
Investment Income
Income:Interest* . . . . . . . . . . . . . . . . . . . . . . . . . . . . . . . . . . . . . . . . . . . . . . . . . . . . . . . . . . . . . . . . . . . . . $ 3,320,194
Expenses:Interest and leverage related expenses . . . . . . . . . . . . . . . . . . . . . . . . . . . . . . . . . . . . . . . . . . . . . $ 151,690Investment advisory fees . . . . . . . . . . . . . . . . . . . . . . . . . . . . . . . . . . . . . . . . . . . . . . . . . . . . . . . . 331,321Administration fees . . . . . . . . . . . . . . . . . . . . . . . . . . . . . . . . . . . . . . . . . . . . . . . . . . . . . . . . . . . . 57,429Transfer agency fees . . . . . . . . . . . . . . . . . . . . . . . . . . . . . . . . . . . . . . . . . . . . . . . . . . . . . . . . . . . 13,253Sub-transfer agency fees . . . . . . . . . . . . . . . . . . . . . . . . . . . . . . . . . . . . . . . . . . . . . . . . . . . . . . . . 29,851Custodian fees . . . . . . . . . . . . . . . . . . . . . . . . . . . . . . . . . . . . . . . . . . . . . . . . . . . . . . . . . . . . . . . . 15,838Professional fees . . . . . . . . . . . . . . . . . . . . . . . . . . . . . . . . . . . . . . . . . . . . . . . . . . . . . . . . . . . . . . 62,569Directors’ fees and expenses . . . . . . . . . . . . . . . . . . . . . . . . . . . . . . . . . . . . . . . . . . . . . . . . . . . . . 23,214Printing expenses . . . . . . . . . . . . . . . . . . . . . . . . . . . . . . . . . . . . . . . . . . . . . . . . . . . . . . . . . . . . . 7,466Miscellaneous expenses . . . . . . . . . . . . . . . . . . . . . . . . . . . . . . . . . . . . . . . . . . . . . . . . . . . . . . . . 34,694
Total expenses . . . . . . . . . . . . . . . . . . . . . . . . . . . . . . . . . . . . . . . . . . . . . . . . . . . . . . . . . . . . . . . . 727,325Fees waived by Investment Adviser** . . . . . . . . . . . . . . . . . . . . . . . . . . . . . . . . . . . . . . . . . . . . . (143,804)
Total expenses after waiver . . . . . . . . . . . . . . . . . . . . . . . . . . . . . . . . . . . . . . . . . . . . . . . . . . . . . . . . 583,521
Net investment income . . . . . . . . . . . . . . . . . . . . . . . . . . . . . . . . . . . . . . . . . . . . . . . . . . . . . . . . . . . 2,736,673
Realized and Unrealized Loss from Investments and Swaps ContractNet realized loss from investment transactions . . . . . . . . . . . . . . . . . . . . . . . . . . . . . . . . . . . . . . . . . (9,247,363)Net unrealized depreciation on investments . . . . . . . . . . . . . . . . . . . . . . . . . . . . . . . . . . . . . . . . . . . (2,172,889)Net realized loss on swap contract^ . . . . . . . . . . . . . . . . . . . . . . . . . . . . . . . . . . . . . . . . . . . . . . . . . (1,708,314)Net unrealized appreciation on swap contract . . . . . . . . . . . . . . . . . . . . . . . . . . . . . . . . . . . . . . . . . 1,036,522
Net loss from investments and swaps contract . . . . . . . . . . . . . . . . . . . . . . . . . . . . . . . . . . . . . (12,092,044)
Net decrease in net assets resulting from operations . . . . . . . . . . . . . . . . . . . . . . . . . . . . . . . . . . . . $ (9,355,371)
* As disclosed in Note 2, realized gain on mortgage-backed security paydowns amounting to $1,423 is recorded as an adjustmentto interest income.
** The fees waived are subject to recoupment by the Investment Adviser as provided in Note 3.
^ As disclosed in Note 2, net interest resulting from swap contracts not designated for hedge accounting amounting to $291,854 isrecorded as an adjustment to realized loss on swap contracts.
The accompanying notes are an integral part of the financial statements.
7
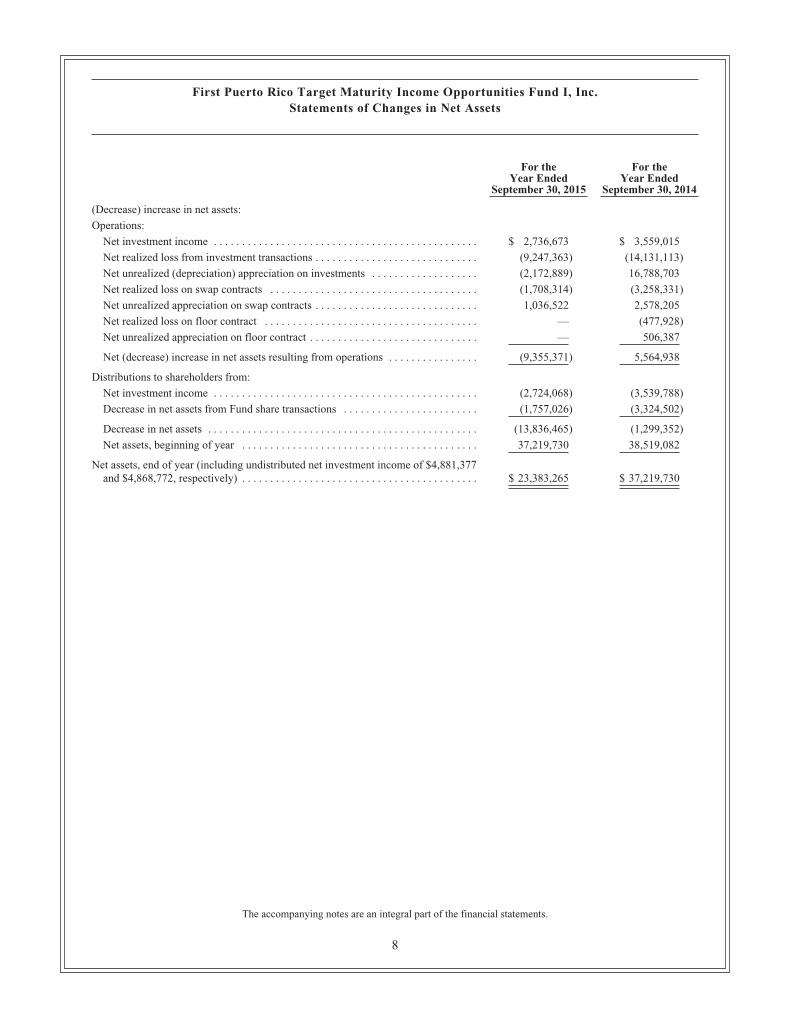
First Puerto Rico Target Maturity Income Opportunities Fund I, Inc.Statements of Changes in Net Assets
For theYear Ended
September 30, 2015
For theYear Ended
September 30, 2014
(Decrease) increase in net assets:
Operations:
Net investment income . . . . . . . . . . . . . . . . . . . . . . . . . . . . . . . . . . . . . . . . . . . . . . . $ 2,736,673 $ 3,559,015
Net realized loss from investment transactions . . . . . . . . . . . . . . . . . . . . . . . . . . . . . (9,247,363) (14,131,113)
Net unrealized (depreciation) appreciation on investments . . . . . . . . . . . . . . . . . . . (2,172,889) 16,788,703
Net realized loss on swap contracts . . . . . . . . . . . . . . . . . . . . . . . . . . . . . . . . . . . . . (1,708,314) (3,258,331)
Net unrealized appreciation on swap contracts . . . . . . . . . . . . . . . . . . . . . . . . . . . . . 1,036,522 2,578,205
Net realized loss on floor contract . . . . . . . . . . . . . . . . . . . . . . . . . . . . . . . . . . . . . . — (477,928)
Net unrealized appreciation on floor contract . . . . . . . . . . . . . . . . . . . . . . . . . . . . . . — 506,387
Net (decrease) increase in net assets resulting from operations . . . . . . . . . . . . . . . . (9,355,371) 5,564,938
Distributions to shareholders from:
Net investment income . . . . . . . . . . . . . . . . . . . . . . . . . . . . . . . . . . . . . . . . . . . . . . . (2,724,068) (3,539,788)
Decrease in net assets from Fund share transactions . . . . . . . . . . . . . . . . . . . . . . . . (1,757,026) (3,324,502)
Decrease in net assets . . . . . . . . . . . . . . . . . . . . . . . . . . . . . . . . . . . . . . . . . . . . . . . . (13,836,465) (1,299,352)
Net assets, beginning of year . . . . . . . . . . . . . . . . . . . . . . . . . . . . . . . . . . . . . . . . . . 37,219,730 38,519,082
Net assets, end of year (including undistributed net investment income of $4,881,377and $4,868,772, respectively) . . . . . . . . . . . . . . . . . . . . . . . . . . . . . . . . . . . . . . . . . . $ 23,383,265 $ 37,219,730
The accompanying notes are an integral part of the financial statements.
8

First Puerto Rico Target Maturity Income Opportunities Fund I, Inc.Statement of Cash Flows
For the Year Ended September 30, 2015
Increase/(Decrease) in Cash
Cash flows from operating activities:
Net decrease in net assets from operations . . . . . . . . . . . . . . . . . . . . . . . . . . . . . . . . . . . . . . . . . . . . $ (9,355,371)
Adjustments to reconcile net decrease in net assets from operations to net cash provided byoperating activities:Purchases of portfolio securities . . . . . . . . . . . . . . . . . . . . . . . . . . . . . . . . . . . . . . . . . . . . . . . . . (2,698,125)Proceeds from sales of portfolio securities . . . . . . . . . . . . . . . . . . . . . . . . . . . . . . . . . . . . . . . . . 12,883,323Proceeds from paydowns . . . . . . . . . . . . . . . . . . . . . . . . . . . . . . . . . . . . . . . . . . . . . . . . . . . . . . . 179,955Accretion of discount on investments, net . . . . . . . . . . . . . . . . . . . . . . . . . . . . . . . . . . . . . . . . . . (1,112,132)Amortization of deferred financing costs . . . . . . . . . . . . . . . . . . . . . . . . . . . . . . . . . . . . . . . . . . . 41,969Decrease in interest and dividends receivable . . . . . . . . . . . . . . . . . . . . . . . . . . . . . . . . . . . . . . . 123,088Increase in prepaid expenses . . . . . . . . . . . . . . . . . . . . . . . . . . . . . . . . . . . . . . . . . . . . . . . . . . . . (2,428)Decrease in accounts payable . . . . . . . . . . . . . . . . . . . . . . . . . . . . . . . . . . . . . . . . . . . . . . . . . . . . (30)Decrease in interest payable . . . . . . . . . . . . . . . . . . . . . . . . . . . . . . . . . . . . . . . . . . . . . . . . . . . . . (24,471)Increase in accrued expenses . . . . . . . . . . . . . . . . . . . . . . . . . . . . . . . . . . . . . . . . . . . . . . . . . . . . 4,767Net unrealized depreciation on investments and swaps contract . . . . . . . . . . . . . . . . . . . . . . . . . 1,136,367Net realized loss from investment transactions . . . . . . . . . . . . . . . . . . . . . . . . . . . . . . . . . . . . . . 9,247,363
Net cash provided by operating activities . . . . . . . . . . . . . . . . . . . . . . . . . . . . . . . . . . . . . . . . . . $ 10,424,275
Cash flows from financing activities:Decrease in borrowings and leverage related transactions . . . . . . . . . . . . . . . . . . . . . . . . . . . . . . . . (5,973,547)Deferred financing costs . . . . . . . . . . . . . . . . . . . . . . . . . . . . . . . . . . . . . . . . . . . . . . . . . . . . . . . . . . (280)Dividends and distributions . . . . . . . . . . . . . . . . . . . . . . . . . . . . . . . . . . . . . . . . . . . . . . . . . . . . . . . (2,641,766)Purchase of Fund shares . . . . . . . . . . . . . . . . . . . . . . . . . . . . . . . . . . . . . . . . . . . . . . . . . . . . . . . . . . (1,839,328)
Net cash used in financing activities . . . . . . . . . . . . . . . . . . . . . . . . . . . . . . . . . . . . . . . . . . . . . . . $(10,454,921)
Cash:Net decrease . . . . . . . . . . . . . . . . . . . . . . . . . . . . . . . . . . . . . . . . . . . . . . . . . . . . . . . . . . . . . . . . . . . (30,646)Beginning balance . . . . . . . . . . . . . . . . . . . . . . . . . . . . . . . . . . . . . . . . . . . . . . . . . . . . . . . . . . . . . . 71,307
Ending balance . . . . . . . . . . . . . . . . . . . . . . . . . . . . . . . . . . . . . . . . . . . . . . . . . . . . . . . . . . . . . . . . . $ 40,661
Supplemental disclosure of cash flows information:Cash paid for interest and leverage related expenses . . . . . . . . . . . . . . . . . . . . . . . . . . . . . . . . . . . . $ 111,343
Non cash activities:Dividends reinvested by common shareholders . . . . . . . . . . . . . . . . . . . . . . . . . . . . . . . . . . . . . . $ 82,302
The accompanying notes are an integral part of the financial statements.
9

First Puerto Rico Target Maturity Income Opportunities Fund I, Inc.Financial Highlights
The following table includes selected data for a share outstanding throughout the year and other performance information derivedfrom the financial statements.
For the Years Ended September 30,2015 2014 2013 2012 2011
Net asset value, beginning of the year . . . . . . . . . . . . . . . . . . . . . . . $5.50 $5.13 $8.60 $8.35 $7.94
(Loss) income from investment operations:Net investment income . . . . . . . . . . . . . . . . . . . . . . . . . . . . . . . . 0.47^ 0.56^ 0.74^ 0.73^ 0.67^Net realized and unrealized (loss) gain on investments, swaps,
options and futures contracts . . . . . . . . . . . . . . . . . . . . . . . . . . (1.91)^ 0.30^* (3.69)^* 0.09^ 0.36^*
Total (loss) income from investment operations . . . . . . . . . . . . . . . (1.44) 0.85 (2.95) 0.82 1.03
Less distributions from:Net investment income . . . . . . . . . . . . . . . . . . . . . . . . . . . . . . . . (0.42) (0.48) (0.52) (0.57) (0.62)
Gain on discount on purchase of common stock . . . . . . . . . . . . . . . 0.06 —* —* — —*
Net asset value, end of year . . . . . . . . . . . . . . . . . . . . . . . . . . . . . . . $3.70 $5.50 $5.13 $8.60 $8.35
Market value, end of year (a) . . . . . . . . . . . . . . . . . . . . . . . . . . . . . . $3.04 $4.74 $5.28 $8.80 $8.10
Total return based on net asset value (b) . . . . . . . . . . . . . . . . . . . . . (26.37)% 17.38% (36.34)% 10.19% 13.88%
Total return based on market value (b) . . . . . . . . . . . . . . . . . . . . . . (29.80)% (1.72)% (35.97)% 16.23% 14.06%
Ratios/Supplemental Data:Net operating expenses to average net assets (d) . . . . . . . . . . . . . 1.42% 1.61% 1.95% 1.92% 1.87%Net operating expenses to average weekly net assets (c) . . . . . . 0.98% 1.00% 1.00% 0.99% 1.00%Interest and leverage related expenses to average net
assets (d) . . . . . . . . . . . . . . . . . . . . . . . . . . . . . . . . . . . . . . . . . 0.50% 0.50% 0.71% 0.81% 1.24%Total expense ratio (d) (e) . . . . . . . . . . . . . . . . . . . . . . . . . . . . . . 1.92%^ 2.11%^ 2.66%^ 2.73%^ 3.11%^Net investment income ratio (d) . . . . . . . . . . . . . . . . . . . . . . . . . 8.98%^ 9.12%^ 8.93%^ 8.61%^ 8.51%^Portfolio turnover rate . . . . . . . . . . . . . . . . . . . . . . . . . . . . . . . . . 6% 24% 12% 16% 33%
Net assets, end of year (in thousands) . . . . . . . . . . . . . . . . . . . . . . . $23,383 $37,220 $38,519 $65,428 $63,780
(a) Market prices are supplied by Santander Securities LLC, an affiliate of the Fund. Santander Securities LLC, at its solediscretion, may decide to maintain a market in shares of common stock of the Fund, although it is not obligated to do so.
(b) The total return assumes reinvestment of all dividends at net asset value and does not reflect the imposition of a sales charge.Total return would have been lower in the absence of a waiver.
(c) The net operating expense ratio is based on the average weekly net assets as disclosed in Note 3, including fees waived by theInvestment Adviser for the years ended September 30, 2015, 2014, 2013, 2012 and 2011. The expense ratio, excluding feeswaived by the Investment Adviser would have been 1.30%, 1.20%, 1.06%, 1.04% and 1.05% for the years ended September 30,2015, 2014, 2013, 2012 and 2011, respectively.
(d) Based on average net assets attributable to common shareholders of $30,481,181; $39,009,961; $62,001,747; $64,760,673 and$61,272,116 for the years ended September 30, 2015, 2014, 2013, 2012 and 2011, respectively.
(e) The total expense ratio includes the fees waived by the Investment Adviser for the years ended September 30, 2015, 2014, 2013,2012 and 2011. The total expense ratio, excluding fees waived by the Investment Adviser, would have been 2.39%, 2.43%,2.77%, 2.81% and 3.20% for the years ended September 30, 2015, 2014, 2013, 2012 and 2011, respectively.
^ The net investment income, net realized gain (loss) on swaps and total expenses reflect the reclassification of net settlementsmade under swaps not designated for hedge accounting for the years ended September 30, 2015, 2014, 2013, 2012 and 2011.
* Net realized and unrealized (loss) gain on investments, swaps, options and futures contracts includes the gain on discount onpurchase of common stock of $0.09, $0.01 and $0.01 for the years ended September 30, 2014, 2013 and 2011, respectively.
The accompanying notes are an integral part of the financial statements.
10

First Puerto Rico Target Maturity Income Opportunities Fund I, Inc.Notes to Financial Statements
Note 1. Organization. First Puerto Rico Target Maturity Income Opportunities Fund I, Inc. (the “Fund”) is a non-diversified,closed-end management investment company registered under the Puerto Rico Investment Companies Act. The Fund wasincorporated on October 21, 2003 and commenced operations on December 29, 2003. The investment objective of the Fundis to provide shareholders with a high level of current investment income exempt from U.S. federal and Puerto Rico incometaxes, consistent with the preservation of capital, its investment policies and prudent investment management.
The Fund is expected to be liquidated on approximately December 31, 2034 (the “Target Date”). The Fund intends todistribute to shareholders the net assets of the Fund during the period commencing December 31, 2024 and endingapproximately on the Target Date. As a result, the Fund has established a restricted account to recoup amounts paid by theFund in connection with its initial public offering (mainly initial sales load).
Note 2. Significant Accounting Policies. The preparation of financial statements in accordance with accounting principlesgenerally accepted in the United States of America requires management to make estimates and assumptions that affect thereported amounts and disclosures in the financial statements. Actual results could differ from those estimates. The followingis a summary of significant accounting policies followed by the Fund:
Net Asset Value Per Share. The net asset value per share of the Fund is determined by the Administrator on Wednesday ofeach week after the close of trading on the New York Stock Exchange (NYSE), or if such day is not a business day in NewYork City and Puerto Rico, on the next succeeding business day. The net asset value per share is computed by dividing theassets of the Fund less its liabilities, by the number of outstanding shares of the Fund.
Security Valuation. The fair value of the securities is determined in good faith by the Administrator on the basis of thevaluations provided by dealers or independent pricing services, when such prices are available, with the assistance of theInvestment Adviser, under the guidelines approved by the Board of Directors. Equity securities are valued at the officialclosing price of, or the last reported sales price on, the exchange or market on which such securities are traded, as of theclose of business on the day the securities are being valued, or lacking any sales, at the last available bid price. Certainsecurities of the Fund for which quotations are not readily available from any source, are valued at fair value by or under thedirection of the Investment Adviser utilizing quotations and other information concerning similar securities obtained fromrecognized dealers. Short-term securities having a maturity of 60 days or less are valued at amortized cost, whichapproximates fair value. All Puerto Rico fixed income securities valuations provided by broker-dealers are priced using theaverage of two quotes, if available. The Investment Adviser can override any price that it believes is not consistent with themarket conditions, using quotes from other broker dealers.
The Board of Directors of the Fund has established a Pricing Committee to assist with the oversight of the valuation of theFund’s securities and to oversee the implementation of the Fund’s valuation policies and procedures. The PricingCommittee is comprised of top management from Santander Asset Management LLC (“SAMLLC”), the investment adviserand administrator of the Fund. The Pricing Committee’s responsibilities include unchanged price review, illiquid securities,market movement, and/or providing recommendations for approval to the Board of Directors, in accordance with the Fund’svaluation policies.
The Pricing Committee primarily employs a market-based approach which may use related or comparable assets orliabilities, recent transactions, market multiples, book values, and other relevant information for the investments todetermine the appropriateness of the fair value of the investments. Valuation reviews may be based upon current marketprices of securities that are comparable in coupon, rating, maturity and industry. SAMLLC is responsible for monitoringdevelopments that may impact Level 3 fair values and discuss at least on a quarterly basis with the Pricing Committee andthe Board of Directors. The appropriateness of Level 3 fair values is assessed based on results of unchanged price reviewand consideration of macro or security specific events and back testing.
In addition, management has internally established materiality thresholds to monitor and investigate material deviations inprices obtained from pricing providers as well from broker-dealers on a daily basis. In the event that the direction of theprice changes by more than 5%, the investment adviser compares prices to other sources, such as Bloomberg or broker-dealer quotes, and analyzes the prices trends to evaluate reasonableness of prices and challenge any price deemed not to berepresentative of fair value. Also a control department, which report to the Chief Executive Officer of SAMLLC, comparesthe prices on every purchase and sale executed by the trading department against an alternate pricing source to monitorvariances.
The Fund follows, Financial Accounting Standards Board Accounting Standards Codification No. 820 (“ASC 820”), “FairValue Measurements and Disclosures”. ASC 820 defines fair value as the price that would be received to sell an asset orpaid to transfer a liability in an orderly transaction between market participants at the measurement date. In addition,ASC 820 establishes disclosures about fair value measurements in financial statements based on hierarchical levels directlyrelated to the amount of subjectivity associated with the inputs used to determine the fair value of financial instruments. Thevarious inputs that may be used to determine the value of the fund’s investments are summarized in three broad levels. The
11

First Puerto Rico Target Maturity Income Opportunities Fund I, Inc.Notes to Financial Statements
(continued)
inputs or methodologies used for valuing securities are not necessarily an indication of the risk associated with investing inthose securities.
Level 1—Quoted prices in active markets for identical instruments.
Level 2—Prices determined using other significant observable inputs. Observable inputs are inputs that other marketparticipants may use in pricing a security. These may include quoted prices for similar securities, interest rates, prepaymentspeeds, credit risk and others.
Level 3—Prices determined using significant unobservable inputs. In situations where quoted prices or observable inputsare unavailable or deemed less relevant (for example, when there is little or no market activity for an instrument at the endof the period), unobservable inputs may be used.
The following table summarizes the Fund’s investments as of September 30, 2015, based on the inputs used to value them:
Assets: Level 1 Level 2 Level 3 Total
Puerto Rico Securities:Puerto Rico Commonwealth Agencies Bonds and
Notes . . . . . . . . . . . . . . . . . . . . . . . . . . . . . . . . . . . . . . . . $ — $15,818,193 $ — $15,818,193Collateralized Mortgage Obligations . . . . . . . . . . . . . . . . . 685,051 — 685,051Fannie Mae . . . . . . . . . . . . . . . . . . . . . . . . . . . . . . . . . . . . . 347,003 — 347,003
U.S. Securities:Government Agencies and Instrumentalities . . . . . . . . . . . 2,021,343 — 2,021,343Treasury Note . . . . . . . . . . . . . . . . . . . . . . . . . . . . . . . . . . . 3,386,541 — 3,386,541State and Municipal Obligations . . . . . . . . . . . . . . . . . . . . 8,942,493 — 8,942,493Collateralized Mortgage Obligation . . . . . . . . . . . . . . . . . . 22,844 — 22,844
Total . . . . . . . . . . . . . . . . . . . . . . . . . . . . . . . . . . . . . . . . . . . . $ — $31,223,468 $ — $31,223,468
Liabilities:
Interest rate swaps . . . . . . . . . . . . . . . . . . . . . . . . . . . . . . . . . $ — $ 553,930 $ — $ 553,930
Total . . . . . . . . . . . . . . . . . . . . . . . . . . . . . . . . . . . . . . . . . . . . $ — $ 553,930 $ — $ 553,930
No transfer in or out of Level 1, 2 or 3 fair value measurements occurred during the year ended September 30, 2015.
The following is a description of the valuation methodologies used for assets and liabilities measured at fair value on arecurring basis and classified as Level 2.
Puerto Rico securities:
Puerto Rico Commonwealth Agencies Bonds and Notes—Fair value for these securities is obtained from third-party pricingservice providers that use a pricing methodology based on observable market inputs. Market inputs utilized in the pricingevaluation process include all or some of the following: benchmark yields, reported trades, broker-dealers quotes, issuerspreads, two-sided markets, bid/offer price or spread, benchmark securities, bids, offers, reference data, benchmark curvesincluding but not limited to Treasury benchmarks, LIBOR and swap curves, and industry and economic events. The extentof the use of each market input depends on the assets class and the market conditions. Depending on the security, thepriority of the use of inputs may change or some market inputs may not be relevant. Fair value for the notes is based on thecharacteristics of the collateral.
Collateralized Mortgage Obligations (“CMOs”)—Fair value for these securities is obtained from third-party pricing serviceproviders and from broker-dealers. Third-party pricings are based on some of the following: benchmark yields, reportedtrades, issuer spreads, prepayment speeds, benchmark securities, bids, offers and market indicators. Broker-dealers pricingsare based on the characteristics of the collateral and on a bond’s theoretical value for similar obligations defined by creditquality and market sector and for which fair value incorporates an option adjusted spread. The option adjusted spreadincludes prepayment and volatility assumptions, ratings and spread adjustments.
Fannie Mae—Fair value for these securities is obtained from third-party pricing service providers that use a pricingmethodology based on observable market inputs. Market inputs used in the evaluation process include all or some of thefollowing: reported trades, benchmark securities, bid/offer price or spread, two sided markets, broker/dealers quotes,benchmark curves including but not limited to Treasury benchmarks, LIBOR and swap curves, discount rates, market datafeeds from commercial data vendors, loan level information, investor reports, prepayment speeds and trustee reports.
12

First Puerto Rico Target Maturity Income Opportunities Fund I, Inc.Notes to Financial Statements
(continued)
U.S. securities:
Government Agencies and Instrumentalities, State and Municipal Obligations and Treasury Note—Fair value for thesesecurities is obtained from third-party pricing service providers that use a pricing methodology based on an active exchangemarket and quoted market prices for similar securities.
Collateralized Mortgage Obligation—Fair value for this security is obtained from a third-party pricing service provider.The price is based on the following: benchmark yields, reported trades, issuer spreads, prepayment speeds, benchmarksecurities, bids, offers and market indicators.
Interest rate floors/swaps:
Interest rate floors and swaps are traded in over-the-counter active markets. These derivatives are indexed to an observableinterest rate benchmark, such as LIBOR, and are priced using an income approach based on present value and option pricingmodels using observable inputs. The non-performance risk is determined using models that consider the collateral held, theremaining term, and the creditworthiness of the entity that bears the risk. The fair value of the liabilities related to theinterest rate swaps and floors entered into by the Fund takes into consideration the non-performance risk of the Fund. Thelimitations established in the Puerto Rico Investment Company Act and related regulations issued by the Puerto RicoCommissioner of Financial Institutions for the use of leverage by the Fund, result in a significant amount of assets availableto pay liabilities of the Fund. Accordingly, no significant adjustment for nonperformance risk was considered necessarywhen fair valuing such swaps and floors at September 30, 2015.
Securities Sold Under Agreements to Repurchase (Reverse Repurchase Agreements). Under these agreements, the Fundsells securities, receives cash in exchange and agrees to repurchase the same or substantially the same securities at amutually agreed upon date and price. Ordinarily, the counterparties with which the Fund enters into these agreementsrequire delivery of collateral. These transactions are treated as financings and recorded as liabilities. Therefore, no gain orloss is recognized on the transaction and the securities pledged as collateral remain recorded as assets of the Fund.
Securities Purchased Under Agreements to Resell (Repurchase Agreements). Under these agreements, the Fund advancescash and receives delivery of underlying securities, the fair value of which at the time of purchase is required to be anamount equal to at least 102% of the resale price, and agrees to resell the same or substantially the same securities at amutually agreed upon date and price. In the event of default, bankruptcy or insolvency of the seller, additional delays andcosts may be incurred. At September 30, 2015, there were no repurchase agreements outstanding.
Margin Loans. The Fund enters into margin loans whereby the Fund receives cash by pledging securities owned by theFund. Interest rate is calculated, on a daily basis, using the current Federal Funds rate plus 60 basis points. These loans donot have a stated maturity date. During the year ended September 30, 2015, the margin loan facility was provided byPershing LLC subject to a guaranty provided by Santander Securities LLC.
Collateralized Exempt and Taxable Obligations. The Fund has a short and medium-term notes program as a funding vehicleto increase the amount available for investment. The short and medium-term notes are issued from time to time indenominations of $25,000 and increments of $1,000 thereafter, maturing in up to 270 days and over 270 days, respectively.The notes are collateralized by the pledge of certain securities of the Fund. The pledged securities are held by BancoSantander Trust Division, as collateral agent, for the benefit of the holders of the notes. Fees related to the issuance of shortand medium-term notes are deferred and amortized throughout the first redeemable date in the case of callable notes or theterm of the notes for non-callable notes. At September 30, 2015, there were no collateralized exempt obligationsoutstanding.
Swaps. Interest rate swaps are agreements between two parties to exchange cash flows based on a notional amount. TheFund currently utilizes interest rate swaps to fix the rate on the expected rollover of the instruments in the Fund’s leverageprogram and to economically hedge the Fund’s exposure to prepayment risk on certain fixed-rate investments. By enteringinto the swap, the principal amount of the hedged item would remain unchanged but the interest payment streams wouldchange. Interest rate swaps are marked to market weekly based upon quotations received from independent sources and thechange, if any, is recorded as unrealized appreciation or depreciation in the statement of operations. The Fund could beexposed to market risk due to unfavorable changes in interest rates or to the risk that a counterparty may default on itsobligation to the Fund. Net settlements incurred under swap contracts not designated for hedge accounting are recorded as acomponent of net realized loss on swap contracts in the statement of operations. For the year ended September 30, 2015 netsettlements incurred under swap contracts not designated for hedge accounting amounted to $291,854. At September 30,2015, there were no swap contracts outstanding designated for hedge accounting treatment.
Options. The Fund may purchase or write option contracts to manage exposure to market risk and interest rate risk.Exchange-traded options are valued on a weekly basis using the last sale price or, in the absence of a sale, at the meanbetween the last reported bid and asked prices. Options traded over-the-counter are valued on a weekly basis using dealer-supplied valuations. Changes in value, if any, are recorded as unrealized appreciation or depreciation in the statement ofoperations. Realized gain or loss is recognized when the option contract is exercised, expires or is closed.
13
First Puerto Rico Target Maturity Income Opportunities Fund I, Inc.Notes to Financial Statements
(continued)
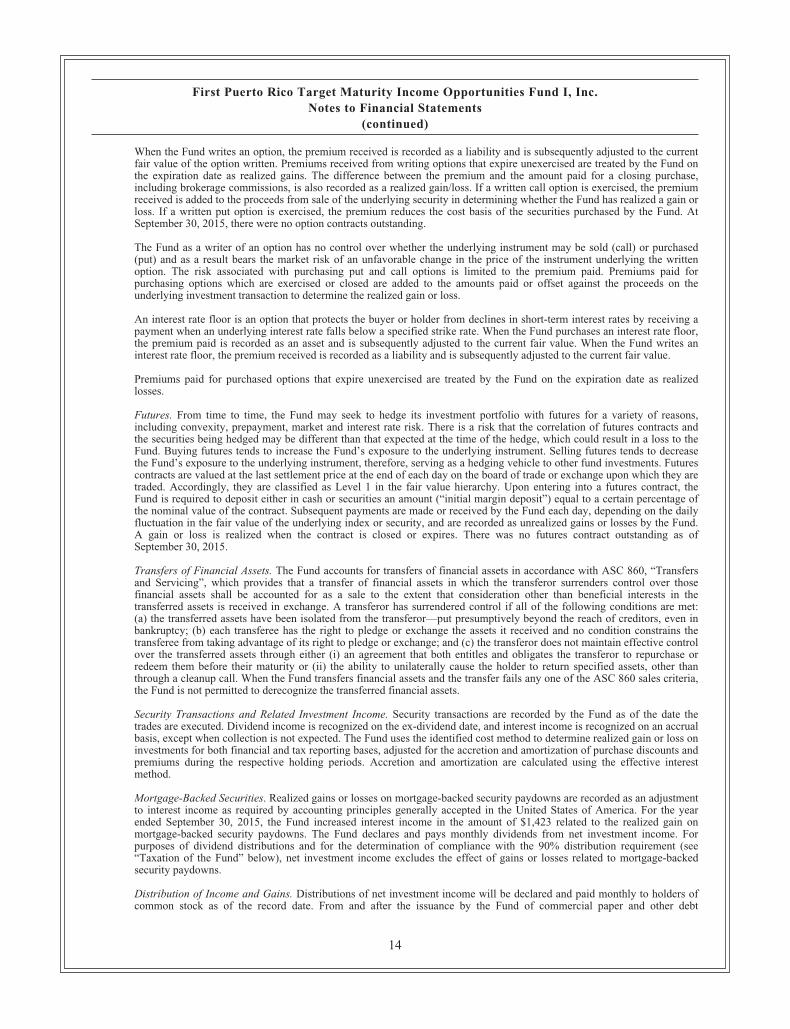
When the Fund writes an option, the premium received is recorded as a liability and is subsequently adjusted to the currentfair value of the option written. Premiums received from writing options that expire unexercised are treated by the Fund onthe expiration date as realized gains. The difference between the premium and the amount paid for a closing purchase,including brokerage commissions, is also recorded as a realized gain/loss. If a written call option is exercised, the premiumreceived is added to the proceeds from sale of the underlying security in determining whether the Fund has realized a gain orloss. If a written put option is exercised, the premium reduces the cost basis of the securities purchased by the Fund. AtSeptember 30, 2015, there were no option contracts outstanding.
The Fund as a writer of an option has no control over whether the underlying instrument may be sold (call) or purchased(put) and as a result bears the market risk of an unfavorable change in the price of the instrument underlying the writtenoption. The risk associated with purchasing put and call options is limited to the premium paid. Premiums paid forpurchasing options which are exercised or closed are added to the amounts paid or offset against the proceeds on theunderlying investment transaction to determine the realized gain or loss.
An interest rate floor is an option that protects the buyer or holder from declines in short-term interest rates by receiving apayment when an underlying interest rate falls below a specified strike rate. When the Fund purchases an interest rate floor,the premium paid is recorded as an asset and is subsequently adjusted to the current fair value. When the Fund writes aninterest rate floor, the premium received is recorded as a liability and is subsequently adjusted to the current fair value.
Premiums paid for purchased options that expire unexercised are treated by the Fund on the expiration date as realizedlosses.
Futures. From time to time, the Fund may seek to hedge its investment portfolio with futures for a variety of reasons,including convexity, prepayment, market and interest rate risk. There is a risk that the correlation of futures contracts andthe securities being hedged may be different than that expected at the time of the hedge, which could result in a loss to theFund. Buying futures tends to increase the Fund’s exposure to the underlying instrument. Selling futures tends to decreasethe Fund’s exposure to the underlying instrument, therefore, serving as a hedging vehicle to other fund investments. Futurescontracts are valued at the last settlement price at the end of each day on the board of trade or exchange upon which they aretraded. Accordingly, they are classified as Level 1 in the fair value hierarchy. Upon entering into a futures contract, theFund is required to deposit either in cash or securities an amount (“initial margin deposit”) equal to a certain percentage ofthe nominal value of the contract. Subsequent payments are made or received by the Fund each day, depending on the dailyfluctuation in the fair value of the underlying index or security, and are recorded as unrealized gains or losses by the Fund.A gain or loss is realized when the contract is closed or expires. There was no futures contract outstanding as ofSeptember 30, 2015.
Transfers of Financial Assets. The Fund accounts for transfers of financial assets in accordance with ASC 860, “Transfersand Servicing”, which provides that a transfer of financial assets in which the transferor surrenders control over thosefinancial assets shall be accounted for as a sale to the extent that consideration other than beneficial interests in thetransferred assets is received in exchange. A transferor has surrendered control if all of the following conditions are met:(a) the transferred assets have been isolated from the transferor—put presumptively beyond the reach of creditors, even inbankruptcy; (b) each transferee has the right to pledge or exchange the assets it received and no condition constrains thetransferee from taking advantage of its right to pledge or exchange; and (c) the transferor does not maintain effective controlover the transferred assets through either (i) an agreement that both entitles and obligates the transferor to repurchase orredeem them before their maturity or (ii) the ability to unilaterally cause the holder to return specified assets, other thanthrough a cleanup call. When the Fund transfers financial assets and the transfer fails any one of the ASC 860 sales criteria,the Fund is not permitted to derecognize the transferred financial assets.
Security Transactions and Related Investment Income. Security transactions are recorded by the Fund as of the date thetrades are executed. Dividend income is recognized on the ex-dividend date, and interest income is recognized on an accrualbasis, except when collection is not expected. The Fund uses the identified cost method to determine realized gain or loss oninvestments for both financial and tax reporting bases, adjusted for the accretion and amortization of purchase discounts andpremiums during the respective holding periods. Accretion and amortization are calculated using the effective interestmethod.
Mortgage-Backed Securities. Realized gains or losses on mortgage-backed security paydowns are recorded as an adjustmentto interest income as required by accounting principles generally accepted in the United States of America. For the yearended September 30, 2015, the Fund increased interest income in the amount of $1,423 related to the realized gain onmortgage-backed security paydowns. The Fund declares and pays monthly dividends from net investment income. Forpurposes of dividend distributions and for the determination of compliance with the 90% distribution requirement (see“Taxation of the Fund” below), net investment income excludes the effect of gains or losses related to mortgage-backedsecurity paydowns.
Distribution of Income and Gains. Distributions of net investment income will be declared and paid monthly to holders ofcommon stock as of the record date. From and after the issuance by the Fund of commercial paper and other debt
14

First Puerto Rico Target Maturity Income Opportunities Fund I, Inc.Notes to Financial Statements
(continued)
instruments and/or shares of preferred stock, monthly distributions to holders of common stock normally will consist of allnet investment income remaining after the payment of interest on the commercial paper or other debt securities orborrowings or dividends on the preferred stock. Net realized long-term or short-term capital gains, if any, will be retained bythe Fund, unless the Board of Directors determines that the capital gains must be distributed to holders of common stockand of preferred stock, if any, in order to ensure an advantageous tax treatment for the Fund.
Taxation of the Fund. In general, Section 1112.01(a)(2) of the Internal Revenue Code for a New Puerto Rico (the “PuertoRico Code”) provides that the Fund will be exempt from Puerto Rico income tax for a taxable year if it distributes to itsshareholders at least 90% of its net investment income for the taxable year excluding net capital gains and exempt incomeother than dividends from industrial development income. The Fund intends to meet the 90% distribution requirement to beexempt from Puerto Rico income tax under the Puerto Rico Code. Accordingly, the income earned by the Fund will not besubject to Puerto Rico income tax at the Fund level. In the opinion of the Fund’s legal counsel, based on the Fund’srepresentations, the Fund is not required to file a U.S. federal income tax return. The Fund is subject to a municipal licensetax for any investment income or realized gains not distributed to its shareholders with the exception of interest incomederived from obligations of the Commonwealth of Puerto Rico, its instrumentalities and municipalities and obligations ofthe U.S. Government and its instrumentalities and political subdivisions.
Note 3. Investment Advisory Agreement. SAMLLC (in its capacity as investment adviser, the “Investment Adviser”, and in itscapacity as administrator, the “Administrator”) is a wholly-owned subsidiary of SAM Investment Holdings Ltd. (hereinafter“SAM Holdings”), a privately held company organized under the laws of Jersey, United Kingdom. SAM Holdings is ownedin part (50%) by SAM UK Investment Holdings Limited, which is owned directly and indirectly by Banco Santander S.A., apublic company traded on the New York Stock Exchange. SAM Holdings is also owned in part (50%) by SherbrookeAcquisition Corp SPC., a segregated portfolio company incorporated in the Cayman Islands, controlled jointly by WarburgPincus, LLC and General Atlantic, LLC. Banco Santander, S.A. owns 100% of Santander BanCorp, which in turns owns100% of Santander Securities LLC (the “Distributor”). Santander BanCorp owns 100% of Banco Santander Puerto Rico (inits capacity as transfer agent, the “Transfer Agent”).
The Fund has entered into an investment advisory agreement with the Investment Adviser, under which agreement theInvestment Adviser is entitled to an annual fee equal to 0.75% of the average weekly net assets of the Fund. “Averageweekly net assets” means the average weekly value of the total assets of the Fund, including the liquidation preference ofany outstanding preferred stock, and the aggregate outstanding amount of any debt securities of the Fund, minus the sum ofaccrued liabilities of the Fund (excluding outstanding leverage), any accrued and unpaid interest on outstanding commercialpaper, debt securities and other borrowings, and accumulated dividends on outstanding shares of preferred stock. For theyear ended September 30, 2015, investment advisory fees amounted to $331,321. For the first 24 months of operations ofthe Fund, and annually thereafter, the Investment Adviser has voluntarily agreed to waive its fees and, if necessary, toreimburse the Fund to the extent that total operating expenses, excluding financing expenditures such as interest, taxes andleverage related expenses, exceed 1.00% of the average weekly net assets on an annual basis. Fees waived are subject torecoupment by the Investment Adviser within the next two years. For the year ended September 30, 2015, the InvestmentAdviser waived fees in the amount of $132,399. This amount is subject to recoupment by the Investment Adviser beforeSeptember 30, 2017. For the year ended September 30, 2014, the Investment Adviser waived fees in the amount of$125,940. This amount is subject to recoupment by the Investment Adviser before September 30, 2016. The InvestmentAdviser may waive additional fees at its discretion. Effective June 1, 2015, the Investment Adviser has voluntarily agreed towaive additional fee of 0.10%. For the year ended September 30, 2015, the Investment Adviser waived additional fees in theamount of $11,405.
Administration, Transfer Agent, Custody and Sub-Transfer Agent Agreements. The Fund has entered into anadministration agreement with the Administrator, under which agreement the Fund pays the Administrator an annual fee of0.13% of the average weekly net assets of the Fund, computed weekly and payable monthly. The Administrator performs, orarranges for the performance of, the administrative services necessary for the operation of the Fund. For the year endedSeptember 30, 2015, the Administrator earned fees of $57,429.
The Fund pays the Transfer Agent a total annual fee of 0.03% of the average weekly net assets of the Fund, computedweekly and payable monthly. For the year ended September 30, 2015, the Transfer Agent earned fees of $13,253.
The Transfer Agent has engaged Bank of New York Mellon Asset Servicing (“BNY Mellon”), to act as sub-transfer agentof the Fund. BNY Mellon acts as the Fund’s agent in administering the dividend reinvestment plan of the Fund. For the yearended September 30, 2015, BNY Mellon earned sub-transfer agency fees of $29,851.
The Fund has engaged Citibank, N.A. to act as custodian of the Fund. For the year ended September 30, 2015, Citibank,N.A. earned custodian fees amounting to $15,838.
Affiliated Transactions. The Fund is not registered under the U.S. Investment Company Act of 1940, therefore it is notsubject to the restrictions contained therein regarding, among other things, transactions between the Fund, SAMLLC, FirstPuerto Rico Family of Funds (“FPR Funds”), Santander BanCorp, Santander Securities LLC and Banco Santander Puerto
15

First Puerto Rico Target Maturity Income Opportunities Fund I, Inc.Notes to Financial Statements
(continued)
Rico or their affiliates (“Affiliated Transactions”). The Board of Directors of the Fund has adopted procedures for AffiliatedTransactions in an effort to address potential conflicts of interest that may arise. It is anticipated that Affiliated Transactionswill continue in the future and that all Affiliated Transactions will be subject to the procedures adopted by the Board ofDirectors.
The total amount of affiliated and unaffiliated transactions (in thousands), during the year ended September 30, 2015, wasas follows:
Investments:%
Securities SoldUnder Agreements
to Repurchase %MarginLoans %
CollateralizedExempt
Obligations %Purchases % Sales
Affiliated Parties . . . . . . . . . .FPR Funds . . . . . . . . . . . . . $ — —%$ — —% $186,775 56% $ — —% $ — —%Santander Securities LLC . . — —% — —% — —% 1,943 100% 12,925 33%
Unaffiliated Parties . . . . . . . . 2,698 100% 12,883 100% 147,211 44% — —% 25,850 67%
Total . . . . . . . . . . . . . . . . . . . . $2,698 100%$12,883 100% $333,986 100% $1,943 100% $38,775 100%
Board of Directors. The business and affairs of the Fund are conducted by, or under the direction of its Board of Directors.The Fund pays each Independent Director an annual fee of $350 payable quarterly plus $400 per regular Board meeting,$175 per special Board meeting, $500 per Audit Committee meeting, $175 per special Audit Committee meeting and $100per Dividend Committee meeting attended, together with such Director’s actual out-of-pocket expenses related toattendance at meetings. The terms of all contracts for services with the Fund are approved by the Board of Directors. For theyear ended September 30, 2015, directors’ compensation amounted to $23,214.
Note 4. Fund Shares. The Fund is authorized to issue 98,000,000 shares of common stock, $0.01 par value, per share. Capital stocktransactions during the years ended September 30, 2015 and September 30, 2014, were as follows:
2015 2014Shares Amount Shares Amount
Beginning of year . . . . . . . . . . . . . . . . . . . . . . . . . . . . . . 6,767,341 $68,887,639 7,504,884 $72,212,141Reinvestment of distributions . . . . . . . . . . . . . . . . . . . . . 17,734 82,302 38,665 205,388Purchase of shares . . . . . . . . . . . . . . . . . . . . . . . . . . . . . . (473,099) (1,839,328) (776,208) (3,529,890)
End of year . . . . . . . . . . . . . . . . . . . . . . . . . . . . . . . . . . . 6,311,976 $67,130,613 6,767,341 $68,887,639
The Fund is authorized to issue 2,000,000 shares of preferred stock, $25 par value. There were no shares of preferred stockoutstanding as of September 30, 2015.
The Board of Directors of the Fund authorized a purchase program in the secondary market of up to (i) 25% of its shares ofcommon stock outstanding as of June 15, 2011 and (ii) any additional shares required in connection with the Fund’sdividend reinvestment plan, if any. The open market purchases will be made from time to time from various broker-dealersat the lower of the market price and the net asset value of the shares, provided that SAMLLC determines that such price isbeneficial to the shareholders of the Fund. The share purchase program in the secondary market is intended to enhanceshareholder value and provide additional liquidity to Fund shareholders. As of September 30, 2015, a total of1,784,624 shares for $9,520,266, with a net asset value of $10,618,081 has been purchased.
Note 5. Purchases, Sales and Redemptions of Investments. For the year ended September 30, 2015, purchases, sales andredemptions of investment securities, were as follows:
Purchases SalesCalls/Maturities/
Paydowns
Puerto Rico securities . . . . . . . . . . . . . . . . . . . . . . . . . . . . . . . . . . . . $2,698,125 $12,883,323 $176,706U.S. securities . . . . . . . . . . . . . . . . . . . . . . . . . . . . . . . . . . . . . . . . . — — 3,249
Total . . . . . . . . . . . . . . . . . . . . . . . . . . . . . . . . . . . . . . . . . . . . . . . . . $2,698,125 $12,883,323 $179,955
16
First Puerto Rico Target Maturity Income Opportunities Fund I, Inc.Notes to Financial Statements
(continued)
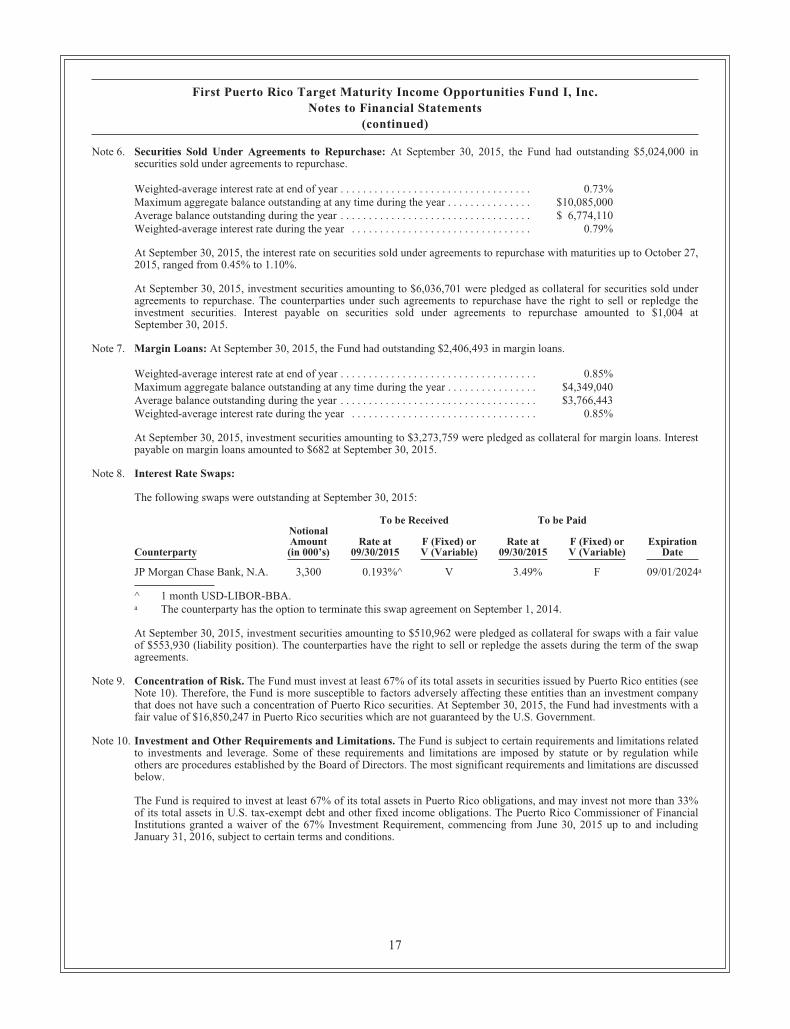
Note 6. Securities Sold Under Agreements to Repurchase: At September 30, 2015, the Fund had outstanding $5,024,000 insecurities sold under agreements to repurchase.
Weighted-average interest rate at end of year . . . . . . . . . . . . . . . . . . . . . . . . . . . . . . . . . . 0.73%Maximum aggregate balance outstanding at any time during the year . . . . . . . . . . . . . . . $10,085,000Average balance outstanding during the year . . . . . . . . . . . . . . . . . . . . . . . . . . . . . . . . . . $ 6,774,110Weighted-average interest rate during the year . . . . . . . . . . . . . . . . . . . . . . . . . . . . . . . . 0.79%
At September 30, 2015, the interest rate on securities sold under agreements to repurchase with maturities up to October 27,2015, ranged from 0.45% to 1.10%.
At September 30, 2015, investment securities amounting to $6,036,701 were pledged as collateral for securities sold underagreements to repurchase. The counterparties under such agreements to repurchase have the right to sell or repledge theinvestment securities. Interest payable on securities sold under agreements to repurchase amounted to $1,004 atSeptember 30, 2015.
Note 7. Margin Loans: At September 30, 2015, the Fund had outstanding $2,406,493 in margin loans.
Weighted-average interest rate at end of year . . . . . . . . . . . . . . . . . . . . . . . . . . . . . . . . . . . 0.85%Maximum aggregate balance outstanding at any time during the year . . . . . . . . . . . . . . . . $4,349,040Average balance outstanding during the year . . . . . . . . . . . . . . . . . . . . . . . . . . . . . . . . . . . $3,766,443Weighted-average interest rate during the year . . . . . . . . . . . . . . . . . . . . . . . . . . . . . . . . . 0.85%
At September 30, 2015, investment securities amounting to $3,273,759 were pledged as collateral for margin loans. Interestpayable on margin loans amounted to $682 at September 30, 2015.
Note 8. Interest Rate Swaps:
The following swaps were outstanding at September 30, 2015:
To be Received To be Paid
Counterparty
NotionalAmount(in 000’s)
Rate at09/30/2015
F (Fixed) orV (Variable)
Rate at09/30/2015
F (Fixed) orV (Variable)
ExpirationDate
JP Morgan Chase Bank, N.A. 3,300 0.193%^ V 3.49% F 09/01/2024a
^ 1 month USD-LIBOR-BBA.a The counterparty has the option to terminate this swap agreement on September 1, 2014.
At September 30, 2015, investment securities amounting to $510,962 were pledged as collateral for swaps with a fair valueof $553,930 (liability position). The counterparties have the right to sell or repledge the assets during the term of the swapagreements.
Note 9. Concentration of Risk. The Fund must invest at least 67% of its total assets in securities issued by Puerto Rico entities (seeNote 10). Therefore, the Fund is more susceptible to factors adversely affecting these entities than an investment companythat does not have such a concentration of Puerto Rico securities. At September 30, 2015, the Fund had investments with afair value of $16,850,247 in Puerto Rico securities which are not guaranteed by the U.S. Government.
Note 10. Investment and Other Requirements and Limitations. The Fund is subject to certain requirements and limitations relatedto investments and leverage. Some of these requirements and limitations are imposed by statute or by regulation whileothers are procedures established by the Board of Directors. The most significant requirements and limitations are discussedbelow.
The Fund is required to invest at least 67% of its total assets in Puerto Rico obligations, and may invest not more than 33%of its total assets in U.S. tax-exempt debt and other fixed income obligations. The Puerto Rico Commissioner of FinancialInstitutions granted a waiver of the 67% Investment Requirement, commencing from June 30, 2015 up to and includingJanuary 31, 2016, subject to certain terms and conditions.
17

First Puerto Rico Target Maturity Income Opportunities Fund I, Inc.Notes to Financial Statements
(concluded)
Under its leverage program, the Fund may issue, from time to time, commercial paper or other debt securities includingdollar rolls and reverse repurchase agreements and shares of preferred stock to Puerto Rico residents, representing not morethan 50% of the Fund’s total assets immediately after such issuance. The use of leverage by the Fund creates theopportunities for increased net income for holders of the common stock and a potentially higher return. At the same time,leverage creates certain risks for common shareholders, including higher volatility of both the net asset value and the fairvalue of the common shares.
In addition, the Fund may borrow money in an amount up to 5% of its total assets in order to meet repurchase requests, forother cash management purposes, to fund the purchase of portfolio securities for a period of no longer than 30 days or forother temporary, emergency or defensive purposes. Interest payments and fees incurred in connection with borrowings willincrease the Fund’s expense ratio and will reduce any income the Fund otherwise has available for the payment ofdividends.
Note 11. Subsequent Events. Management has evaluated events occurring subsequent to September 30, 2015 through December 14,2015, the date the financial statements were available to be issued, to determine if any such events should either berecognized or disclosed in the financial statements. Management has determined that there are no material events ortransactions that would affect the Fund’s financial statements or require disclosure in the Fund’s financial statementsthrough such date, except as indicated below.
On October 8, 2015, the Dividend Committee of the Fund’s Board of Directors declared tax-exempt and taxable dividendsof $0.0268 and $0.0003 per common share, respectively, totaling $169,161 and $1,894 respectively, payable on October 15,2015, to common shareholders as of record date September 30, 2015.
On November 10, 2015, the Dividend Committee of the Fund’s Board of Directors declared tax-exempt and taxabledividends of $0.0269 and $0.0002 per common share, respectively, totaling $169,824 and $1,263 respectively, payable onNovember 16, 2015, to common shareholders as of record date October 30, 2015.
On December 8, 2015, the Dividend Committee of the Fund’s Board of Directors declared tax-exempt and taxabledividends of $0.0269 and $0.0002 per common share, respectively, totaling $169,861 and $1,263 respectively, payable onDecember 15, 2015, to common shareholders as of record date November 30, 2015.
18

INDEPENDENT AUDITORS’ REPORT
The Board of Directors and ShareholdersFirst Puerto Rico Target Maturity Income Opportunities Fund I, Inc.:
We have audited the accompanying financial statements of First Puerto Rico Target Maturity Income Opportunities Fund I, Inc. (the “Fund), whichcomprise the statement of assets and liabilities, including the investment portfolio, as of September 30, 2015, and the related statements of operations andcash flows for the year then ended, the statements of changes in net assets for each of the two years in the period then ended, and the financial highlightsfor each of the five years in the period then ended, and the related notes to the financial statements.
Management’s Responsibility for the Financial Statements
Management is responsible for the preparation and fair presentation of these financial statements and financial highlights in accordance with accountingprinciples generally accepted in the United States of America; this includes the design, implementation, and maintenance of internal control relevant to thepreparation and fair presentation of financial statements and financial highlights that are free from material misstatement, whether due to fraud or error.
Auditors’ Responsibility
Our responsibility is to express an opinion on these financial statements and financial highlights based on our audits. We conducted our audits inaccordance with auditing standards generally accepted in the United States of America. Those standards require that we plan and perform the audits toobtain reasonable assurance about whether the financial statements and financial highlights are free from material misstatement.
An audit involves performing procedures to obtain audit evidence about the amounts and disclosures in the financial statements and financial highlights.The procedures selected depend on the auditor’s judgment, including the assessment of the risks of material misstatement of the financial statements andfinancial highlights, whether due to fraud or error. In making those risk assessments, the auditor considers internal control relevant to the Fund’spreparation and fair presentation of the financial statements and financial highlights in order to design audit procedures that are appropriate in thecircumstances, but not for the purpose of expressing an opinion on the effectiveness of the Fund’s internal control. Accordingly, we express no suchopinion. An audit also includes evaluating the appropriateness of accounting policies used and the reasonableness of significant accounting estimatesmade by management, as well as evaluating the overall presentation of the financial statements and financial highlights.
We believe that the audit evidence we have obtained is sufficient and appropriate to provide a basis for our audit opinion.
Opinion
In our opinion, the financial statements and financial highlights referred to above present fairly, in all material respects, the financial position of FirstPuerto Rico Target Maturity Income Opportunities Fund I, Inc. as of September 30, 2015, the results of its operations, its cash flows, the changes in itsnet assets, and financial highlights for the respective stated periods, in accordance with accounting principles generally accepted in the United States ofAmerica.
Emphasis of Matter
As discussed in Note 9 to the financial statements, the Fund is required to have high concentration of Puerto Rico securities. For many years, theCommonwealth of Puerto Rico’s (“Commonwealth”) recurring expenditures have exceeded its recurring revenues. In addition, many of theCommonwealth’s agencies and instrumentalities have had losses from operations during the past years. As result of budgetary constraints and the fiscalsituation, the credit ratings of the Commonwealth and its agencies and instrumentalities were downgraded, negatively affecting the fair value of theinvestment securities held by the Fund. Continuance of and/or significant negative changes in these factors may affect the ability of the Commonwealth,its agencies and instrumentalities to repay their outstanding obligations with investors and, accordingly, may have an adverse impact on the Fund’sfinancial condition, liquidity, funding sources, and results of operations. Our opinion is not modified with respect to this matter.
December 14, 2015
Stamp No. E201980affixed to original.
19
First Puerto Rico Target Maturity Income Opportunities Fund I, Inc.Common Stock
Santander Securities, Distributor
First Puerto Rico Target Maturity Income Opportunities Fund I, Inc.GAM Tower, 2nd Floor2 Tabonuco StreetGuaynabo, PR 00968
Address Service Requested