first publication. 2016. jpa/bp/01/2016 - … 2015...floriculture industry and bio innovation...
TRANSCRIPT


First Publication. 2016. JPA/BP/01/2016

i
Publication and distribution of this book is an effort by
the Department to assist and facilitate, especially staff of
the Department of Agriculture and Agrifood in assisting
the public who wish to obtain the required information.
It is our hope that this will contribute to a more well-
informed society in the agricultural and agrifood sector
in Brunei Darussalam.
HAJAH AIDAH BINTI HAJI MOHD HANIFAHDirector of Agriculture and AgrifoodMinistry of Primary Resources and TourismNegara Brunei Darussalam
PREFACE
Agriculture and Agrifood Sector continues to experience
positive growth, with the transition from traditional or
conventional methods of farming to technology-based
system which has moved the sector forward. Agricultural
development in this country has achieved great progress
with the increase in commodity production for the past 5
years from $240.96 million in the year 2011 to $366.15
million in the year 2015.
‘Agriculture & Agrifood Statistics In Brief’ is published
as an easy to read booklet which contains information
on agriculture and agrifood statistics and facts in Brunei
Darussalam and the development of agribusiness
activities for the year 2015, which would be beneficial to
all public and private sector, entrepreneurs, students and
researchers.

ii
AGRICULTURE AT A GLANCEIn ensuring the security of food supply and enhance
economic contribution to GDP, Brunei Darussalam
places much importance in agriculture and agrifood
development. In this respect, the Department of
Agriculture and Agrifood actively promotes development
of various agricultural commodities as well as facilitates
the outsourcing of raw materials and food supply.
It is a fact that agriculture & agrifood development is
the main factor in sustaining national food supply and
agrifood production. Agriculture & agrifood activities are
mainly centered on the production of food commodities.
In 2015, the livestock sector continued to dominate the
agriculture & agrifood sector development with the retail
value at $197.14 million compared to crop sector with an
output value of $58.53 million and agrifood processing
with output value $110.48 million, which contributed
about 54%, 16% and 30% to the total agriculture output,
respectively. Poultry, eggs and tropical leafy vegetables
are the commodities which have attained self-sufficiency
level.
All this was achieved through the active involvement
and increasing interest in commercial production by
agricultural entrepreneurs as well as small and medium
enterprises (SMEs) which have become a driving force for
agricultural development in the country.

iii
THE DEPARTMENT OF AGRICULTURE AND AGRIFOOD
Agriculture and Agrifood are the major source of the
primary resources and manufacturing sectors which
contributes to the growth of the Gross Domestic Product
(GDP), Export and Economic Diversification.
Through the proposed strategic plan, it is expected that
Agricultural productions will increase exponentially
whereby the Livestock and Crop Industry will be the
main contributor. The productions on the processing
sectors will eventually increase from the contribution of
Livestock and Crop Industry.
In effort to further develop the agriculture sector,
especially in livestock and crop production, the
Department of Agriculture and Agrifood is encouraging
the involvement of local and foreign investors and
increasing access to export market.
The core trust of the Department of Agriculture and Agrifood are:-
• Growth - ensuring growth and expansion of output
continuously every year to contribute to GDP;
• Productivity - importance of the application of technology and
modern techniques to increase productivity, drastic increase in production and reducing the unit cost of production;
• Export - reducing the dependence on small domestic market
but should explore the export market to ensure business and increase in GDP; and
• Sustainable - this has a very wide scope, but generally every
effort must be taken which aims at reducing the Government spending where we must explore several strategies such as ‘public-private partnership’, foreign direct investment and other cost-effective.

iv
CONTENTPreface
Agriculture at a Glance
The Department of Agriculture
and Agrifood
Vision/Mission/Goals
Agriculture & Agrifood in Brief
Organizational Structure
Human Resources
Agriculture Contribution To GDP
Agricultural Gross Output
Rental Rate For ADA Land
Agricultural Development Area
Agricultural Stations
Rural Agriculture
Development Area (KPLB)
Summary of The Livestock Industry
Development
Livestock Land Areas
Livestock Entrepreneurs
Broiler Industry
Egg Industry
DOC Hatchery Industry
Fertilized Eggs Industry
Beef Industry
Goat Industry
Miscellaneous Livestock
Summary of Crops Industry
Development
Crops Land Areas
Crops Entrepreneurs
Vegetables Industry
Fruit Industry
Rice Industry
Miscellaneous Crops Industry
Ornamental Industry
Cut Flowers Industry
Agrifood Industry
Export
Strategic Plan 2015 - 2020
31 - 33
34 - 36
37 - 39
40 - 44
45 - 46
47 - 50
52
53
54
55 - 61
62 - 68
69 - 71
72 - 76
77 - 80
81 - 84
86 - 88
90 - 92
94
………
………
………
………
………
………
………
………
………
………
………
………
………
………
………
………
………
………
………
………
………
………
………
………
………
………
………
………
………
………
………
………
………
………
………
i
ii
iii
1
2
3
4
5
6
7
8 - 14
15 - 16
17 - 22
24
25
26
27 - 30

1
VISION
MISSION
Towards Improving Productions on Agriculture and Agrifood Based Industries through Increasing Productivity And High
Technology Oriented For Export
To Accelerate The Growth of Agriculture and Agrifood Based Industry through High-Technology and Export Oriented,
Encouraging Progressive Involvement of Local and Foreign Direct Investment, while focusing on High-Yield Production
inclusive of Primary and Processing Industry

2
AGRICULTURE AND AGRIFOOD IN BRIEF 2015
Developed Agricultural LandLivestock: 2,910.50 haCrops: 4,149.02 ha
TOTAL : 7,059.52 ha
Agriculture/Agrifood Farmers & EntrepreneursLivestock: 987 EntrepreneursCrops: 4,249 EntrepreneursAgrifood : 381 Entrepreneurs
TOTAL : 5,665 Entrepreneurs
Gross Output of Agricultural ProductionLivestock: $197.14 millionCrops: $58.53 millionAgrifood Processing: $110.48 million
TOTAL: $366.15 million
Agricultural Labour Force Livestock: 749 PersonsCrops: 1,533 Persons Agrifood: 3,693 Persons
TOTAL: 5,975 Persons
AGRICULTURE AND AGRIFOODIN BRIEF 2015
Estimated Brunei Population : 417,200 Persons Note :
Area include Agricultural Development Area (ADA), Existing Area (Ladang Sedia Ada) – EDR & TOL, Young Famer Area and Rural Agricultural Development Area (KPLB)

3
ORGANISATIONAL STRUCTURE
Deputy Director
Director
Crop Industry
Livestock Industry
AgriculturalExtension
AgriculturalEngineering
Services
AgrifoodIndustry
Policy, Management And Finance
Human Resources Management
And ICT
InternationalAffairs And Trade
Finance & RKN
Public RelationAnd Library
Administration
Agribusiness Statistics And
Stores
VeterinaryServices
Livestock Husbandry
Animal Health and Disease
Control
Agrifood Chemical Laboratory
Services
AgrifoodProducts
Development
AgrifoodStatistics And Development
LivestockDevelopment
AgrifoodMicrobiology Laboratory
Services
Post HarvestTechnology
Public Veterinary Health
Animal Feed And
Biotechnology
Drainage And Irrigation
Building Maintenance
Soil ScienceAnd
Plant Nutrients
TemburongAgricultural
Extension District
TutongAgricultural
Extension District
AgricultureDevelopment
Area
InfrastructureMaintenance
Mechanical Engineering
Agricultural Project
Monitoring
InfrastructureDevelopment
BelaitAgricultural
Extension District
Brunei MuaraAgricultural
Extension District
Fruit Industry And Rural
AgriculturalDevelopment
FloricultureIndustry And Bio
Innovation Corridor
Vegetable Industry And
High Technology
National Rice Production
Project
Miscellaneous Crops Industry
ORGANISATIONAL STRUCTURE
3

4
DIVISION NO OF STAFF
I 1
II 68
III 109
IV 225
V * 675
Site Staff 4
Total 1,082
HUMAN RESOURCES
Note : 1/. Source : Human Resources Management & ICT Unit2/. * The number of employees in the Division V, including Open Vote and Daily Paid
HUMAN RESOURCES

5
AGRICULTURE GDP
Note: 1. GDP for year 2015 is preliminary estimates and new data calculation by using “base year 2010”2. Source: Department of Economic Planning and Development
2010 2011 2012 2013 2014 2015Agriculture GDP (B$ Mil) 70.25 76.22 88.36 82.25 88.66 89.07% Contribution 0.38% 0.33% 0.37% 0.36% 0.41% 0.50%
0.00%
0.10%
0.20%
0.30%
0.40%
0.50%
0
20
40
60
80
100
120
140
% C
ontr
ibut
ion
B$
Mill
ion
Chart TitleAGRICULTURE GDP

6
AGRICULTURAL GROSS OUTPUT
2006 2007 2008 2009 2010 2011 2012 2013 2014 2015Agriculture Production 171.75 199.53 225.44 228.26 228.43 240.96 281.52 291.67 357.25 366.15Livestock Industry 109.63 123.54 131.57 130.10 131.99 139.89 159.43 156.97 198.58 197.14Crop Industry 32.02 35.77 41.34 44.96 42.67 43.86 59.27 48.46 55.99 58.53Agrifood Processing 30.10 40.22 52.53 53.20 53.76 57.21 62.83 86.24 102.68 110.48
0
50
100
150
200
250
300
350
400B
$ M
illio
n
AGRICULTURAL GROSS OUTPUT

7
RENTAL RATE FOR AGRICULTURAL DEVELOPMENT AREAS
NOCOMERCIAL
AGRICULTURAL ACTIVITIES
DURATION RENTAL
(Year)
RENTAL RATE($/Ha/Year)
1 Vegetable 5 $25.00
2 Fruit 25 $25.00
3 Nursery (Floriculture, Grass & etc) 5 $50.00
4 Hatchery 10 $100.00
5 Poultry 5 $100.00
6 Goat 5 $5.00
7 Cow 10 $5.00
8 Deer 5 $5.00
9 Duck 5 $100.00
10 Tissue Culture 5 $50.00
11 Sugar Cane Planting 5 $25.00
12 Abattoir and Feedlot 10 $125.00
13 Agri-Mart 10 $500.00
Source : Agriculture Development Area Unit, Department of Agriculture and Agrifood
RENTAL RATE FORAGRICULTURAL DEVELOPMENT AREAS

8
NO DISTRICTGAZETTE
AREA (Ha)
ALLOCATED AREA TO FARMERS
(Ha)
STATIONS / OTHER USED(Ha)
BALANCE(Ha)
1 Brunei Muara 3,680.87 2,044.05 548.35 1,088.47
2 Tutong 1,913.16 605.22 339.85 968.09
3 Belait 4,655.92 625.12 15.63 4,015.17
4 Temburong 2,009.24 340.10 331.84 1,337.30
TOTAL 12,259.19 3,614.49 1,235.67 7,409.03
AGRICULTURAL DEVELOPMENT AREAS 2015BY DISTRICTS
Source : Agriculture Development Area Unit, Department of Agriculture and Agrifood
AGRICULTURAL DEVELOPMENT AREAS 2015BY DISTRICTS

9
NOAGRICULTURAL DEVELOPMENT
AREAS
GAZETTE AREA (Ha)
ALLOCATED AREA TO FARMERS
(Ha)
AGRICULTURAL ENTERPRISE
1 KKP Batumpu, Bengkurong-Masin 484.94 326.00 Vegetables, Fruits, Poultry, Goats,
Ornamental Nursery, Hydroponics & etc.
2 KKP Tanah Tuah, Kulapis 71.96 36.00 Poultry, Integrated Farming
3 KKP Si Bongkok, Kg Batong & Kg Masin 141.32 34.00 Vegetables & Ornamentals Plants &
Livestock
4 KKP Si Bongkok, Kg Parit, Masin 128.00 56.00 Poultry, Vegetables, Fruits & Ornamental
Plants
5 KKP Lumapas 38.86 19.30 Vegetables & Sweet Corns
6 KKP Mulaut, Kg Mulaut 31.21 13.15 Vegetables, Hatchery & Fodder
7 KKP Limpaki, Kg Mulaut 90.54 40.00 Nursery/Grass, Feedlot, Ornamental & Landscaping, and Abattoir
8 KKP Sungai Tajau, Wasan-Bebuloh 116.69 99.00 Vegetables, Ornamental Nursery, Integrated
Farming, Goats & Poultry
9 KKP Putat 0.87 0.87 Vegetables
10 KKP Tanjong Nangka 9.00 9.00 Poultry & Fruits
11 KKP Mentiri 10.66 3.57 Hatchery (DOC) and Nursery
12 KKP Wasan 476.00 257.81 Paddy, Poultry Slaughter House
13 KKP HBC Rimba 33.66 9.89 Floriculture Nursery, Hi-Tech Nursery and Garden Centre
14 KKP Tungku, Kg Tungku 232.61 232.61 Brunei Agro-Tech Park
AGRICULTURAL DEVELOPMENT AREASBRUNEI MUARA DISTRICT
AGRICULTURAL DEVELOPMENT AREASBRUNEI MUARA DISTRICT

10
NO AGRICULTURAL DEVELOPMENT AREAS
GAZETTE AREA (Ha)
ALLOCATED AREA TO FARMERS
(Ha)
AGRICULTURAL ENTERPRISE
15 KKP Mulaut 141.30 0.00 Buffalo Grazing Area
16 KKP Kg Bebuloh 204.36 204.36 Fruits and Paddy
17 KKP Jerudong (PP Luahan) 73.33 73.33 Fruits ,Vegetables and Poultry
18 KKP Terunjing 4.53 0.00 Animal Clinic & Quarantine
19 KKP Kilanas (Station) 59.5 0.00 Hydroponics
20 KKP Luahan (Station) 20.10 15.50 Poultry
21 KKP Mulaut (Station) 0.74 0.00 Agricultural Station
22 KKP Lumapas (Station) 10.78 2.00 Agricultural Station
23 KKP Kg Masin, Mukim PengkalanBatu 134.66 134.66 Poultry (Ideal Multifeed Farm (Brunei)
Sdn Bhd)
24 KKP Limau Manis/Junjungan, Mukim Pengkalan Batu 743.96 107.00 Paddy & Fruits
25 KKP Mukim Pengkalan Batu(Mulaut Mechanised Rice Project) 421.29 370 Paddy
TOTAL 3,680.87 2,044.05
AGRICULTURAL DEVELOPMENT AREASBRUNEI MUARA DISTRICT
AGRICULTURAL DEVELOPMENT AREASBRUNEI MUARA DISTRICT

11
NO AGRICULTURAL DEVELOPMENT AREAS
GAZETTE AREA (Ha)
ALLOCATED AREA TO FARMERS
(Ha)
AGRICULTURAL ENTERPRISE
1 KKP Sungai Paku, Mukim Telisai 30.0 24.0 Breeder, Hatchery & Poultry
2 KKP Kupang 109.0 109.0 Fruits
3 KKP Maraburong 138.55 46.0 Vegetables & Poultry
4 KKP Birau (Penempatan Peladang) 100.99 100.99 Broiler, Hatchery, Vegetables & Mushroom
5 KKP Padnunok/ Sungai Burong, Kiudang 113.0 95.0 Broiler & Deer
6 KKP Batang Mitus (Halaman) 588.7 87.39 Hatchery, Abattoir House, Processing, Goat & Fruits
7 KKP Bang Nukat, Lamunin (GP.133) 0.42 0.00 -
8 KKP Birau (Stesen) 233.02 61.00 Broiler, Vegetables & Agricultural Station
9 KKP Batang Mitus (Buah) 572.35 57.54 Fruits & Agricultural Station
10 KKP Bang Nukat, Lamunin (GP. 400) 2.02 0.00 Agricultural Station
11 KKP Kg. Supon Besar 0.81 0.00 Agricultural Station
12 KKP Tanjong Maya 24.3 24.3 Paddy
TOTAL 1,913.16 605.22
AGRICULTURAL DEVELOPMENT AREASTUTONG DISTRICT
AGRICULTURAL DEVELOPMENT AREASTUTONG DISTRICT

12
NO AGRICULTURAL DEVELOPMENT AREAS
GAZETTE AREA (Ha)
ALLOCATED AREA TO FARMERS
(Ha)
AGRICULTURAL ENTERPRISE
1 KKP Rampayoh, Kg Labi 120.82 77.12 Feedlot, Fruits, Vegetables, Poultry and Goat
2 KKP Merangking, Bukit Sawat 484.0 113.0 Fruits
3 KKP Sungai Liang 9.71 3.0 Hydroponics, Watermelon & Agricultural Station
4 KKP Tunggulian, Kg Tunggulian 131.28 32.0 Fruits, Vegetables, Watermelon & Arable Crops
5 KKP Lot Sengkuang, Labi 300.00 300.00 Paddy
6 KKP Malayan ‘A’ 80.0 5.0 Fruits
7 KKP Malayan ‘B’ 100.0 0.0 Fruits, Poultry & Goat
8 KKP Labi Lama, Kg Tarunan, Labi 50.0 50.0 Fruits
9 KKP Kg. Sungai Petai, Mukim Labi 50.0 45.0 Poultry & Vegetables
10 KKP Kg Mumong, Mukim KualaBelait
21.19 0.0 Agribusiness
11 KKP Kg Kenapol(Labi Agricultural Station)
3.01 0.0 Agricultural Station
12 KKP Kg Singap(Bukit Sawat Agricultural Station)
2.0 0.0 Agricultural Station
13 KKP Kg. Buau 1.99 0.0 Agricultural Station
AGRICULTURAL DEVELOPMENT AREASBELAIT DISTRICT
AGRICULTURAL DEVELOPMENT AREASBELAIT DISTRICT

13
NO AGRICULTURAL DEVELOPMENT AREAS
GAZETTE AREA (Ha)
ALLOCATED AREA TO FARMERS
(Ha)
AGRICULTURAL ENTERPRISE
14 KKP Kg. Tanjong Sudai 1.92 0.0 Agricultural Station
15 KKP Buau 3,300.0 0.0 Paddy
TOTAL 4,655.92 625.12
AGRICULTURAL DEVELOPMENT AREASBELAIT DISTRICTAGRICULTURAL DEVELOPMENT AREASBELAIT DISTRICT

14
NO AGRICULTURAL DEVELOPMENT AREAS
GAZETTE AREA (Ha)
ALLOCATED AREA TO FARMERS
(Ha)
AGRICULTURAL ENTERPRISE
1 KKP Labu Estate A 65.30 26.0 Fruits
2 KKP Labu Estate B 34.64 0.0 Fruits
3 KKP Bakarut 137.0 0.0 Fruits / Goats
4 KKP Perdayan 59.98 0.0 Arboretum / Paddy
5 KKP Selapon A 79.98 37.0 Fruits
6 KKP Selapon B 292.04 43.0 Fruits & Paddy
7 KKP Senukoh A 56.10 34.1 Paddy
8 KKP Senukoh B 32.0 0.0 Paddy
9 KKP Lakiun 999.95 200.0 Paddy
10 KKP Sembabat 250.30 0.00 Agricultural Station
11 KKP Kampong Puni 1.95 0.00 Temburong Agriculture Office
TOTAL 2,009.24 340.10
AGRICULTURAL DEVELOPMENT AREASTEMBURONG DISTRICT
AGRICULTURAL DEVELOPMENT AREASTEMBURONG DISTRICT

15
AGRICULTURAL STATIONS
NOAGRICULTURAL
STATIONS
TOTAL AREA(Ha)
AGRICULTURAL ENTERPRISE
1 Kilanas 59.50 Agricultural Research Centre
2 Terunjing 4.53 Animal Clinic & Quarantine
3 Luahan 4.60 Poultry/Agricultural Station
4 Lumapas 10.78 Vegetables / Seeds Production / Agriculture Office
5 Mulaut 142.04 Buffalo Grazing Area / Agricultural Station
6 Limpaki, Mulaut 20.0 Agriculture Office
7 Wasan 258.9 Agriculture Office, Workshop, Paddy Research Centre
8 Rimba, Gadong 18.97 Agriculture Office & Garden Centre
9 KKP Tanah Jambu 25.30Protected Cultivation, Fertigation Farming, Drip Irrigation & Soiless Culture for Vegetable, Ornamental & Fruits Production (Privatized)
10 KKP Pengkalan Batu 3.73 Crops, Processing, Exhibition and Sale of Coconut & Coconut Based Products (Privatized)
11 Birau 172.02 Fruits Research Centre
12 Batang Mitus 165.0 Fruit Nursery / Agricultural Station
13 Bang Nukat, Lamunin (GP.400) 2.02 Agricultural Station
14 Kg. Supon Besar 0.81 Agricultural Station
15 Sungai Liang 6.71 Agriculture Station, Livestock Clinic, Model Farm,Information Centre & Etc
16 KKP Kg Kenapol(Labi Agricultural Station) 3.01 Agricultural Station
AGRICULTURAL STATIONS
16
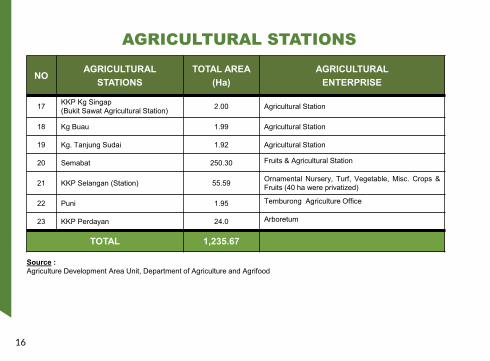
AGRICULTURAL STATIONS
Source : Agriculture Development Area Unit, Department of Agriculture and Agrifood
NOAGRICULTURAL
STATIONSTOTAL AREA
(Ha)AGRICULTURAL
ENTERPRISE
17 KKP Kg Singap(Bukit Sawat Agricultural Station) 2.00 Agricultural Station
18 Kg Buau 1.99 Agricultural Station
19 Kg. Tanjung Sudai 1.92 Agricultural Station
20 Semabat 250.30 Fruits & Agricultural Station
21 KKP Selangan (Station) 55.59 Ornamental Nursery, Turf, Vegetable, Misc. Crops &Fruits (40 ha were privatized)
22 Puni 1.95 Temburong Agriculture Office
23 KKP Perdayan 24.0 Arboretum
TOTAL 1,235.67
AGRICULTURAL STATIONS

17
NO DISTRICTNO OF
APPROVED AREA
APPROVED AREA(Ha)
NO. OF FARMERS (Persons)
ACTIVE AREA(Ha)
NO. OF FARMERS
ACTIVE (Persons)
1 Brunei Muara 13 458 1,150 247.8 608
2 Tutong 26 822.88 1,235 725.66 1,002
3 Belait 3 317 392 133 114
4 Temburong 5 208.10 197 143.70 197
TOTAL 47 1,803.98 2,974 1,250.16 1,921
KPLB LAND AREASBY DISTRICTS
Source :Fruit Industry and Rural Agricultural Development Unit, Department of Agriculture and Agrifood
KPLB LAND AREASBY DISTRICTS

18
NO AREASAPPROVED
AREA(Ha)
NO. OF FARMERS (Persons)
ACTIVE AREA(Ha)
NO. OF FARMERS
ACTIVE (Persons)
1 KPLB Kulapis 32 123 32 123
2 KPLB PITA, Kg Tanah Jambu 22 102 22 102
3 KPLB Wasan 51 152 3 5
4 KPLB Menunggol/Riong 28 75 28 75
5 KPLB Bekarai 40 128 15 48
6 KPLB Masin ‘A’ 42 60 40 58
7 KPLB Masin ‘B’ 12 27 0.4 1
8 KPLB Bukit Pawas, Kg Lumapas 40 129 3 5
9 KPLB Lugu 15 43 0.4 1
10 KPLB Bukit TempayanPisang, Kg Kapok 32 28 12 12
11 KPLB Pengkalan Batu 37 92 32 80
12 KPLB Junjongan 72 116 60 98
13 KPLB Batong 35 75 - -
TOTAL 458 1,150 247.8 608
KPLB LAND AREASBRUNEI MUARA DISTRICT
KPLB LAND AREASBRUNEI MUARA DISTRICT

19
NO AREASAPPROVED
AREA(Ha)
NO. OF FARMERS (Persons)
ACTIVE AREA(Ha)
NO. OF FARMERS
ACTIVE (Persons)
1 KPLB Bukit Sulang 99 52 99 52
2 KPLB Bukit Nanas A 12.3 19 12.3 19
3 KPLB Bukit Nanas B 68 104 65.4 100
4 KPLB Bukit Kukub A 5 11 5 11
5 KPLB Bukit Kukub B 47.4 60 37.52 47
6 KPLB Biong A 24 46 23.5 45
7 KPLB Biong B 16.8 41 16.8 41
8 KPLB Bukit Panggal 26.4 55 26.4 55
9 KPLB Bukit Sabal 6 30 6 30
10 KPLB Sg Batu Ampar 54.2 87 54.2 87
11 KPLB Merimbun 57 57 57 57
12 KPLB Padnunok ‘A’ 19 41 19 41
13 KPLB Padnunok ‘B’ 14 34 14 34
14 KPLB Padnunok ‘C’ 47.5 62 6.9 9
KPLB LAND AREASTUTONG DISTRICT
KPLB LAND AREASTUTONG DISTRICT

20
NO AREASAPPROVED
AREA(Ha)
NO. OF FARMERS (Persons)
ACTIVE AREA(Ha)
NO. OF FARMERS
ACTIVE (Persons)
15 KPLB Batang Mitus 20 45 15.56 35
16 KPLB Panchong 8 20 3.6 9
17 KPLB Bukit Tiong 28.5 54 28.5 54
18 KPLB Nong Tadion 21.5 34 21.5 34
19 KPLB Santol ‘A’ 20.2 26 20.2 26
20 KPLB Santol ‘B’ 65.3 102 65.3 77
21 KPLB Luagan Timbaran 26.8 31 26.8 31
22 KPLB Kupang 6.75 38 4.97 28
23 KPLB Tabalu 21.3 40 17.31 35
24 KPLB Meriok 62.50 25 62.50 25
25 KPLB Sungai Burong 22.58 25 16.4 20
26 KPLB Paya Perian 22.85 96 - -
TOTAL 822.88 1,235 725.66 1,002
KPLB LAND AREASTUTONG DISTRICT
KPLB LAND AREASTUTONG DISTRICT

21
NO AREASAPPROVED
AREA(Ha)
NO. OF FARMERS (Persons)
ACTIVE AREA(Ha)
NO. OF FARMERS ACTIVE
(Persons)
1 KPLB Sungai Lalit A 28 32 28 32
2 KPLB Sungai Lalit B 120 149 73 50
3 KPLB Pak Natu 169 211 32 32
TOTAL 317 392 133 114
KPLB LAND AREASBELAIT DISTRICT
KPLB LAND AREASBELAIT DISTRICT

22
NO AREASAPPROVED
AREA(Ha)
NO. OF FARMERS (Persons)
ACTIVE AREA(Ha)
NO. OF FARMERS
ACTIVE (Persons)
1 KPLB Sibut 33.6 42 33.6 42
2 KPLB Meniup 31.5 43 31.5 43
3 KPLB Belais 15.9 28 15.9 28
4 KPLB Seri Tanjong Belayang 100 51 35.6 51
5 KPLB Puni 27.1 33 27.1 33
TOTAL 208.10 197 143.7 197
KPLB LAND AREASTEMBURONG DISTRICT
KPLB LAND AREASTEMBURONG DISTRICT


24
AGRICULTURE COMMODITY
LOCAL IMPORT TOTAL SELF-SUFFICIENCY
Quantity Retail Value ($mil) Quantity CIF Value
($mil) Quantity %
Broilers (mt) 23,263.96 106.79 1,496.26 5.56 24,760.22 93.96%
Eggs (mil eggs) 130.53 26.39 2.08 0.37 132.61 98.43%
Beef – Buffalo & Cattle (mt) 133.88 1.36 3,283.02 20.81 3,416.89 3.92%
Goat Meat (mt) 8.24 0.12 13.18 0.18 21.42 38.45%
Day Old Chicks(mil heads)
16.66 19.99 0.38 0.46 17.04 97.76%
Fertilized Eggs (mil egg)
9.78 7.83 6.61 4.56 16.39 59.69%
Miscellaneous Livestock (mt) 179.39 1.25 n/a n/a n/a n/a
Animal Feed (mt) 41,884.25 33.42 26,537.94 10.58 68,422.19 61.21%
TOTAL 197.14 42.51
SUMMARY OF THE LIVESTOCKS INDUSTRY DEVELOPMENT 2015
SUMMARY OF THE LIVESTOCKS INDUSTRYDEVELOPMENT 2015

25
COMMODITIES BRUNEI/MUARA BELAIT TUTONG TEMBURONG TOTAL
(Ha)
Broiler (Chicken Meat) 171.39 7.30 98.26 1.60 278.55
Layer (Egg) 99.46 8.20 0.00 0.00 107.66
Day Old Chicks 19.47 0.00 41.00 0.00 60.47
Fertilized Eggs 0.00 0.00 40.00 0.00 40.00
Buffalo 1,030.85 20.94 746.26 128.52 1,926.57
Cattle 22.08 13.82 54.12 12.07 102.09
Goats 90.90 44.06 81.64 18.70 235.30
Deer 15.25 0.00 2.25 2.50 20.00
Sheep 10.82 0.00 8.00 14.05 32.89
Animal Feed 106.99 0.00 0.00 0.00 106.99
TOTAL (Ha) 1,567.21 94.32 1,071.53 177.44 2,910.50
LIVESTOCK LAND AREAS 2015
Note : Area include Agricultural Development Area (ADA), Young Farmer Area, Existing Area and Rural Agricultural Development Area.
LIVESTOCK LAND AREAS 2015COMMODITIES BRUNEI/
MUARA BELAIT TUTONG TEMBURONG TOTAL (Ha)
Broiler (Chicken Meat) 171.39 7.30 98.26 1.60 278.55
Layer (Egg) 99.46 8.20 0.00 0.00 107.66
Day Old Chicks 19.47 0.00 41.00 0.00 60.47
Fertilized Eggs 0.00 0.00 40.00 0.00 40.00
Buffalo 1,030.85 20.94 746.26 128.52 1,926.57
Cattle 22.08 13.82 54.12 12.07 102.09
Goats 90.90 44.06 81.64 18.70 235.30
Deer 15.25 0.00 2.25 2.50 20.00
Sheep 10.82 0.00 8.00 14.05 32.89
Animal Feed 106.99 0.00 0.00 0.00 106.99
TOTAL (Ha) 1,567.21 94.32 1,071.53 177.44 2,910.50
LIVESTOCK LAND AREAS 2015
Note : Area include Agricultural Development Area (ADA), Young Farmer Area, Existing Area and Rural Agricultural Development Area.

26
AGRICULTURE COMMODITY
BRUNEI / MUARA BELAIT TUTONG TEMBURONG TOTAL
(Entrepreneurs)
Broilers 18 5 14 3 40
Eggs 4 5 0 0 9
Day Old Chicks 4 0 3 0 7
Fertilized Eggs 0 0 2 0 2
Buffalo 92 9 145 16 262
Cattle 175 15 28 4 222
Goats 148 43 73 19 283
Deer 8 2 4 2 16
Sheep 6 0 2 13 21MiscellaneousLivestock 41 14 14 49 118
Animal Feed 7 0 0 0 7
Total (Entrepreneurs) 503 93 285 106 987
LIVESTOCK ENTREPRENEURS 2015LIVESTOCKS ENTREPRENEURS 2015

27
BROILER INDUSTRY 2015
Total Consumption 24,760.22 mtRetail Value (B$) 112.90 millionPer Capita Consumption (kg/yr) 59.3 kg
Total Day Old Chick 17,044,139 birdsLocal 16,661,739 birdsImport 382,400 birdsPrice Per Chick (B$) 1.20 /bird
No. of Slaughter Broiler 15,509,309 birdsMortality Rate 8.7 %Growth Period 7 weeksAverage Dressed Weight (kg) 1.50 /bird
No of Entrepreneurs 40 persons
Local Production 23,264.0 mtRetail Value (B$) 106.79 millionPercentage Production 94.0 %(not included process product)
Import (Chilled & Frozen) * 1,496.3 mtCIF Value (B$) 5.56 millionEst. Retail Value (B$) 6.12 millionPercentage Import 6.0 %
Average Retail Price (B$)Whole Chicken 4.59 /kg
Average CIF Price (B$)Whole 0.42 /kgPart 4.76 /kgFurther Process 3.89 /kgProcess 4.10 /kg
Brunei Estimated Population 417,200 persons
Note : • Imports in whole, part and for further process only (not including processed products).
BROILER INDUSTRY 2015

28
BROILER INDUSTRY 2006 - 2015
BROILER INDUSTRY 2006 – 2015
Note : Import include process product
Met
ric T
onne
s
25,000
20,000
15,000
10,000
5,000
2006Local 17,886
711 947 1,615 1,640 1,887 1,954 2,459 2,399 1,789 3,31819,079 19,485 19,536 20,635 22,962 23,902 23,062 23,932 23,264
Import
2007 2008 2009 2010 2011 2012 2013 2014 20150

29
PRIVATE SECTOR CONTRIBUTION IN BROILERPRODUCTION 2015 (CHICKEN MEAT)
Small & Medium5,889 mt[25%]
QAF Farm3,752 mt[16%]
Soon Lee Farm4,704 mt[20%]Ideal Multifeed Farm
3,239 mt[14%]
Hua Ho Agriculture Farm2,590 mt[11%]
Sykt Kumpulan Harapan Baru1,439 mt
[6%]
Tunas Harapan Farm1,652 mt
[7%]
PRIVATE SECTOR CONTRIBUTION IN BROILER PRODUCTION 2015 (CHICKEN MEAT)
Note:
Market Size: 23,264 mt (B$106.79 million)Large-Scale Company 75%Small & Medium Company 25%

30
CHICKEN MEAT IMPORT (CHILLED & FROZEN)BY CATEGORY 2015
Part128.56 mt[3.9%]
Further Process1,259.70 mt[38%]Process
1,821.38 mt[54.9%]
CHICKEN MEAT IMPORT (CHILLED & FROZEN) BY CATEGORY 2015
Note :Import from Malaysia & Jordan
Whole108.00 mt[3.3%]

31
EGG INDUSTRY 2015Total Consumption 132.61 mil eggsRetail Value (B$) 26.80 millionPer Capita Consumption (egg/yr) 318 eggs
Local Production 130.53 mil eggsRetail Value (B$) 26.39 millionNo. of Layer 947,341 birds
Area 107.66 ha
Import 2.08 mil eggsCIF Value (B$) 0.37 millionEst Retail Value (B$) 0.41 millionPercentage Import 1.6 %
Self-Sufficiency 98.4 %Average Retail Price (B$) 0.20 /egg
Brunei Estimated Population 417,200 persons
DISTRICT QUANTITY(Mil. Eggs)
RETAIL VALUE (B$)
QUANTITY PERCENTAGE
(%)NO OF FARMS
Brunei/Muara 99.34 20.07 76.1 % 4
Belait 31.19 6.32 23.9 % 5
TOTAL 130.53 26.39 100 % 9
LOCAL PRODUCTION
EGG INDUSTRY 2015

32
EGG INDUSTRY 2006 - 2015
EGG INDUSTRY 2006 – 2015
140
120
100
Mill
ion
Eggs 80
60
40
20
2006118.39Local
Import 0.00 1.79 0.45 1.20 0.20 0.93 3.15 4.40 1.98 2.08114.17 123.21 124.48 127.54 128.87 128.51 127.98 131.7 130.52007 2008 2009 2010 2011 2012 2013 2014 2015
0

33
PRIVATE SECTOR CONTRIBUTIONIN EGGS PRODUCTION 2015
Hua Ho Agriculture Farm 51.94 mill eggs
[ 39 % ]
Soon Lee Farm & Trading Co. 23.07 mill eggs
[ 17 % ]
Import2.08 mill eggs [ 2% ]
Small & Medium Company12.16 mill eggs [ 9% ]
Ideal Multifeed Farm43.36 mill eggs [ 33 % ]
PRIVATE SECTOR CONTRIBUTION IN EGGS PRODUCTION 2015
Note :Market Size: 130.53 million eggs (B$26.39 million)Large-Scale Company 91%Small & Medium Company 9%

34
Total Consumption 17.04 mil birdsRetail Value (B$) 20.45 million
Local Production 16.66 mil birdsRetail Value (B$) 19.99 millionPercentage Production 97.8 %Price Per Chick (B$) 1.20 /bird
DISTRICT QUANTITY(Mil. Birds) RETAIL VALUE (B$)
QUANTITY PERCENTAGE
(%)
Brunei/Muara 6.08 7.30 36.5
Tutong 10.58 12.69 63.5
TOTAL 16.66 19.99 100.0
DOC HATCHERY INDUSTRY 2015
Import 0.38 mil birdsCIF Value (B$) 0.45 millionRetail Value (B$) 0.46 millionPercentage Import 2.2 %
LOCAL PRODUCTION
DOC HATCHERY INDUSTRY 2015

35
DOC INDUSTRY 2006 - 2015
DOC INDUSTRY 2006 – 2015
18
16
Thou
sand
Bird
s
14
12
10
8
6
4
2
02006
LocalImport
13.050.66 0.56 0.29 0.26 0.35 0.38 0.29 0.25 0.19 0.38
13.49 13.92 14.07 14.57 14.10 16.80 16.20 16.84 16.662007 2008 2009 2010 2011 2012 2013 2014 2015

36
PRIVATE SECTOR CONTRIBUTIONIN DAYS OLD CHICKS PRODUCTION 2015
Ideal Hatchery2.56 mil birds[15%] Hua Ho Agriculture Farm
3.22 mil birds[19%]
Golden Chick Hatchery & Breeding Farm5.30 mil birds[31%]
MZ B Hatchery2.69 mil birds
[16%]
Mumtaz Farm 0.17 mil birds
[1%]
QAF Farm2.72 mil birds[16%]Import
0.38 mil birds[2%]
PRIVATE SECTOR CONTRIBUTION IN DAYS OLD CHICKS PRODUCTION 2015
Note:
Market Size: 17.04 million birds (B$20.45 million)Local Production 97.8 %Import 2.2 %

37
FERTILIZED EGGS INDUSTRY 2015
Total Consumption 16.39 mil eggsRetail Value (B$) 13.11 million
Local Production 9.78 mil eggsRetail Value (B$) 7.83 millionSelf-Sufficiency 59.7 %No. of Layer 171,972 birds
Import 6.61 mil eggsCIF Value (B$) 4.56 millionRetail Value (B$) 5.28 millionPercentage Import 40.3 %
Average Retail Price (B$) 0.80 /egg
FERTILIZED EGGS INDUSTRY 2015

38
FERTILIZED EGGS INDUSTRY2006 - 2015
FERTILIZED EGGS INDUSTRY 2006 – 2015
10,000
9,000
8,000
7,000
6,000
Thou
sand
Egg
s
5,000
4,000
3,000
2,000
20068,964Local
Import 4,898 5,090 4,913 5,923 5,845 6,309 7,335 7,352 6,720 6,6069,694 9,987 9,208 9,117 8,711 9,737 8,779 9,223 9,7832007 2008 2009 2010 2011 2012 2013 2014 2015
1,000
0

39
PRIVATE SECTOR CONTRIBUTIONIN FERTILIZED EGGS PRODUCTION 2015
Ideal Hatchery Sdn Bhd3.16 mil eggs
[19.3%]Import6.61 mil eggs[40.3%]
Golden Chick Hatchery & Breeding Farm6.63 mil eggs[40.4%]
PRIVATE SECTOR CONTRIBUTION IN FERTILIZED EGGS PRODUCTION 2015
Note:
Market Size: 16.39 mil eggs (B$13.11 million)Local Production 59.7 %Import 40.3%

40
BEEF INDUSTRY 2015
Total Consumption 5,163.31 mtBuffalo 2,830.72 mtCattle 2,332.60 mt
Retail Value (B$) 75.65 millionBuffalo (B$) 27.36 millionCattle (B$) 48,29 million
Per Capita Consumption 12.4 kg/yr
Local (Slaughtered) 781 headsDressed Weight 133.88 mtRetail Value (B$) 1.36 millionPercentage Production 2.59 %
Total Import (Live) *** 6,144 headsCIF Value (B$) 8.67 millionEst. Live Weight 2,281.60 mt
Live Import (Slaughtered) * 7,850 headsDressed Weight 1,746.42 mtEst. CIF Value (B$) 9.13 millionRetail Value (B$) 30.32 millionPercentage Import 33.82 %
Import (Chilled & Frozen) ** 3,283.02 mtCIF Value (B$) 20.81 millionRetail Value (B$) 43.96 millionPercentage Import 63.58 %
Average Retail Price (B$)Buffalo Meat (B$) 8.54 – 11.47 /kgCattle Meat (B$) 14.87 – 29.26 /kg
Brunei Estimated Population 417,200 Persons
Note : * - Alive livestock that slaughtered for year 2015** - Import (Chilled & Frozen) only part & for further process (not included process product)*** - Total overall alive livestock imported to Brunei for the year 2015
BEEF INDUSTRY 2015

41
TYPE OF LIVESTOCK
LOCAL (ALIVE)Quantity(Head)
Live Weight (Kg)
Dressing(%)
Dressed Weight (Mt)
Retail Value(B$)
Buffalo 725 253,750 50% 126.88 1,220,450.70
Cattle 56 14,000 50% 7.00 141,248.63
TOTAL 781 267,750 133.88 1,361,699.33
TYPE OF LIVESTOCK
IMPORT ALIVE (SLAUGHTERED)
Quantity(Head)
Live Weight (Kg)
Dressing(%)
Dressed Weight (Mt)
Retail Value(B$)
Buffalo 2,169 867,600 52% 451.15 4,389,872.45
Cattle 5,681 2,158,780 60% 1,295.27 25,933,870.03
TOTAL 7,850 3,026,380 1,746.42 30,323,742.48
TYPE OF LIVESTOCK
IMPORT (CHILLED & FROZEN) – PART & FOR FURTHER PROCESS
Quantity(Mt)
C.I.F Value(B$)
C.I.F Price (B$/Kg)
Retail Value(B$)
Buffalo 2,252.69 13,142,122.90 5.83 21,748,273.00
Cattle 1,030.33 7,668,373.76 7.44 22,216,267.31
TOTAL 3,283.02 20,810,496.66 6.34 43,964,540.31
TYPE OF LIVESTOCK
IMPORT (CHILLED & FROZEN) – PROCESS PRODUCT
Quantity(Mt)
C.I.F Value(B$)
C.I.F Price(B$/Kg)
Cattle 14.81 222,529.09 15.03
TOTAL 14.81 222,529.09 15.03
SUMMARY OF BEEF INDUSTRY 2015SUMMARY OF BEEF INDUSTRY 2015

42
BEEF INDUSTRY 2006 - 2015
BEEF INDUSTRY 2006 – 2015
Note : Chilled & frozen imports are in the form of parts & for further process only (not including processed products).
6,000
5,000
4,000
Met
ric T
onne
s
3,000
2,000
1,000
0200648.9Local
Import 334 3,080 3,775 2,750 3,463 4,053 3,796 5,454 4,731 5,02972.2 30.5 24.0 9.4 28.4 91.2 93.1 71.4 133.92007 2008 2009 2010 2011 2012 2013 2014 2015

43
BUFFALO AND CATTLESLAUGHTERED IN 2015
Other Companies3,915 heads[45.4%]
PDS Abattoir Sdn Bhd4,085 heads
[47.3%]
Mulaut Abattoir Sdn Bhd631 heads[7.3%]
BUFFALO AND CATTLE SLAUGHTERED IN 2015
Note:
Market Size: 8,631 heads (B$31.68 mil)

44
COUNTRY
LIVE ANIMALS
CATTLE BUFFALO TOTAL
Head CIF Value (B$) Head CIF Value
(B$) HeadCIF Value
(B$)
Australia 3,830 5,987,472 625 1,000,674 4,455 6,988,146
Sarawak, Malaysia 99 89,952 1,135 1,127,929 1,234 1,217,881
Sabah, Malaysia 325 333,639 130 128,906 455 462,544
TOTAL 4,254 6,411,062 1,890 2,257,509 6,144 8,668,572
COUNTRY
BEEF (CHILLED AND FROZEN)
CATTLE BUFFALO TOTAL
Quantity (Kg)
CIF Value (B$)
Quantity (Kg)
CIF Value (B$)
Quantity (Kg)
CIF Value (B$)
Australia 1,030,330.04 7,668,373.76 1,030,330.04 7,668,373.76
India 2,252,688.40 13,142,122.90 2,252.688.40 13,142,122.90
Malaysia 14,808.40 222,529.09 14,808.40 222,529.09
TOTAL 1,045,138.44 7,890,902.85 2,252,688.40 13,142,122.90 3,297,826.84 21,033,025.75
IMPORTED OF CATTLE & BUFFALO BY COUNTRY 2015
Note :For chilled & frozen import, buffalo meat is part & for further process only and cattle meat include part, for further process and process product.
IMPORTED OF CATTLE & BUFFALO BY COUNTRY 2015

45
GOAT INDUSTRY 2015GOAT INDUSTRY 2015
Total Consumption 1,391 headsTotal Dressed Weight 21.42 mtRetail Value (B$) 0.32 millionPer Capita Consumption 0.05 kg/yr
Local (Slaughtered) 732 headsDressed Weight 8.24 mtRetail Value (B$) 0.12 millionPercentage Production 38.5 %
Live Import (Slaughtered) * 659 headsDressed Weight 13.18 mtEst. C.I.F Value 0.18 millionEst. Retail Value (B$) 0.20 millionPercentage Import 61.5 %
Total Import (Live) ** 2,884 headsC.I.F Value (B$) 1.02 million
Brunei Estimated Population 417,200 Persons
Note :* - Alive livestock that slaughtered for year 2015.
** - Total overall alive livestock imported to Brunei.
GOAT INDUSTRY 2015
Total Consumption 1,391 headsTotal Dressed Weight 21.42 mtRetail Value (B$) 0.32 millionPer Capita Consumption 0.05 kg/yr
Local (Slaughtered) 732 headsDressed Weight 8.24 mtRetail Value (B$) 0.12 millionPercentage Production 38.5 %
Live Import (Slaughtered) * 659 headsDressed Weight 13.18 mtEst. C.I.F Value 0.18 millionEst. Retail Value (B$) 0.20 millionPercentage Import 61.5 %
Total Import (Live) ** 2,884 headsC.I.F Value (B$) 1.02 million
Brunei Estimated Population 417,200 Persons
Note :* - Alive livestock that slaughtered for year 2015.
** - Total overall alive livestock imported to Brunei.

46
GOAT INDUSTRY 2006 - 2015
GOAT INDUSTRY 2006 - 2015
30
25
20
15
Met
ric T
onne
s
10
5
020063.74Local
Import 26.88 10.42 3.48 22.28 10.26 4.92 6.60 17.64 11.04 13.182.85 0.92 0.81 3.62 6.76 10.35 9.24 8.240.92007 2008 2009 2010 2011 2012 2013 2014 2015

47
TYPE OF LIVESTOCKS UNIT QUANTITY(Unit)
QUANTITY(Kilogram)
RETAIL VALUE(B$)
RUMINANT :-
1. Sheep Heads 8 160.00 $2,560.002. Deer Heads 2 76.50 $1,300.50
NON-RUMINANT :-1. Ayam Kampong Birds 30,553 36,663.60 $403,299.602. Goose Birds 0 0.00 $0.003. Patu Birds 1,237 1,855.50 $12,988.504. Duck Birds 3,567 3,567.00 $24,969.005. Quail Birds 84,503 11,407.91 $205,342.296. Pigeon Birds 30 11.40 $68.407. Old Layer Chicken Birds 64,623 77,547.60 $306,313.028. Old Breeder Chicken Birds 0 0.00 $0.009. Guinea Fowl Birds 8 4.00 $16.0010. Turkey Chicken Birds 19 133.00 $1,064.00
EGGS :-
1. Ayam Kampong Eggs Eggs 120,500 6,025.00 60,250.002. Goose Eggs Eggs 10 3.40 3.003. Patu Eggs Eggs 11,159 669.54 3,347.704. Duck Eggs Eggs 615,403 36,924.18 184,620.905. Quail Eggs Eggs 430,012 4,300.12 43,001.206. Guinea Fowl Eggs Eggs 520 26.00 260.004. Turkey Chicken Eggs Eggs 240 14.40 120.00
TOTAL 179,389.15 $1,249,524.11
MISCELLANEOUS LIVESTOCK INDUSTRY 2015MISCELLANEOUS LIVESTOCK INDUSTRY 2015
48
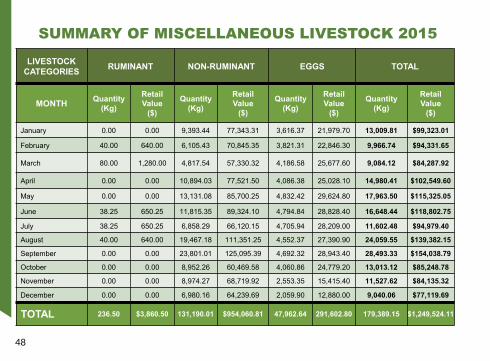
SUMMARY OF MISCELLANEOUS LIVESTOCK 2015
LIVESTOCK CATEGORIES RUMINANT NON-RUMINANT EGGS TOTAL
MONTH Quantity(Kg)
Retail Value
($)
Quantity(Kg)
Retail Value
($)
Quantity(Kg)
Retail Value
($)
Quantity(Kg)
Retail Value
($)
January 0.00 0.00 9,393.44 77,343.31 3,616.37 21,979.70 13,009.81 $99,323.01
February 40.00 640.00 6,105.43 70,845.35 3,821.31 22,846.30 9,966.74 $94,331.65
March 80.00 1,280.00 4,817.54 57,330.32 4,186.58 25,677.60 9,084.12 $84,287.92
April 0.00 0.00 10,894.03 77,521.50 4,086.38 25,028.10 14,980.41 $102,549.60
May 0.00 0.00 13,131.08 85,700.25 4,832.42 29,624.80 17,963.50 $115,325.05
June 38.25 650.25 11,815.35 89,324.10 4,794.84 28,828.40 16,648.44 $118,802.75
July 38.25 650.25 6,858.29 66,120.15 4,705.94 28,209.00 11,602.48 $94,979.40
August 40.00 640.00 19,467.18 111,351.25 4,552.37 27,390.90 24,059.55 $139,382.15
September 0.00 0.00 23,801.01 125,095.39 4,692.32 28,943.40 28,493.33 $154,038.79
October 0.00 0.00 8,952.26 60,469.58 4,060.86 24,779.20 13,013.12 $85,248.78
November 0.00 0.00 8,974.27 68,719.92 2,553.35 15,415.40 11,527.62 $84,135.32
December 0.00 0.00 6,980.16 64,239.69 2,059.90 12,880.00 9,040.06 $77,119.69
TOTAL 236.50 $3,860.50 131,190.01 $954,060.81 47,962.64 291,602.80 179,389.15 $1,249,524.11
SUMMARY OF MISCELLANEOUS LIVESTOCK 2015

49
MISCELLANEOUS LIVESTOCK PRODUCTION BY QUANTITY (KG) & DISTRICT - 2015
DISTRICTB/MUARA TUTONG BELAIT TEMBURONG TOTAL
TYPE OF LIVESTOCK
RUMINANT :-1. Sheep 100.00 20.00 0.00 40.00 160.002. Deer 76.50 0.00 0.00 0.00 76.50TOTAL (Kg) 176.50 20.00 0.00 40.00 236.50
NON-RUMINANT :-1. Ayam Kampong 33,549.60 192.00 963.60 1,958.40 36,663.602. Goose 0.00 0.00 0.00 0.00 0.003. Patu 1,606.50 28.50 0.00 220.50 1,855.504. Duck 344.00 1,073.00 135.00 2,015.00 3,567.005. Quail 11,110.50 297.41 0.00 0.00 11,407.916. Pigeon 11.40 0.00 0.00 0.00 11.407. Old Layer Chicken 77,547.60 0.00 0.00 0.00 77,547.608. Old Breeder Chicken 0.00 0.00 0.00 0.00 0.009. Guinea Fowl 0.00 0.00 0.00 4.00 4.0010. Turkey Chicken 133.00 0.00 0.00 0.00 133.00TOTAL (Kg) 124,302.60 1,590.91 1,098.60 4,197.90 131,190.01EGGS :-1. Ayam Kampong Eggs 1,006.95 3,440.55 0.00 1,577.50 6,025.002. Goose Eggs 0.00 0.00 0.00 3.40 3.403. Patu Eggs 3.60 371.94 0.00 294.00 669.544. Duck Eggs 5,402.76 5,489.82 0.00 26,031.60 36,924.185. Quail Eggs 3,273.88 1,026.24 0.00 0.00 4,300.126. Guinea Fowl Eggs 0.00 0.00 0.00 26.00 26.007. Turkey Chicken Eggs 0.00 0.00 0.00 14.40 14.40TOTAL (Kg) 9,687.19 10,328.55 0.00 27,946.90 47,962.64
TOTAL OVERALL (Kg) 134,166.29 11,939.46 1,098.60 32,184.80 179,389.15
MISCELLANEOUS LIVESTOCK PRODUCTION BY QUANTITY (KG) & DISTRICT - 2015

50
DISTRICTB/MUARA TUTONG BELAIT TEMBURONG TOTAL
TYPE OF LIVESTOCKRUMINANT :-1. Sheep $1,600.00 $320.00 $0.00 $640.00 $2,560.002. Deer $1,300.50 $0.00 $0.00 $0.00 $1,300.50
TOTAL (B$) $2,900.50 $320.00 $0.00 $640.00 $3,860.50NON-RUMINANT :-1. Ayam Kampong $369,045.60 $2,112.00 $10,599.60 $21,542.40 $403,299.602. Goose $0.00 $0.00 $0.00 $0.00 $0.003. Patu $11,245.50 $199.50 $0.00 $1,543.50 $12,988.504. Duck $2,408.00 $7,511.00 $945.00 $14,105.00 $24,969.005. Quail $199,989.00 $5,353.29 $0.00 $0.00 $205,342.296. Pigeon $68.40 $0.00 $0.00 $0.00 $68.407. Old Layer Chicken $306,313.02 $0.00 $0.00 $0.00 $306,313.028. Old Breeder Chicken $0.00 $0.00 $0.00 $0.00 $0.009. Guinea Fowl $0.00 $0.00 $0.00 $16.00 $16.0010. Turkey Chicken $1,064.00 $0.00 $0.00 $0.00 $1,064.00TOTAL (B$) $890,133.52 $15,175.79 $11,544.60 $37,206.90 $954,060.81EGGS :-1. Ayam Kampong Eggs $10,069.50 $34,405.50 $0.00 $15,775.00 $60,250.002. Goose Eggs $0.00 $0.00 $0.00 $3.00 $3.003. Patu Eggs $18.00 $1,859.70 $0.00 $1,470.00 $3,347.704. Duck Eggs $27,013.80 $27,449.10 $0.00 $130,158.00 $184,620.905. Quail Eggs $32,738.80 $10,262.40 $0.00 $0.00 $43,001.206. Guinea Fowl Eggs $0.00 $0.00 $0.00 $260.00 $260.004. Turkey Chicken Eggs $0.00 $0.00 $0.00 $120.00 $120.00TOTAL (B$) $69,840.10 $73,976.70 $0.00 $147,786.00 $291,602.80
TOTAL OVERALL (B$) $962,874.12 $89,472.49 $11,544.60 $185,632.90 $1,249,524.11
MISCELLANEOUS LIVESTOCK PRODUCTION BY DISTRICT & RETAIL PRICE - 2015
MISCELLANEOUS LIVESTOCK PRODUCTION BY DISTRICT & RETAIL PRICE - 2015

52
AGRICULTURE COMMODITY
LOCAL IMPORTTOTAL
(Quantity -Unit)
PERCENTAGESELF-
SUFFICIENCYQuantity(Unit)
Retail Value ($Mil)
Quantity(Unit)
CIF Value ($Mil)
Vegetables (mt) 12,981.13 33.76 10,816.87 16.02 23,798.00 54.55%
Fruits (mt) 6,261.97 13.72 16,493.27 28.48 22,755.25 27.52%
Rice (mt) 1,983.19 5.57 31,349.65 37.54 33,332.84 5.95%
Miscellaneous Crops (mt) 1,136.75 2.45 14,167.94 15.73 15,304.69 7.43%
Ornamental Plants (plants) 687,360 2.86 236,562 0.65 923,922 74.40%
Cut Flowers (cut) 173,625 0.16 1,014,400 1.09 1,188,025 14.61%
TOTAL 58.53 99.51
SUMMARY OF CROPS INDUSTRY DEVELOPMENT 2015
SUMMARY OF CROPS INDUSTRYDEVELOPMENT 2015

53
DISTRICT / COMMODITIES
BRUNEI-MUARA BELAIT TUTONG TEMBURONG TOTAL
(Ha)
Vegetables 473.27 93.00 90.27 7.60 664.14
Fruits 387.84 572.08 1,068.37 351.00 2,379.29
Paddy 388.70 158.10 138.53 238.70 924.03
Miscellaneous Crops 34.56 31.95 30.82 11.60 108.93
Floriculture 27.10 4.67 10.86 30.00 72.63
TOTAL (Ha) 1,311.47 859.80 1,338.85 638.90 4,149.02
CROP LAND AREAS 2015
Note :
Area include Agricultural Development Area (ADA), Existing Area (Ladang Sedia Ada) – EDR & TOL, Young Famer Area and Rural Agricultural Development Area
CROP LAND AREAS 2015

54
DISTRICT / AGRICULTURE COMMODITY
BRUNEI / MUARA BELAIT TUTONG TEMBURONG TOTAL
(Entrepreneurs)
Vegetables 253 136 116 40 545
Fruits 601 321 1,152 475 2,549
Paddy 224 146 258 211 839
Miscellaneous crops 20 71 148 46 285
Floriculture 32 18 28 1 79
TOTAL (Entrepreneurs) 1,130 692 1,702 773 4,297
CROPS ENTREPRENEURS 2015CROP ENTREPRENEURS 2015

55
VEGETABLE INDUSTRY 2015
Total Consumption 23,798.0 mtTropical 16,379.7 mtTemperate 7,418.3 mt
Est. Retail Value (B$) 65.91 millionPer Capita Consumption 57.0 kg/yr
Local Production 12,981.1 mtRetail Value (B$) 33.76 million
Percentage Production 54.5 %Tropical Vegetable 79.3 %
Area Developed 664.1 ha
No of Entrepreneurs 545 entrepreneurs
Import 10,816.9 mtCIF Value (B$) 16.02 millionEst. Retail Value (B$) 32.15 millionPercentage Import 45.5 %
Average Retail Price (B$) 1.00 – 12.00 /kg
Average CIF Price (B$)Tropical 0.39 – 10.50 /kgTemperate 0.70 – 102.76 /kg
Brunei Estimated Population 417,200 persons
VEGETABLE INDUSTRY 2015
56
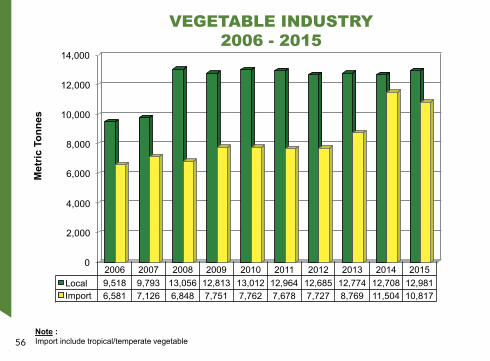
VEGETABLE INDUSTRY 2006 - 2015
VEGETABLE INDUSTRY 2006 – 2015
Note : Import include tropical/temperate vegetable
14,000
12,000
10,000
8,000
Met
ric T
onne
s
6,000
4,000
2,000
020069,518Local
Import 6,581 7,126 6,848 7,751 7,762 7,678 7,727 8,769 11,504 10,8179,793 13,056 12,813 13,012 12,964 12,685 12,774 12,708 12,9812007 2008 2009 2010 2011 2012 2013 2014 2015

57
DISTRICT QUANTITY(Mt)
RETAIL VALUE(B$)
QUANTITY PERCENTAGE (%)
BRUNEI/MUARA 7,206.09 18,419,076 54.6
BELAIT 2,240.06 7,039,584 20.9
TUTONG 3,275.37 7,555,241 22.4
TEMBURONG 259.60 744,294 2.2
TOTAL 12,981.13 33,758,196 100.0
TYPES QUANTITY(Mt)
C.I.F. VALUE(B$)
QUANTITY PERCENTAGE (%)
TROPICAL 3,398.54 4,734,093.42 31.4
TEMPERATE 7,418.33 11,288,360.95 68.6
TOTAL 10,816.87 16,022,454.37 100.0
DISTRICT AREA(Ha)
PERCENTAGE(%)
NO OF FARMERS(Entrepreneurs)
BRUNEI/MUARA 473.27 71.3% 253
TUTONG 90.27 13.6% 116
BELAIT 93.00 14.0% 136
TEMBURONG 7.60 1.1% 40
TOTAL 664.14 100.0% 545
LOCAL VEGETABLES PRODUCTION 2015
VEGETABLES IMPORT 2015
VEGETABLES LAND AREA 2015
LOCAL VEGETABLES PRODUCTION 2015
VEGETABLES IMPORT 2015
VEGETABLES LAND AREA 2015
DISTRICT QUANTITY(Mt)
RETAIL VALUE(B$)
QUANTITY PERCENTAGE (%)
BRUNEI/MUARA 7,206.09 18,419,076 54.6
BELAIT 2,240.06 7,039,584 20.9
TUTONG 3,275.37 7,555,241 22.4
TEMBURONG 259.60 744,294 2.2
TOTAL 12,981.13 33,758,196 100.0
TYPES QUANTITY(Mt)
C.I.F. VALUE(B$)
QUANTITY PERCENTAGE (%)
TROPICAL 3,398.54 4,734,093.42 31.4
TEMPERATE 7,418.33 11,288,360.95 68.6
TOTAL 10,816.87 16,022,454.37 100.0
DISTRICT AREA(Ha)
PERCENTAGE(%)
NO OF FARMERS(Entrepreneurs)
BRUNEI/MUARA 473.27 71.3% 253
TUTONG 90.27 13.6% 116
BELAIT 93.00 14.0% 136
TEMBURONG 7.60 1.1% 40
TOTAL 664.14 100.0% 545
LOCAL VEGETABLES PRODUCTION 2015
VEGETABLES IMPORT 2015
VEGETABLES LAND AREA 2015

58
DISTRICTB/MUARA BELAIT TUTONG TEMBURONG TOTAL
Quantity % FARM CATEGORY
Existing Area (Commercial) 863,547 999,057 2,122,860 46,127 4,031,591 31.1%
Existing Area (Non-Commercial) 125,590 804,227 472,666 125,398 1,527,881 11.8%
Existing Area (Unregistered Farmer) 0 0 0 82,941 82,941 0.6%
Agricultural Development Area 5,491,191 159,989 155,296 169 5,806,645 44.7%
Hydroponic Farm 0 58,280 0 0 58,280 0.4%
Rural Agricultural Development Area 0 218,244 38,073 4,833 261,150 2.0%
Young Farmers Area 724,327 0 485,769 0 1,210,096 9.3%
Mushroom Farm 1,436 265 712 134 2,546 0.0%
TOTAL (Kg) 7,206,091 2,240,062 3,275,374 259,602 12,981,129 100.0%
DISTRICTB/MUARA BELAIT TUTONG TEMBURONG TOTAL Retail
Value %FARM CATEGORY
Existing Area (Commercial) 2,387,822 2,865,280 4,954,860 114,561 10,322,524 30.6%
Existing Area (Non-Commercial) 412,981 2,741,482 993,747 305,603 4,453,813 13.2%
Existing Area (Unregistered Farmer) 0 0 0 312,533 312,533 0.9%
Agricultural Development Area 13,724,309 575,386 328,304 967 14,628,966 43.3%
Hydroponic Farm 0 170,492 0 0 170,492 0.5%
Rural Agricultural Development Area 0 683,763 85,270 9,025 778,058 2.3%
Young Farmers Area 1,876,737 0 1,184,518 0 3,061,256 9.1%
Mushroom Farm 17,226 3,182 8,541 1,606 30,555 0.1%
TOTAL (B$) 18,419,076 7,039,584 7,555,241 744,294 33,758,196 100.0%
STATUS OF VEGETABLES PRODUCTION BY FARM CATEGORY AND DISTRICT – 2015STATUS OF VEGETABLES PRODUCTION
BY FARM CATEGORY AND DISTRICT - 2015

59
RANK TYPE QUANTITY(Kg)
RETAIL VALUE (B$)
PRICE(B$/Kg)
1 Cucumber 2,373,244 3,378,554 1.42
2 Long Bean 1,483,097 4,019,216 2.71
3 Chai Sim (Sawi Hijau/Manis) 1,304,598 3,334,883 2.56
4 Convolvulus/Water Spinach 997,587 1,856,753 1.86
5 Chinese Spinach/Amaranth (Bayam) 881,887 1,679,120 1.90
6 Pak Choy 698,625 1,693,234 2.42
7 Loafah 571,931 1,113,025 1.95
8 Bitter Guord 527,027 1,471,029 2.79
9 Lady’s Finger 492,389 1,526,384 3.10
10 Red Chilli 487,579 3,349,105 6.87
11 Eggplant 461,052 1,211,659 2.63
12 Water Guord 352,418 555,095 1.58
13 Sawi Taiwan 338,149 1,096,231 3.24
14 Swatow Mustard (Sawi Pahit) 263,717 763,951 2.90
15 Pumpkin 185,049 355,129 1.92
15 MAJOR TYPE OF LOCAL VEGETABLESPRODUCTION 2015 (BY QUANTITY)
15 MAJOR TYPE OF LOCAL VEGETABLESPRODUCTION 2015 (BY QUANTITY)

60
RANK TYPE QUANTITY(Kg)
C.I.F VALUE (B$)
AVERAGEC.I.F PRICE
(B$/Kg)1 Thailand Chilli 621,946 1,076,447 1.73
2 Pumpkin 437,452 346,051 0.79
3 French Bean 357,359 304,900 0.85
4 Radish 284,840 271,030 0.95
5 Egg Plant/Brinjal 254,355 175,803 0.69
6 Mushroom 197,218 1,045,877 5.30
7 Red Chilli 192,509 312,749 1.62
8 Spring Onion/Chives 167,282 120,939 0.72
9 Timun Duri 154,729 75,488 0.49
10 Corriander Leaf 108,529 159,482 1.47
11 Daun Sop 105,800 116,225 1.10
12 Young Corn 103,012 312,713 3.04
13 Continental Cucumber 65,805 62,681 0.95
14 Terong Iban 38,981 24,749 0.63
15 Wax Guord / Squash 38,208 18,200 0.48
15 MAJOR TYPE OF IMPORT TROPICAL VEGETABLES 2015 (BY QUANTITY)
15 MAJOR TYPE OF IMPORT TROPICALVEGETABLES 2015 (BY QUANTITY)

61
RANK TYPE QUANTITY(Kg)
C.I.F VALUE (B$)
AVERAGEC.I.F PRICE
(B$/Kg)1 Cabbage 2,057,268 1,479,310 0.72
2 Tomato 1,403,115 1,202,735 0.86
3 Carrot 1,044,938 1,290,007 1.23
4 Cauliflower 444,019 825,779 1.86
5 Lettuce 419,892 1,542,906 3.67
6 Brocolli (Bunga Kobis) 387,388 1,215,638 3.14
7 Baby Kailan 318,182 299,962 0.94
8 Chinese Cabbage 270,321 214,007 0.79
9 Capsicum/Sweet Pepper 233,131 645,020 2.77
10 Pak Choy 161,558 275,889 1.71
11 Celery 143,077 278,524 1.95
12 Leek 76,372 102,227 1.34
13 Chinese Kale 63,782 185,537 2.91
14 Lotus Root 41,083 127,647 3.11
15 Asparagus 38,354 355,166 9.26
15 MAJOR TYPE OF IMPORT TEMPERATE VEGETABLES 2015 (BY QUANTITY)
15 MAJOR TYPE OF IMPORT TEMPERATEVEGETABLES 2015 (BY QUANTITY)

62
FRUITS INDUSTRY 2015
Total Consumption 22,755.2 mtTropical 16,704.1 mtTemperate 6,051.1 mt
Est. Retail Value (B$) 60.14 millionPer Capita Consumption 54.5 kg/yr
Local Production 6,262.0 mtRetail Value (B$) 13.72 millionPercentage Production 27.5 %Percentage Tropical Fruits 37.5 %
Area Developed 2,379 ha
No of Entrepreneurs 2,549 entrepreneurs
Import 16,493.3 mtCIF Value (B$) 28.48 millionEst. Retail Value (B$) 46.42 millionPercentage Import 72.5 %
Average Retail Price (B$) 0.39 – 7.16 /kg
Average CIF Price (B$)Tropical 0.38 – 7.85 /kgTemperate 1.87 – 22.77 /kg
Brunei Estimated Population 417,200 Persons
FRUITS INDUSTRY 2015

63
FRUITS INDUSTRY 2006 - 2015
FRUITS INDUSTRY 2006 – 2015
18,000
16,000
14,000
12,000
Met
ric T
onne
s
10,000
8,000
6,000
4,000
2,000
2006
3,765LocalImport 14,787 14,322 14,359 14,332 14,940 14,413 13,647 14,480 14,803 16,493
4,372 3,485 4,372 3,229 2,628 8,779 3,855 5,834 6,262
2007 2008 2009 2010 2011 2012 2013 2014 20150

64
DISTRICT QUANTITY(Mt)
RETAIL VALUE (B$)
PERCENTAGE (%)
BRUNEI/MUARA 2,668.38 4,584,938.01 42.6
BELAIT 1,665.96 4,803,320.52 26.6
TUTONG 1,011.42 2,260,941.85 16.2
TEMBURONG 916.21 2,068,519.48 14.6
TOTAL 6,261.97 13,717,719.86 100.0
TYPES QUANTITY(Mt)
C.I.F. VALUE (B$) PERCENTAGE (%)
TROPICAL 10,442.14 12,947,530.29 63.3
TEMPERATE 6,051.14 15,530,467.24 36.7
TOTAL 16,493.27 28,477,997.53 100.0
DISTRICT EXISTING AREA RADA ADA YF
TOTAL
HA %
BRUNEI/MUARA 87.04 232.80 56.00 12.00 387.84 16.3
TUTONG 164.71 725.66 170.00 8.00 1,068.37 44.9
BELAIT 382.78 133.00 56.30 0.00 572.08 24.0
TEMBURONG 143.80 143.70 63.50 0.00 351.00 14.8
TOTAL 778.33 1,235.16 345.80 20.00 2,379.29 100.0
LOCAL FRUITS PRODUCTION 2015
FRUITS IMPORT 2015
DEVELOPED FRUIT BY FARM CATEGORY 2015
Note : RADA- Rural Agricultural Development Area , ADA - Agricultural Development Area & YF - Young Famers
LOCAL FRUITS PRODUCTION 2015
FRUITS IMPORT 2015
DEVELOPED FRUIT BY FARM CATEGORY 2015
DISTRICT QUANTITY(Mt)
RETAIL VALUE (B$)
PERCENTAGE (%)
BRUNEI/MUARA 2,668.38 4,584,938.01 42.6
BELAIT 1,665.96 4,803,320.52 26.6
TUTONG 1,011.42 2,260,941.85 16.2
TEMBURONG 916.21 2,068,519.48 14.6
TOTAL 6,261.97 13,717,719.86 100.0
TYPES QUANTITY(Mt)
C.I.F. VALUE (B$) PERCENTAGE (%)
TROPICAL 10,442.14 12,947,530.29 63.3
TEMPERATE 6,051.14 15,530,467.24 36.7
TOTAL 16,493.27 28,477,997.53 100.0
DISTRICT EXISTING AREA RADA ADA YF
TOTAL
HA %
BRUNEI/MUARA 87.04 232.80 56.00 12.00 387.84 16.3
TUTONG 164.71 725.66 170.00 8.00 1,068.37 44.9
BELAIT 382.78 133.00 56.30 0.00 572.08 24.0
TEMBURONG 143.80 143.70 63.50 0.00 351.00 14.8
TOTAL 778.33 1,235.16 345.80 20.00 2,379.29 100.0
LOCAL FRUITS PRODUCTION 2015
FRUITS IMPORT 2015
DEVELOPED FRUIT BY FARM CATEGORY 2015
Note : RADA- Rural Agricultural Development Area , ADA - Agricultural Development Area & YF - Young Famers

65
DISTRICTB/MUARA TUTONG BELAIT TEMBURONG TOTAL
QUANTITY %FARM CATEGORY
Existing Area (Commercial) 203,565 30,971 894,880 19,552 1,148,968 18.35%
Existing Area (Non-Commercial) 146,868 150,650 548,770 458,992 1,305,280 20.84%
Existing Area (Non-Commercial –unregistered farmer) 1,390,049 327,699 18,284 364,247 2,100,279 33.54%
Rural Agricultural Development Area 533,487 270,692 85,929 25,766 915,874 14.63%
Young Farmers Area 20,238 366 0 0 20,604 0.33%
Sinaut Incubator 0 1,768 0 0 1,768 0.03%
Agricultural Development Area (ADA) 374,171 229,273 118,101 47,654 769,199 12.28%
TOTAL (Kg) 2,668,378 1,011,419 1,665,964 916,211 6,261,972 100.00%
DISTRICTB/MUARA TUTONG BELAIT TEMBURONG TOTAL
VALUE %FARM CATEGORY
Existing Area (Commercial) 411,217 67,325 2,486,366 30,569 2,995,478 21.84%
Existing Area (Non-Commercial) 225,306 287,006 1,746,511 1,204,356 3,463,179 25.25%
Existing Area (Non-Commercial –unregistered farmer) 1,511,235 763,427 27,012 683,082 2,984,756 21.76%
Rural Agricultural Development Area 1,747,529 747,202 255,770 70,889 2,821,391 20.57%
Young Farmers Area 48,166 826 0 0 48,992 0.36%
Sinaut Incubator 0 12,376 0 0 12,376 0.09%
Agricultural Development Area (ADA) 641,484 382,780 287,662 79,622 1,391,547 10.14%
TOTAL (B$) 4,584,938 2,260,942 4,803,321 2,068,519 13,717,720 100.00%
STATUS OF FRUIT PRODUCTION BY FARM CATEGORY AND DISTRICT – 2015
STATUS OF FRUIT PRODUCTIONBY FARM CATEGORY AND DISTRICT - 2015

66
RANK TYPE QUANTITY(Kg)
RETAIL VALUE (B$)
PRICE(B$/Kg)
1 Banana 1,269,039 1,672,051 1.32
2 Young Coconut 1,164,692 449,425 0.39
3 Durian 652,373 3,510,771 5.38
4 Musk Lime 531,970 1,761,989 3.31
5 Cempedak 285,885 600,826 2.10
6 Rambutan 284,827 662,419 2.33
7 Mango 274,355 748,469 2.73
8 Papaya 261,937 385,115 1.47
9 Old Coconut 249,439 359,765 1.44
10 Tarap 174,719 320,828 1.84
11 Limau Kapas 141,118 563,664 3.99
12 Watermelon 139,952 222,157 1.59
13 Jackfruit 113,398 209,056 1.84
14 Guava 102,885 325,955 3.17
15 Pineapple 87,329 193,248 2.21
15 MAJOR TYPE OF LOCAL FRUITS 2015PRODUCTION (BY QUANTITY)
15 MAJOR TYPE OF LOCAL FRUITS 2015PRODUCTION (BY QUANTITY)

67
RANK TYPE QUANTITY(Kg)
C.I.F VALUE (B$)
AVERAGEC.I.F PRICE
(B$/Kg)1 Watermelon 2,478,884 1,197,193 0.48
2 Banana 2,453,806 2,139,530 0.87
3 Melon/Rock Melon 864,894 1,117,002 1.29
4 Young Coconut 656,639 249,901 0.38
5 Papaya 567,624 314,331 0.55
6 Lemon 453,509 1,340,225 2.96
7 Pineapple 438,493 481,814 1.10
8 Durian 426,012 1,358,504 3.19
9 Mango 310,977 1,555,202 5.00
10 Old Coconut 244,638 176,507 0.72
11 Pamelo 206,854 184,704 0.89
12 Guava 195,745 150,545 0.77
13 Langsat 152,944 206,287 1.35
14 Avocado 129,166 662,795 5.13
15 Rambutan 113,399 217,310 1.92
15 MAJOR TYPE OF IMPORT TROPICAL FRUITS 2015 (BY QUANTITY)
15 MAJOR TYPE OF IMPORT TROPICALFRUITS 2015 (BY QUANTITY)

68
RANK TYPE QUANTITY(Kg)
C.I.F VALUE (B$)
AVERAGEC.I.F PRICE
(B$/Kg)1 Apple 2,014,908 4,030,891 2.00
2 Sunkist Orange 1,400,876 2,621,873 1.87
3 Mandarin Orange 834,349 1,668,180 2.00
4 Pear 695,101 1,449,590 2.09
5 Grape 576,588 3,195,791 5.54
6 Dragon Fruit 116,564 250,305 2.15
7 Kiwi Fruit 86,122 391,430 4.55
8 Sweet Orange 69,549 155,662 2.24
9 Longan 61,334 170,390 2.78
10 Strawberry 54,704 703,530 12.86
11 Plum 48,217 208,115 4.32
12 Persimmon 23,936 136,314 5.69
13 Grape Fruit 11,447 26,364 2.30
14 Chestnut 10,388 33,405 3.22
15 Lychee 8,091 62,153 7.68
15 MAJOR TYPE OF IMPORT TEMPERATE FRUITS 2015 (BY QUANTITY)
15 MAJOR TYPE OF IMPORT TEMPERATEFRUITS 2015 (BY QUANTITY)

69
RICE INDUSTRY 2015
Note:
1. Area are divided into two data. Harvested area is 1,302.93 ha for two seasons and total developed area is 924.03 ha
2. The average retail price of local rice are taken from the overall average retail price which was collected by Agribusiness Statistics & Stores Unit. While import prices was according to the price control by EPU.
Total Consumption 33,333 mtEst. Retail Value (B$) 43.11 millionPer Capita Consumption 79.90 kg/yr
Local Production 1,983.2 mtRetail Value (B$) 5.57 millionPercentage Self-Sufficiency 5.95 %
Average Retail Price (B$)Local Rice 2.81 /kg
Area Developed 924.03 haProductivity
Irrigated Area 6.17 mt/ha/yrNon-Irrigated Area 1.42 mt/ha/yr
Total Import 25,540 mt
Saleable 31,350 mtEst. Retail Value (B$) 37.54 million
Import (%) 94.1 %
Average Retail Price (B$)Fragrant Rice (AAA) 1.25 /kgOrdinary Rice 0.85 /kgGlutinous Rice 0.76 /kg
Brunei Estimated Population 417,200 Persons
RICE INDUSTRY 2015

70
RICE INDUSTRY 2006 - 2015
2006 2007 2008 2009 2010 2011 2012 2013 2014 2015Local 895 983 911 891 1072 1,480 1,756 1,237 1,382 1,983Import 30,186 30,259 31,969 30,895 31,293 31,835 32,966 33,074 32,744 31,350
28,500
29,000
29,500
30,000
30,500
31,000
31,500
32,000
32,500
33,000
33,500
0
500
1,000
1,500
2,000
2,500
Met
ric T
onne
s
Met
ric T
onne
s
RICE INDUSTRY 2006 - 2015
Note : Import is saleable rice

71
DISTRICTHARVESTED
AREA(Ha)
NO. OF FARMERS
YEILD PADDY (Mt)
RICE 65% milling Recovery (Mt) %
BRUNEI MUARA 739.00 216 2,278.96 1,481.3 74.7
BELAIT 179.30 146 138.59 90.1 4.5
TUTONG 139.03 258 139.11 90.4 4.6
TEMBURONG 245.60 215 494.40 321.4 16.2
TOTAL 1,302.93 835 3,051.06 1,983.19 100.0
DISTRICT AREA(Ha)
NO. OF FARMERS
TOTAL PADDY SOLD (Kg)
VALUE (B$) @ $1.60/Kg
BRUNEI MUARA 682.00 390 2,139,695.00 3,423,512.00
BELAIT 179.10 162 102,345.50 163,752.80
TUTONG 138.53 258 24,143.00 38,628.80
TEMBURONG 261.20 258 184,470.00 295,152.00
TOTAL 1,260.83 1,068 2,450,653.50 3,921,045.60
LOCAL RICE PRODUCTION 2015
PADDY RICE SUPPORT SCHEME FOR 2014/2015 & 2015 SEASON
Note : 1). The number of farmers & acreage are using main season only except for Brunei Muara District have to select high cultivated area for two seasons.
2). Acreage is acreage that yielded only.
Note : Total both main season 2014/2015 & Off Season 2015
LOCAL RICE PRODUCTION 2015
PADDY RICE SUPPORT SCHEME FOR 2014/2015 & 2015 SEASON
DISTRICTHARVESTED
AREA(Ha)
NO. OF FARMERS
YEILD PADDY (Mt)
RICE 65% milling Recovery (Mt) %
BRUNEI MUARA 739.00 216 2,278.96 1,481.3 74.7
BELAIT 179.30 146 138.59 90.1 4.5
TUTONG 139.03 258 139.11 90.4 4.6
TEMBURONG 245.60 215 494.40 321.4 16.2
TOTAL 1,302.93 835 3,051.06 1,983.19 100.0
DISTRICT AREA(Ha)
NO. OF FARMERS
TOTAL PADDY SOLD (Kg)
VALUE (B$) @ $1.60/Kg
BRUNEI MUARA 682.00 390 2,139,695.00 3,423,512.00
BELAIT 179.10 162 102,345.50 163,752.80
TUTONG 138.53 258 24,143.00 38,628.80
TEMBURONG 261.20 258 184,470.00 295,152.00
TOTAL 1,260.83 1,068 2,450,653.50 3,921,045.60
LOCAL RICE PRODUCTION 2015
PADDY RICE SUPPORT SCHEME FOR 2014/2015 & 2015 SEASON
Note : 1). The number of farmers & acreage are using main season only except for Brunei Muara District have to select high cultivated area for two seasons.
2). Acreage is acreage that yielded only.
Note : Total both main season 2014/2015 & Off Season 2015

72
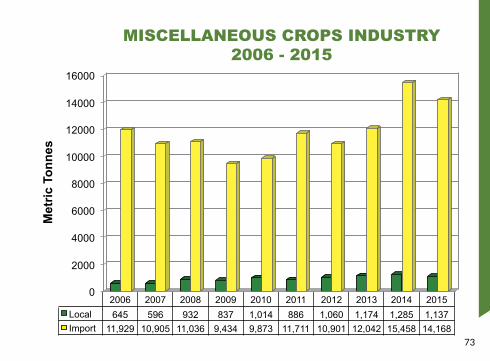
MISCELLANEOUS CROPS INDUSTRY 2015
Total Consumption 15,304.7 mtEst. Retail Value (B$) 26.05 millionPer Capita Consumption 36.7 kg/yr
Local Production 1,136.8 mtRetail Value (B$) 2.45 millionPercentage Self-Sufficiency 7.4 %
Brunei Estimated Population 417,200 Persons
Total Import 14,167.9 mtCIF Value (B$) 15.73 millionEst. Retail Value (B$) 23.60 millionPercentage Import 92.6 %
MISCELLANEOUS CROPS INDUSTRY 2015
73
MISCELLANEOUS CROPS INDUSTRY 2006 - 2015
MISCELLANEOUS CROPS INDUSTRY 2006 - 2015
16000
14000
12000
10000
8000
Met
ric T
onne
s
6000
4000
2000
2006LocalImport
64511,929 10,905 11,036 9,434 9,873 11,711 10,901 12,042 15,458 14,168
596 932 837 1,014 886 1,060 1,174 1,285 1,1372007 2008 2009 2010 2011 2012 2013 2014 2015
0

74
DISTRICT QUANTITY(Kg)
RETAIL VALUE (B$)
QUANTITY PERCENTAGE(%)
BRUNEI/MUARA 426,812.00 1,000,715.60 37.55
BELAIT 325,932.55 685,083.50 28.67
TUTONG 274,777.00 572,687.04 24.17
TEMBURONG 109,229.00 195,422.95 9.61
TOTAL 1,136,750.55 2,453,909.09 100.00
TYPES QUANTITY(Kg)
RETAIL VALUE (B$)
PRICE (B$ / Kg)
BeveragesSugar CaneArabica CoffeeRobusta Coffee
116,371250250
58,3923,0003,000
0.5012.0012.00
RootSweet PotatoTapiocaYamGround NutYam BeanCoco Bean
96,073168,79429,0611,36716916
270,249224,27869,3705,30049340
2.811.332.393.882.922.50
SpicesLemon GrassGalangalTurmeric Ginger
104,11658,95912,367
560
203,686147,60855,4462,201
1.962.504.483.93
Sweet Corn 482,785 1,214,026 2.51
Sago 24,655 54,557 2.21
LOCAL MISCELLANEOUS CROPS PRODUCTION 2015
LOCAL MISCELLANEOUS CROPS 2015 (BY TYPES)
LOCAL MISCELLANEOUS CROPS PRODUCTION 2015
LOCAL MISCELLANEOUS CROPS 2015 (BY TYPES)
DISTRICT QUANTITY(Kg)
RETAIL VALUE (B$)
QUANTITY PERCENTAGE(%)
BRUNEI/MUARA 426,812.00 1,000,715.60 37.55
BELAIT 325,932.55 685,083.50 28.67
TUTONG 274,777.00 572,687.04 24.17
TEMBURONG 109,229.00 195,422.95 9.61
TOTAL 1,136,750.55 2,453,909.09 100.00
TYPES QUANTITY(Kg)
RETAIL VALUE (B$)
PRICE (B$ / Kg)
BeveragesSugar CaneArabica CoffeeRobusta Coffee
116,371250250
58,3923,0003,000
0.5012.0012.00
RootSweet PotatoTapiocaYamGround NutYam BeanCoco Bean
96,073168,79429,0611,36716916
270,249224,27869,3705,30049340
2.811.332.393.882.922.50
SpicesLemon GrassGalangalTurmeric Ginger
104,11658,95912,367
560
203,686147,60855,4462,201
1.962.504.483.93
Sweet Corn 482,785 1,214,026 2.51
Sago 24,655 54,557 2.21
LOCAL MISCELLANEOUS CROPS PRODUCTION 2015
LOCAL MISCELLANEOUS CROPS 2015 (BY TYPES)

75
NO TYPE QUANTITY(Kg)
C.I.F VALUE (B$)
AVERAGEC.I.F PRICE
(B$/Kg)Cereals :
1 Maize Corn Whole 175,372 87,989 0.50
2 Sweet Corn 66,406 39,369 0.59
Root :
3 Potato 3,711,223 2,978,665 0.80
4 Ground Nut 315,749 635,993 2.01
5 Sweet Potato 259,551 351,018 1.35
6 Yam 198,943 327,876 1.65
7 Yam Bean 114,402 101,612 0.89
Spices :
8 Big Onion 4,552,283 3,922,831 0.86
9 Garlic 1,228,361 1,970,674 1.60
10 Onion 856,064 1,188,759 1.39
11 Ginger 901,532 1,172,476 1.30
12 Dried Pepper/Chili 218,395 686,891 3.15
13 White Pepper 17,711 160,645 9.07
14 Turmeric 77,075 130,796 1.70
TYPE OF IMPORT MISCELLANEOUS CROPS 2015 (BY QUANTITY)
TYPE OF IMPORT MISCELLANEOUSCROPS 2015 (BY QUANTITY)

76
NO TYPE QUANTITY(Kg)
C.I.F VALUE
(B$)
AVERAGEC.I.F PRICE
(B$/Kg)15 Black Pepper 6,469 91,001 14.07
16 Coriander seeds 28,329 90,345 3.19
17 Galangal 48,518 27,241 0.56
18 Lemon Grass 43,355 22,743 0.52
Bean/Dried :
19 Soybean 806,710 887,287 1.10
20 Mung Bean Seed 175,572 322,732 1.84
21 Ground Nut Kernel 161,967 311,547 1.92
22 Wheat 119,040 54,661 0.46
23 Black Bean 16,325 17,636 1.08
24 Black Eye Beans 7,500 13,599 1.81
25 Takamaria Seed 1,000 10,083 10.08
Other :
26 Tom Yam Set 7,986 49,446 6.19
27 Lime Leaf 19,111 32,380 1.69
TYPE OF IMPORT MISCELLANEOUS CROPS 2015 (BY QUANTITY)
TYPE OF IMPORT MISCELLANEOUSCROPS 2015 (BY QUANTITY)

77
ORNAMENTAL INDUSTRY 2015
Total Consumption 923,922 plantsEst. Retail Value (B$) 3.90 million
Local Production 687,360 plantsRetail Value (B$) 2.86 millionPercentage Production 74.4 %
Total Import 236,562 plantsCIF Value (B$) 0.65 millionEst. Retail Value (B$) 1.04 millionPercentage Import 25.6 %
Average Retail Price (B$) 0.95 – 10.80 /plantAverage CIF Price (B$) 0.38 – 47.97 /plant
ORNAMENTAL INDUSTRY 2015

78
ORNAMENTAL INDUSTRY 2006 - 2015
ORNAMENTAL INDUSTRY 2006 - 2015
700,000
600,000
500,000
400,000
Plan
ts
300,000
200,000
100,000
2006LocalImport
332,269303,835 324,680 291,082 214,504 122,599 138,765 177,223 271,352 336,194 236,562
406,501 430,331 338,899 372,482 363,166 427,922 530,138 595,258 687,3602007 2008 2009 2010 2011 2012 2013 2014 2015
0

79
DISTRICT QUANTITY(Plants)
RETAIL VALUE (B$)
QUANTITY PERCENTAGE
(%)
BRUNEI/MUARA 585,745 2,277,226.55 85.2
BELAIT 19,333 81,637.80 2.8
TUTONG 82,282 505,568.50 12.0
TOTAL 687,360 2,864,432.85 100.0
NO TYPES QUANTITY(Plants)
RETAIL VALUE(B$)
PRICE B$/PLANT
1 Ground Cover 256,983 244,497.28 0.95
2 Outdoor Shrubs 183,581 845,416.50 4.61
3 Indoor Shrubs 100,871 554,982.97 5.50
4 Palms 43,225 202,581.00 4.69
5 Trees 49,792 537,744.50 10.80
6 Orchid 48,146 448,084.10 9.31
7 Cactus 4,762 31,126.50 6.54
TOTAL 687,360 2,864,432.85 4.17
LOCAL ORNAMENTAL PLANTS 2015 (BY TYPES)
LOCAL ORNAMENTAL PLANTS PRODUCTION 2015LOCAL ORNAMENTAL PLANTS PRODUCTION 2015
LOCAL ORNAMENTAL PLANTS 2015 (BY TYPES)
DISTRICT QUANTITY(Plants)
RETAIL VALUE (B$)
QUANTITY PERCENTAGE
(%)
BRUNEI/MUARA 585,745 2,277,226.55 85.2
BELAIT 19,333 81,637.80 2.8
TUTONG 82,282 505,568.50 12.0
TOTAL 687,360 2,864,432.85 100.0
NO TYPES QUANTITY(Plants)
RETAIL VALUE(B$)
PRICE B$/PLANT
1 Ground Cover 256,983 244,497.28 0.95
2 Outdoor Shrubs 183,581 845,416.50 4.61
3 Indoor Shrubs 100,871 554,982.97 5.50
4 Palms 43,225 202,581.00 4.69
5 Trees 49,792 537,744.50 10.80
6 Orchid 48,146 448,084.10 9.31
7 Cactus 4,762 31,126.50 6.54
TOTAL 687,360 2,864,432.85 4.17
LOCAL ORNAMENTAL PLANTS 2015 (BY TYPES)
LOCAL ORNAMENTAL PLANTS PRODUCTION 2015

80
RANK TYPE QUANTITY(Plants)
C.I.F VALUE (B$)
AVERAGEC.I.F PRICE(B$/Plant)
1 Phalaenopsis 61,118 215,583.23 3.53
2 Dendrobium Hybrids 49,045 94,856.89 1.93
3 Rose 12,484 19,144.12 1.53
4 Mokara Plant 12,190 35,002.75 2.87
5 Bougainvillea 11,751 26,792.10 2.28
6 Orchid Plant 10,120 27,794.85 2.75
7 Anthurium Spp. 9,954 49,054.65 4.93
8 Hibiscus Spp. 7,983 8,704.13 1.09
9 Adenium Spp. 6,630 13,326.93 2.01
10 Dianthus Spp. 2,350 2,435.08 1.04
11 Impala Lily/Desert R 2,250 6,051.42 2.69
12 Vinca Spp. 2,220 2,601.80 1.17
13 Lantana Camara 2,010 1,185.90 0.59
14 Narcissus Spp. 1,524 7,565.73 4.96
15 Zinnia Spp. 1,450 3,713.75 2.56
15 MAJOR TYPE OF IMPORT ORNAMENTAL PLANTS2015 (BY QUANTITY)
15 MAJOR TYPE OF IMPORT ORNAMENTAL PLANTS2015 (BY QUANTITY)
81
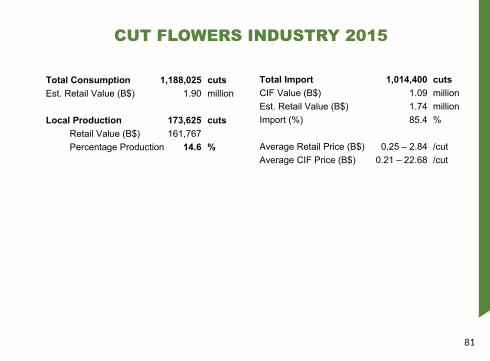
CUT FLOWERS INDUSTRY 2015
Total Consumption 1,188,025 cutsEst. Retail Value (B$) 1.90 million
Local Production 173,625 cutsRetail Value (B$) 161,767Percentage Production 14.6 %
Total Import 1,014,400 cutsCIF Value (B$) 1.09 millionEst. Retail Value (B$) 1.74 millionImport (%) 85.4 %
Average Retail Price (B$) 0.25 – 2.84 /cutAverage CIF Price (B$) 0.21 – 22.68 /cut
CUT FLOWERS INDUSTRY 2015

82
CUT FLOWERS INDUSTRY 2006 - 2015
CUT FLOWERS INDUSTRY 2006 - 2015
1,200
1,000
800
600
Thou
sand
Cut
s
400
200
2006Local
Import167
1,003 1,009 932 612 682 729 681 922 864 1,014230 262 145 139 278 184 210 187 174
2007 2008 2009 2010 2011 2012 2013 2014 20150

83
NO TYPES QUANTITY(Cuts)
RETAIL VALUE(B$)
QUANTITY PERCENTAGE
(%)
1 Orchid 132,060 132,060 76.1
2 Red Ginger 12,000 17,700 6.9
3 Goldern Red 19,840 4,960 11.4
4 Anthurium 2,870 3,122 1.7
5 Heliconia 855 2,425 0.5
6 Johor Fern 6,000 1,500 3.5
TOTAL 173,625 161,767 100.0
Note : 100% produced by Belait District
LOCAL CUT FLOWERS 2015 (BY TYPES)LOCAL CUT FLOWERS 2015 (BY TYPES)

84
RANK TYPE QUANTITY(Cuts)
C.I.F VALUE (B$)
AVERAGEC.I.F PRICE
(B$/Cut)
1 Chrysanthemum Spp. 357,746 255,422.67 0.71
2 Rose 166,770 236,806.29 1.42
3 Pom Pom 59,723 40,897.79 0.68
4 Carnation 59,593 50,912.50 0.85
5 Orchids Flowers 50,832 49,928.62 0.98
6 Eustoma 32,539 46,067.90 1.42
7 Lily 23,064 46,066.29 2.00
8 Mix Fillers 20,208 20,440.00 1.01
9 Achillea Filipenduli 18,500 12,053.03 0.65
10 Dendrobium Hybrids 18,244 18,176.76 1.00
11 Transvaal/African 18,120 10,996.14 0.61
12 Phoenix/Peacock 16,860 9,864.43 0.59
13 Gerbera Spp. 16,168 8,723.26 0.54
14 Johore Fern 14,354 5,714.88 0.40
15 Ping Pong 14,000 13,055.10 0.93
15 MAJOR TYPE OF IMPORT CUT FLOWERS2015 (BY QUANTITY)
15 MAJOR TYPE OF IMPORT CUT FLOWERS2015 (BY QUANTITY)


86
DISTRICT ENTERPRENEURS(Persons)
ESTIMATED LABOUR(Persons)
RETAIL VALUE(B$)
Brunei/Muara 262 3,252 $106,908,209
Tutong 47 126 $2,442,446
Belait 20 102 $767,294
Temburong 52 213 $363,081
TOTAL 381 3,693 $110,481,031
AGRIFOOD PRODUCTIONBY DISTRICT 2015
AGRIFOOD PRODUCTIONBY DISTRICT 2015

87
LOCAL AGRIFOOD INDUSTRY2006 - 2015
LOCAL AGRIFOOD INDUSTRY2006 - 2015
70
60
50
40
B$
Mill
ion
30
20
10
20069.51Livestock Processing
Crop Processing 20.59 30.34 44.68 44.15 44.42 46.96 49.52 42.03 58.81 65.219.88 7.85 9.06 9.33 10.25 13.31 44.20 43.87 45.272007 2008 2009 2010 2011 2012 2013 2014 2015
0

88
AGRIFOOD INDUSTRY BY CATEGORY 2015
Biscuits & Bakery$34.35 mil
31%
Soft Drink & Mineral Water$17.23 mil
16% Ice Cream$2.30 mil2%
Snack$1.91 mil2%
Traditional Foods$1.97 mil
2%
Fish Products$1.27 mil1%
Spices$1.01 mil1%
Sauces & Seasonings$0.88 mil 1%
Noodle$2.57 mil2%
Others$1.16 mil1%
Soybean Products$0.56 mil 0.5%
Meat Products$11.83 mil
11%
Fast Food$33.44mil
30%
AGRIFOOD INDUSTRY BY CATEGORY 2015
Note:1. Market Size : B$ 110.48 million2. Others – Pickles, Meals Ready To Eat, Fermentation, Confectionery, Health & Beauty Products, Sago.
Other: Pickles & Pickle, sago, Confectionery, fermentation, Meals Ready to Eat, Health & Beauty Products,


90
EXPORT TREND OF BEEF AND CHICKEN MEAT 2006 - 2015
-
5,000
10,000
15,000
20,000
25,000
30,000
35,000
40,000
45,000
2006 2007 2008 2009 2010 2011 2012 2013 2014 2015Process 18,995 44 2,296 4,679 11,349 5,511 2,900 6,638 17,610 5,809Part 40,002 4,430 10,016 44,970 3,100 16,200 11,875 20,800 45,000 3,000
Kilo
gram
EXPORT TREND OF BEEF AND CHICKEN MEAT
2006 - 2015
Note :For year 2015, total export is 8,809 kg.

91
EXPORT OF BEEF AND CHICKEN MEAT FOR YEAR 2015
PROCESS5,809 kg [66%]PDS Meat Industries (B) Sdn Bhd = 4,368 kg (75.2%)BMC Food Industries Sdn Bhd = 1,441 kg (24.8%)
PART3,000 kg [34%]PDS Abattoir (B) Sdn Bhd = 3,000 kg (100%)
EXPORT OF BEEF AND CHICKEN MEAT FOR YEAR 2015
Note :2015, only 3 company exporting their products [PDS Abattoir (B) Sdn Bhd , PDS Meat Industries (B)Sdn Bhd and BMC Food Industries Sdn Bhd) and exported to Sarawak, Malaysia.

92
EXPORT OF CATTLE HIDE 2015
PDS ABATTOIR (B) SDN BHD4,116 Pieces [66%]
MULAUT ABATTOIR SDN BHD2,098 Pieces [34%]
EXPORT OF CATTLE HIDE 2015
Note :For year 2015, total export is 6,214 pieces and export to Indonesia, Thailand & India.


94
TARGET & TRAJECTORYAGRICULTURE AND AGRIFOOD
TARGET & TRAJECTORYAGRICULTURE AND AGRIFOOD
SECTOR / YEAR 2014 2015 2016 2017 2018 2019 2020
1. Primary Crop 55.99 58.53 60.29 120.90 187.62 243.17 276.06
2. Primary Livestock 198.57 197.15 229.34 278.34 304.67 334.26 464.14
3. Agrifood Processing 102.68 110.48 127.32 169.48 218.44 275.31 340.77
TOTAL (B$ Million) 357.24 366.16 416.95 568.72 710.73 852.74 1,080.97
0
200
400
600
800
1,000
1,200
2014 2015 2016 2017 2018 2019 2020
B$
Mill
ion
Primary Crop Primary Livestock Agrifood Processing
Note : 1/. Main commodities only and data for year 2014 & 2015 is real achievements data2/. Growth rates per annum is 24%

NOTE

NOTE
For further inquiry please contact :
Agribusiness Statistics & StoresDepartment of Agriculture and Agrifood
Ministry of Primary Resources and TourismTel : +673 238 8095 / 8096 Fax : +673 238 2026
E-mail : [email protected] Website : www.agriculture.gov.bn