first pacific company limited · 3 financial highlights revenue 2015 revenue growth 2013 - 2014...
TRANSCRIPT
FINANCIAL STATEMENT ANALYSIS
First Pacific Company Limited
Year 2011 - 2015
Report developed on www.appforfinance.com

Table of contents
Financial Highlights ....................................... 3
Key financials .................................................................................... 4
Key balance sheet data ..................................................................... 6
Ratios ................................................................................................ 9
Reclassified Financial Statement .............. 111
Structure of Assets & Liabilities .................................................... 111
Structure of Assets & Liabilities .................................................... 122
Overview of Financial Results ....................................................... 144
Overview of Financial Results ....................................................... 155
Main Economic Data ............... Errore. Il segnalibro non è definito.7
Income Statement ratios ........................... 19
Profitability Ratios ................................... 233
Liquidity analysis ....................................... 28
Capital Structure Ratios ........................... 311
Solvency analysis ..................................... 366
Rating analysis ......................................... 411
Altman's model ............................................................................. 411
Taffler's model .............................................................................. 444
Springate's model ......................................................................... 455
Performance evaluation 2015 .................. 466
Profitability ................................................................................... 466
Capital Structure ........................................................................... 477
Solvency .......................................................................................... 48
Liquidity........................................................................................... 49
Methodological Notes ............................. 511
Ratios ............................................................................................ 511
Abbreviations ................................................................................ 533

3
Financial Highlights
Revenue 2015 Revenue Growth 2013 - 2014 Revenue Growth 2014 - 2015 Debt change 2014 - 2015
$ 6,437M +10.2% -5.9% +9.6%
Gross Profit 2015 EBIT 2015 EBITDA 2015 Net Profit 2015
$ 1,822M $ 673M $ 1,009M $ 438M
Economic margins
Revenue
Financial Debt
Debt to Equity ratio
Gross Profit/Sales EBIT/Sales
Net Profit/Sales
0
2.000
4.000
6.000
8.000
2011 2012 2013 2014 2015
Revenue [million $]0
1.000
2.000
3.000
4.000
5.000
6.000
7.000
2011 2012 2013 2014 2015
Debt [million $]
0,00
0,50
1,00
1,50
2,00
2,50
2011 2012 2013 2014 2015
D/E

4
Key financials in millions of US Dollars 2011 2012 2013 2014 2015
Revenue 5,684 5,991 6,206 6,841 6,437
yoy % n.a. +5.4% +3.6% +10.2% -5.9%
EBITDA 1,445 1,261 1,023 965 1,009
EBITDA margin 25.4% 21.0% 16.5% 14.1% 15.7%
EBIT 1,229 1,022 740 646 673
EBIT margin 21.6% 17.1% 11.9% 9.4% 10.5%
Net Profit (Loss) 1,135 834 621 521 438
Debt 3,695 4,366 5,618 5,806 6,362
yoy % n.a. +18.2% +28.7% +3.3% +9.6%
D/(D+E) 0.55 0.57 0.62 0.63 0.67
D/EBITDA 2.56 3.46 5.49 6.02 6.31
Operating Cash-flow 16 25 17 19 15
Revenue
In 2015 total revenue was $ 6,437 million, -5.9% compared to the $ 6,841 million generated in 2014.
Cost of Sales
Cost of Sales amounted to $ 4,615 million, decreasing of 6.3% compared to 2014.
Gross Profit
Gross Profit totalled $ 1,822 million, a decrease of $ 95 million, or 5.0%, compared to 2014 ($ 1,917 million). As a percentage of revenue Gross Profit grew from 28.0% in 2014 to 28.3% in 2015.
EBITDA
EBITDA totalled $ 1,009 million, which was 4.6% higher than the $ 965 million reported in 2014. The EBITDA margin was 15.7%, which showed an improvement from the 14.1% of 2014. Overall,
operating costs as a percentage of revenue dropped from 15.7% to 15.6%.

5
EBIT
EBIT was a profit of $ 673 million, an improvement compared to the $ 646 million profit in 2014. The EBIT margin was 10.5%, which showed an improvement from the 9.4% of 2014.
Net Profit (Loss)
Ultimately, fiscal year 2015 ended up in a net profit of $ 438 million, a 15.9% decrease compared to the $ 521 million profit reported in 2014. As a percentage of revenue, Net Profit dropped from
7.6% in 2014 to 6.8% in 2015.
0
1.000
2.000
3.000
4.000
5.000
6.000
7.000
8.000
2011 2012 2013 2014 2015
Revenue EBITDA EBIT Debt

6
Key balance sheet data in millions of US Dollars 2011 2012 2013 2014 2015
Total Assets 12,611 13,886 15,583 16,642 17,591 Total Non-current Assets 9,315 10,203 11,605 11,903 13,351 Total Current Assets 3,296 3,683 3,978 4,739 4,240 Equity & Liabilities 12,611 13,886 15,583 16,642 17,591 Total Equity 6,879 7,250 7,518 7,716 7,629 Total Non-current Liabilities 3,629 4,566 5,734 6,112 6,895 Long-term Debt 2,576 3,439 4,551 4,894 5,363
Total Current Liabilities 2,103 2,070 2,331 2,814 3,067 Short-term Debt 1,119 927 1,067 912 999
Total Non-current Assets
Non-current Assets rose by $ 1,448 million at the end of fiscal year 2015 compared to 2014, amounting to a total of $ 13,351 million and reporting a 12.2% increase over the period.
Total Current Assets
In 2014 Current Assets amounted to $ 4,240 million, decreasing by 10.5% compared to 2015, when totalled $ 4,739 million. Average days receivables in 2015 amounted to 43, as the company
collected $ 6,437 million in revenues and had trade receivables of $ 767 million at the end of the year. Such a performance was roughly unchanged compared to the previous year, when the company
cashed in its invoices after an average of 35 days.
Net Working Capital
Net Working Capital in 2015 was $ 1,173 million and reported a 39.1% decrease compared to 2014, when amounted to $ 1,925 million. Average days payables in 2015 amounted to 148, as the
company incurred costs for supplies amounting to $ 5,764 million and had trade payables of $ 2,369 million at the end of the year. Such a performance was better than in the previous year, when
the company paid for its purchases after an average of 119 days.
Cash and Cash Equivalents
At the end of fiscal year 2015 the company reported net liquidity of $ 1,612 million. Cash and cash equivalents fell by 28.9% compared to 2014.
Equity
Equity in 2015 was $ 7,629 million and reported a 1.1% decrease compared to 2014, when it amounted to $ 7,716 million.
Financial Debt
In 2015 the company reported $ 6,362 million of financial liabilities, consisting of $ 5,363 million in long-term obligations and $ 999 million in current ones, while in 2014 Total Debt was $ 5,806
million (all of it in short-term liabilities). Ultimately, Total Financial Liabilities rose by 9.6% in 2015 compared with the previous year.

7
Financial Debt & solvency
Debt to Equity ratio in 2015 was 2.02, resulting from Debt of $ 6,362 million and Equity of $ 3,149 million. The debt capital borrowed by the company is much higher than Equity capital invested by shareholders. Such a Debt to Equity ratio level is deemed to be unsatisfactory. A strategy should be implemented to reduce this ratio, to prevent debt service issues. D/E ratio was roughly unchanged (0.33 absolute variation) compared with the previous year, when it was 1.69. Such a stable D/E ratio resulted despite a significant growth in Debt and a decline in Equity. Specifically, Debt increased from $ 5,806 million in 2014 to $ 6,362 million in 2015 (9.6% variation), while Equity dropped from $ 3,428 million to $ 3,149 million (-8.1% variation). In 2013 the ratio was 1.60. The Net Debt to Equity ratio in 2015 was 1.51, resulting from Net Debt of $ 4,750 million and Equity of $ 3,149 million. Such a level of the ratio is deemed to be very unsatisfactory. Net Debt/Equity was roughly unchanged (0.48 absolute variation) compared with the previous year, when it was 1.03. Such a stable Net Debt/Equity resulted despite a substantial growth in Net Debt and a decline in Equity. Specifically, Net Debt increased from $ 3,540 million in 2014 to $ 4,750 million in 2015 (34.2% variation), while Equity dropped from $ 3,428 million to $ 3,149 million (-8.1% variation). In 2013 the ratio was 0.92. EBIT to Interest coverage ratio in 2015 was 1.79, given by an EBIT of $ 673 million and finance charges of $ 375 million. Such a level of the ratio is deemed to be unsatisfactory. The income from operating activities is sufficient to service the debt, but a careful monitoring of the situation is however recommended. EBIT on Interest Expense was roughly unchanged (-0.01 absolute variation) compared with the previous year, when it was 1.81. Such a stable ratio resulted from EBIT staying roughly constant, while interest expense grew significantly. Specifically, EBIT changed from $ 646 million in 2014 to $ 673 million in 2015 (4.2% variation), while interest expense increased from $ 357 million to $ 375 million (5.0% variation). In 2013 the ratio was 2.43.
0
2.000
4.000
6.000
8.000
10.000
12.000
14.000
16.000
18.000
20.000
2015 2014 2013 2012 2011
Total Assets Total Liabilities Equity Financial Debt

8
Profitability analysis
Return on Equity in 2015 was 13.9%, given by Net Profit of $ 438 million and book value of Equity of $ 3,149 million. Such a ROE level is deemed to be less than satisfactory. ROE was roughly unchanged (-1.3% absolute variation) compared with the previous year, when it was 15.2%. Such a stable ROE resulted despite a significant decline both in Profit and Equity. Specifically, Profit decreased from $ 521 million in 2014 to $ 438 million in 2015 (-15.9% variation), while the book value of Equity changed from $ 3,428 million to $ 3,149 million (-8.1% variation). In 2013 the ratio was 17.7%. Return on Assets in 2015 was 2.5%, given by Net Profit of $ 438 million and Total Assets of $ 17,591 million. Such a ROA level is deemed to be less than satisfactory. ROA was roughly unchanged (-0.6% absolute variation) compared with the previous year, when it was 3.1%. Such a stable ROA resulted despite a significant decline in Net Profit and a growth in Assets. Specifically, Net Profit dropped from $ 521 million in 2014 to $ 438 million in 2015 (-15.9% variation), while Total Assets increased from $ 16,642 million to $ 17,591 million (5.7% variation). In 2013 the ratio was 4.0%.
0,0%
5,0%
10,0%
15,0%
20,0%
25,0%
30,0%
35,0%
40,0%
2011 2012 2013 2014 2015
ROE ROA

9
Ratios Profitability Ratios 2011 2012 2013 2014 2015
ROE (Return on Equity) 37.6% 25.7% 17.7% 15.2% 13.9%
ROCE (Return on Capital Employed) 9.7% 7.4% 4.7% 3.9% 3.8%
ROA (Return on Assets) 9.0% 6.0% 4.0% 3.1% 2.5%
Retained Earnings to Total Assets ratio 10.2% 10.7% 10.1% 9.3% 8.6%
Liquidity Ratios 2011 2012 2013 2014 2015
Current ratio 1.57 1.78 1.71 1.68 1.38
Quick ratio 1.19 1.36 1.36 1.06 0.79
Cash ratio 0.89 1.05 1.02 0.81 0.53
Days Payables 107.3 120.5 118.4 118.7 148.0
Days Receivables 38.9 47.5 44.8 35.4 42.9
Capital Structure Ratios 2011 2012 2013 2014 2015
Debt to Equity ratio 1.22 1.35 1.60 1.69 2.02
Net Debt to Equity ratio 0.60 0.68 0.92 1.03 1.51
Total Liabilities to Assets ratio 0.45 0.48 0.52 0.54 0.57
Total Liabilities to Equity ratio 1.90 2.05 2.30 2.60 3.16
Equity to Assets ratio 0.24 0.23 0.23 0.21 0.18
Fixed Assets coverage ratio 0.71 0.77 0.80 0.80 0.75
Working Capital to Assets ratio 9.5% 11.6% 10.6% 11.6% 6.7%
Leverage ratio 4.17 4.29 4.44 4.85 5.59
Equity market value to Liabilities ratio 0.53 0.49 0.44 0.38 0.32

10
Solvency Ratios 2011 2012 2013 2014 2015 Debt to EBITDA ratio 2.56 3.46 5.49 6.02 6.31
Debt to Operating Cash-flow ratio 230.94 174.64 330.47 305.58 424.13
Net Debt to EBITDA ratio 1.26 1.74 3.17 3.67 4.71
EBIT to Interest coverage ratio 6.57 3.73 2.43 1.81 1.79
EBITDA to Interest coverage ratio 7.73 4.60 3.37 2.70 2.69
Operating Cash-flow to Interest coverage ratio 0.09 0.09 0.06 0.05 0.04
Operating Cash-flow to Short-term Debt 0.01 0.03 0.02 0.02 0.02
Operating Cash-flow to Long-term Debt 0.01 0.01 0.00 0.00 0.00
Margins 2011 2012 2013 2014 2015 Sales growth n.a. +5.4% +3.6% +10.2% -5.9%
Gross Profit margin 31.2% 31.1% 29.5% 28.0% 28.3%
Gross Profit growth n.a. +5.0% -1.8% +4.8% -5.0%
EBITDA margin 25.4% 21.0% 16.5% 14.1% 15.7%
EBITDA growth n.a. -12.7% -18.9% -5.7% +4.6% EBIT margin 21.6% 17.1% 11.9% 9.4% 10.5%
EBIT growth n.a. -16.8% -27.6% -12.7% +4.2%
Profit Before Tax margin 18.3% 13.7% 8.2% 5.5% 5.8%
Profit Before Tax growth n.a. -21.3% -27.3% -15.1% -7.8%
Net Profit margin 20.0% 13.9% 10.0% 7.6% 6.8%
Net Profit growth n.a. -26.5% -25.5% -16.1% -15.9%
Operating Cash-flow margin 0.3% 0.4% 0.3% 0.3% 0.2%
Operating Cash-flow growth n.a. +56.3% -32.0% +11.8% -21.1%
Asset turnover 45.1% 43.1% 39.8% 41.1% 36.6%
Revenue per Employee $ 77k $ 74k $ 68k $ 70k $ 67k

11
Reclassified Financial Statement
Structure of Assets & Liabilities 2015 2014 2013 2012 2011
in millions of US Dollars $ $ $ $ $
TOTAL ASSETS 17,591 16,642 15,583 13,886 12,611
1. Non-current Assets 13,351 11,903 11,605 10,203 9,315
2. Current Assets 4,240 4,739 3,978 3,683 3,296
Inventories 631 717 696 817 732
Trade and other Current Receivables 758 661 754 600 582
Other Current Assets 1,239 1,095 153 91 107
Cash and Cash Equivalents 1,612 2,266 2,375 2,175 1,875
EQUITY & LIABILITIES 17,591 16,642 15,583 13,886 12,611
1. Total Equity 7,629 7,716 7,518 7,250 6,879
2. Non-current Liabilities 6,895 6,112 5,734 4,566 3,629
Long-term Debt 5,363 4,894 4,551 3,439 2,576
Trade Payables 1,129 850 816 691 607
Other Liabilities 403 368 367 436 446
3. Current Liabilities 3,067 2,814 2,331 2,070 2,103
Short-term Debt 999 912 1,067 927 1,119
Trade Payables 1,240 1,192 981 984 797
Other Liabilities 828 710 283 159 187

12
Structure of Assets & Liabilities 2015 2014 2013
in millions of US Dollars $ % total yoy % '14-'15 $ % total yoy % '13-'14 $ % total yoy % '12-'13
TOTAL ASSETS 17,591 100.0% +5.7% 16,642 100.0% +6.8% 15,583 100.0% +12.2%
1. Non-current Assets 13,351 75.9% +12.2% 11,903 71.5% +2.6% 11,605 74.5% +13.7%
2. Current Assets 4,240 24.1% -10.5% 4,739 28.5% +19.1% 3,978 25.5% +8.0%
Inventories 631 3.6% -12.0% 717 4.3% +3.0% 696 4.5% -14.8%
Trade and other Current Receivables 758 4.3% +14.7% 661 4.0% -12.3% 754 4.8% +25.7%
Other Current Assets 1,239 7.0% +13.2% 1,095 6.6% +615.7% 153 1.0% +68.1%
Cash and Cash Equivalents 1,612 9.2% -28.9% 2,266 13.6% -4.6% 2,375 15.2% +9.2%
EQUITY & LIABILITIES 17,591 100.0% +5.7% 16,642 100.0% +6.8% 15,583 100.0% +12.2%
1. Total Equity 7,629 43.4% -1.1% 7,716 46.4% +2.6% 7,518 48.2% +3.7%
2. Non-current Liabilities 6,895 39.2% +12.8% 6,112 36.7% +6.6% 5,734 36.8% +25.6%
Long-term Debt 5,363 30.5% +9.6% 4,894 29.4% +7.5% 4,551 29.2% +32.3%
Trade Payables 1,129 6.4% +32.8% 850 5.1% +4.2% 816 5.2% +18.1%
Other Liabilities 403 2.3% +9.5% 368 2.2% +0.3% 367 2.4% -15.8%
3. Current Liabilities 3,067 17.4% +9.0% 2,814 16.9% +20.7% 2,331 15.0% +12.6%
Short-term Debt 999 5.7% +9.5% 912 5.5% -14.5% 1,067 6.8% +15.1%
Trade Payables 1,240 7.0% +4.0% 1,192 7.2% +21.5% 981 6.3% -0.3%
Other Liabilities 828 4.7% +16.6% 710 4.3% +150.9% 283 1.8% +78.0%

13
2012 2011
in millions of US Dollars $ % total yoy % '11-'12 $ % total yoy % '10-'11
TOTAL ASSETS 13,886 100.0% +10.1% 12,611 100.0% n.a.
1. Non-current Assets 10,203 73.5% +9.5% 9,315 73.9% n.a.
2. Current Assets 3,683 26.5% +11.7% 3,296 26.1% n.a.
Inventories 817 5.9% +11.6% 732 5.8% n.a.
Trade and other Current Receivables 600 4.3% +3.1% 582 4.6% n.a.
Other Current Assets 91 0.7% -15.0% 107 0.8% n.a.
Cash and Cash Equivalents 2,175 15.7% +16.0% 1,875 14.9% n.a.
EQUITY & LIABILITIES 13,886 100.0% +10.1% 12,611 100.0% n.a.
1. Total Equity 7,250 52.2% +5.4% 6,879 54.5% n.a.
2. Non-current Liabilities 4,566 32.9% +25.8% 3,629 28.8% n.a.
Long-term Debt 3,439 24.8% +33.5% 2,576 20.4% n.a.
Trade Payables 691 5.0% +13.8% 607 4.8% n.a.
Other Liabilities 436 3.1% -2.2% 446 3.5% n.a.
3. Current Liabilities 2,070 14.9% -1.6% 2,103 16.7% n.a.
Short-term Debt 927 6.7% -17.2% 1,119 8.9% n.a.
Trade Payables 984 7.1% +23.5% 797 6.3% n.a.
Other Liabilities 159 1.1% -15.0% 187 1.5% n.a.

14
Overview of Financial Results 2015 2014 2013 2012 2011
in millions of US Dollars $ $ $ $ $
1. Revenue (Sales) 6,437 6,841 6,206 5,991 5,684
2. Cost of Sales (4,615) (4,924) (4,377) (4,129) (3,910)
3. Gross Profit (1-2) 1,822 1,917 1,829 1,862 1,774
4. Operating Costs (1,007) (1,075) (990) (876) (801)
5. Other Income and (Expense) (142) (196) (99) 36 256
6. Other Gains (Losses) 0 0 0 0 0
7. EBIT (3 -4 +/-5 +/-6) 673 646 740 1,022 1,229
7.a EBITDA (Ebit + Depreciation and Amortization) 1,009 965 1,023 1,261 1,445
8. Share of Profit (Loss) of Associates and Joint Ventures 230 279 268 241 310
9. Interest Income 78 89 70 75 0
10. Interest Expense (375) (357) (304) (274) (187)
11. Other Financial Income (Expense) 0 0 0 0 0
12. Other Non-Operating Income (Expense) 0 0 0 0 0
13. Profit (Loss) before Tax (7 +/- 8 +9 -10 +/- 11 +/- 12) 606 657 774 1,064 1,352
14. Income tax expense (194) (199) (153) (230) (217)
15. Profit (Loss) from continuing operations (13 -14) 412 458 621 834 1,135
16. Profit (Loss) from discontinued operations 26 63 0 0 0
17. Profit (loss) (15 + 16) 438 521 621 834 1,135
18. Profit (loss) attributable to non-controlling interests 0 0 0 0 0
19. Profit (loss) attributable to the owners of the parent (17 - 18) 438 521 621 834 1,135
20. Other comprehensive income (loss) (564) (196) (1,043) (117) (35)
21. Comprehensive Income (17+20) (126) 325 (422) 717 1,100

15
Overview of Financial Results 2015 2014 2013 in millions of US Dollars $ % revenue yoy % '14-'15 $ % revenue yoy % '13-'14 $ % revenue yoy % '12-'13
1. Revenue (Sales) 6,437 100.0% -5.9% 6,841 100.0% +10.2% 6,206 100.0% +3.6%
2. Cost of Sales (4,615) 71.7% -6.3% (4,924) 72.0% +12.5% (4,377) 70.5% +6.0%
3. Gross Profit (1-2) 1,822 28.3% -5.0% 1,917 28.0% +4.8% 1,829 29.5% -1.8%
4. Operating Costs (1,007) 15.6% -6.3% (1,075) 15.7% +8.6% (990) 16.0% +13.0%
5. Other Income and (Expense) (142) 2.2% +27.6% (196) 2.9% -98.0% (99) 1.6% -375.0%
6. Other Gains (Losses) 0 0.0% 0.0% 0 0.0% 0.0% 0 0.0% 0.0%
7. EBIT (3 -4 +/-5 +/-6) 673 10.5% +4.2% 646 9.4% -12.7% 740 11.9% -27.6%
7.a EBITDA (Ebit + Depreciation and Amortization) 1,009 15.7% +4.6% 965 14.1% -5.7% 1,023 16.5% -18.9%
8. Share of Profit (Loss) of Associates and Joint Ventures 230 3.6% -17.6% 279 4.1% +4.1% 268 4.3% +11.2%
9. Interest Income 78 1.2% -12.4% 89 1.3% +27.1% 70 1.1% -6.7%
10. Interest Expense (375) 5.8% +5.0% (357) 5.2% +17.4% (304) 4.9% +10.9%
11. Other Financial Income (Expense) 0 0.0% 0.0% 0 0.0% 0.0% 0 0.0% 0.0%
12. Other Non-Operating Income (Expense) 0 0.0% 0.0% 0 0.0% 0.0% 0 0.0% 0.0%
13. Profit (Loss) before Tax (7 +/- 8 +9 -10 +/- 11 +/- 12) 606 9.4% -7.8% 657 9.6% -15.1% 774 12.5% -27.3%
14. Income tax expense (194) 3.0% -2.5% (199) 2.9% +30.1% (153) 2.5% -33.5%
15. Profit (Loss) from continuing operations (13 -14) 412 6.4% -10.0% 458 6.7% -26.2% 621 10.0% -25.5%
16. Profit (Loss) from discontinued operations 26 0.4% -58.7% 63 0.9% +100.0% 0 0.0% 0.0%
17. Profit (loss) (15 + 16) 438 6.8% -15.9% 521 7.6% -16.1% 621 10.0% -25.5%
18. Profit (loss) attributable to non-controlling interests 0 0.0% 0.0% 0 0.0% 0.0% 0 0.0% 0.0%
19. Profit (loss) attributable to the owners of the parent (17 - 18)
438 6.8% -15.9% 521 7.6% -16.1% 621 10.0% -25.5%
20. Other comprehensive income (loss) (564) 8.8% -187.8% (196) 2.9% +81.2% (1,043) 16.8% -791.5%
21. Comprehensive Income (17+20) (126) 2.0% -138.8% 325 4.8% +177.0% (422) 6.8% -158.9%

16
2012 2011
in millions of US Dollars $ % revenue yoy % '11-'12 $ % revenue yoy % '10-'11
1. Revenue (Sales) 5,991 100.0% +5.4% 5,684 100.0% n.a.
2. Cost of Sales (4,129) 68.9% +5.6% (3,910) 68.8% n.a.
3. Gross Profit (1-2) 1,862 31.1% +5.0% 1,774 31.2% n.a.
4. Operating Costs (876) 14.6% +9.4% (801) 14.1% n.a.
5. Other Income and (Expense) 36 0.6% -85.9% 256 4.5% n.a.
6. Other Gains (Losses) 0 0.0% 0.0% 0 0.0% n.a.
7. EBIT (3 -4 +/-5 +/-6) 1,022 17.1% -16.8% 1,229 21.6% n.a.
7.a EBITDA (Ebit + Depreciation and Amortization) 1,261 21.0% -12.7% 1,445 25.4% n.a.
8. Share of Profit (Loss) of Associates and Joint Ventures 241 4.0% -22.3% 310 5.5% n.a.
9. Interest Income 75 1.3% +100.0% 0 0.0% n.a.
10. Interest Expense (274) 4.6% +46.5% (187) 3.3% n.a.
11. Other Financial Income (Expense) 0 0.0% 0.0% 0 0.0% n.a.
12. Other Non-Operating Income (Expense) 0 0.0% 0.0% 0 0.0% n.a.
13. Profit (Loss) before Tax (7 +/- 8 +9 -10 +/- 11 +/- 12) 1,064 17.8% -21.3% 1,352 23.8% n.a.
14. Income tax expense (230) 3.8% +6.0% (217) 3.8% n.a.
15. Profit (Loss) from continuing operations (13 -14) 834 13.9% -26.5% 1,135 20.0% n.a.
16. Profit (Loss) from discontinued operations 0 0.0% 0.0% 0 0.0% n.a.
17. Profit (loss) (15 + 16) 834 13.9% -26.5% 1,135 20.0% n.a.
18. Profit (loss) attributable to non-controlling interests 0 0.0% 0.0% 0 0.0% n.a.
19. Profit (loss) attributable to the owners of the parent (17 - 18) 834 13.9% -26.5% 1,135 20.0% n.a.
20. Other comprehensive income (loss) (117) 2.0% -234.3% (35) 0.6% n.a.
21. Comprehensive Income (17+20) 717 12.0% -34.8% 1,100 19.4% n.a.
17
Main Economic Data
2015 2014 2013 2012 2011
in millions of US Dollars $ yoy % $ yoy % $ yoy % $ yoy % $ yoy %
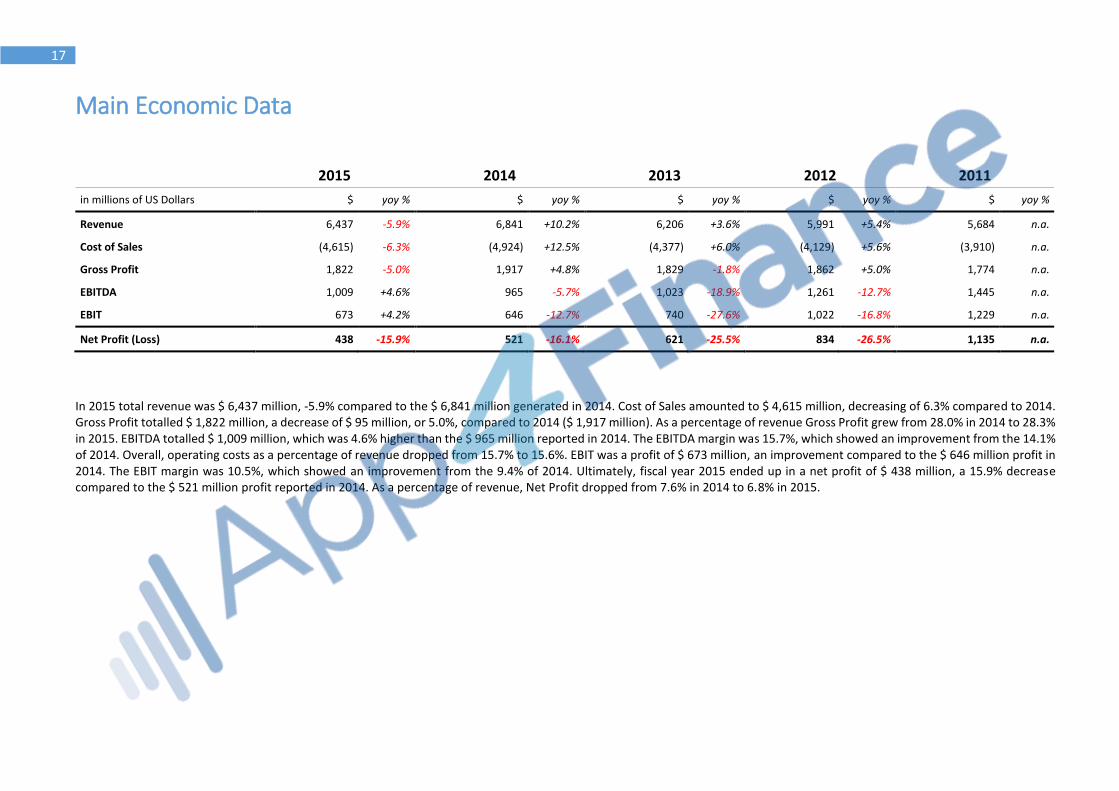
Revenue 6,437 -5.9% 6,841 +10.2% 6,206 +3.6% 5,991 +5.4% 5,684 n.a.
Cost of Sales (4,615) -6.3% (4,924) +12.5% (4,377) +6.0% (4,129) +5.6% (3,910) n.a.
Gross Profit 1,822 -5.0% 1,917 +4.8% 1,829 -1.8% 1,862 +5.0% 1,774 n.a.
EBITDA 1,009 +4.6% 965 -5.7% 1,023 -18.9% 1,261 -12.7% 1,445 n.a.
EBIT 673 +4.2% 646 -12.7% 740 -27.6% 1,022 -16.8% 1,229 n.a.
Net Profit (Loss) 438 -15.9% 521 -16.1% 621 -25.5% 834 -26.5% 1,135 n.a.
In 2015 total revenue was $ 6,437 million, -5.9% compared to the $ 6,841 million generated in 2014. Cost of Sales amounted to $ 4,615 million, decreasing of 6.3% compared to 2014. Gross Profit totalled $ 1,822 million, a decrease of $ 95 million, or 5.0%, compared to 2014 ($ 1,917 million). As a percentage of revenue Gross Profit grew from 28.0% in 2014 to 28.3% in 2015. EBITDA totalled $ 1,009 million, which was 4.6% higher than the $ 965 million reported in 2014. The EBITDA margin was 15.7%, which showed an improvement from the 14.1% of 2014. Overall, operating costs as a percentage of revenue dropped from 15.7% to 15.6%. EBIT was a profit of $ 673 million, an improvement compared to the $ 646 million profit in 2014. The EBIT margin was 10.5%, which showed an improvement from the 9.4% of 2014. Ultimately, fiscal year 2015 ended up in a net profit of $ 438 million, a 15.9% decrease compared to the $ 521 million profit reported in 2014. As a percentage of revenue, Net Profit dropped from 7.6% in 2014 to 6.8% in 2015.

18
0
1.000
2.000
3.000
4.000
5.000
6.000
7.000
8.000
2015 2014 2013 2012 2011
Revenue
Gross Profit
EBIT
Net Profit(Loss)

19
Income Statement ratios
Gross Profit margin 2011 2012 2013 2014 2015
Gross Profit/Sales 31.2% 31.1% 29.5% 28.0% 28.3%
Gross Profit margin measures the firm's capacity to generate profit through sales.
Range Significance
Ratio > 20% Satisfactory performance
10% < Ratio < 20% Average performance
Ratio < 10% Unsatisfactory performance
Gross Profit margin in 2015 was 28.3%, resulting from a Gross Profit of $ 1,822 million and Sales of $ 6,437 million. The ratio remained virtually unchanged compared with the previous year, when it was 28.0% (an absolute variation of 0.3%).
26,0%
27,0%
28,0%
29,0%
30,0%
31,0%
32,0%
2011 2012 2013 2014 2015
Gross Profit margin

20
EBITDA margin 2011 2012 2013 2014 2015
EBITDA/Sales 25.4% 21.0% 16.5% 14.1% 15.7%
EBITDA margin measures overall profitability after taking into account all operating costs: variable costs and fixed costs.
Range Significance
Ratio > 15% Satisfactory performance
8% < Ratio < 15% Average performance
Ratio < 8% Unsatisfactory performance
EBITDA margin in 2015 was 15.7%, resulting from an operating profit (EBITDA) of $ 1,009 million and Sales of $ 6,437 million. The ratio remained virtually unchanged compared with the previous year, when it was 14.1% (an absolute variation of 1.6%).
Profit Before Tax margin 2011 2012 2013 2014 2015
Profit Before Tax/Sales 18.3% 13.7% 8.2% 5.5% 5.8%
Profit Before Tax margin measures how much revenue is converted into profits, before tax is deducted.
Range Significance
Ratio > 10% Satisfactory performance
5% < Ratio < 10% Average performance
Ratio < 5% Unsatisfactory performance
Profit Before Tax margin in 2015 was 5.8%, resulting from a Profit Before Tax of $ 606 million and Sales of $ 6,437 million. The ratio remained virtually unchanged compared with the previous year, when it was 5.5% (an absolute variation of 0.3%).
0,0%
5,0%
10,0%
15,0%
20,0%
25,0%
30,0%
2011 2012 2013 2014 2015
EBITDA margin
0,0%2,0%4,0%6,0%8,0%
10,0%12,0%14,0%16,0%18,0%20,0%
2011 2012 2013 2014 2015
Profit Before Tax margin

21
Net Profit margin 2011 2012 2013 2014 2015
Net Profit/Sales 20.0% 13.9% 10.0% 7.6% 6.8%
Net Profit margin is the percentage of revenue remaining after all expenses (operating, financial and tax) have been deducted from the company's total revenue. Therefore, the net profit margin measures the ability of the company to convert revenue into profits available for shareholders.
Range Significance
Ratio > 8% Satisfactory performance
5% < Ratio < 8% Average performance
Ratio < 5% Unsatisfactory performance
Net Profit margin in 2015 was 6.8%, resulting from a Net Profit of $ 438 million and Sales of $ 6,437 million. The ratio remained virtually unchanged compared with the previous year, when it was 7.6% (an absolute variation of -0.8%).
Operating Cash-flow margin 2011 2012 2013 2014 2015
Operating Cash-flow/Sales 0.3% 0.4% 0.3% 0.3% 0.2%
Operating Cash-flow margin measures how much cash is generated from operating activities per unit of revenue.
Range Significance
Ratio > 10% Satisfactory performance
5% < Ratio < 10% Average performance
Ratio < 5% Unsatisfactory performance
Operating Cash-flow margin in 2015 was 0.2%, given by cash-flow from operating activities of $ 15 million and Sales of $ 6,437 million. The ratio remained virtually unchanged compared with the previous year, when it was 0.3% (an absolute variation of 0.0%).
0,0%
5,0%
10,0%
15,0%
20,0%
25,0%
2011 2012 2013 2014 2015
Net Profit margin
0,0%
0,1%
0,1%
0,2%
0,2%
0,3%
0,3%
0,4%
0,4%
0,5%
2011 2012 2013 2014 2015
Operating Cash-flow margin

22
Revenue per Employee 2011 2012 2013 2014 2015
Sales/Number of employees $ 77k $ 74k $ 68k $ 70k $ 67k
Revenue per employee ratio is an efficiency metric showing how much revenue is collected per single employee. A higher ratio indicates higher productivity.
6062646668707274767880
2011 2012 2013 2014 2015
Revenue per Employee [thousand $]

23
Profitability Ratios
ROE 2011 2012 2013 2014 2015
Net Profit/Equity 37.6% 25.7% 17.7% 15.2% 13.9%
Return on Equity measures the overall profitability of the Equity capital invested in the company and provides a benchmark to evaluate alternative investments.
Range Significance
ROE > 15% Satisfactory performance
8% < ROE < 15% Average performance
ROE < 8% Unsatisfactory performance
Return on Equity in 2015 was 13.9%, given by Net Profit of $ 438 million and book value of Equity of $ 3,149 million. Such a ROE level is deemed to be less than satisfactory. ROE was roughly unchanged (-1.3% absolute variation) compared with the previous year, when it was 15.2%. Such a stable ROE resulted despite a significant decline both in Profit and Equity. Specifically, Profit decreased from $ 521 million in 2014 to $ 438 million in 2015 (-15.9% variation), while the book value of Equity changed from $ 3,428 million to $ 3,149 million (-8.1% variation). In 2013 the ratio was 17.7%.
0,0%
5,0%
10,0%
15,0%
20,0%
25,0%
30,0%
35,0%
40,0%
2011 2012 2013 2014 2015
ROE

24
ROCE 2011 2012 2013 2014 2015
EBIT/Total Assets 9.7% 7.4% 4.7% 3.9% 3.8%
Return on Capital Employed (ROCE) is a financial ratio that measures the profitability of the ordinary business activities and its efficiency with respect to the amount of capital employed.
Range Significance
ROCE > 20% Satisfactory performance
10% < ROCE < 20% Average performance
ROCE < 10% Unsatisfactory performance
Return on Capital Employed in 2015 was 3.8%, given by EBIT of $ 673 million and Total Assets of $ 17,591 million. Such a ROCE level is deemed to be unsatisfactory. ROCE was roughly unchanged (-0.1% absolute variation) compared with the previous year, when it was 3.9%. Such a stable ROCE resulted from EBIT staying roughly constant, while Assets reported a significant growth. Specifically, EBIT changed from $ 646 million in 2014 to $ 673 million in 2015 (4.2% variation), while the Total Assets increased from $ 16,642 million to $ 17,591 million (5.7% variation). In 2013 the ratio was 4.7%.
EBIT margin 2011 2012 2013 2014 2015
EBIT/Sales 21.6% 17.1% 11.9% 9.4% 10.5%
EBIT margin reflects the company's commercial performance and measures the average profit per unit of revenue.
Range Significance
Ratio > 10% Satisfactory performance
5% < Ratio < 10% Average performance
Ratio < 5% Unsatisfactory performance
EBIT margin in 2015 was 10.5%, as the company collected $ 6,437 million in revenues and totalled a $ 673 million EBIT. Such a level of the ratio is deemed to be satisfactory. EBIT margin was roughly unchanged (1.0% absolute variation) compared with the previous year, when it was 9.4%. Such a stable ratio resulted from EBIT staying roughly constant, while Revenue reported a significant decline. Specifically, EBIT changed from $ 646 million in 2014 to $ 673 million in 2015 (4.2% variation), while Revenue dropped from $ 6,841 million to $ 6,437 million (-5.9% variation). In 2013 the ratio was 11.9%.
0,0%
2,0%
4,0%
6,0%
8,0%
10,0%
12,0%
2011 2012 2013 2014 2015
ROCE
0,0%
5,0%
10,0%
15,0%
20,0%
25,0%
2011 2012 2013 2014 2015
EBIT margin

25
ROA 2011 2012 2013 2014 2015
Net Profit/Total Assets 9.0% 6.0% 4.0% 3.1% 2.5%
Return on Assets measures the profitability of the company, based on the company's assets.
Range Significance
ROA > 5% Satisfactory performance
2% < ROA < 5% Average performance
ROA < 2% Unsatisfactory performance
Return on Assets in 2015 was 2.5%, given by Net Profit of $ 438 million and Total Assets of $ 17,591 million. Such a ROA level is deemed to be less than satisfactory. ROA was roughly unchanged (-0.6% absolute variation) compared with the previous year, when it was 3.1%. Such a stable ROA resulted despite a significant decline in Net Profit and a growth in Assets. Specifically, Net Profit dropped from $ 521 million in 2014 to $ 438 million in 2015 (-15.9% variation), while Total Assets increased from $ 16,642 million to $ 17,591 million (5.7% variation). In 2013 the ratio was 4.0%.
Asset turnover 2011 2012 2013 2014 2015
Sales/Total Assets 45.1% 43.1% 39.8% 41.1% 36.6%
Asset turnover measures the firm's capacity to generate revenue per unit of asset invested. The Asset Turnover ratio is also one component of the ROE disaggregation (DuPont Analysis), the other two components being the profit margin and the financial leverage.
Range Significance
Ratio > 50% Satisfactory performance
25% < Ratio < 50% Average performance
Ratio < 25% Unsatisfactory performance
Asset turnover in 2015 was 36.6%, due to Sales of $ 6,437 million and to total assets of $ 17,591 million. The ratio remained virtually unchanged compared with the previous year, when it was 41.1% (an absolute variation of -4.5%). The analysis highlights an unsatisfactory position, since annual revenue is not sufficient to replace all assets.
0,0%1,0%2,0%3,0%4,0%5,0%6,0%7,0%8,0%9,0%
10,0%
2011 2012 2013 2014 2015
ROA
0,0%5,0%
10,0%15,0%20,0%25,0%30,0%35,0%40,0%45,0%50,0%
2011 2012 2013 2014 2015
Asset turnover

26
Retained Earnings to Total Assets ratio
2011 2012 2013 2014 2015
Retained Earnings/Total Assets 10.2% 10.7% 10.1% 9.3% 8.6%
Retained Earnings is a balance sheet account which records the total amount of profits (or losses) made by a firm over its entire life, net of the dividends paid. The age of a firm is implicitly considered in this ratio. For example, a relatively young firm is likely to show a low RE/TA ratio because it has not had time to build up its cumulative profits. Retained Earnings to Total Assets measures the leverage of a firm because it refers to the company's ability to build up assets through retained earnings. The ratio in 2015 was 8.6% and remained virtually unchanged compared with the previous year, when it amounted to %4%.
0,0%
2,0%
4,0%
6,0%
8,0%
10,0%
12,0%
2011 2012 2013 2014 2015
Retained Earnings to Total Assets ratio

27
ROE breakdown (DuPont analysis)
2011 2012 2013 2014 2015
ROE = Net Profit Margin x Asset turnover x Leverage ratio 37.6% 25.7% 17.7% 15.2% 13.9%
This breakdown, originally developed by the firm DuPont, is a financial tool that helps executives understand the relationships between profit, sales, total assets and financial leverage.
ROE Net Profit margin Asset turnover Leverage ratio
2011
37.6% 20.0% 45.1% 4.17
2012
25.7% 13.9% 43.1% 4.29
2013
17.7% 10.0% 39.8% 4.44
2014
15.2% 7.6% 41.1% 4.85
2015
13.9% 6.8% 36.6% 5.59

28
Liquidity analysis Liquidity analysis reveals whether the business has sufficient resources available in order to service its debt (interest and principal repayments).
Current ratio 2011 2012 2013 2014 2015
Current Assets/Current Liabilities 1.57 1.78 1.71 1.68 1.38
Current ratio indicates the company's ability to cover its short-term liabilities using short-term assets (i.e. the assets that turn into cash quickly).
Range Significance
Current ratio > 2 Good position
1 < Current ratio < 2 Average position
Current ratio < 1 Critical position
The Current Ratio in 2015 was 1.38 and remained unchanged compared to the previous year. Since the Working Capital is the difference between current assets and current liabilities, a current ratio (or working capital ratio) higher than 1 indicates that the company has a positive working capital. The analysis therefore highlights a relatively stable financial position, since current assets are sufficient to cover current liabilities.
0,00
0,20
0,40
0,60
0,80
1,00
1,20
1,40
1,60
1,80
2,00
2011 2012 2013 2014 2015
Current ratio

29
Quick ratio 2011 2012 2013 2014 2015
(Cash and Cash equivalents+Other Current Financial Assets+Trade and other Current Receivables)/Current Liabilities
118.9% 135.7% 136.3% 105.9% 79.0%
Quick ratio measures the company's solvency with regard to short-term liabilities. Specifically, it measures whether the company's cash and equivalents and its trade and other receivables are sufficient to cover the short-term liabilities.
Range Significance
Quick ratio > 100% Good position
60% < Quick ratio < 100% Average position
Quick ratio < 60% Critical position
The Quick Ratio in 2015 was 79.0% and was worse than in the previous year, when it amounted to 105.9% (a -27.0% variation). The analysis highlights a relatively stable financial position since cash, cash equivalents, trade and other receivables are sufficient to cover current liabilities.
Cash ratio 2011 2012 2013 2014 2015
Cash and Cash equivalents/Current Liabilities 0.89 1.05 1.02 0.81 0.53
Cash ratio is used to examine the company's liquidity. It is more conservative than the current ratio and the quick ratio, as it compares the amount of cash and cash equivalents with current liabilities.
Range Significance
Ratio > 0.75 Very good position
0.30 < Ratio < 0.75 Satisfactory position
Ratio < 0.30 Critical position
The Cash ratio in 2015 was 0.53 and remained unchanged compared to the previous year. The analysis highlights a relatively stable financial position since cash and cash equivalents, are barely sufficient to cover current liabilities.
0,0%
20,0%
40,0%
60,0%
80,0%
100,0%
120,0%
140,0%
160,0%
2011 2012 2013 2014 2015
Quick ratio
0,00
0,20
0,40
0,60
0,80
1,00
1,20
2011 2012 2013 2014 2015
Cash ratio

30
Days Payables 2011 2012 2013 2014 2015
Trade Payables/Purchases * 360 107 120 118 119 148
Days payables express the average number of days it takes the company to pay its invoices from trade creditors, such as suppliers.
Average days payables in 2015 amounted to 148, as the company incurred costs for supplies amounting to $ 5,764 million and had trade payables of $ 2,369 million at the end of the year. Such a performance was better than in the previous year, when the company paid for its purchases after an average of 119 days.
Days Receivables 2011 2012 2013 2014 2015
Trade Receivables/Revenue * 360 39 48 45 35 43
Days receivables express the average time it takes the company to cash in its invoices from customers.
Average days receivables in 2015 amounted to 43, as the company collected $ 6,437 million in revenues and had trade receivables of $ 767 million at the end of the year. Such a performance was roughly unchanged compared to the previous year, when the company cashed in its invoices after an average of 35 days.
0,0
20,0
40,0
60,0
80,0
100,0
120,0
140,0
160,0
2011 2012 2013 2014 2015
Days Payables
0,0
10,0
20,0
30,0
40,0
50,0
2011 2012 2013 2014 2015
Days Receivables

31
Capital Structure Ratios Capital structure analysis examines the relationship between internal sources of capital and debt capital, assessing the viability of the company's financing strategy.
Debt to Equity ratio 2011 2012 2013 2014 2015
Financial Debt/Equity 1.22 1.35 1.60 1.69 2.02
Debt to Equity ratio compares the financial resources provided by debtholders with those provided by the shareholders. This ratio is used to monitor the company's financial risk.
Range Significance
D/E < 0.30 Strong position
0.30 < D/E < 2 Average position
D/E > 2 Critical position
Debt to Equity ratio in 2015 was 2.02, resulting from Debt of $ 6,362 million and Equity of $ 3,149 million. The debt capital borrowed by the company is much higher than Equity capital invested by shareholders. Such a Debt to Equity ratio level is deemed to be unsatisfactory. A strategy should be implemented to reduce this ratio, to prevent debt service issues. D/E ratio was roughly unchanged (0.33 absolute variation) compared with the previous year, when it was 1.69. Such a stable D/E ratio resulted despite a significant growth in Debt and a decline in Equity. Specifically, Debt increased from $ 5,806 million in 2014 to $ 6,362 million in 2015 (9.6% variation), while Equity dropped from $ 3,428 million to $ 3,149 million (-8.1% variation). In 2013 the ratio was 1.60.
0,00
0,50
1,00
1,50
2,00
2,50
2011 2012 2013 2014 2015
Debt to Equity ratio

32
Net Debt to Equity ratio 2011 2012 2013 2014 2015
Net Financial Debt/Equity 0.60 0.68 0.92 1.03 1.51 Net Debt is defined as the borrowings of the reported entity (Total Liabilities) less cash and cash equivalents. The ratio compares the financial resources provided by debtholders with those provided by the shareholders. This ratio is used to monitor the company's financial risk.
Range Significance
Net D/E < 0.15 Strong position
0.15 < Net D/E < 0.40 Satisfactory position
0.40 < Net D/E < 1 Average position
The Net Debt to Equity ratio in 2015 was 1.51, resulting from Net Debt of $ 4,750 million and Equity of $ 3,149 million. Such a level of the ratio is deemed to be very unsatisfactory. Net Debt/Equity was roughly unchanged (0.48 absolute variation) compared with the previous year, when it was 1.03. Such a stable Net Debt/Equity resulted despite a substantial growth in Net Debt and a decline in Equity. Specifically, Net Debt increased from $ 3,540 million in 2014 to $ 4,750 million in 2015 (34.2% variation), while Equity dropped from $ 3,428 million to $ 3,149 million (-8.1% variation). In 2013 the ratio was 0.92.
Total Liabilities to Assets ratio 2011 2012 2013 2014 2015
Total Liabilities/Total Assets 0.45 0.48 0.52 0.54 0.57
Total Liabilities to Assets ratio shows how much of company's assets consist of liabilities.
Range Significance
Ratio < 0.29 Very good position
0.29 < Ratio < 0.50 Satisfactory position
0.50 < Ratio < 0.71 Critical position
Ratio > 0.71 Very risky position
In 2015 Total Liabilities to Assets ratio was 0.57, given by Total Liabilities of $ 9,962 million and Assets totalling $ 17,591 million. The analysis shows a satisfactory solvency, as total liabilities is covered by total value of the assets. The value of the ratio remained virtually unchanged compared with the previous year, when it amounted to 0.54 (a 0.03 absolute variation).
0,00
0,20
0,40
0,60
0,80
1,00
1,20
1,40
1,60
2011 2012 2013 2014 2015
Net Debt to Equity ratio
0,00
0,10
0,20
0,30
0,40
0,50
0,60
2011 2012 2013 2014 2015
Total Liabilities to Assets ratio

33
Total Liabilities to Equity ratio 2011 2012 2013 2014 2015
Total Liabilities/Equity 1.90 2.05 2.30 2.60 3.16
Total Liabilities to Equity ratio is a capital structure metric comparing the whole amount of the company's obligations to the book value of Equity.
Range Significance
Ratio < 0.40 Very good position
0.40 < Ratio < 1 Satisfactory position
1 < Ratio < 2.50 Critical position
Ratio > 2.50 Very risky position
Total Liabilities to Equity ratio in 2015 was 3.16, resulting from Total Liabilities of $ 9,962 million and Equity of $ 3,149 million. Such a level of the ratio is deemed to be unsatisfactory. A strategy should be implemented to reduce this ratio and prevent issues. Liabilities on Equity ratio increased significantly (0.56 absolute variation) compared with the previous year, when it was 2.60. The growth (a worsening of the ratio) was caused from a significant growth in Total Liabilities and a decline in Equity. Specifically, Total Liabilities changed from $ 8,926 million in 2014 to $ 9,962 million in 2015 (11.6% increase), while Equity dropped from $ 3,428 million to $ 3,149 million (-8.1% variation). In 2013 the ratio was 2.30.
Fixed Assets coverage ratio 2011 2012 2013 2014 2015
(Equity + Non-current Liabilities)/Non-current Assets 0.71 0.77 0.80 0.80 0.75
Fixed Assets Coverage ratio measures the company's ability to cover required investments in fixed assets by means of equity and debt.
Range Significance
Ratio > 1 Satisfactory performance
Ratio < 1 Unsatisfactory performance
In 2015 Fixed Assets coverage ratio remained roughly unchanged, compared to the previous year, amounting to a value of 0.75. The analysis highlights an unsatisfactory financial position, as the ratio shows that current liabilities are used to finance a portion of the non-current assets.
0,00
0,50
1,00
1,50
2,00
2,50
3,00
3,50
2011 2012 2013 2014 2015
Total Liabilities to Equity ratio
0,66
0,68
0,70
0,72
0,74
0,76
0,78
0,80
0,82
2011 2012 2013 2014 2015
Fixed Assets coverage ratio

34
Equity to Assets ratio 2011 2012 2013 2014 2015
Equity/Total Assets 0.24 0.23 0.23 0.21 0.18
Equity to Assets ratio assesses the degree of financial independence, i.e. what percentage of total company's assets is financed by Equity. A low equity ratio is not necessarily bad, as it can contribute an increase in the Return on Equity (as long as the company earns a rate of return on assets that is greater than the interest rate paid to creditors).
Range Significance
E/A > 0.71 Good position
0.50 < E/A < 0.71 Average position
0.29 < E/A < 0.50 Critical position
E/A < 0.29 Average position
Equity to Assets ratio in 2015 was 0.18, given by a book value of Equity of $ 3,149 million and Assets totalling $ 17,591 million. The analysis highlights an unsatisfactory balance between Debt capital and Equity. E/A was roughly unchanged (-0.03 absolute variation) compared with the previous year, when it was 0.21. Such a stable E/A resulted despite a significant decline in Equity and a growth in Assets. Specifically, Equity dropped from $ 3,428 million in 2014 to $ 3,149 million in 2015 (-8.1% variation), while Assets increased from $ 16,642 million to $ 17,591 million (5.7% variation). In 2013 the ratio was 0.23.
Working Capital to Assets ratio 2011 2012 2013 2014 2015
Net Working Capital/Total Assets 9.5% 11.6% 10.6% 11.6% 6.7%
The working capital to total assets ratio compares the net liquid assets of the firm to the total assets. Working Capital is the difference between current assets and current liabilities, so the Working Capital to Total Assets ratio determines the short-term company's solvency.
Range Significance
Ratio > 30% Very Good
15% < Ratio < 30% Satisfactory
0% < Ratio < 15% Unsatisfactory
Ratio < 0% Critical, no Net Current Assets
The Working Capital to Assets ratio in 2015 amounted to 6.7%, which was virtually unchanged compared with the previous year, when it was 11.6% (an absolute variation of -4.9%).
0,00
0,05
0,10
0,15
0,20
0,25
0,30
2011 2012 2013 2014 2015
Equity to Assets ratio
0,0%
2,0%
4,0%
6,0%
8,0%
10,0%
12,0%
14,0%
2011 2012 2013 2014 2015
Working Capital to Assets ratio

35
Leverage ratio 2011 2012 2013 2014 2015
Total Assets/Equity 4.17 4.29 4.44 4.85 5.59
Leverage ratio indicates a company's ability to make use of its borrowed capital to purchase assets. This ratio is an indicator of the company's financial leverage used to finance the firm.
Range Significance
Leverage < 1.40 Solid position
1.40 < Leverage < 3.50 Average position
Leverage > 3.50 Average position
Leverage Ratio (A/E) in 2015 was 5.59, given by Assets totalling $ 17,591 million and a book value of Equity of $ 3,149 million. The analysis highlights an unsatisfactory balance between Debt capital and Equity. Leverage ratio increased significantly (0.73 absolute variation) compared with the previous year, when it was 4.85. Such a change was caused from a significant growth in Assets and a decline in Equity. Specifically, Assets changed from $ 16,642 million in 2014 to $ 17,591 million in 2015 (5.7% increase), while Equity dropped from $ 3,428 million to $ 3,149 million (-8.1% variation). In 2013 the ratio was 4.44.
Equity market value to Liabilities ratio
2011 2012 2013 2014 2015
Market value of Equity/Total Liabilities 0.53 0.49 0.44 0.38 0.32
Range Significance
Ratio > 2.50 Strong position
0.40 < Ratio < 2.50 Average position
Ratio < 0.40 Critical position
In this software, if the Market value of Equity is unknown, it is replaced by the book value of Equity attributable to the owners of the parent
*Equity attributable to the owners of the parent
0,00
1,00
2,00
3,00
4,00
5,00
6,00
2011 2012 2013 2014 2015
Leverage ratio
0,00
0,10
0,20
0,30
0,40
0,50
0,60
2011 2012 2013 2014 2015
Equity market value to Liabilities ratio

36
Solvency analysis
Solvency analysis examines a firm's capability to meet long term obligations. In general, a solvency ratio compares a measure of profitability to the company's financial obligations.
Debt to EBITDA ratio 2011 2012 2013 2014 2015
Financial Debt/EBITDA 2.56 3.46 5.49 6.02 6.31
Debt to EBITDA ratio is a solvency indicator that is commonly used by credit rating agencies to assess the probability of defaulting on issued debt. It indicates the approximate time period required by a firm or business to pay off all financial debts.
Range Significance
Ratio < 3 Very good position
3 < Ratio < 3.50 Satisfactory position
3.50 < Ratio < 5 Critical position
Ratio > 5 Very risky position
Debt to EBITDA ratio in 2015 was 6.31, resulting from Debt of $ 6,362 million and EBITDA of $ 1,009 million. Such a Debt to EBITDA ratio level is deemed to be unsatisfactory. Debt to EBITDA ratio was roughly unchanged (0.29 absolute variation) compared with the previous year, when it was 6.02. Such a stable ratio resulted despite a significant growth in both Debt and EBITDA. Specifically, Debt increased from $ 5,806 million in 2014 to $ 6,362 million in 2015 (9.6% variation), while EBITDA changed from $ 965 million to $ 1,009 million (4.6% variation). In 2013 the ratio was 5.49.
0,00
1,00
2,00
3,00
4,00
5,00
6,00
7,00
2011 2012 2013 2014 2015
Debt to EBITDA ratio

37
Debt to Operating Cash-flow ratio 2011 2012 2013 2014 2015
Financial Debt/Operating Cash-flow 230.94 174.64 330.47 305.58 424.13
Debt to EBITDA ratio is a solvency metrics that, differently from Debt to EBITDA ratio, takes into account the actual cash-flow generated by operating activities and compares it to the amount of financial liabilities.
Range Significance
Ratio < 3 Very good position
3 < Ratio < 3.50 Satisfactory position
3.50 < Ratio < 5 Critical position
Ratio > 5 Very risky position
Debt to Operating Cash-flow ratio in 2015 was 424.13, resulting from Debt of $ 6,362 million and Operating Cash-flow of $ 15 million. Such a Debt to Operating Cash-flow ratio level is deemed to be unsatisfactory. Debt to Operating Cash-flow ratio increased significantly (118.55 absolute variation) compared with the previous year, when it was 305.58. The growth (a worsening of the ratio) was caused from a substantial growth in Debt and a decline in Cash-flow. Specifically, Debt changed from $ 5,806 million in 2014 to $ 6,362 million in 2015 (9.6% increase), while Operating Cash-flow dropped from $ 19 million to $ 15 million (-21.1% variation). In 2013 the ratio was 330.47.
Net Debt to EBITDA ratio 2011 2012 2013 2014 2015
Net Financial Debt/EBITDA 1.26 1.74 3.17 3.67 4.71
Net Debt to EBITDA ratio is a solvency metric akin to Debt on EBITDA ratio. Unlike the aforementioned ratio, it takes into account the company's immediate liquidity, as it involves net financial debt, i.e. Debt minus cash and cash equivalents.
Range Significance
Ratio < 1.50 Very good position
1.50 < Ratio < 3 Satisfactory position
3 < Ratio < 4 Critical position
Ratio > 4 Very risky position
The Net Debt to EBITDA ratio in 2015 was 4.71, resulting from Net Debt of $ 4,750 million and EBITDA of $ 1,009 million. Such a level of the ratio is deemed to be very unsatisfactory. Net Debt/EBITDA increased significantly (1.04 absolute variation) compared with the previous year, when it was 3.67. The growth (a worsening of the ratio) resulted from a substantial growth both in Net Debt and EBITDA value and was caused by Net Debt increasing at a higher rate over the period. Specifically, Net Debt changed from $ 3,540 million in 2014 to $ 4,750 million in 2015 (34.2% increase), while EBITDA increased from $ 965 million to $ 1,009 million (4.6% variation). In 2013 the ratio was 3.17.
0,00
100,00
200,00
300,00
400,00
500,00
2011 2012 2013 2014 2015
Debt to Operating Cash-flow ratio
0,00
1,00
2,00
3,00
4,00
5,00
2011 2012 2013 2014 2015
Net Debt to EBITDA ratio

38
EBIT to Interest coverage ratio 2011 2012 2013 2014 2015
EBIT/Interest Expense 6.57 3.73 2.43 1.81 1.79
EBIT to Interest coverage ratio assesses the company's ability to cover its finance charges through its operating income.
Range Significance
Ratio > 3 Good position
2 < Ratio < 3 Average position, to be controlled
1 < Ratio < 2 Financial tension
Ratio < 1 Serious financial tension
EBIT to Interest coverage ratio in 2015 was 1.79, given by an EBIT of $ 673 million and finance charges of $ 375 million. Such a level of the ratio is deemed to be unsatisfactory. The income from operating activities is sufficient to service the debt, but a careful monitoring of the situation is however recommended. EBIT on Interest Expense was roughly unchanged (-0.01 absolute variation) compared with the previous year, when it was 1.81. Such a stable ratio resulted from EBIT staying roughly constant, while interest expense grew significantly. Specifically, EBIT changed from $ 646 million in 2014 to $ 673 million in 2015 (4.2% variation), while interest expense increased from $ 357 million to $ 375 million (5.0% variation). In 2013 the ratio was 2.43.
EBITDA to Interest coverage ratio 2011 2012 2013 2014 2015
EBITDA/Interest Expense 7.73 4.60 3.37 2.70 2.69
EBITDA to Interest Expense coverage ratio assesses the company's ability to cover its finance charges through its operating income, before depreciation and amortization expenses, and share of profit from associates.
Range Significance
Ratio > 4 Good position
3 < Ratio < 4 Average position, to be controlled
1.50 < Ratio < 3 Financial tension
Ratio < 1.50 Serious financial tension
EBITDA to Interest coverage ratio in 2015 was 2.69, given by an EBITDA of $ 1,009 million and finance charges of $ 375 million. Such a level of the ratio is deemed to be unsatisfactory. The income before interest, taxes, depreciation and amortization is sufficient to service the debt, but a careful monitoring of the situation is however recommended. EBITDA on Interest Expense was roughly unchanged (-0.01 absolute variation) compared with the previous year, when it was 2.70. Such a stable EBITDA on Interest Expense resulted from EBITDA staying roughly constant, while interest expense reported a significant growth. Specifically, EBITDA changed from $ 965 million in 2014 to $ 1,009 million in 2015 (4.6% variation), while interest expense increased from $ 357 million to $ 375 million (5.0%% variation). In 2013 the ratio was 3.37.
0,00
1,00
2,00
3,00
4,00
5,00
6,00
7,00
2011 2012 2013 2014 2015
EBIT to Interest coverage ratio
0,00
1,00
2,00
3,00
4,00
5,00
6,00
7,00
8,00
9,00
2011 2012 2013 2014 2015
EBITDA to Interest coverage ratio

39
Operating Cash-flow to Interest coverage ratio 2011 2012 2013 2014 2015
Operating Cash-flow/Interest Expense 0.09 0.09 0.06 0.05 0.04
Operating Cash-flow to Interest coverage ratio assesses the company's ability to cover its finance charges comparing interest expense to the actual cash amount generated by operating activities.
Range Significance
Ratio > 4 Good position
3 < Ratio < 4 Average position, to be controlled
2 < Ratio < 3 Financial tension
Ratio < 2 Serious financial tension
Operating Cash-flow to Interest coverage ratio in 2015 was 0.04, given by an Operating Cash-flow of $ 15 million and finance charges of $ 375 million. Such a level of the ratio is deemed to be very unsatisfactory, as the cash-flow from operating activities is barely sufficient to service the debt. The analysis shows the existence of financial tensions, which are likely to require interventions. Operating Cash-flow on Interest Expense was roughly unchanged (-0.01 absolute variation) compared with the previous year, when it was 0.05. Such a stable ratio resulted despite a significant decline in Operating Cash-flow and a growth in interest expense. Specifically, Operating Cash-flow dropped from $ 19 million in 2014 to $ 15 million in 2015 (-21.1% variation), while interest expense increased from $ 357 million to $ 375 million (5.0% variation). In 2013 the ratio was 0.06.
Operating Cash-flow to Short-term Debt 2011 2012 2013 2014 2015
Operating Cash-flow/Current Financial Liabilities 0.01 0.03 0.02 0.02 0.02
Operating Cash-flow to Short-term Debt ratio measure the company's ability to generate cash from operating actvities in order to pay back its current financial debt.
Range Significance
Ratio > 2 Very good position
1 < Ratio < 2 Satisfactory position
0.50 < Ratio < 2 Critical position
Ratio < 0.50 Very risky position
Operating Cash-flow to Short-term Debt in 2015 was 0.02, resulting from an Operating Cash-flow of $ 15 million and short-term financial liabilities totalling $ 999 million. Such a level of the ratio is deemed to be very unsatisfactory. Operating Cash-flow on Short-term Debt was roughly unchanged (-0.01 absolute variation) compared with the previous year, when it was 0.02. Such a stable ratio resulted despite a substantial decline in Operating Cash-flow and a growth in Short-term Debt. Specifically, Operating Cash-flow dropped from $ 19 million in 2014 to $ 15 million in 2015 (-21.1% variation), while Short-term Debt increased from $ 912 million to $ 999 million (9.5% variation). In 2013 the ratio was 0.
0,00
0,02
0,04
0,06
0,08
0,10
2011 2012 2013 2014 2015
Operating Cash-flow to Interest coverage ratio
0,00
0,01
0,01
0,02
0,02
0,03
0,03
2011 2012 2013 2014 2015
Operating Cash-flow to Short-term Debt

40
Operating Cash-flow to Long-term Debt 2011 2012 2013 2014 2015
Operating Cash-flow/Non-current Financial Liabilities 0.01 0.01 0.00 0.00 0.00
Operating Cash-flow to Long-term Debt ratio measure the company's ability to generate cash from operating actvities in order to pay back its non-current financial debt.
Range Significance
Ratio > 0.35 Very good position
0.25 < Ratio < 0.35 Satisfactory position
0.20 < Ratio < 0.25 Critical position
Ratio < 0.20 Very risky position
Operating Cash-flow to Long-term Debt in 2015 was 0.00, given by an Operating Cash-flow of $ 15 million and long-term financial liabilities totalling $ 5,363 million. Such a level of the ratio is deemed to be very unsatisfactory. Operating Cash-flow on Long-term Debt was roughly unchanged (0.00 absolute variation) compared with the previous year, when it was 0.00. Such a stable ratio resulted despite a substantial decline in Operating Cash-flow and a growth in Long-term Debt. Specifically, Operating Cash-flow dropped from $ 19 million in 2014 to $ 15 million in 2015 (-21.1% variation), while Long-term Debt increased from $ 4,894 million to $ 5,363 million (9.6% variation). In 2013 the ratio was 0.00.
0,00
0,00
0,00
0,00
0,00
0,01
0,01
0,01
0,01
2011 2012 2013 2014 2015
Operating Cash-flow to Long-term Debt

41
Rating analysis
Altman's model Main variables 2011 2012 2013 2014 2015
T1 Working Capital/Total Assets 0.09 0.12 0.11 0.12 0.07
The Working Capital to Total Assets ratio compares the net liquid assets of the firm to Total Assets. Working Capital is the difference between current assets and current liabilities, so the Working Capital to Total Assets ratio determines the short-term company's solvency. The Working Capital to Assets ratio in 2015 amounted to 6.7%, which was virtually unchanged compared with the previous year, when it was 11.6% (an absolute variation of -4.9%).
T2 Retained Earnings/Total Assets 0.10 0.11 0.10 0.09 0.09
Retained Earnings is a balance sheet account which records the total amount of profits (or losses) made by a firm over its entire life, net of the dividends paid. The age of a firm is implicitly considered in this ratio. For example, a relatively young firm is likely to show a low RE/TA ratio because it has not had time to build up its cumulative profits. Retained Earnings to Total Assets measures the leverage of a firm because it refers to the company's ability to build up assets through retained earnings. The ratio in 2015 was 8.6% and remained virtually unchanged compared with the previous year, when it amounted to %4%.
T3 EBIT/Total Assets 0.10 0.07 0.05 0.04 0.04
Earnings Before Interest and Taxes (EBIT) to Total assets ratio is a measure of the economic productivity of the firm's assets, independently of tax and financial leverage. The EBIT to Total Assets ratio in 2015 was 0.04, remaining roughly unchanged compared with the previous year, when it amounted to 0.04 (a -1.4% variation).
T4 Equity market value/Total Liabilities 0.53 0.49 0.44 0.38 0.32
The Market value of Equity to Total Liabilities ratio measures financial leverage using Equity at market price, rather than at book value. In 2015 the ratio was 0.32, worse than the previous year, when it amounted to 0.38 (a -17.7% variation).
T5 Sales/Total Assets 0.45 0.43 0.40 0.41 0.37
The Sales to Total Assets ratio, also known as Asset turnover ratio, measures the capacity of the company to generate sales using its assets (an asset efficiency metric). In 2015 the Asset turnover was 0.37, due to sales of $ 6,437 million and to Total Assets of $ 17,591 million. The ratio was worse, compared with the previous year, when it amounted to 0.41 (a -11.0% variation).

42
Altman's Z-Score standard model 2011 2012 2013 2014 2015
Z = 1.2T1 + 1.4T2 + 3.3T3 + 0.6T4 + 0.999T5 1.34 1.26 1.08 1.04 0.88
Distress zone Distress zone Distress zone Distress zone Distress zone
Change n.a. -6.6% -13.6% -4.3% -15.0% Z-Score is a financial metric developed by Edward l. Altman to predict the probability that a firm will undergo bankruptcy within the next few years. It is calculated as a linear combination of five common business ratios, weighted by coefficients. In this software, if the "Market value of the Equity" is unknown, it is replaced by the book value of Equity.
Range Significance Z-score < 1.81 Distress zone
1.81 < Z-score < 2.99 Gray zone
Z-score > 2.99 Safe zone
Altman's Z-Score is in the range of Distress zone and worsened by 15.0%, compared with the previous year, when it amounted to a value of 1.04.
Altman's Z-Score for private firms 2011 2012 2013 2014 2015
Z = 0.717T1 + 0.847T2 + 3.10T3 + 0.420T4 + 0.998T5 1.13 1.04 0.89 0.85 0.74 Distress zone Distress zone Distress zone Distress zone Distress zone
n.a. -8.0% -14.3% -4.0% -13.6%
In 2002, Altman advocated a revised Z-Score formula for private companies, which uses different weights and the book value of Equity instead of the market capitalization. It is calculated as a linear combination of five common business ratios, weighted by different coefficients to the ones used in Altman's original Z-Score.
Range Significance Z-score < 1.23 Distress zone
1.23 < Z-score < 2.90 Gray zone
Z-score > 2.90 Safe zone
Altman's Z-Score is in the range of Distress zone and worsened by 13.6%, compared with the previous year, when it amounted to a value of 0.85.

43
Altman's Z-Score for Nonmanufacturers 2011 2012 2013 2014 2015
Z = 1.2T1 + 1.4T2 + 3.3T3 + 0.6T4 0.89 0.82 0.69 0.63 0.52 Distress zone Distress zone Distress zone Distress zone Distress zone
n.a. -7.8% -16.8% -8.7% -17.7%
Edward Altman originally developed the Z-Score for manufacturers, primarily because those were the companies in his original sample. However, the emergence of large, public service companies prompted him to develop a second Z-Score model for non-manufacturing companies. The formula remains essentially the same, except that it excludes the last component (Sales/Total Assets) because Altman wanted to minimize the effects of manufacturing-intensive asset turnover.
Range Significance Z-score < 1.10 Distress zone
1.10 < Z-score < 2.60 Gray zone
Z-score > 2.60 Safe zone
Altman's Z-Score for Non-manufacturers is in the range of Distress zone and remained virtually unchanged, compared with the previous year, when it amounted to a value of 0.63.
Altman's Z-Score for Emerging markets 2011 2012 2013 2014 2015
Z = 6.56T1 + 3.26T2 + 6.72T3 + 1.05T4 2.16 2.12 1.80 1.72 1.31
Gray zone Gray zone Gray zone Gray zone Gray zone
n.a. -2.1% -15.0% -4.1% -24.3%
It is often impossible to build a model for emerging market countries, because of the of credit experience there. To solve this issue , Altman, Hartzell, and Peck modified the original Altman Z-Score model, creating the emerging market scoring (EMS) model.
Range Significance Z-score < 1.10 Distress zone
1.10 < Z-score < 2.60 Gray zone
Z-score > 2.60 Safe zone
Altman's Z-Score for emerging markets is in the range of Gray zone and worsened by 24.3%, compared with the previous year, when it amounted to a value of 1.72.

44
Taffler's model
Main variables 2011 2012 2013 2014 2015
T1 Gross Profit/Current Liabilities 0.84 0.90 0.78 0.68 0.59
T2 Working Capital/Total Liabilities 0.21 0.24 0.20 0.22 0.12
T3 Current Liabilities/Total Assets 0.17 0.15 0.15 0.17 0.17
T4 Sales/Total Assets 0.45 0.43 0.40 0.41 0.37
Taffler's Z-score 2011 2012 2013 2014 2015
Z = 0.53T1 + 0.13T2 + 0.18T3 + 0.16T4 0.58 0.60 0.53 0.49 0.42 Safe zone Safe zone Safe zone Safe zone Safe zone
n.a. 4.8% -11.8% -9.0% -13.4%
Range Significance Z-score < 0.2 Distress zone
0.2 < Z-score < 0.3 Gray zone
Z-score > 0.3 Safe zone
Taffler's Z-Score is in the range of Safe zone but worsened by 13.4%, compared with the previous year, when it amounted to a value of 0.49.

45
Springate's model
Main variables 2011 2012 2013 2014 2015
T1 Working Capital/Total Assets 0.09 0.12 0.11 0.12 0.07
T2 EBIT/Total Assets 0.10 0.07 0.05 0.04 0.04
T3 Profit Before Tax/Current Liabilities 0.64 0.51 0.33 0.23 0.20
T4 Sales/Total Assets 0.45 0.43 0.40 0.41 0.37
Springate's Z-score 2011 2012 2013 2014 2015
Z = 1.03T1 + 3.07T2 + 0.66T3 + 0.4T4 1.00 0.86 0.63 0.56 0.46 Safe zone Failed Failed Failed Failed
n.a. -14.4% -26.2% -12.0% -16.9%
Range Significance
Z-score < 0.892 Failed
0.892 < Z-score < 0.900 Critical zone
Z-score > 0.900 Safe zone
Springate's Z-Score is in the range of Failed zone and worsened by 16.9%, compared with the previous year, when it amounted to a value of 0.56.

46
Performance evaluation 2015
Profitability
ROE - Return On Equity ROCE - Return on Capital Employed Asset turnover EBIT margin
Year Value Evaluation Year Value Evaluation Year Value Evaluation Year Value Evaluation
2011 37.6% Satisfactory 2011 9.7% Unsatisfactory 2011 45.1% Average 2011 21.6% Satisfactory
2012 25.7% Satisfactory 2012 7.4% Unsatisfactory 2012 43.1% Average 2012 17.1% Satisfactory
2013 17.7% Satisfactory 2013 4.7% Unsatisfactory 2013 39.8% Average 2013 11.9% Satisfactory
2014 15.2% Satisfactory 2014 3.9% Unsatisfactory 2014 41.1% Average 2014 9.4% Average
2015 13.9% Average 2015 3.8% Unsatisfactory 2015 36.6% Average 2015 10.5% Satisfactory
Economic evaluation 2015 B+ The company's profitability needs to be improved
The following interventions are recommended:
ROCE is critically low, indicating poor profitability of the ordinary business activities. Based on the ROCE breakdown formula, ROCE is not satisfactory due to a poor production efficiency (measured by Asset turnover), despite a good sales profitability (measured by EBIT margin). An improvement in production efficiency is required.

47
Capital Structure
Debt to Equity ratio Leverage ratio Fixed Assets coverage ratio Working Capital to Assets ratio
Year Value Evaluation Year Value Evaluation Year Value Evaluation Year Value Evaluation
2011 1.22 Average 2011 4.17 Unsatisfactory 2011 0.71 Average 2011 9.5% Unsatisfactory
2012 1.35 Average 2012 4.29 Unsatisfactory 2012 0.77 Average 2012 11.6% Unsatisfactory
2013 1.60 Average 2013 4.44 Unsatisfactory 2013 0.80 Average 2013 10.6% Unsatisfactory
2014 1.69 Average 2014 4.85 Unsatisfactory 2014 0.80 Average 2014 11.6% Unsatisfactory
2015 2.02 Unsatisfactory 2015 5.59 Unsatisfactory 2015 0.75 Average 2015 6.7% Unsatisfactory
Capital Structure evaluation 2015 D The company's financial solidity is at
default risk
The following measures are recommended: Debt (book value) is excessively high compared to Equity. This is likely to lead to a bad corporate credit rating and a consequent shortage of financing sources. A capital increase should be considered. Leverage ratio is critically high. This indicates that the company may have an unbalanced financial structure, where Liabilities are excessively high compared to Equity.

48
Solvency
Debt to EBITDA ratio Debt to Operating Cash-flow ratio
EBIT to Interest coverage ratio Operating Cash-flow to Short-term Debt Year Value Evaluation Year Value Evaluation Year Value Evaluation Year Value Evaluation
2011 2.56 Satisfactory 2011 230.94 Unsatisfactory 2011 6.57 Satisfactory 2011 0.01 Unsatisfactory
2012 3.46 Average 2012 174.64 Unsatisfactory 2012 3.73 Satisfactory 2012 0.03 Unsatisfactory
2013 5.49 Unsatisfactory 2013 330.47 Unsatisfactory 2013 2.43 Average 2013 0.02 Unsatisfactory
2014 6.02 Unsatisfactory 2014 305.58 Unsatisfactory 2014 1.81 Average 2014 0.02 Unsatisfactory
2015 6.31 Unsatisfactory 2015 424.13 Unsatisfactory 2015 1.79 Average 2015 0.02 Unsatisfactory
Solvency evaluation 2015 D The company's solvency is at default risk
The following measures are recommended: Debt to EBITDA ratio requires intervention. The amount of Debt is excessively high compared to annual profit from operating activity (EBITDA). Coverage of finance charges is inadequate, as Finance charges are too high compared to the profits from ordinary activities. A renegotiation of financial liabilities should be considered, or interventions to reduce production costs. Coverage of finance charges is inadequate, as Finance charges are too high compared to the profits from ordinary activities. A renegotiation of financial liabilities should be considered, or interventions to reduce production costs.

49
Liquidity
Current ratio Quick ratio Cash ratio Days Receivables
Year Value Evaluation Year Value Evaluation Year Value Evaluation Year Value Evaluation
2011 1.57 Average 2011 118.9% Satisfactory 2011 0.89 Satisfactory 2011 107 Average
2012 1.78 Average 2012 135.7% Satisfactory 2012 1.05 Satisfactory 2012 120 Unsatisfactory
2013 1.71 Average 2013 136.3% Satisfactory 2013 1.02 Satisfactory 2013 118 Average
2014 1.68 Average 2014 105.9% Satisfactory 2014 0.81 Satisfactory 2014 119 Average
2015 1.38 Average 2015 79.0% Average 2015 0.53 Average 2015 148 Unsatisfactory
Liquidity evaluation 2015 BB+ The company's short-term liquidity needs to be improved
The following measures are recommended: The analysis highlights a relatively stable financial position, since current assets are sufficient to cover current liabilities. Careful monitoring of the situation is recommended. The analysis highlights an unsatisfactory financial position, since short-term liquidity is insufficient to cover current liabilities.

50
Global evaluation 2015
C
The analysis highlights that the overall performance of the business is unsatisfactory
C

51
Methodological Notes
The value of Equity here reported is always assumed as the portion attributable to the owners of the parent.
Ratios
ROE Profit (loss) attributable to Owners of the Parent/Equity attributable to the Owners of the Parent
ROCE EBIT/Total Assets
EBIT margin EBIT/Sales
ROA Profit (loss)/Total Assets
Asset turnover Sales/Total Assets
Retained Earnings to Total Assets ratio Retained Earnings/Total Assets
Current ratio Current Assets/Current Liabilities
Quick ratio (Cash and Cash equivalents+Other Current Financial Assets+Trade and other Current Receivables)/Current Liabilities
Cash ratio Cash and Cash equivalents/Current Liabilities
Days Payables Trade Payables/(Cost of Sales + Distribution, Marketing and Administrative expense + Other Expense) * 360
Days Receivables Trade Receivables/Revenue * 360
Debt to Equity ratio Financial Debt/Equity
Net Debt to Equity ratio Net Financial Debt/Equity
Total Liabilities to Assets ratio Total Liabilities/Total Assets
Total Liabilities to Equity ratio Total Liabilities/Equity
Equity to Assets ratio Equity/Total Assets

52
Fixed Assets coverage ratio (Equity + Non-current Liabilities)/Non-current Assets
Working Capital to Assets ratio Net Working Capital/Total Assets
Leverage ratio Total Assets/Equity
Equity market value to Liabilities ratio Market value of Equity/Total Liabilities
Debt to EBITDA ratio Financial Debt/EBITDA
Debt to Operating Cash-flow ratio Financial Debt/Operating Cash-flow
Net Debt to EBITDA ratio Net Financial Debt/EBITDA
EBIT to Interest coverage ratio EBIT/Interest Expense
EBITDA to Interest coverage ratio EBITDA/Interest Expense
Operating Cash-flow to Interest coverage ratio Operating Cash-flow/Interest Expense
Operating Cash-flow to Short-term Debt Operating Cash-flow/Current Financial Liabilities
Operating Cash-flow to Long-term Debt Operating Cash-flow/Non-current Financial Liabilities
Financial Debt Non-current Borrowings + Other Non-current Financial Liabilities + Current Borrowings + Other Current Financial Liabilities
Net Financial Debt Financial Debt - Cash and Cash Equivalents
Gross Profit Revenue - Cost of Sales
Operating Costs Distribution, Marketing and Administrative expense
Other Income and (Expense) Other Income - Other Expense
EBIT Gross Profit - Operating Costs +/- Other Income and (Expense) +/- Other Gains (Losses)
EBITDA EBIT + Depreciation and Amortization
Net Working Capital Current Assets - Current Liabilities

53
Abbreviations
NO ASSETS The company's Total Assets are zero
NO EQUITY The book value of Equity is zero or negative
NO LIABILITIES Total Liabilities are zero
NO CL Current Liabilities are zero
NO DEBT Financial debt is zero
NO NFP Net financial debt is zero or negative, but financial debt is not. Net financial debt is given by Debt less cash and cash equivalents.
NO SD Current Financial Debt is zero
NO LD Non-current Financial Debt is zero
NO SALES The company did not collect any revenue
NO EBITDA EBITDA is zero or negative
NO EBIT EBIT is zero or negative
NO FC No Finance Charges. The company did not incur any interest expense.
NO CF Operating Cash-flow is zero or negative