first half-year 2017 - allianz · 6 life/health insurance operations ... 23 consolidated statements...
TRANSCRIPT

FIRST HALF-YEAR2017
Allianz Group Interim Report 2017

To go directly to any chapter, simply click on the headline or the page number.
All references to chapters, pages, notes, internet pages, etc. within this report are also linked.
CONTENT
A _ Interim Group Management Report Pages 1 - 18
2 Executive Summary
4 Property-Casualty Insurance Operations
6 Life/Health Insurance Operations
9 Asset Management
11 Corporate and Other
12 Outlook
14 Balance Sheet Review
16 Reconciliations
B _ Condensed Consolidated Interim Financial Statements Pages 19 - 46
20 Consolidated Balance Sheets
21 Consolidated Income Statements
22 Consolidated Statements of Comprehensive Income
23 Consolidated Statements of Changes in Equity
24 Consolidated Statements of Cash Flows
NOTES TO THE CONDENSED CONSOLIDATED INTERIM FINANCIAL STATEMENTS 26 General Information
33 Notes to the Consolidated Balance Sheets
38 Notes to the Consolidated Income Statements
42 Other Information
C _ Further Information Pages 47 - 49
48 Responsibility Statement
49 Review Report
Disclaimer regarding roundings The consolidated financial statements are presented in millions of Euros (€ MN) unless otherwise stated. Due to rounding, numbers presented may not add up precisely to thetotals provided and percentages may not precisely reflect the absolute figures.
Guideline on Alternative Performance Measures For further information on the definition of our Alternative Performance Measuresand their components, as well as the basis of calculation adopted, please refer towww.allianz.com/results.

Interim Report for the First Half-Year of 2017 − Allianz Group 1
INTERIM GROUP MANAGEMENT REPORT

A – Interim Group Management Report
Interim Report for the First Half-Year of 2017 — Allianz Group 2
Key figures
KEY FIGURES ALLIANZ GROUP1
six months ended 30 June 2017 2016 Delta
Total revenues2 € mn 66,218 64,759 1,459
Operating profit3,4,5
€ mn 5,860 5,063 797
Net income3,4
€ mn 4,013 3,425 587
thereof: attributable to shareholders4 € mn 3,810 3,231 579
Solvency II capitalization ratio6,7
% 219 218 2 %-p
Return on equity4,8
% 13.4 12.3 1.2 %-p
Earnings per share4 € 8.45 7.10 1.35
Diluted earnings per share4 € 8.44 6.92 1.52
Earnings summary2,3,4,5,6,7,8
ECONOMIC AND INDUSTRY ENVIRONMENT The world economy currently finds itself in fairly good shape and has
gained some momentum in the course of the first half of 2017. Most
industrialized countries have registered solid growth. The U.S.
economy experienced only subdued growth in the first quarter of
2017, then firmed up somewhat in the second quarter. In the Euro-
zone, economic recovery continued. Private consumption benefited
from rising employment. In the emerging markets, economic mo-
mentum improved as well. Growth in emerging Asian economies was
supported by an acceleration in world trade and stable growth in
China. Russia, having experienced two years of recession, enjoyed
positive albeit weak growth.
The heightened global political uncertainty failed to rattle the fi-
nancial markets; stock market volatility in the first half-year was –
overall – low. On the monetary policy front, in light of slightly better-
than-expected Eurozone economic data, the European Central Bank
started to tweak its forward guidance. Although the changes in com-
munication were cautious, markets reacted sensitively to the pro-
spect of potential tapering by the European Central Bank. In the
United States, the Federal Reserve continued to raise the federal
funds rate: In both March and June, it lifted the target policy rate
range by 25 basis points, bringing it to 1.0 to 1.25 %. Moreover, in June
1_For further information on Allianz Group figures, please refer to note 4 to the condensed consolidated
interim financial statements.
2 _Total revenues comprise statutory gross premiums written in Property-Casualty and Life/Health,
operating revenues in Asset Management, and total revenues in Corporate and Other (Banking).
3_The Allianz Group uses operating profit and net income as key financial indicators to assess the perfor-
mance of its business segments and of the Group as a whole.
4_Prior year figures have been adjusted in order to reflect the impact resulting from an accounting policy
change to measure the Guaranteed Minimum Income Benefit (GMIB) liability at fair value for our life
business. For further information, please refer to note 2 to the condensed consolidated interim financial
statements.
5_In light of the new operating profit definition, restructuring charges are reported outside of operating
profit unless shared with policyholders. Prior year figures have been adjusted accordingly.
6_2016 figures as of 31 December 2016, 2017 figures as of 30 June 2017.
7_Risk capital figures are group diversified at 99.5 % confidence level. Allianz Life US included based on
third country equivalence with 150 % of “Risk Based Capital Company Action Level” since 30 September
2015.
8_Represents the annualized ratio of net income attributable to shareholders to the average shareholders’
equity excluding unrealized gains/losses on bonds, net of shadow accounting, at beginning of the period
and at end of the period. Annualized figures are not a forecast for full year numbers. For 2016, the return
on equity for the full year is shown.
the Federal Reserve announced its intention to begin implementing a
balance sheet normalization program this year.
Yields on 10-year German government bonds closed the end of
June 2017 at 0.5 %, about 30 basis points higher than at year-end 2016.
Spreads on Eurozone government bonds moved in different direc-
tions. Spreads on French government bonds benefited from the
outcome of the presidential and parliamentary elections and ended
the first half-year at 35 basis points. Major stock markets around the
globe showed positive performance, with a number of indices reach-
ing new all-time highs. The Euro appreciated strongly against the U.S.
Dollar in the first half of 2017. The U.S. Dollar-to-Euro exchange rate
was 1.14 at the end of June 2017 (end of 2016: 1.05).
For the insurance industry, the first half of 2017 presented a ra-
ther mixed environment: While top lines grew in many markets,
yields remained suppressed and insured losses form natural catas-
trophes remained relatively high, albeit below the long-term average.
In particular the U.S. market had to cope with numerous tornadoes,
hail storms, floods, and mudslides. As a consequence, bottom lines
remained under pressure. Added to that the digital transformation,
which continues to gather speed, thus increasing competition and
forcing insurers to adapt their business models as quickly as possible.
In the asset management industry, fund flows accelerated, par-
ticularly in the United States and Germany, both into bonds and into
riskier asset types such as multi-assets and equity products. In the
last week of June, bonds experienced a global sell-off, especially in the
United States, as major central banks signaled they were considering
a less accommodative monetary policy for the near future.
MANAGEMENT’S ASSESSMENT Our total revenues went up 2.3 %, in the first half of 2017 – a 2.6 %
increase on an internal basis9 compared to the same period of the
previous year. All business segments contributed to this, with the
Life/Health business segment registering the strongest increase,
mainly due to premium growth in capital-efficient products in Ger-
many as well as in unit-linked products in Asia-Pacific and Italy.
Our operating investment result decreased by € 14 mn to
€ 12,083 mn. We recorded higher operating losses from financial
assets and liabilities carried at fair value through income (net), large-
ly due to a negative impact from fixed income duration management
in our German Life business. In addition, operating realized
gains/losses (net) declined as a result of lower debt realizations. We
also recorded lower equity impairments, as the first half of 2016 had
seen a downturn of some of the major equity markets.
9_Internal total revenue growth excludes the effects of foreign currency translation as well as acquisitions
and disposals. Please refer to page 16 for a reconciliation of nominal total revenue growth to internal
total revenue growth for each of our business segments and the Allianz Group as a whole.
Executive Summary

A _ Interim Group Management Report
Interim Report for the First Half-Year of 2017 — Allianz Group 3
Our operating profit1 went up, mostly owing to our Life/Health
business segment, which recorded higher investment margins main-
ly in the United States, Spain, and the German life business, as well as
higher technical margins in the United States and France. Our Asset
Management business segment recorded strong operating profit
growth, largely due to increased average third-party assets under
management at PIMCO, as the first half of 2017 saw a high level of
third-party net inflows. Operating profit also increased in our Proper-
ty-Casualty business segment, mainly because the underwriting
result benefited from lower claims from natural catastrophe events
but also as an effect of profitability improvements at our operating
entities. An increase in the operating result recorded by our Corpo-
rate and Other business segment was driven by both the Holding &
Treasury and Banking reportable segments.
Our non-operating result improved by € 69 mn to a loss of
€ 263 mn. This development was impacted by lower realized gains
and increased restructuring charges while the comparison period
was burdened by the negative net impact from our South Korean
Life/Health business.
Income taxes increased by € 278 mn to € 1,585 mn and the effec-
tive tax rate increased to 28.3 % (6M 2016: 27.6 %), mainly driven by
less tax-free income.
The increase in net income reflects the higher operating profit,
partly offset by the rise in income taxes.
Our shareholders’ equity2 decreased by € 2.9 bn to € 64.2 bn, with
€ 1.6 bn of this decrease being attributable to the share buy-back
program. During the first half-year of 2017, Allianz SE purchased
approximately 9.6 million own shares as part of its share-buy-back
program announced in February 2017 with a total volume of up to
€ 3.0 bn.3 Over the same period, our Solvency II capitalization ratio
grew to 219 %.
For a more detailed description of the results generated by our
business segments – specifically, Property-Casualty insurance opera-
tions, Life/Health insurance operations, Asset Management, and
Corporate and Other – please consult the respective chapter s on the
following pages.
Risk and opportunity management
In our Annual Report 2016, we have described our opportunity and
risk profile and addressed potential risks that could adversely affect
our business as well as our risk profile. The statements contained in
that report remain largely unchanged. We continue to monitor de-
velopments in order to be able to react in a timely and appropriate
manner, should the need arise. For further information, please refer
to the chapter Outlook, which starts on page 12.
Events after the balance sheet date
For information on events after the balance sheet date, please refer to
note 33 to the condensed consolidated interim financial statements.
1_Prior year figures have been adjusted due to an updated operating profit definition and an accounting
policy change. For further information, please refer to note 4 and note 2, respectively, to the condensed
consolidated interim financial statements.
2_For further information on shareholders‘ equity, please refer to page 14 of the Balance Sheet chapter.
3_For further information on the share buy-back program, please refer to note 17 to the condensed
consolidated interim financial statements.
Other information
RECENT ORGANIZATIONAL CHANGES Effective 1 January 2017, the Allianz Group reorganized the structure
of its insurance activities to reflect the changes in the responsibilities
of the Board of Management. The former reportable segment Asia
Pacific has been allocated to the reportable segment Western &
Southern Europe, Middle East, Africa, Asia Pacific. Previously reported
information has been adjusted to reflect this change in the composi-
tion of the Allianz Group’s reportable segments.
Additionally, some minor reallocations between the reportable
segments have been made.
STRATEGY The Allianz Group’s strategy is described in the Risk and Opportunity
Report in our Annual Report 2016. There have been no material
changes to our Group strategy.
PRODUCTS, SERVICES AND SALES CHANNELS For an overview of the products and services offered by the Allianz
Group as well as of sales channels, please refer to the Business Opera-
tions chapter in our Annual Report 2016.
ALLIANZ GROUP AND BUSINESS SEGMENTS The Allianz Group operates and manages its activities through four
business segments, which have all been mentioned above. For fur-
ther information, please refer to note 4 to the condensed consolidat-
ed interim financial statements or to the Business Operations chap-
ter in our Annual Report 2016.
ALLIANZ AND LIVERPOOL VICTORIA TO LAUNCH JOINT VENTURE IN THE UNITED KINGDOM PERSONAL INSURANCE MARKET Liverpool Victoria (LV=) will receive £ 500 mn from Allianz in ex-
change for a 49 percent stake in Liverpool Victoria General Insurance
(LV= GI). The new, long-term joint venture LV= GI, will acquire
Allianz’s personal home and motor insurer’s renewal rights while
Allianz will obtain LV= GI’s commercial insurer’s renewal rights. For
further information, please refer to note 33 to the condensed consoli-
dated interim financial statements.

A – Interim Group Management Report
Interim Report for the First Half-Year of 2017 — Allianz Group 4
Key figures
KEY FIGURES PROPERTY-CASUALTY1 2345
six months ended 30 June 2017 2016 Delta
Gross premiums written € mn 29,388 28,856 532
Operating profit2 € mn 2,705 2,572 133
Net income € mn 2,070 1,922 148
Loss ratio3 % 66.0 66.4 (0.4) %-p
Expense ratio4 % 28.6 28.4 0.2 %-p
Combined ratio5 % 94.6 94.9 (0.2) %-p
Gross premiums written6
On a nominal basis, we recorded an increase in gross premiums
written compared to the first six months of the previous year.
Foreign currency translation effects amounted to € 1 mn.7 Con-
solidation/deconsolidation effects were positive at € 176 mn, largely
due to a portfolio purchase in the Netherlands and the acquisition of
a new insurance entity in Morocco.
On an internal basis, our premiums went up 1.2 %, driven by a
positive price effect of 1.1 % and a positive volume effect of 0.2 %.
The following operations contributed positively to internal growth:
AWP: Gross premiums grew to € 2,749 mn – an increase of 9.1 %
on an internal basis. It was owed to our U.S. travel business and our
assistance business in France.
Germany: Gross premiums amounted to € 6,251 mn. This inter-
nal growth of 1.8 % was mainly due to positive price effects in our
motor insurance business. Spain: Gross premiums stood at € 1,325 mn – up 6.1 % on an in-
ternal basis. This was driven by positive price and volume effects
across the portfolio.
The following operations contributed negatively to internal growth:
AGCS: Gross premiums fell to € 3,939 mn – a decrease of 8.6 % on
an internal basis. It was largely due to seasonality effects at Allianz
Risk Transfer, as well as to the discontinuation of our U.S. crop busi-
ness and re-underwriting activities in our marine business.
Turkey: Gross premiums decreased to € 644 mn. This decrease –
8.3 % on an internal basis – largely resulted from our strategic with-
drawal from the motor third-party liability insurance business fol-
lowing a regulatory change.
1_For further information on Allianz Property-Casualty figures, please refer to note 4 to the condensed
consolidated interim financial statements.
2_In light of the new operating profit definition, restructuring charges are reported outside of operating
profit unless shared with policyholders. Prior year figures have been adjusted accordingly.
3_Represents claims and insurance benefits incurred (net) divided by premiums earned (net).
4_Represents acquisition and administrative expenses (net) divided by premiums earned (net).
5_Represents the total of acquisition and administrative expenses (net) and claims and insurance benefits
incurred (net) divided by premiums earned (net).
6_We comment on the development of our gross premium written on an internal basis, which means
figures have been adjusted for foreign currency translation and (de-)consolidation effects in order to
provide more comparable information.
7_Based on the average exchange rates in 2017 compared to 2016.
Italy: Gross premiums amounted to € 2,225 mn. The decline of
1.9 % on an internal basis resulted from unfavorable price effects in
our motor insurance business.
Operating profit
OPERATING PROFIT € MN
six months ended 30 June 2017 2016 Delta
Underwriting result 1,136 1,045 91
Operating investment income (net) 1,490 1,473 17
Other result1 79 54 25
Operating profit 2,705 2,572 133
1_Consists of fee and commission income/expenses and other income/expenses.
Our operating profit increased, compared to the same period of the
previous year. This was mainly driven by the fact that our underwrit-
ing result benefited from lower claims from natural catastrophe
events, but also from wide-spread profitability improvements across
our operating entities.
A strong improvement on the claims side was partially offset by
a lower contribution of run-off compared to the previous year and, to
a smaller extent, by a slight deterioration on the expenses side. Our
combined ratio improved by 0.2 percentage points to 94.6 %.
UNDERWRITING RESULT € MN
six months ended 30 June 2017 2016 Delta
Premiums earned (net) 23,557 22,823 735
Accident year claims (16,326) (16,302) (23)
Previous year claims (run-off) 770 1,141 (371)
Claims and insurance benefits incurred (net) (15,556) (15,162) (394)
Acquisition and administrative expenses (net) (6,739) (6,492) (247)
Change in reserves for insurance and investment contracts (net) (without expenses for premium refunds)
1 (127) (124) (3)
Underwriting result 1,136 1,045 91
1_Consists of the underwriting-related part (aggregate policy reserves and other insurance reserves) of
"change in reserves for insurance and investment contracts (net)". For further information, please refer
to note 24 to the condensed consolidated interim financial statements.
Our accident year loss ratio8 stood at 69.3 % – a 2.1 percentage point
improvement compared to the first half of the previous year. In the
first six months of this year our losses from natural catastrophes
were lower than in the same period of 2016, reducing the impact on
our combined ratio from 2.3 % to 1.1 %, representing a decrease of 1.2
percentage points.
Excluding losses from natural catastrophes, our accident year
loss ratio improved to 68.2 %. This was mainly due to profitability
improvements across the Allianz Group.
8_Represents claims and insurance benefits incurred (net) less previous year claims (run-off), divided by
premiums earned (net).
Property-Casualty Insurance Operations

A _ Interim Group Management Report
Interim Report for the First Half-Year of 2017 — Allianz Group 5
The following operations contributed positively to the development
of our accident year loss ratio:
AGCS: 1.0 percentage points. The accident year loss ratio bene-
fited from the absence of natural catastrophes in 2017, as opposed to
the first half-year of 2016.
France: 0.3 percentage points. The improvement resulted from
lower losses from natural catastrophe events but also from an im-
provement in the attritional profitability.
Germany: 0.2 percentage points. This was driven by a benign
natural catastrophe environment.
The following operation contributed negatively to the development of
our accident year loss ratio:
Australia: 0.2 percentage points. This was driven by higher losses
from natural catastrophes but also by a customer reimbursement for
unused insurance.
Our positive run-off result amounted to € 770 mn, compared to
€ 1,141 mn in the first half-year of 2016. This translates into a run-off
ratio of 3.3 %. The reduction in run-off is due to the fact we had seen a
more positive loss development in previous years at our reinsurance
operation as well as reserve releases from short-tail lines at AGCS in
the first six months of 2016. Furthermore, we saw a negative impact
in the beginning of 2017 stemming from the Ogden rate change
which affected our operations Reinsurance, United Kingdom and
Ireland.
Total expenses amounted to € 6,739 mn in the first half of 2017,
compared to € 6,492 mn in the same period of 2016. Our expense ratio
increased by 0.2 percentage points. This was mainly due to higher
administrative expenses.
OPERATING INVESTMENT INCOME (NET)
€ MN
six months ended 30 June 2017 2016 Delta
Interest and similar income (net of interest expenses) 1,708 1,688 20
Operating income from financial assets and liabilities carried at fair value through income (net) (51) (25) (26)
Operating realized gains (net) 152 157 (5)
Operating impairments of investments (net) (6) (43) 37
Investment expenses (183) (175) (8)
Expenses for premiums refunds (net)1
(131) (129) (2)
Operating investments income (net)
2 1,490 1,473 17
1_Refers to policyholder participation, mainly from APR business (accident insurance with premium
refunds), and consists of the investment-related part of "change in reserves for insurance and
investment contracts (net)". For further information, please refer to note 24 to the condensed
consolidated interim financial statements.
2_The operating investment income (net) of our Property-Casualty business segment consists of the
operating investment result - as shown in note 4 to the condensed consolidated interim financial
statements - and expenses for premium refunds (net) (policyholder participation).
Our operating investment income (net) increased slightly, mainly due
to lower impairments on equities in our APR business (accident
insurance with premium refunds) and higher net interest and simi-
lar income, partially offset by an unfavorable foreign currency trans-
lation result net of hedging.
The positive development of the net interest and similar income
resulted from higher income from equities that overcompensated
the lower income on debt securities.
OTHER RESULT € MN
six months ended 30 June 2017 2016 Delta
Fee and commission income 911 759 152
Other income 32 1 31
Fee and commission expenses (864) (706) (158)
Other expenses - - -
Other result 79 54 25
Our other result increased, mainly driven by realized gains from the
sale of real estate held for own use by our Italian subsidiary.
Net income
Net income increased, primarily driven by the increase in operating
profit and lower income taxes.
A – Interim Group Management Report
Interim Report for the First Half-Year of 2017 — Allianz Group 6
Key figures
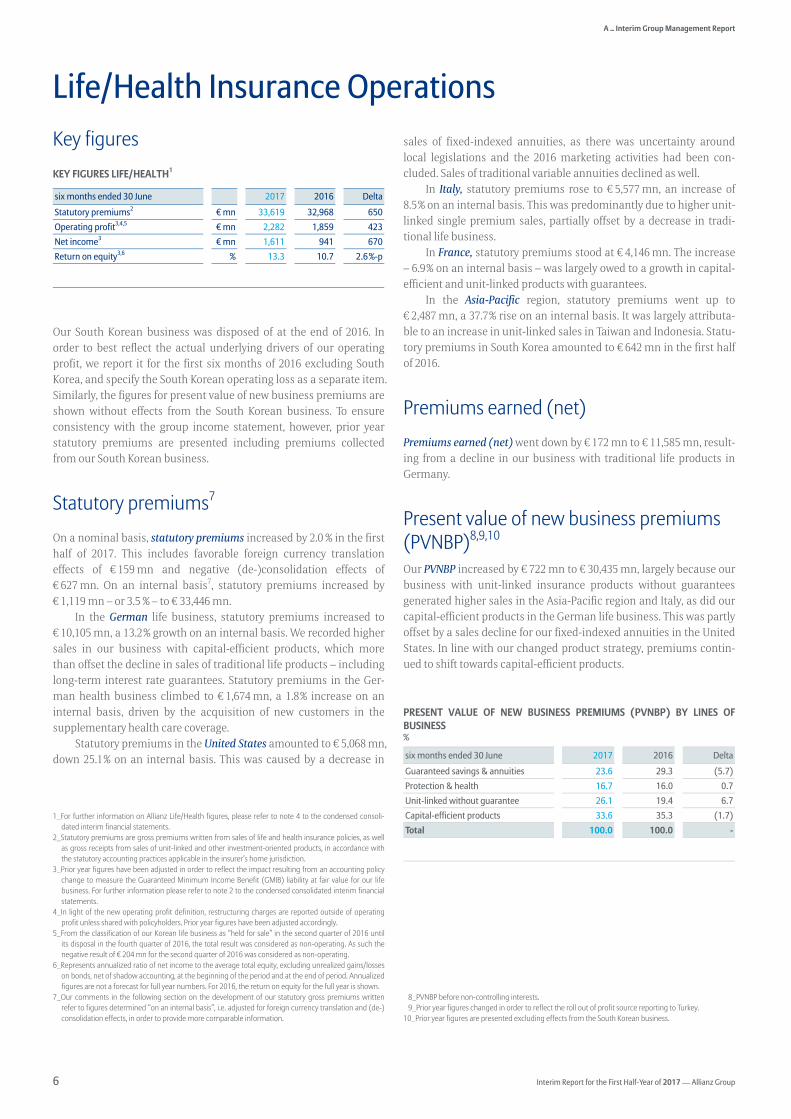
KEY FIGURES LIFE/HEALTH1
six months ended 30 June 2017 2016 Delta
Statutory premiums2 € mn 33,619 32,968 650
Operating profit3,4,5
€ mn 2,282 1,859 423
Net income3 € mn 1,611 941 670
Return on equity3,6
% 13.3 10.7 2.6 %-p
Our South Korean business was disposed of at the end of 2016. In
order to best reflect the actual underlying drivers of our operating
profit, we report it for the first six months of 2016 excluding South
Korea, and specify the South Korean operating loss as a separate item.
Similarly, the figures for present value of new business premiums are
shown without effects from the South Korean business. To ensure
consistency with the group income statement, however, prior year
statutory premiums are presented including premiums collected
from our South Korean business. 2,3,4,5,6,
Statutory premiums7
On a nominal basis, statutory premiums increased by 2.0 % in the first
half of 2017. This includes favorable foreign currency translation
effects of € 159 mn and negative (de-)consolidation effects of
€ 627 mn. On an internal basis7, statutory premiums increased by
€ 1,119 mn – or 3.5 % – to € 33,446 mn.
In the German life business, statutory premiums increased to
€ 10,105 mn, a 13.2 % growth on an internal basis. We recorded higher
sales in our business with capital-efficient products, which more
than offset the decline in sales of traditional life products – including
long-term interest rate guarantees. Statutory premiums in the Ger-
man health business climbed to € 1,674 mn, a 1.8 % increase on an
internal basis, driven by the acquisition of new customers in the
supplementary health care coverage.
Statutory premiums in the United States amounted to € 5,068 mn,
down 25.1 % on an internal basis. This was caused by a decrease in
1_For further information on Allianz Life/Health figures, please refer to note 4 to the condensed consoli-
dated interim financial statements.
2_Statutory premiums are gross premiums written from sales of life and health insurance policies, as well
as gross receipts from sales of unit-linked and other investment-oriented products, in accordance with
the statutory accounting practices applicable in the insurer’s home jurisdiction.
3_Prior year figures have been adjusted in order to reflect the impact resulting from an accounting policy
change to measure the Guaranteed Minimum Income Benefit (GMIB) liability at fair value for our life
business. For further information please refer to note 2 to the condensed consolidated interim financial
statements.
4_In light of the new operating profit definition, restructuring charges are reported outside of operating
profit unless shared with policyholders. Prior year figures have been adjusted accordingly.
5_From the classification of our Korean life business as “held for sale” in the second quarter of 2016 until
its disposal in the fourth quarter of 2016, the total result was considered as non-operating. As such the
negative result of € 204 mn for the second quarter of 2016 was considered as non-operating.
6_Represents annualized ratio of net income to the average total equity, excluding unrealized gains/losses
on bonds, net of shadow accounting, at the beginning of the period and at the end of period. Annualized
figures are not a forecast for full year numbers. For 2016, the return on equity for the full year is shown.
7_Our comments in the following section on the development of our statutory gross premiums written
refer to figures determined “on an internal basis”, i.e. adjusted for foreign currency translation and (de-)
consolidation effects, in order to provide more comparable information.
sales of fixed-indexed annuities, as there was uncertainty around
local legislations and the 2016 marketing activities had been con-
cluded. Sales of traditional variable annuities declined as well.
In Italy, statutory premiums rose to € 5,577 mn, an increase of
8.5 % on an internal basis. This was predominantly due to higher unit-
linked single premium sales, partially offset by a decrease in tradi-
tional life business.
In France, statutory premiums stood at € 4,146 mn. The increase
– 6.9 % on an internal basis – was largely owed to a growth in capital-
efficient and unit-linked products with guarantees.
In the Asia-Pacific region, statutory premiums went up to
€ 2,487 mn, a 37.7 % rise on an internal basis. It was largely attributa-
ble to an increase in unit-linked sales in Taiwan and Indonesia. Statu-
tory premiums in South Korea amounted to € 642 mn in the first half
of 2016.
Premiums earned (net)
Premiums earned (net) went down by € 172 mn to € 11,585 mn, result-
ing from a decline in our business with traditional life products in
Germany.
Present value of new business premiums (PVNBP)8,9,10 Our PVNBP increased by € 722 mn to € 30,435 mn, largely because our
business with unit-linked insurance products without guarantees
generated higher sales in the Asia-Pacific region and Italy, as did our
capital-efficient products in the German life business. This was partly
offset by a sales decline for our fixed-indexed annuities in the United
States. In line with our changed product strategy, premiums contin-
ued to shift towards capital-efficient products.
PRESENT VALUE OF NEW BUSINESS PREMIUMS (PVNBP) BY LINES OF
BUSINESS %
six months ended 30 June 2017 2016 Delta
Guaranteed savings & annuities 23.6 29.3 (5.7)
Protection & health 16.7 16.0 0.7
Unit-linked without guarantee 26.1 19.4 6.7
Capital-efficient products 33.6 35.3 (1.7)
Total 100.0 100.0 -
8_PVNBP before non-controlling interests.
9_Prior year figures changed in order to reflect the roll out of profit source reporting to Turkey.
10_Prior year figures are presented excluding effects from the South Korean business.
Life/Health Insurance Operations

A _ Interim Group Management Report
Interim Report for the First Half-Year of 2017 — Allianz Group 7
Operating profit
OPERATING PROFIT BY PROFIT SOURCES1,2
OPERATING PROFIT BY PROFIT SOURCES € MN
six months ended 30 June 2017 2016 Delta
Loadings and fees 2,949 2,770 179
Investment margin 2,082 1,861 221
Expenses (3,349) (3,359) 10
Technical margin 549 480 69
Impact of changes in DAC 52 190 (138)
Operating loss – South Korea1 - (82) 82
Operating profit 2,282 1,859 423
1_The 2016 figure represents the operating loss of the first quarter only, as the negative result for the
second quarter of 2016 was considered as non-operating.
Our operating profit rose, as we achieved higher investment margins
mainly in the United States, Spain, and the German life business, as
well as higher technical margins in the United States and France.
LOADINGS AND FEES3
LOADINGS AND FEES € MN
six months ended 30 June 2017 2016 Delta
Loadings from premiums 1,916 1,845 71
Loadings from reserves 720 649 71
Unit-linked management fees 313 276 37
Loadings and fees1 2,949 2,770 179
Loadings from premiums as % of statutory premiums 5.7 5.7 -
Loadings from reserves as % of average reserves
2,3 0.1 0.1 -
Unit-linked management fees as % of average unit-linked reserves
3,4 0.2 0.2 -
1_Prior year figures are presented excluding the effects from the South Korean business.
2_Aggregate policy reserves and unit-linked reserves.
3_Yields are pro rata.
4_Unit-linked management fees, excluding asset management fees, divided by unit-linked reserves.
Loadings from premiums went up in line with the higher sales, mainly
in the German life business, and in the Asia-Pacific region. The
growth in loadings from reserves was attributable to higher reserve
volume, largely in the United States. Unit-linked management fees
increased driven by Italy.
1_Prior year figures changed in order to reflect the roll out of profit source reporting to Turkey.
2_The purpose of the Life/Health operating profit sources analysis is to explain movements in IFRS results
by analyzing underlying drivers of performance on a Life/Health business segment consolidated basis.
3 _Loadings and fees include premium and reserve based fees, unit-linked management fees, and
policyholder participation in expenses.
INVESTMENT MARGIN4
INVESTMENT MARGIN € MN
six months ended 30 June 2017 2016 Delta
Interest and similar income 9,056 8,905 151
Operating income from financial assets and liabilities carried at fair value through income (net) (965) (551) (414)
Operating realized gains/losses (net) 2,916 3,112 (197)
Interest expenses (49) (56) 7
Operating impairments of investments (net) (255) (934) 679
Investment expenses (609) (544) (64)
Other1 271 55 216
Technical interest (4,401) (4,358) (43)
Policyholder participation (3,882) (3,768) (114)
Investment margin2 2,082 1,861 221
Investment margin in basis points3,4
49.3 45.8 3.5
1_Other comprises the delta of out-of-scope entities, on the one hand, which are added here with their
respective operating profit and different line item definitions compared to the financial statements,
such as interest paid on deposits for reinsurance, fee and commission income and expenses excluding
unit-linked management fees on the other hand.
2_Prior year figures are presented excluding the effects from the South Korean business.
3_Investment margin divided by the average of current end-of-period and previous end-of-period
aggregate policy reserves.
4_Yields are pro rata.
Our investment margin increased mainly due to lower equity im-
pairments in Germany and favorable market conditions in our varia-
ble annuities business in the United States. This was partly offset by
the negative impacts from our fixed income derivatives in the Ger-
man life business.
EXPENSES5
EXPENSES € MN
six months ended 30 June 2017 2016 Delta
Acquisition expenses and commissions (2,451) (2,487) 36
Administrative and other expenses (898) (872) (26)
Expenses1 (3,349) (3,359) 10
Acquisition expenses and commissions as % of PVNBP
2 (8.1) (8.4) 0.3
Administrative and other expenses as % of average reserves
3, 4 (0.2) (0.2) -
1_Prior year figures are presented excluding the effects from the South Korean business.
2_PVNBP before non-controlling interests.
3_Aggregate policy reserves and unit-linked reserves.
4_Yields are pro rata.
4_The investment margin is defined as IFRS investment income net of expenses, less interest credited to
IFRS reserves and policyholder participation (including policyholder participation beyond contractual
and regulatory requirements mainly for the German life business).
5_Expenses include acquisition expenses and commissions (excluding commission clawbacks, which are
allocated to the technical margin) as well as administrative and other expenses.

A – Interim Group Management Report
Interim Report for the First Half-Year of 2017 — Allianz Group 8
Our acquisition expenses and commissions decreased, predominantly
due to declined sales in the fixed-indexed annuities business in the
United States. It was partly offset by higher expenses due to sales
growth in our German life business and in Asia-Pacific.
Administrative and other expenses remained stable in relation to
reserves.
TECHNICAL MARGIN1 Our technical margin increased, as the first half of 2016 was burdened
by one-off reserve adjustments predominantly in the United States. A
reserve release for unclaimed contracts in France also contributed to
this development.
IMPACT OF CHANGE IN DEFERRED ACQUISITION COSTS (DAC)2
IMPACT OF CHANGE IN DAC € MN
six months ended 30 June 2017 2016 Delta
Capitalization of DAC 866 1,003 (137)
Amortization, unlocking and true-up of DAC (814) (813) (1)
Impact of change in DAC1 52 190 (138)
1_Prior year figures are presented excluding the effects from the South Korean business.
The decrease in the impact of change in DAC was due to lower capital-
ization of DAC, resulting mainly from decreased sales in fixed-
indexed annuities in the United States.
OPERATING PROFIT BY LINES OF BUSINESS3
OPERATING PROFIT BY LINES OF BUSINESS € MN
six months ended 30 June 2017 2016 Delta
Guaranteed savings & annuities 1,216 986 230
Protection & health 457 339 118
Unit-linked without guarantee 185 176 9
Capital-efficient products 425 440 (15)
Operating loss – South Korea1 - (82) 82
Operating profit 2,282 1,859 423
1_The 2016 figure represents the operating loss of the first quarter only, as the negative result for the
second quarter of 2016 was considered as non-operating.
The operating profit in our guaranteed savings & annuities line of
business went up. Much of the increase was contributed by our tradi-
tional variable annuities business in the United States, which bene-
fited from favorable market movements. The higher operating profit
in the protection & health line of business was largely driven by a
1_Technical margin comprises risk result (risk premiums less benefits in excess of reserves less policy-
holder participation), lapse result (surrender charges and commission clawbacks) and reinsurance
result.
2_Impact of change in DAC includes effects of change in DAC, unearned revenue reserves (URR) and value
of business acquired (VOBA). It represents the net impact of deferral and amortization of acquisition
costs and front-end loadings on operating profit and therefore deviates from the IFRS financial state-
ments.
3_Prior year figures changed in order to reflect the roll out of profit source reporting to Turkey.
higher technical margin in the German health business. Our operat-
ing profit in the unit-linked without guarantee line of business went
up slightly, too, which was primarily due to higher unit-linked fees in
Italy. A decrease in operating profit in the capital-efficient products
line was largely attributable to lower investment margin in the Unit-
ed States.
Return on equity
Our return on equity increased by 2.6 percentage points to 13.3 %
because – among other factors – the 2016 number had been negative-
ly impacted by the unfavorable development of our South Korean
business.
Net income
The increase in our net income was largely owed to our operating
performance and the fact that the prior year’s net income had been
negatively affected by our business in South Korea.

A _ Interim Group Management Report
Interim Report for the First Half-Year of 2017 — Allianz Group 9
Key figures
KEY FIGURES ASSET MANAGEMENT1
six months ended 30 June 2017 2016 Delta
Operating revenues € mn 3,114 2,827 287
Operating profit2 € mn 1,156 960 196
Cost-income ratio3 % 62.9 66.1 (3.2) %-p
Net income € mn 735 615 120
Total assets under management as of 30 June
4 € bn 1,915 1,871 44
thereof: Third-party assets under management as of 30 June
4 € bn 1,406 1,361 45
Assets under management
COMPOSITION OF TOTAL ASSETS UNDER MANAGEMENT € BN
Net inflows5 of total assets under management (AuM) amounted to
€ 73 bn, driven by third-party AuM net inflows of € 74 bn. Most of
these third-party inflows occurred in the second quarter: They
amounted to € 55 bn net and represented a quarterly record high,
which was supported by one large mandate amounting to € 19 bn.
Almost all of the first half-year’s third-party AuM net inflows are
attributable to PIMCO, where we recorded € 73 bn. AllianzGI recorded
third-party net inflows of € 2 bn.
Favorable effects from Market and Other6 contributed € 41 bn to
the increase in total AuM. This was mainly driven by fixed income
assets at PIMCO and – to a lesser extent – by equities at AllianzGI.
Effects from consolidation, deconsolidation and other adjust-
ments added € 13 bn to total AuM.
Negative foreign currency translation effects amounted to
€ 83 bn and were primarily driven by the depreciation of the U.S.
Dollar and the British Pound against the Euro. Despite these negative
effects, total AuM increased overall by 2.4 %.
In the following section we focus on the development of third-
party assets under management.
As of 30 June 2017, the share of third-party AuM by business unit
remained stable at 76.0 % (31 December 2016: 76.1 %) attributable to
PIMCO and 24.0 % (31 December 2016: 23.9 %) attributable to AllianzGI.
The share of fixed income assets rose from 75.5 % to 76.2 % over
the first half-year, mainly driven by strong third-party AuM net in-
flows and positive market effects. The shares of equities, multi-assets
and other decreased slightly or remained stable, at 9.8 %, 10.0 % and
4.0 %, respectively, while their absolute volumes remained almost
unchanged (31 December 2016: 10.3 %, 10.0 % and 4.2 %, respectively).
The shares in third-party assets of both mutual funds and sepa-
rate accounts7 were quite steady compared to year-end 2016, with
mutual funds at 58.1 % (31 December 2016: 57.8 %) and separate
accounts at 41.9 % (31 December 2016: 42.2 %).
As for the regional allocation of third-party AuM8 , shares shifted
in favor of Europe (33.8 %), while the share of America declined (54.3 %)
and the share of the Asia-Pacific region remained stable (11.8 %)
(31 December 2016: 32.8 %, 55.3 % and 11.9 %, respectively). The shift
was primarily driven by third-party AuM net inflows and positive
market effects in the United Kingdom, which outpaced the overall
favorable effects in the other regions. The decrease in America was
due to the weakening of the U.S. Dollar, which mitigated the region’s
AuM increase from net inflows and positive market effects.
The overall three-year rolling investment performance9 of our
Asset Management business increased over the first half of 2017, with
87 % of third-party assets outperforming their respective benchmarks
(31 December 2016: 83 %). The increase was driven by both PIMCO’s
and AllianzGI’s three year rolling investment performance, which
rose from 88 % to 91 % and from 63 % to 70 %, respectively.
Asset Management
Type of asset class
as of 30 June
2017
as of 31 December
2016 Delta
Fixed income 1,519 1,489 30
Equities 164 166 (2)
Multi-assets1 156 153 3
Other2 77 63 13
Total 1,915 1,871 44 1_Multi-assets is a combination of several asset classes (e.g. bonds, stocks, cash and real property) used
as an investment. Multi-assets class investments increase the diversification of an overall portfolio by
distributing investments throughout several asset classes.
2_Other is composed of other asset classes than equity, fixed income and multi-assets, e.g. money
markets, commodities, real estate investment trusts, infrastructure investments, private equity
investments, hedge funds, etc.
6_Market and Other represents current income earned on, and changes in the fair value of, securities held
in client accounts. It also includes dividends from net investment income and from net realized capital
gains to investors of open ended mutual funds and of closed end funds.
7_Mutual funds are investment vehicles (in the United States, investment companies subject to the U.S.
code; in Germany, vehicles subject to the “Standard-Anlagerichtlinien des Fonds” Investmentgesetz)
where the money of several individual investors is pooled into one account to be managed by the asset
manager, e.g. open-end funds, closed-end funds. Separate accounts are investment vehicles where the
money of a single investor is directly managed by the asset manager in a separate dedicated account
(e.g. public or private institutions, high net worth individuals, and corporates).
8_Based on the location of the asset management company.
9_Three-year rolling investment performance reflects the mandate-based and volume-weighted three-
year investment success of all third-party assets that are managed by Allianz Asset Management’s
portfolio-management units. For separate accounts and mutual funds, the investment success (valued
on the basis of the closing prices) is compared with the investment success prior to cost deduction of
the respective benchmark, based on various metrics. For some mutual funds, the investment success,
reduced by fees, is compared with the investment success of the median of the respective Morningstar
peer group (a position in the first and second quartile is equivalent to outperformance).
1_For further information about our Asset Management business segment, please refer to note 4 to the
condensed consolidated financial statements.
2_In light of the new operating profit definition, restructuring charges are reported outside of operating
profit unless shared with policyholders. Prior year figures have been adjusted accordingly.
3_Represents operating expenses divided by operating revenues.
4_2016 figure as of 31 December 2016.
5_Net flows represent the sum of new client assets, additional contributions from existing clients –
including dividend reinvestment – withdrawals of assets from, and termination of, client accounts and
distributions to investors. Reinvested dividends amounted to € 5 bn.

A – Interim Group Management Report
Interim Report for the First Half-Year of 2017 — Allianz Group 10
Operating revenues
Our operating revenues went up by 10.1 % – a 7.5 % plus on an internal
basis1.
Performance fees increased, mainly in the United States.
Other net fee and commission income rose, mainly driven by in-
creased average third-party AuM, mostly at PIMCO. The positive effect
was partially mitigated by a decrease in third-party AuM-driven
margins at both, PIMCO and AllianzGI.
Other operating revenues increased, mainly due to favorable for-
eign currency translation effects on financial assets and liabilities
carried at fair value through profit and loss.
Operating profit
Our operating profit increased by 20.4 % on a nominal basis and by
17.5 % on an internal basis1, because of strong revenue growth which
was only partly offset by increased administrative expenses.
The main driver for the increase of administrative expenses was
higher personnel expenses, due to a rise in variable compensation,
which is related to the overall positive business development. Lower
expenses associated with the Special Performance Award (SPA) could
only partly offset the total increase in operating expenses. The SPA
was introduced in the fourth quarter of 2014 at PIMCO to secure
performance and retain talent. Furthermore, increased non-
personnel expenses also contributed to the rise in administrative
expenses, albeit to a lesser extent.
Our cost-income ratio improved significantly, as revenue growth
outpaced the increase in expenses. The SPA effect added 0.4 percent-
age points to the cost-income ratio – net of the impact on variable
compensation.
ASSET MANAGEMENT BUSINESS SEGMENT INFORMATION € MN
six months ended 30 June 2017 2016 Delta
Performance fees 149 127 23
Other net fee and commission income 2,926 2,702 225
Other operating revenues 38 (1) 39
Operating revenues 3,114 2,827 287
Administrative expenses (net), excluding acquisition-related expenses (1,958) (1,868) (91)
Operating expenses (1,958) (1,868) (91)
Operating profit 1,156 960 196
Net income
The increase in our net income corresponds to the positive develop-
ment of our operating profit.
1_Operating revenues/operating profit adjusted for foreign currency translation and (de-)consolidation
effects.

A _ Interim Group Management Report
Interim Report for the First Half-Year of 2017 — Allianz Group 11
Key figures
KEY FIGURES CORPORATE AND OTHER1
€ MN
six months ended 30 June 2017 2016 Delta
Operating revenues 1,680 1,174 506
Operating expenses (1,945) (1,497) (448)
Operating result2 (265) (323) 58
Net income (loss) (456) (188) (268)
KEY FIGURES REPORTABLE SEGMENTS2
€ MN
six months ended 30 June 2017 2016 Delta
HOLDING & TREASURY
Operating revenues 1,044 544 500
Operating expenses (1,387) (928) (458)
Operating result (343) (384) 41
BANKING
Operating revenues 519 519 -
Operating expenses (462) (483) 22
Operating result 57 36 21
ALTERNATIVE INVESTMENTS
Operating revenues 121 111 9
Operating expenses (100) (87) (13)
Operating result 20 24 (4)
1_Consolidation included. For further information about our Corporate and Other business segment,
please refer to note 4 to the condensed consolidated interim financial statements.
2_In light of the new operating profit definition, restructuring charges are reported outside of operating
profit unless shared with policyholders. Prior year figures have been adjusted accordingly.
Earnings summary
Our operating result improved due to the positive developments in
Holding & Treasury and Banking.
Our net loss worsened due to lower realized gains, as the prior
year had benefited from one-off gains from the sale of financial
stakes, as well as from lower non-operating trading result.
In Holding & Treasury, the improvement of our operating result
was mainly driven by a higher net interest result. Lower administra-
tive expenses also contributed positively.
Banking’s operating result increased. This was mainly driven by
both a higher net fee and commission result as well as by lower loan
loss provisions. The positive development was partly offset by a lower
net interest result.
Corporate and Other

A – Interim Group Management Report
Interim Report for the First Half-Year of 2017 — Allianz Group 12
Economic outlook1
Prospects for the world economy remain favorable overall in mid-
year 2017, despite the heightened level of political uncertainty. In the
United States, even several months after taking office, the new U.S.
administration’s stance across a wide range of policy areas remains
highly opaque. Partly due to this backdrop, upward pressure on the
U.S. Dollar has subsided, which improves the outlook for U.S. exports.
All in all, the U.S. economy is likely to expand by around 2 % this year.
In the Eurozone, the economic recovery looks set to continue. We
expect the real gross domestic product to increase by about 2 %.
While rising inflation will weigh on private consumption, household
spending will be supported by rising employment. At a global level,
overall output is likely to expand by 2.9 % in 2017, compared with 2.6 %
in 2016. Industrialized countries are expected to register a 1.9 %
growth in gross domestic product, while in emerging markets growth
could pick up to 4.5 % from the 4.0 % seen in 2016, in part driven by an
economic stabilization in emerging market heavyweights such as
Russia.
The uncertain global political and economic environment bears
the potential for higher financial market volatility. On the monetary
policy front, the Federal Reserve will probably continue to adjust its
policy stance; the key rate is likely to be lifted by a further 25 basis
points by year-end. In addition, the Federal Reserve has meanwhile
reaffirmed its intention to begin reducing its balance sheet this year,
provided that the economy performs in line with its expectations. In
the Eurozone, the European Central Bank is expected to announce in
September a further reduction in bond purchases for January 2018,
probably from € 60 bn to € 40 bn. There are no key interest rate hikes
on the cards until tapering will have been concluded. Modestly rising
yields on 10-year U.S. government bonds, higher inflation rates in the
Eurozone and speculation about the timing and manner of the Euro-
pean Central Bank’s exit from its bond purchasing program will exert
some upward pressure on European benchmark bond yields. For 10-
year German government bonds, we see yields climbing modestly –
towards 1 % – in the remainder of 2017; yields on 10-year U.S. govern-
ment bonds may end the year around 2.5 %. We expect the U.S. Dollar-
to-Euro exchange rate to close the year above the year-end closing
rate of 2016.
1_The information presented in the sections “Economic outlook”, “Insurance industry outlook” and “Asset
management industry outlook” is based on our own estimates.
Insurance industry outlook
We confirm our outlook for premium growth in 2017. As expected,
the first half of the year saw the global economy shift up a gear, lead-
ing to modest top-line growth, while the low-yield environment
turned out much harder to escape, which led to unrelenting pressure
on investment income. Further strain on the bottom line resulted
from the unabated need to build new, digital business models.
In the property-casualty sector, premiums in advanced markets
should grow moderately, supported by the ongoing economic recov-
ery. The emerging markets are expected to grow much faster, with
Asia being the frontrunner. Overall, we expect global premium reve-
nue growth. Given the still challenging pricing outlook, weak invest-
ment income, and elevated catastrophe losses from severe weather
events, the sector’s overall profitability will remain stressed.
In the life sector, we expect advanced markets to recover and
grow modestly, as demand benefits from rising employment and new
product offers. Emerging markets, on the other hand, will perform
more strongly, as rising incomes, urbanization, and social security
reforms remain powerful engines for growing insurance demand. All
in all, we expect global premium revenue to increase. To safeguard
profitability, insurers will continue to review both their product
mixes and their investment portfolios. As a result, overall profitability
should not deteriorate any further.
Outlook

A _ Interim Group Management Report
Interim Report for the First Half-Year of 2017 — Allianz Group 13
Asset management industry outlook
As described above, in the second half of 2017 we will continue to see
uncertainty at a global level, both in monetary and fiscal policy as
well as in trade, geopolitical processes and exchange rates. As illus-
trated by the bond sell-down at the end of June, 2017, the global
capital markets remain volatile in the light of potential changes in
central banks’ monetary policy.
Overall, the current market development is presenting both risks
and opportunities for asset managers. Bonds remain particularly
interesting for the growing number of retirees in developed countries
looking for a stable stream of income; liability-driven investors may
also consider further de-risking into bonds as yields rise. The asset
management industry’s profitability remains under pressure from
continuous flows into passive products as well as rising distribution
costs; it may additionally be affected by measures aimed at strength-
ening regulatory oversight and reporting. As a result of this pressure
on profitability, the industry is likely to consolidate further. At the
same time, digital channels are expected to continue gaining promi-
nence. To continue growing their businesses, it is vital for asset man-
agers to maintain sufficient business volumes, ensure efficient oper-
ations, and keep their investment performance at continued high
levels.
Outlook for the Allianz Group
We now expect the 2017 Allianz Group operating profit to arrive near
the upper end of the outlook range of € 10.8 bn, plus or minus € 0.5 bn.
As always, natural catastrophes and adverse developments in
the capital markets, as well as factors stated in our cautionary note
regarding forward-looking statements, may severely affect the results
of our operations.
Cautionary note regarding forward-looking statements
The statements contained herein may include prospects, statements of future expectations, and other forward-looking statements that are based on management’s current views and
assumptions and involve known and unknown risks and uncertainties. Actual results, performance, or events may differ materially from those expressed or implied in such forward-looking
statements.
Such deviations may arise due to, without limitation, (i) changes of the general economic conditions and competitive situation, particularly in the Allianz Group’s core business and core
markets, (ii) performance of financial markets (particularly market volatility, liquidity and credit events), (iii) frequency and severity of insured loss events, including natural catastrophes, and
the development of loss expenses, (iv) mortality and morbidity levels and trends, (v) persistency levels, (vi) particularly in the banking business, the extent of credit defaults, (vii) interest rate
levels, (viii) currency exchange rates, including the Euro/U.S. Dollar exchange rate, (ix) changes in laws and regulations, including tax regulations, (x) the impact of acquisitions, including
related integration issues and reorganization measures, and (xi) general competitive factors, in each case on a local, regional, national, and/or global basis. Many of these factors may be more
likely to occur, or more pronounced, as a result of terrorist activities and their consequences.
No duty to update
The company assumes no obligation to update any information or forward-looking statement contained herein, save for any information required to be disclosed by law.

A – Interim Group Management Report
Interim Report for the First Half-Year of 2017 — Allianz Group 14
Shareholders’ equity1
SHAREHOLDERS’ EQUITY € MN
as of 30 June
2017
as of 31 December
2016 Delta
Shareholders' equity
Paid-in capital 28,928 28,928 -
Retained earnings 26,055 27,087 (1,032)
Foreign currency translation adjustment (1,906) (762) (1,144)
Unrealized gains and losses (net) 11,122 11,830 (709)
Total1 64,198 67,083 (2,885)
1_Prior year figures have been adjusted in order to reflect the impact resulting from an accounting policy
change to measure the Guaranteed Minimum Income Benefit (GMIB) liability at fair value for our life
business. For further information, please refer to note 2 in the condensed consolidated interim financial
statements.
A major share of the decrease in shareholders’ equity – € 5,048 mn –
was attributable to a dividend payout in May 2017 (€ 3,410 mn) and
the share buy-back program2 which started in February of this year
(€ 1,638 mn). In addition, negative impacts from foreign currency
translation and a decline in unrealized gains – mainly from debt
securities – decreased the shareholders’ equity by € 1,144 mn and
€ 709 mn, respectively. The overall decline could only partly be offset
by the net income attributable to shareholders, amounting to
€ 3,810 mn.
1_This does not include non-controlling interests of € 2,864 mn and € 3,052 mn as of 30 June 2017 and
31 December 2016, respectively. For further information, please refer to note 17 to the condensed
consolidated interim financial statements.
2_For further information, please refer to note 17 to the condensed consolidated interim financial
statements.
Regulatory capital adequacy
The Allianz Group’s own funds and capital requirements are based
on the market value balance sheet approach as the major economic
principle of Solvency II rules.3 Our regulatory capitalization is shown
in the following table.
SOLVENCY II REGULATORY CAPITAL ADEQUACY
as of 30 June
2017
as of31 December
2016 Delta
Eligible own funds € bn 76.0 75.3 0.7
Capital requirement € bn 34.6 34.6 0.1
Capitalization ratio % 219 218 2 %-p
The Solvency II capitalization ratio rose from 218 % to 219 % over the
first six months of 2017. Eligible own funds slightly increased. The
positive effects of operating Solvency II earnings and of regulatory
changes were widely offset by the full recognition of the share buy-
back program and other effects, such as taxes and foreign currency
translation. The capital requirement remained almost stable, as
drivers that increased capital requirements – in particular model
changes – were strongly mitigated, in particular by favorable market
impacts. However, on a pro forma basis, fully reflecting the € 3 bn
share buy-back at year-end 2016, the Solvency II capitalization ratio
increased from 209 % to 219 %.
3_Own funds are calculated under consideration of volatility adjustment and yield curve extension, as
described on page 67 in the Allianz Group Annual Report 2016.
Balance Sheet Review

A _ Interim Group Management Report
Interim Report for the First Half-Year of 2017 — Allianz Group 15
Total assets and total liabilities
As of 30 June 2017, total assets amounted to € 887.2 bn and total
liabilities were € 820.1 bn. Compared to year-end 2016, total assets
and total liabilities rose by € 3.4 bn and € 6.5 bn, respectively.
The following section focuses on our financial investments in
debt instruments, equities, real estate, and cash, as these reflect the
major developments in our asset base.
STRUCTURE OF INVESTMENTS – PORTFOLIO OVERVIEW The following portfolio overview covers the Allianz Group’s assets
held for investment, which are largely driven by our insurance busi-
nesses.
ASSET ALLOCATION AND FIXED INCOME PORTFOLIO OVERVIEW
as of30 June
2017
as of31 December
2016 Delta
as of 30 June
2017
as of31 December
2016 Delta
Type of investment € bn € bn € bn % % %-p
Debt instruments; thereof: 572.5 577.3 (4.8) 87.8 88.4 (0.6)
Government bonds 213.3 213.6 (0.3) 37.3 37.0 0.3
Covered bonds 85.5 89.9 (4.4) 14.9 15.6 (0.7)
Corporate bonds (excl. banks) 190.3 189.5 0.8 33.2 32.8 0.4
Banks 31.6 32.9 (1.2) 5.5 5.7 (0.2)
Other 51.7 51.4 0.3 9.0 8.9 0.1
Equities 53.2 49.9 3.3 8.2 7.6 0.5
Real estate 11.2 11.7 (0.5) 1.7 1.8 (0.1)
Cash/other 14.9 14.2 0.8 2.3 2.2 0.1
Total 651.8 653.1 (1.2) 100.0 100.0 -
Compared to year-end 2016, our overall asset allocation remained
almost unchanged. The decrease in debt instruments, mainly cov-
ered bonds, was partially offset by new investments in equities.
Our well-diversified exposure to debt instruments decreased,
primarily due to a slight rise in interest rates from their low level of
year-end 2016. About 94 % of this portfolio was invested in invest-
ment-grade bonds and loans.1 Our government bonds portfolio con-
tained, amongst others, bonds from Italy and Spain that represented
4.0 %, and 1.9 % shares, respectively, of our debt instruments portfolio
with unrealized gains (gross) of € 2,584 mn and € 827 mn. Of our
covered bonds portfolio, 41.9 % (31 December 2016: 41.3 %) were Ger-
man Pfandbriefe backed by either public-sector loans or mortgage
loans. French, Spanish and Italian covered bonds had portfolio
shares of 16.0 %, 9.4 % and 7.4 %, respectively (31 December 2016: 16.0 %,
9.4 % and 7.5 %).
Our exposure to equities increased mainly due to new invest-
ments. Our equity gearing 2 remained almost unchanged at 24 %
(31 December 2016: 23 %).
1_Excluding self-originated German private retail mortgage loans. For 3 %, no ratings were available.
2_Equity gearing is defined as the ratio of our equity holdings allocated to the shareholder after policy-
holder participation and hedges to shareholders’ equity plus off-balance sheet reserves less goodwill.
LIABILITIES
PROPERTY-CASUALTY LIABILITIES As of 30 June 2017, the business segment’s gross reserves for loss and
loss adjustment expenses as well as discounted loss reserves
amounted to € 64.9 bn, compared to € 65.7 bn at year-end 2016. On a
net basis, our reserves, including discounted loss reserves, were
almost unchanged at € 56.9 bn.3
LIFE/HEALTH LIABILITIES Life/Health reserves for insurance and investment contracts slightly
decreased by € 0.8 bn to € 489.9 bn over the first six months of 2017.
The € 9.9 bn increase in aggregate policy reserves before foreign
currency translation effects was mainly driven by our operations in
Germany (€ 6.1 bn), the United States (€ 3.6 bn before foreign curren-
cy translation effects) and Switzerland (€ 0.5 bn before foreign cur-
rency translation effects). Reserves for premium refund decreased by
€ 3.2 bn, due to lower unrealized gains to be shared with policyhold-
ers as interest rates are on the rise. Foreign currency translation
effects resulted from the weaker U.S. Dollar (€ (6.9) bn), Swiss Franc,
and Asian currencies (€ (0.3) bn each).
3_For further information about changes in the reserves for loss and loss adjustment expenses for the
Property-Casualty business segment, please refer to note 13 to the condensed consolidated interim
financial statements.

A – Interim Group Management Report
Interim Report for the First Half-Year of 2017 — Allianz Group 16
The previous analysis is based on our condensed consolidated inter-
im financial statements and should be read in conjunction with
them. In addition to our figures stated in accordance with the Inter-
national Financial Reporting Standards (IFRS), the Allianz Group uses
operating profit and internal growth to enhance the understanding
of our results. These additional measures should be viewed as com-
plementary to, rather than a substitute for, our figures determined
according to IFRS.
For further information, please refer to note 4 to the condensed
consolidated interim financial statements.
Composition of total revenues
Total revenues comprise statutory gross premiums written in Proper-
ty-Casualty and Life/Health, operating revenues in Asset Manage-
ment, and total revenues in Corporate and Other (Banking).
COMPOSITION OF TOTAL REVENUES € MN
six months ended 30 June 2017 2016
Property-Casualty
Gross premiums written 29,388 28,856
Life/Health
Statutory premiums 33,619 32,968
Asset Management
Operating revenues 3,114 2,827
consisting of:
Net fee and commission income 3,076 2,828
Net interest income1 7 (3)
Income from financial assets and liabilities carried at fair value through income (net) 31 1
Other income - 1
Corporate and Other
thereof: Total revenues (Banking) 275 272
consisting of:
Interest and similar income 217 249
Income from financial assets and liabilities carried at fair value through income (net)
2 13 6
Fee and commission income 287 264
Interest expenses, excluding interest expenses from external debt (72) (90)
Fee and commission expenses (172) (160)
Other income 3 -
Consolidation effects within Corporate and Other - 3
Consolidation (178) (165)
Allianz Group total revenues 66,218 64,759 1_Represents interest and similar income less interest expenses.
2_Includes trading income.
Composition of total revenue growth
We believe that an understanding of our total revenue performance
is enhanced when the effects of foreign currency translation as well
as acquisitions, disposals, and transfers (or “changes in scope of
consolidation”) are analyzed separately. Accordingly, in addition to
presenting nominal total revenue growth, we also present internal
growth, which excludes these effects.
RECONCILIATION OF NOMINAL TOTAL REVENUE GROWTH TO INTERNAL
TOTAL REVENUE GROWTH %
six months ended 30 June 2017
Internal growth
Changes in scope of consoli-
dation
Foreigncurrency
translationNominal
growth
Property-Casualty 1.2 0.6 - 1.8
Life/Health 3.5 (1.9) 0.5 2.0
Asset Management 7.5 0.3 2.3 10.1
Corporate and Other 1.0 - - 1.0
Allianz Group 2.6 (0.7) 0.3 2.3
Life/Health Insurance Operations
OPERATING PROFIT The reconciling item scope comprises the effects from out-of-scope
entities in the profit sources reporting compilation. Operating profit
from operating entities that are not in-scope entities is included in
the investment margin. Currently, 21 entities comprising 99.5 % of
Life/Health total statutory premiums are in scope.
EXPENSES Expenses comprise acquisition expenses and commissions as well as
administrative and other expenses.
The delta shown as definitions in acquisition expenses and
commissions represents commission clawbacks, which are allocated
to the technical margin. The delta shown as definitions in administra-
tive and other expenses mainly represents restructuring charges,
which are stated in a separate line item in the group income state-
ment.1
1_In light of the new operating profit definition, restructuring charges are reported outside of operating
profit unless shared with policyholders. Prior year figures have been adjusted accordingly.
Reconciliations

A _ Interim Group Management Report
Interim Report for the First Half-Year of 2017 — Allianz Group 17
ACQUISITION, ADMINISTRATIVE, CAPITALIZATION, AND AMORTIZATION
OF DAC1
€ MN
six months ended 30 June 2017 2016
Acquisition expenses and commissions2 (2,451) (2,487)
Definitions 8 7
Scope (63) (139)
Acquisition costs incurred (2,506) (2,619)
Capitalization of DAC2 866 1,003
Definition: URR capitalized 260 242
Definition: policyholder participation3 495 475
Scope 16 76
Capitalization of DAC 1,638 1,796
Amortization, unlocking, and true-up of DAC2 (814) (813)
Definition: URR amortized (69) (22)
Definition: policyholder participation3 (662) (270)
Scope (16) (324)
Amortization, unlocking, and true-up of DAC (1,561) (1,430)
Commissions and profit received on reinsurance business ceded 39 28
Acquisition costs4 (2,391) (2,225)
Administrative and other expenses2 (898) (872)
Definitions 74 84
Scope (60) (111)
Administrative expenses on reinsurance business ceded 8 1
Administrative expenses4 (877) (899)
1_Prior year figures changed in order to reflect the roll out of profit source reporting to Turkey.
2_As per Interim Group Management Report.
3_For German Speaking Countries, policyholder participation on revaluation of DAC/URR
capitalization/amortization.
4_As per notes to the condensed consolidated interim financial statements.
IMPACT OF CHANGE IN DEFERRED ACQUISITION COSTS (DAC) Impact of change in DAC includes effects of change in DAC, unearned
revenue reserves (URR), and value of business acquired (VOBA), and
is the net impact of the deferral and amortization of acquisition costs
and front-end loadings on operating profit.
URR capitalized: Capitalization amount of unearned revenue re-
serves (URR) and deferred profit liabilities (DPL) for FAS 97 LP.
URR amortized: Total amount of URR amortized includes sched-
uled URR amortization, true-up and unlocking.
Both capitalization and amortization are included in the line
item premiums earned (net) in the group income statement.
Policyholder participation is included within change in our re-
serves for insurance and investment contracts (net) in the group
income statement.
RECONCILIATION TO NOTES1
€ MN
six months ended 30 June 2017 2016
Acquisition expenses and commissions2 (2,451) (2,487)
Administrative and other expenses2 (898) (872)
Capitalization of DAC2 866 1,003
Amortization, unlocking, and true-up of DAC2 (814) (813)
Acquisition and administrative expenses (3,297) (3,169)
Definitions 106 516
Scope (122) (498)
Commissions and profit received on reinsurance business ceded 39 28
Administrative expenses on reinsurance business ceded 8 1
Acquisition and administrative expenses (net)3 (3,267) (3,123)
1_Prior year figures changed in order to reflect the roll out of profit source reporting to Turkey.
2_As per Interim Group Management Report.
3_As per notes to the condensed consolidated interim financial statements.

A – Interim Group Management Report
Interim Report for the First Half-Year of 2017 — Allianz Group 18
This page intentionally left blank

Interim Report for the First Half-Year of 2017 − Allianz Group 19
CONDENSED CONSOLIDATED INTERIM FINANCIAL STATEMENTS

B _ Condensed Consolidated Interim Financial Statements
Interim Report for the First Half-Year of 2017 — Allianz Group 20
CONSOLIDATED BALANCE SHEETS € MN
note
as of 30 June
2017
as of 31 December
2016
ASSETS
Cash and cash equivalents 17,154 14,463
Financial assets carried at fair value through income 5 8,454 8,333
Investments 6 535,806 536,869
Loans and advances to banks and customers 7 104,496 105,369
Financial assets for unit-linked contracts 115,268 111,325
Reinsurance assets 8 15,225 15,562
Deferred acquisition costs 9 24,061 24,887
Deferred tax assets 951 1,003
Other assets 10 38,041 38,050
Non-current assets and assets of disposal groups classified as held for sale 3 14,378 14,196
Intangible assets 11 13,353 13,752
Total assets 887,189 883,809
LIABILITIES AND EQUITY
Financial liabilities carried at fair value through income1 11,073 11,271
Liabilities to banks and customers 12 13,666 13,038
Unearned premiums 24,902 21,360
Reserves for loss and loss adjustment expenses 13 71,745 72,373
Reserves for insurance and investment contracts 14 504,404 505,322
Financial liabilities for unit-linked contracts 115,268 111,325
Deferred tax liabilities 4,737 4,683
Other liabilities 15 39,799 39,867
Liabilities of disposal groups classified as held for sale 3 13,401 13,290
Certificated liabilities 16 7,682 7,615
Subordinated liabilities 16 13,448 13,530
Total liabilities 820,127 813,674
Shareholders’ equity 64,198 67,083
Non-controlling interests 2,864 3,052
Total equity 17 67,062 70,135
Total liabilities and equity 887,189 883,809
1_Include mainly derivative financial instruments.
CONSOLIDATED BALANCE SHEETS

B _ Condensed Consolidated Interim Financial Statements
Interim Report for the First Half-Year of 2017 — Allianz Group 21
CONSOLIDATED INCOME STATEMENTS € MN
six months ended 30 June note 2017 2016
Gross premiums written 41,425 41,140
Ceded premiums written (2,643) (2,993)
Change in unearned premiums (net) (3,639) (3,567)
Premiums earned (net) 18 35,143 34,580
Interest and similar income 19 11,099 11,115
Income from financial assets and liabilities carried at fair value through income (net) 20 (954) (491)
Realized gains/losses (net) 21 3,529 4,144
Fee and commission income 22 5,591 5,107
Other income 34 11
Total income 54,441 54,466
Claims and insurance benefits incurred (gross) (26,579) (26,797)
Claims and insurance benefits incurred (ceded) 1,185 1,511
Claims and insurance benefits incurred (net) 23 (25,394) (25,286)
Change in reserves for insurance and investment contracts (net) 24 (6,697) (7,539)
Interest expenses 25 (582) (606)
Loan loss provisions (13) (24)
Impairments of investments (net) 26 (332) (1,421)
Investment expenses 27 (644) (601)
Acquisition and administrative expenses (net) 28 (12,678) (12,173)
Fee and commission expenses 29 (2,172) (1,923)
Amortization of intangible assets (79) (67)
Restructuring charges (252) (94)
Other expenses (1) (1)
Total expenses (48,844) (49,734)
Income before income taxes 5,597 4,731
Income taxes 30 (1,585) (1,306)
Net income 4,013 3,425
Net income attributable to:
Non-controlling interests 203 194
Shareholders 3,810 3,231
Basic earnings per share (€) 8.45 7.10
Diluted earnings per share (€) 8.44 6.92
CONSOLIDATED INCOME STATEMENTS

B _ Condensed Consolidated Interim Financial Statements
Interim Report for the First Half-Year of 2017 — Allianz Group 22
CONSOLIDATED STATEMENTS OF COMPREHENSIVE INCOME € MN
six months ended 30 June 2017 2016
Net income 4,013 3,425
Other comprehensive income
Items that may be reclassified to profit or loss in future periods
Foreign currency translation adjustments
Reclassifications to net income - (6)
Changes arising during the period (1,182) (313)
Subtotal (1,182) (319)
Available-for-sale investments
Reclassifications to net income (1,635) (748)
Changes arising during the period 927 6,229
Subtotal (708) 5,481
Cash flow hedges
Reclassifications to net income (14) (8)
Changes arising during the period (19) 285
Subtotal (34) 277
Share of other comprehensive income of associates and joint ventures
Reclassifications to net income - -
Changes arising during the period (25) (51)
Subtotal (25) (51)
Miscellaneous
Reclassifications to net income - -
Changes arising during the period 12 (34)
Subtotal 12 (34)
Items that may never be reclassified to profit or loss
Changes in actuarial gains and losses on defined benefit plans 255 (604)
Total other comprehensive income (1,682) 4,750
Total comprehensive income 2,330 8,175
Total comprehensive income attributable to:
Non-controlling interests 176 296
Shareholders 2,154 7,879
For further details concerning income taxes on components of the
other comprehensive income, please see note 30.
CONSOLIDATED STATEMENTS OF COMPREHENSIVE INCOME

B _ Condensed Consolidated Interim Financial Statements
Interim Report for the First Half-Year of 2017 — Allianz Group 23
CONSOLIDATED STATEMENTS OF CHANGES IN EQUITY € MN
Paid-in capital
Retained earnings
Foreign currency
translation adjustments
Unrealized gains and
losses (net)
Share- holders'
equity
Non-controlling
interests Total equity
Balance as of 1 January 2016, as previously reported 28,928 24,222 (926) 10,920 63,144 2,955 66,099
Adjustments (see note 2) - (329) - - (329) - (329)
Balance as of 1 January 2016, as reported 28,928 23,894 (926) 10,920 62,815 2,955 65,771
Total comprehensive income1 - 2,501 (312) 5,690 7,879 296 8,175
Paid-in capital - - - - - - -
Treasury shares - 7 - - 7 - 7
Transactions between equity holders2 - (12) 4 (4) (12) 15 3
Dividends paid - (3,320) - - (3,320) (222) (3,543)
Balance as of 30 June 2016 28,928 23,069 (1,234) 16,606 67,369 3,044 70,413
Balance as of 1 January 2017, as previously reported 28,928 27,336 (754) 11,830 67,341 3,052 70,392
Adjustments (see note 2) - (249) (8) - (258) - (258)
Balance as of 1 January 2017, as reported 28,928 27,087 (762) 11,830 67,083 3,052 70,135
Total comprehensive income1 - 4,015 (1,144) (717) 2,154 176 2,330
Paid-in capital - - - - - - -
Treasury shares - (360) - - (360) - (360)
Transactions between equity holders2,3
- (1,277) - 8 (1,269) (162) (1,431)
Dividends paid - (3,410) - - (3,410) (202) (3,612)
Balance as of 30 June 2017 28,928 26,055 (1,906) 11,122 64,198 2,864 67,062 1_Total comprehensive income in shareholders’ equity for the six months ended 30 June 2017 comprises net income attributable to shareholders of € 3,810 mn (2016: € 3,231 mn).
2_Includes income taxes within retained earnings.
3_During the first half-year of 2017, Allianz SE purchased for an amount of € 1,638 mn approximately 9.6 million own shares as part of its share-buy-back program announced in February 2017 with a total volume of up
to € 3.0 bn. Thereof 7,472,978 own shares in the amount of € 1,271 mn were cancelled by the end of June 2017 without changing the registered capital of Allianz SE.
CONSOLIDATED STATEMENTS OF CHANGES IN EQUITY

B _ Condensed Consolidated Interim Financial Statements
Interim Report for the First Half-Year of 2017 — Allianz Group 24
CONSOLIDATED STATEMENTS OF CASH FLOWS € MN
six months ended 30 June 2017 2016
SUMMARY
Net cash flow provided by operating activities 19,615 15,527
Net cash flow used in investing activities (11,565) (13,891)
Net cash flow used in financing activities (4,941) (1,787)
Effect of exchange rate changes on cash and cash equivalents (419) (117)
Change in cash and cash equivalents 2,691 (269)
Cash and cash equivalents at beginning of period 14,463 14,842
Cash and cash equivalents reclassified to assets of disposal groups held for sale - -
Cash and cash equivalents at end of period 17,154 14,573
CASH FLOW FROM OPERATING ACTIVITIES
Net income 4,013 3,425
Adjustments to reconcile net income to net cash flow provided by operating activities
Share of earnings from investments in associates and joint ventures (220) (132)
Realized gains/losses (net) and impairments of investments (net) of:
Available-for-sale and held-to-maturity investments, investments in associates and joint ventures, real estate held for investment, loans and advances to banks and customers, non-current assets and disposal groups classified as held for sale (3,229) (2,724)
Other investments, mainly financial assets held for trading and designated at fair value through income (1,311) (442)
Depreciation and amortization 718 622
Loan loss provisions 13 24
Interest credited to policyholder accounts 2,328 2,283
Net change in:
Financial assets and liabilities held for trading 2,085 1,384
Reverse repurchase agreements and collateral paid for securities borrowing transactions 87 (458)
Repurchase agreements and collateral received from securities lending transactions 631 (905)
Reinsurance assets (654) (1,390)
Deferred acquisition costs (405) (649)
Unearned premiums 3,921 3,859
Reserves for loss and loss adjustment expenses 649 529
Reserves for insurance and investment contracts 7,316 10,439
Deferred tax assets/liabilities 262 (85)
Other (net) 3,409 (253)
Subtotal 15,602 12,101
Net cash flow provided by operating activities 19,615 15,527
CASH FLOW FROM INVESTING ACTIVITIES
Proceeds from the sale, maturity or repayment of:
Financial assets designated at fair value through income 1,051 1,028
Available-for-sale investments 82,146 77,973
Held-to-maturity investments 136 163
Investments in associates and joint ventures 381 710
Non-current assets and disposal groups classified as held for sale 215 63
Real estate held for investment 85 141
Fixed assets of renewable energy investments 2 -
Loans and advances to banks and customers (purchased loans) 3,023 3,593
Property and equipment 128 43
Subtotal 87,167 83,714
CONSOLIDATED STATEMENTS OF CASH FLOWS

B _ Condensed Consolidated Interim Financial Statements
Interim Report for the First Half-Year of 2017 — Allianz Group 25
CONSOLIDATED STATEMENTS OF CASH FLOWS € MN
six months ended 30 June 2017 2016
Payments for the purchase or origination of
Financial assets designated at fair value through income (915) (1,012)
Available-for-sale investments (92,224) (92,294)
Held-to-maturity investments (140) (120)
Investments in associates and joint ventures (1,229) (413)
Non-current assets and disposal groups classified held for sale (50) -
Real estate held for investment (75) (324)
Fixed assets of renewable energy investments (150) (165)
Loans and advances to banks and customers (purchased loans) (1,407) (1,539)
Property and equipment (701) (506)
Subtotal (96,890) (96,373)
Business combinations (note 3):
Proceeds from sale of subsidiaries, net of cash disposed - -
Acquisitions of subsidiaries, net of cash acquired - -
Change in other loans and advances to banks and customers (originated loans) (1,729) (1,329)
Other (net) (112) 97
Net cash flow used in investing activities (11,565) (13,891)
CASH FLOW FROM FINANCING ACTIVITIES
Net change in liabilities to banks and customers 289 383
Proceeds from the issuance of certificated liabilities and subordinated liabilities 3,786 3,864
Repayments of certificated liabilities and subordinated liabilities (3,468) (2,477)
Cash inflow from capital increases - -
Transactions between equity holders (1,431) 3
Dividends paid to shareholders (3,612) (3,543)
Net cash from sale or purchase of treasury shares (355) 8
Other (net) (150) (25)
Net cash flow used in financing activities (4,941) (1,787)
SUPPLEMENTARY INFORMATION ON THE CONSOLIDATED STATEMENTS OF CASH FLOWS
Income taxes paid (1,318) (1,465)
Dividends received 1,266 1,026
Interest received 10,048 10,853
Interest paid (553) (485)
CONSOLIDATED STATEMENTS OF CASH FLOWS - CONTINUED

B _ Condensed Consolidated Interim Financial Statements
Interim Report for the First Half-Year of 2017 — Allianz Group 26
1 – Basis of presentation
The condensed consolidated interim financial statements of the
Allianz Group are presented in accordance with the requirements of
IAS 34 and have been prepared in conformity with International
Financial Reporting Standards (IFRSs), as adopted under European
Union regulations.
For existing and unchanged IFRSs, the condensed consolidated
interim financial statements use the same accounting policies for
recognition, measurement, consolidation and presentation as ap-
plied in the consolidated financial statements for the year ended
31 December 2016, except for the change in accounting policy as
described in note 2. These condensed consolidated interim financial
statements should be read in conjunction with the consolidated
financial statements for the year ended 31 December 2016.
In accordance with the provisions of IFRS 4, insurance contracts
are recognized and measured on the basis of accounting principles
generally accepted in the United States of America (US GAAP) as at
first-time adoption of IFRS 4 on 1 January 2005.
Amounts are rounded to millions of Euro (€ mn), unless other-
wise stated.
These condensed consolidated interim financial statements of
the Allianz Group were authorized for issue by the Board of Manage-
ment on 3 August 2017.
2 – Recently adopted and issued accounting pronouncements and change in accounting policies
RECENTLY ADOPTED ACCOUNTING PRONOUNCEMENTS (EFFECTIVE 1 JANUARY 2017) The following amendments and revisions to existing standards be-
came effective for the Allianz Group’s consolidated financial state-
ments as of 1 January 2017:
— IAS 7, Disclosure initiative, — IAS 12, Recognition of Deferred Tax Assets for Unrealised Losses, — Annual Improvements to IFRSs 2014 – 2016 Cycle.
No material impact arose on the financial results or the financial
position of the Allianz Group.
RECENTLY ISSUED ACCOUNTING PRONOUNCEMENTS IFRS 17 Insurance Contracts was issued by the IASB in May 2017 and
is the first comprehensive IFRS Standard establishing the accounting
for insurance contracts. IFRS 17 replaces the interim Standard IFRS 4
Insurance Contracts and is effective from 1 January 2021. The Allianz
Group is currently evaluating the impact of adopting IFRS 17 on its
consolidated financial statements.
CHANGE IN ACCOUNTING POLICIES At the beginning of 2017, the Allianz Group entered into an economic
hedging program for its Guaranteed Minimum Income Benefits
(GMIBs), which were sold as part of its variable annuity portfolio. In
order to mitigate accounting mismatches between the hedging
derivatives and the GMIBs, the Allianz Group has started measuring
the GMIBs at fair value through profit or loss as of 1 January 2017.
This change in measurement is permitted by IFRS 4 and represents
an accounting policy change. Accounting policy changes need to be
applied retrospectively. The total effect of the new measurement on
prior period numbers is as follows:
CHANGE OF CONSOLIDATED BALANCE SHEET RELATING TO THE CHANGE IN ACCOUNTING POLICIES FOR GMIBS € MN
as of 31 December 2016
As previously
reported
Change in accounting
policies GMIBs As reported
Financial liabilities carried at fair value through income 10,737 534 11,271
Reserves for insurance and investment contracts 505,460 (138) 505,322
Deferred tax liabilities 4,822 (139) 4,683
Total liabilities 813,417 258 813,674
Shareholders' equity 67,341 (258) 67,083
Non-controlling interests 3,052 - 3,052
Total equity 70,392 (258) 70,135
Total liabilities and equity 883,809 - 883,809
In the consolidated income statement for the six months ended
30 June 2016, the GMIB-related change in accounting policies led to a
€ 78 mn decrease in income from financial assets and liabilities
carried at fair value through income (net) and a € 5 mn decrease in
changes in reserves for insurance and investment contracts (net).
Together with the decrease of income taxes of € 29 mn the net income
decreased with an amount of € 54 mn. This led to a 12 cent decrease
in earnings per share. For the year ended 31 December 2016, the
implementation of the changed accounting policy lead to a € 121 mn
increase of income before income taxes and an increase of income
taxes of € 42 mn. In total, the net income increased by € 79 mn. This
resulted in an increase of 17 cents in earnings per share.
Notes to the Condensed Consolidated Interim Financial Statements
GENERAL INFORMATION

B _ Condensed Consolidated Interim Financial Statements
Interim Report for the First Half-Year of 2017 — Allianz Group 27
3 – Classification as held for sale
NON-CURRENT ASSETS AND DISPOSAL GROUPS CLASSIFIED AS HELD FOR SALE € MN
as of 30 June
2017
as of 31 December
2016
Assets of disposal groups classified as held for sale
Oldenburgische Landesbank AG, Oldenburg 13,889 13,915
Other disposal groups 370 42
Subtotal 14,259 13,957
Non-current assets classified as held for sale
Real estate held for investment 119 160
Real estate held for own use - 79
Subtotal 119 239
Total 14,378 14,196
Liabilities of disposal groups classified as held for sale
Oldenburgische Landesbank AG, Oldenburg 13,236 13,282
Other disposal groups 165 8
Total 13,401 13,290
OLDENBURGISCHE LANDESBANK AG, OLDENBURG At the end of the second quarter of 2017, all requirements were still
fulfilled to present Oldenburgische Landesbank AG, Oldenburg,
allocated to the reportable segment Banking (Corporate and Other)
as a disposal group classified as held for sale.
RECLASSIFIED ASSETS AND LIABILITIES € MN
Cash and cash equivalents 234
Financial assets carried at fair value through income 14
Investments 2,584
Loans and advances to banks and customers 10,889
Deferred tax assets 70
Other assets 97
Total assets 13,889
Financial liabilities carried at fair value through income 11
Liabilities to banks and customers 12,434
Other liabilities 414
Certificated liabilities 158
Subordinated liabilities 217
Total liabilities 13,236
As of 30 June 2017, cumulative gains of € 59 mn were reported in
other comprehensive income relating to the disposal group classified
as held for sale. A sales contract for the Allianz shares in Olden-
burgische Landesbank AG was signed on 23 June 2017. The necessary
approvals and the transfer to the buyer are expected in the fourth
quarter of 2017.
4 - Segment reporting
The business activities of the Allianz Group, the business segments
as well as the products and services from which the reportable seg-
ments derive revenue are consistent with the ones described in the
consolidated financial statements for the year ended 31 December
2016. The statement contained therein regarding general segment
reporting information is still applicable and valid. The reportable
segments measure of profit or loss remained unchanged, except that
effective 1 January 2017 restructuring charges are presented general-
ly as non-operating items. Like the other non-operating items, they
are shown in operating profit, if they are shared with the policyhold-
ers. There is one exception from this general rule with regard to
policyholder participation in tax benefits. As IFRS requires that the
consolidated income statements present all tax benefits in the line
item income taxes, even when they belong to policyholders, the
corresponding expenses for premium refunds are shown as non-
operating as well.
RECENT ORGANIZATIONAL CHANGES Effective 1 January 2017, the Allianz Group reorganized the structure
of its insurance activities to reflect the changes in the responsibilities
of the Board of Management. The former reportable segment Asia
Pacific has been allocated to the reportable segment Western &
Southern Europe, Middle East, Africa, Asia Pacific. Previously reported
information has been adjusted to reflect this change in the composi-
tion of the Allianz Group’s reportable segments.
Additionally, some minor reallocations between the reportable
segments have been made.

B _ Condensed Consolidated Interim Financial Statements
Interim Report for the First Half-Year of 2017 — Allianz Group 28
BUSINESS SEGMENT INFORMATION – CONSOLIDATED BALANCE SHEETS
BUSINESS SEGMENT INFORMATION – CONSOLIDATED BALANCE SHEETS € MN
Property-Casualty Life/Health
as of
30 June 2017as of
31 December 2016 as of
30 June 2017 as of
31 December 2016
ASSETS
Cash and cash equivalents 3,483 3,429 9,006 7,014
Financial assets carried at fair value through income 622 539 7,496 7,427
Investments 102,414 102,430 415,600 415,023
Loans and advances to banks and customers 10,805 11,508 92,368 93,142
Financial assets for unit-linked contracts - - 115,268 111,325
Reinsurance assets 9,980 10,016 5,345 5,625
Deferred acquisition costs 5,026 4,782 19,035 20,105
Deferred tax assets 1,001 1,175 550 537
Other assets 22,842 22,392 17,895 19,143
Non-current assets and assets of disposal groups classified as held for sale 55 97 404 146
Intangible assets 2,820 2,870 3,005 3,078
Total assets 159,048 159,237 685,973 682,564
Property-Casualty Life/Health
as of
30 June 2017as of
31 December 2016 as of
30 June 2017 as of
31 December 2016
LIABILITIES AND EQUITY
Financial liabilities carried at fair value through income 87 129 10,828 10,928
Liabilities to banks and customers 1,205 864 6,128 5,551
Unearned premiums 20,648 17,276 4,293 4,108
Reserves for loss and loss adjustment expenses 60,832 61,617 10,956 10,790
Reserves for insurance and investment contracts 14,791 14,837 489,901 490,739
Financial liabilities for unit-linked contracts - - 115,268 111,325
Deferred tax liabilities 2,412 2,674 3,666 3,697
Other liabilities 17,142 19,261 14,864 14,622
Liabilities of disposal groups classified as held for sale 20 - 139 3
Certificated liabilities 11 11 11 11
Subordinated liabilities - - 95 95
Total liabilities 117,147 116,668 656,150 651,869

B _ Condensed Consolidated Interim Financial Statements
Interim Report for the First Half-Year of 2017 — Allianz Group 29
Asset Management Corporate and Other Consolidation Group
as of 30 June 2017
as of 31 December 2016
as of 30 June 2017
as of 31 December 2016
as of 30 June 2017
as of 31 December 2016
as of 30 June 2017
as of 31 December 2016
884 1,155 4,046 3,053 (266) (187) 17,154 14,463
84 63 653 701 (402) (398) 8,454 8,333
116 133 101,823 103,578 (84,146) (84,295) 535,806 536,869
57 65 6,089 6,081 (4,823) (5,427) 104,496 105,369
- - - - - - 115,268 111,325
- - - - (100) (78) 15,225 15,562
- - - - - - 24,061 24,887
210 260 825 936 (1,636) (1,904) 951 1,003
2,937 2,924 7,681 8,556 (13,313) (14,965) 38,041 38,050
27 29 13,904 13,925 (12) (2) 14,378 14,196
7,517 7,794 12 11 - - 13,353 13,752
11,833 12,422 135,033 136,841 (104,697) (107,256) 887,189 883,809
Asset Management Corporate and Other Consolidation Group
as of 30 June 2017
as of 31 December 2016
as of 30 June 2017
as of 31 December 2016
as of 30 June 2017
as of 31 December 2016
as of 30 June 2017
as of 31 December 2016
- - 566 615 (409) (400) 11,073 11,271
174 174 7,806 8,424 (1,646) (1,974) 13,666 13,038
- - - - (38) (24) 24,902 21,360
- - - - (43) (34) 71,745 72,373
- - (92) (57) (196) (196) 504,404 505,322
- - - - - - 115,268 111,325
87 29 208 188 (1,636) (1,904) 4,737 4,683
2,644 2,925 25,495 25,283 (20,346) (22,223) 39,799 39,867
5 5 13,262 13,306 (25) (25) 13,401 13,290
- - 10,434 10,586 (2,774) (2,994) 7,682 7,615
- - 13,403 13,485 (50) (50) 13,448 13,530
2,910 3,133 71,081 71,830 (27,161) (29,826) 820,127 813,674
Total equity 67,062 70,135
Total liabilities and equity 887,189 883,809

B _ Condensed Consolidated Interim Financial Statements
Interim Report for the First Half-Year of 2017 — Allianz Group 30
BUSINESS SEGMENT INFORMATION – TOTAL REVENUES AND RECONCILIATION OF OPERATING PROFIT (LOSS) TO NET INCOME (LOSS)
BUSINESS SEGMENT INFORMATION – TOTAL REVENUES AND RECONCILIATION OF OPERATING PROFIT (LOSS) TO NET INCOME (LOSS) € MN
Property-Casualty Life/Health
six months ended 30 June 2017 2016 2017 2016
Total revenues1 29,388 28,856 33,619 32,968
Premiums earned (net) 23,557 22,823 11,585 11,757
Operating investment result
Interest and similar income 1,760 1,736 9,056 9,128
Operating income from financial assets and liabilities carried at fair value through income (net) (51) (25) (965) (551)
Operating realized gains/losses (net) 152 157 2,916 3,114
Interest expenses, excluding interest expenses from external debt (52) (48) (49) (57)
Operating impairments of investments (net) (6) (43) (255) (934)
Investment expenses (183) (175) (609) (551)
Subtotal 1,621 1,602 10,094 10,149
Fee and commission income 911 759 708 679
Other income 32 1 1 9
Claims and insurance benefits incurred (net) (15,556) (15,162) (9,838) (10,127)
Operating change in reserves for insurance and investment contracts (net)2 (258) (254) (6,476) (7,211)
Loan loss provisions - - - -
Acquisition and administrative expenses (net), excluding acquisition-related expenses (6,739) (6,492) (3,267) (3,123)
Fee and commission expenses (864) (706) (350) (305)
Operating amortization of intangible assets - - (9) (9)
Operating restructuring charges - - (17) (14)
Other expenses - - (148) (149)
Reclassifications3 - - - 203
Operating profit (loss) 2,705 2,572 2,282 1,859
Non-operating investment result
Non-operating income from financial assets and liabilities carried at fair value through income (net) (2) (21) 22 11
Non-operating realized gains/losses (net) 307 327 59 21
Non-operating impairments of investments (net) (53) (168) (27) (218)
Subtotal 252 138 54 (186)
Non-operating change in reserves for insurance and investment contracts (net) - - 2 -
Interest expenses from external debt - - - -
Acquisition-related expenses - - - -
Non-operating amortization of intangible assets (31) (26) (27) (21)
Non-operating restructuring charges (165) (33) (7) (49)
Reclassifications3 - - - (203)
Non-operating items 56 78 22 (460)
Income (loss) before income taxes 2,761 2,651 2,305 1,399
Income taxes (691) (729) (693) (458)
Net income (loss) 2,070 1,922 1,611 941
Net income (loss) attributable to:
Non-controlling interests 90 84 67 73
Shareholders 1,980 1,838 1,544 868 1_Total revenues comprise statutory gross premiums written in Property-Casualty and Life/ Health, operating revenues in Asset Management and total revenues in Corporate and Other (Banking).
2_For the six months ended 30 June 2017, includes expenses for premium refunds (net) in Property-Casualty of € (131) mn (2016: € (129) mn).
3_From the classification of the South Korean life business as "held for sale" in the second quarter of 2016 until its disposal in the fourth quarter of 2016, the total result was considered as non-operating. Furthermore tax
reclassifications are included in this line.

B _ Condensed Consolidated Interim Financial Statements
Interim Report for the First Half-Year of 2017 — Allianz Group 31
Asset Management Corporate and Other Consolidation Group
2017 2016 2017 2016 2017 2016 2017 2016
3,114 2,827 275 272 (178) (165) 66,218 64,759
- - - - - - 35,143 34,580
12 2 383 370 (112) (121) 11,099 11,115
31 1 10 12 (1) - (976) (563)
- - - - (42) 38 3,026 3,310
(5) (6) (163) (194) 107 118 (161) (188)
- - - - - - (261) (977)
- - (49) (40) 197 166 (644) (601)
38 (2) 181 148 148 200 12,083 12,097
3,845 3,496 1,138 643 (1,012) (471) 5,591 5,107
- 1 149 148 (148) (149) 34 11
- - - - - 3 (25,394) (25,286)
- - - - 35 (74) (6,699) (7,539)
- - (13) (24) - - (13) (24)
(1,958) (1,868) (692) (699) (27) 8 (12,684) (12,173)
(769) (668) (1,027) (540) 838 296 (2,172) (1,923)
- - - - - - (9) (9)
- - - - - - (17) (14)
- - - - 148 148 (1) (1)
- - - - - 34 - 238
1,156 960 (265) (323) (18) (5) 5,860 5,063
- - (29) 79 31 4 22 71
7 - 71 354 59 132 504 835
- - 9 (58) - - (71) (444)
7 - 51 375 91 136 454 462
- - - - - - 2 -
- - (421) (418) - - (421) (418)
6 - - - - - 6 -
(7) (6) (5) (4) - - (69) (58)
(8) 2 (56) - - - (235) (80)
- - - - - (34) - (238)
(2) (4) (430) (47) 91 101 (263) (332)
1,154 956 (695) (371) 73 97 5,597 4,731
(419) (340) 239 183 (21) 39 (1,585) (1,306)
735 615 (456) (188) 52 135 4,013 3,425
35 29 11 8 - - 203 194
700 586 (467) (196) 52 135 3,810 3,231

B _ Condensed Consolidated Interim Financial Statements
Interim Report for the First Half-Year of 2017 — Allianz Group 32
RECONCILIATION OF REPORTABLE SEGMENTS TO ALLIANZ GROUP FIGURES
RECONCILIATION OF REPORTABLE SEGMENTS TO ALLIANZ GROUP FIGURES € MN
Total revenues Premiums earned (net) Operating profit (loss) Net income (loss)
six months ended 30 June 2017 2016 2017 2016 2017 2016 2017 2016
German Speaking Countries and Central & Eastern Europe 9,182 8,925 6,151 5,961 765 756 638 608
Western & Southern Europe, Middle East, Africa, Asia Pacific 6,737 6,758 5,786 5,676 923 761 665 507
Iberia & Latin America 2,615 2,353 1,828 1,677 154 89 54 55
Global Insurance Lines & Anglo Markets 12,069 12,490 7,661 7,672 774 911 656 724
Allianz Worldwide Partners 2,749 2,479 2,132 1,837 87 55 57 30
Consolidation (3,964) (4,149) - - - - - (2)
Total Property-Casualty 29,388 28,856 23,557 22,823 2,705 2,572 2,070 1,922
German Speaking Countries and Central & Eastern Europe 13,534 12,305 7,071 7,214 818 797 549 543
Western & Southern Europe, Middle East, Africa, Asia Pacific
1 14,295 13,182 3,477 3,531 687 627 503 79
Iberia & Latin America 1,008 1,015 242 253 164 113 128 79
USA 5,068 6,575 609 547 587 302 410 220
Global Insurance Lines & Anglo Markets 297 321 185 211 17 15 13 13
Consolidation (584) (430) 1 - 9 6 9 5
Total Life/Health 33,619 32,968 11,585 11,757 2,282 1,859 1,611 941
Asset Management 3,114 2,827 - - 1,156 960 735 615
Holding & Treasury - - - - (343) (384) (508) (244)
Banking 275 270 - - 57 36 38 35
Alternative Investments - - - - 20 24 14 16
Consolidation - 2 - - - - - 5
Total Corporate and Other 275 272 - - (265) (323) (456) (188)
Consolidation (178) (165) - - (18) (5) 52 135
Group 66,218 64,759 35,143 34,580 5,860 5,063 4,013 3,425
1_From the classification of the South Korean life business as "held for sale" in the second quarter of 2016 until its disposal in the fourth quarter of 2016, the total result was considered as non-operating.

B _ Condensed Consolidated Interim Financial Statements
Interim Report for the First Half-Year of 2017 — Allianz Group 33
5 – Financial assets carried at fair value through income
FINANCIAL ASSETS CARRIED AT FAIR VALUE THROUGH INCOME € MN
as of 30 June
2017
as of 31 Decembe
r 2016
Financial assets held for trading
Debt securities 431 264
Equity securities 201 210
Derivative financial instruments 2,666 2,433
Subtotal 3,297 2,907
Financial assets designated at fair value through income
Debt securities 2,691 2,970
Equity securities 2,466 2,457
Subtotal 5,157 5,426
Total 8,454 8,333
6 – Investments
INVESTMENTS € MN
as of 30 June
2017
as of 31 Decembe
r 2016
Available-for-sale investments 511,147 512,268
Held-to-maturity investments 2,414 2,399
Funds held by others under reinsurance contracts assumed 908 912
Investments in associates and joint ventures 7,624 7,161
Real estate held for investment 11,226 11,732
Fixed assets of renewable energy investments 2,487 2,397
Total 535,806 536,869
AVAILABLE-FOR-SALE INVESTMENTS
AVAILABLE-FOR-SALE INVESTMENTS € MN
as of 30 June 2017 as of 31 December 2016
Amortized
cost Unrealized
gainsUnrealized
losses Fair valueAmortized
costUnrealized
gains Unrealized
losses Fair value
Debt securities
Corporate bonds 227,185 15,050 (917) 241,319 230,504 15,944 (1,575) 244,874
Government and government agency bonds1 178,163 21,728 (1,509) 198,383 173,456 27,121 (1,663) 198,914
MBS/ABS 20,648 401 (179) 20,869 21,258 441 (303) 21,396
Other 4,351 638 (10) 4,979 3,569 753 (17) 4,305
Subtotal 430,348 37,817 (2,615) 465,550 428,787 44,259 (3,557) 469,489
Equity securities 32,730 13,206 (338) 45,598 30,323 12,649 (192) 42,779
Total 463,078 51,023 (2,954) 511,147 459,109 56,908 (3,750) 512,268
1_As of 30 June 2017, fair value and amortized costs of bonds from countries with a rating below AA amounted to € 73,359 mn (31 December 2016: € 73,519 mn) and € 68,385 mn (31 December 2016: € 67,571 mn),
respectively.
NOTES TO THE CONSOLIDATED BALANCE SHEETS

B _ Condensed Consolidated Interim Financial Statements
Interim Report for the First Half-Year of 2017 — Allianz Group 34
7 – Loans and advances to banks and customers
LOANS AND ADVANCES TO BANKS AND CUSTOMERS € MN
as of 30 June
2017
as of 31 Decembe
r 2016
Short-term investments and certificates of deposit 3,341 3,699
Loans 99,504 99,883
Other 1,747 1,884
Subtotal 104,591 105,466
Loan loss allowance (95) (97)
Total 104,496 105,369
8 – Reinsurance assets
REINSURANCE ASSETS € MN
as of 30 June
2017
as of 31 Decembe
r 2016
Unearned premiums 1,912 1,543
Reserves for loss and loss adjustment expenses 8,253 8,685
Aggregate policy reserves 4,938 5,211
Other insurance reserves 122 124
Total 15,225 15,562
9 – Deferred acquisition costs
DEFERRED ACQUISITION COSTS € MN
as of 30 June
2017
as of 31 Decembe
r 2016
Deferred acquisition costs
Property-Casualty 5,026 4,782
Life/Health 17,962 18,780
Subtotal 22,988 23,562
Deferred sales inducements 579 781
Present value of future profits 494 544
Total 24,061 24,887
10 – Other assets
OTHER ASSETS
€ MN
as of 30 June
2017
as of 31 Decembe
r 2016
Receivables
Policyholders 5,991 5,938
Agents 4,638 4,217
Reinsurance 2,898 2,755
Other 5,587 5,126
Less allowances for doubtful accounts (597) (632)
Subtotal 18,518 17,404
Tax receivables
Income taxes 1,886 1,809
Other taxes 1,580 1,615
Subtotal 3,467 3,424
Accrued dividends, interest and rent 6,174 7,257
Prepaid expenses 530 390
Derivative financial instruments used for hedging, that meet the criteria for hedge accounting, and firm commitments 473 677
Property and equipment
Real estate held for own use 3,005 3,024
Software 2,711 2,640
Equipment 1,470 1,477
Subtotal 7,186 7,141
Other assets 1,694 1,756
Total 38,041 38,050
11 – Intangible assets
INTANGIBLE ASSETS € MN
as of 30 June
2017
as of 31 Decembe
r 2016
Goodwill 12,060 12,372
Distribution agreements1 898 951
Acquired business portfolios2 148 172
Customer relationships 107 122
Other3 140 136
Total 13,353 13,752
1_Primarily includes the long-term distribution agreements with Commerzbank AG of € 242 mn (2016:
€ 261 mn), Banco Popular S.A. of € 361 mn (2016: € 371 mn), Yapi ve Kredi Bankasi A.S. of € 84 mn
(2016: € 96 mn), Philippine National Bank of € 73 mn (2016: € 83 mn) and HSBC Asia, HSBC Turkey,
BTPN Indonesia and Maybank Indonesia of € 118 mn (2016: € 133 mn).
2_Primarily includes the acquired business portfolio of Allianz Yasam ve Emeklilik A.S. of € 87 mn (2016:
€ 98 mn).
3_Primarily includes heritable building rights, land use rights, lease rights and brand names.

B _ Condensed Consolidated Interim Financial Statements
Interim Report for the First Half-Year of 2017 — Allianz Group 35
12 – Liabilities to banks and customers
LIABILITIES TO BANKS AND CUSTOMERS € MN
as of 30 June
2017
as of 31 December
2016
Payable on demand and other deposits 927 897
Repurchase agreements and collateral received from securities lending transactions and derivatives 4,472 4,040
Other 8,267 8,101
Total 13,666 13,038
13 – Reserves for loss and loss adjustment expenses As of 30 June 2017, the reserves for loss and loss adjustment expenses
of the Allianz Group amounted in total to € 71,745 mn (31 December
2016: € 72,373 mn). The following table reconciles the beginning and
ending reserves of the Property-Casualty business segment for the
half-years ended 30 June 2017 and 2016.
CHANGE IN THE RESERVES FOR LOSS AND LOSS ADJUSTMENT EXPENSES IN THE PROPERTY-CASUALTY BUSINESS SEGMENT € MN
2017 2016
As of 1 January 61,617 61,169
Balance carry forward of discounted loss reserves 4,055 3,882
Subtotal 65,671 65,051
Loss and loss adjustment expenses incurred
Current year 17,547 17,797
Prior years (1,016) (1,378)
Subtotal 16,531 16,419
Loss and loss adjustment expenses paid
Current year (6,341) (6,395)
Prior years (9,804) (9,563)
Subtotal (16,145) (15,958)
Foreign currency translation adjustments and other changes (1,184) (532)
Subtotal 64,873 64,981
Ending balance of discounted loss reserves (4,041) (3,969)
As of 30 June 60,832 61,012
14 – Reserves for insurance and investment contracts
RESERVES FOR INSURANCE AND INVESTMENT CONTRACTS € MN
as of 30 June
2017
as of 31 December
2016
Aggregate policy reserves 436,012 433,610
Reserves for premium refunds 67,391 70,664
Other insurance reserves 1,001 1,048
Total 504,404 505,322
15 – Other liabilities
OTHER LIABILITIES € MN
as of 30 June
2017
as of 31 December
2016
Payables
Policyholders 3,976 4,908
Reinsurance 1,990 1,745
Agents 1,491 1,616
Subtotal 7,457 8,269
Payables for social security 408 478
Tax payables
Income taxes 1,958 1,836
Other taxes 1,847 1,452
Subtotal 3,804 3,287
Accrued interest and rent 588 564
Unearned income 465 440
Provisions
Pensions and similar obligations 9,047 9,401
Employee related 2,292 2,551
Share-based compensation plans 343 431
Restructuring plans 305 95
Other provisions 1,834 2,121
Subtotal 13,820 14,599
Deposits retained for reinsurance ceded 2,090 2,254
Derivative financial instruments used for hedging, that meet the criteria for hedge accounting, and firm commitments 145 159
Financial liabilities for puttable equity instruments 2,669 2,894
Other liabilities 8,353 6,922
Total 39,799 39,867

B _ Condensed Consolidated Interim Financial Statements
Interim Report for the First Half-Year of 2017 — Allianz Group 36
16 – Certificated and subordinated liabilities
CERTIFICATED AND SUBORDINATED LIABILITIES € MN
as of 30 June
2017
as of 31 December
2016
Senior bonds 6,554 6,574
Money market securities 1,129 1,041
Total certificated liabilities 7,682 7,615
Subordinated bonds1 13,403 13,485
Hybrid equity2 45 45
Total subordinated bonds 13,448 13,530 1_Change due to the issuance of € 1.0 bn and $ 0.6 bn bonds as well as the redemption of a € 1.4 bn
bond in the first half-year of 2017.
2_Relates to hybrid equity issued by subsidiaries.
BONDS OUTSTANDING AS OF 30 JUNE 2017
ISIN Year of Issue Currency Notional amount Coupon in % Maturity date
Certificated liabilities
Allianz Finance II B.V., Amsterdam DE000A1HG1J8 2013 EUR 500 1.375 % 13 March 2018
DE000A1AKHB8 2009 EUR 1,500 4.750 % 22 July 2019
DE000A180B72 2016 EUR 750 0.000 % 21 April 2020
DE000A1G0RU9 2012 EUR 1,500 3.500 % 14 February 2022
DE000A1HG1K6 2013 EUR 750 3.000 % 13 March 2028
DE000A180B80 2016 EUR 750 1.375 % 21 April 2031
DE000A1HG1L4 2013 GBP 750 4.500 % 13 March 2043
Subordinated liabilities
Allianz SE, Munich DE000A1RE1Q3 2012 EUR 1,500 5.625 % 17 October 2042
DE000A14J9N8 2015 EUR 1,500 2.241 % 7 July 2045
DE000A2DAHN6 2017 EUR 1,000 3.099 % 6 July 2047
XS1556937891 2017 USD 600 5.100 % 30 January 2049
XS0857872500 2012 USD 1,000 5.500 % Perpetual
DE000A1YCQ29 2013 EUR 1,500 4.750 % Perpetual
CH0234833371 2014 CHF 500 3.250 % Perpetual
DE000A13R7Z7 2014 EUR 1,500 3.375 % Perpetual
XS1485742438 2016 USD 1,500 3.875 % Perpetual
Allianz Finance II B.V., Amsterdam DE000A1GNAH1 2011 EUR 2,000 5.750 % 8 July 2041
DE000A0GNPZ3 2006 EUR 800 5.375 % Perpetual

B _ Condensed Consolidated Interim Financial Statements
Interim Report for the First Half-Year of 2017 — Allianz Group 37
17 – Equity
EQUITY € MN
as of 30 June
2017
as of 31 December
2016
Shareholders' equity
Issued capital 1,170 1,170
Additional paid-in capital 27,758 27,758
Retained earnings1,2
26,055 27,087
Foreign currency translation adjustments (1,906) (762)
Unrealized gains and losses (net)3 11,122 11,830
Subtotal 64,198 67,083
Non-controlling interests 2,864 3,052
Total 67,062 70,135 1_As of 30 June 2017, include € (517) mn (31 December 2016: € (157) mn) related to treasury shares.
2_During the first half year of 2017, Allianz SE purchased for an amount of € 1,638 mn approximately 9.6
million own shares as part of its share-buy-back program announced in February 2017 with a total
volume of up to € 3.0 bn. Thereof 7,472,978 own shares in the amount of € 1,271 mn were cancelled
by the end of June 2017 without changing the registered capital of Allianz SE.
3_As of 30 June 2017, include € 264 mn (31 December 2016: € 297 mn) related to cash flow hedges.
DIVIDENDS In the second quarter of 2017, a total dividend of € 3,410 mn (2016:
€ 3,320 mn) or € 7.60 (2016: € 7.30) per qualifying share was paid to
the shareholders.

B _ Condensed Consolidated Interim Financial Statements
Interim Report for the First Half-Year of 2017 — Allianz Group 38
18 – Premiums earned (net)
PREMIUMS EARNED (NET) € MN
six months ended 30 June
Property-Casualty Life/Health
Consoli- dation Group
2017
Premiums written
Gross 29,388 12,118 (81) 41,425
Ceded (2,424) (300) 81 (2,643)
Net 26,964 11,818 - 38,782
Change in unearned premiums (net) (3,406) (232) - (3,639)
Premiums earned (net) 23,557 11,585 - 35,143
2016
Premiums written
Gross 28,856 12,357 (73) 41,140
Ceded (2,743) (323) 73 (2,993)
Net 26,113 12,034 - 38,147
Change in unearned premiums (net) (3,290) (277) - (3,567)
Premiums earned (net) 22,823 11,757 - 34,580
19 – Interest and similar income
INTEREST AND SIMILAR INCOME € MN
six months ended 30 June 2017 2016
Dividends from available-for-sale investments 1,227 1,023
Interest from available-for-sale investments 6,731 6,939
Interest from loans to banks and customers 2,131 2,274
Rent from real estate held for investment 459 463
Other 550 416
Total 11,099 11,115
20 – Income from financial assets and liabilities carried at fair value through income (net)
INCOME FROM FINANCIAL ASSETS AND LIABILITIES CARRIED AT FAIR
VALUE THROUGH INCOME (NET) € MN
six months ended 30 June 2017 2016
Income from financial assets and liabilities held for trading (net) 1,272 (322)
Income from financial assets and liabilities designated at fair value through income (net) 180 (109)
Income from financial liabilities for puttable equity instruments (net) (85) 134
Foreign currency gains and losses (net)1 (2,322) (195)
Total (954) (491)
1_These foreign currency gains and losses arise subsequent to initial recognition on all assets and
liabilities denominated in a foreign currency that are monetary items and not measured at fair value
through income.
21 – Realized gains/losses (net)
REALIZED GAINS/LOSSES (NET) € MN
six months ended 30 June 2017 2016
REALIZED GAINS
Available-for-sale investments
Equity securities 1,379 1,319
Debt securities 2,688 2,972
Subtotal 4,067 4,291
Other 268 581
Subtotal 4,335 4,872
REALIZED LOSSES
Available-for-sale investments
Equity securities (271) (257)
Debt securities (503) (469)
Subtotal (773) (726)
Other (33) (1)
Subtotal (806) (728)
Total 3,529 4,144
NOTES TO THE CONSOLIDATED INCOME STATEMENTS

B _ Condensed Consolidated Interim Financial Statements
Interim Report for the First Half-Year of 2017 — Allianz Group 39
22 – Fee and commission income
FEE AND COMMISSION INCOME € MN
six months ended 30 June 2017 2016
PROPERTY-CASUALTY
Fees from credit and assistance business 663 516
Service agreements 249 243
Subtotal 911 759
LIFE/HEALTH
Service agreements 60 64
Investment advisory 648 615
Subtotal 708 679
ASSET MANAGEMENT
Management and advisory fees 3,398 3,122
Loading and exit fees 283 231
Performance fees 149 127
Other 15 17
Subtotal 3,845 3,496
CORPORATE AND OTHER
Service agreements 750 288
Investment advisory and banking activities 388 355
Subtotal 1,138 643
CONSOLIDATION (1,012) (471)
Total 5,591 5,107
23 – Claims and insurance benefits incurred (net)
CLAIMS AND INSURANCE BENEFITS INCURRED (NET) € MN
six months ended 30 June
Property-Casualty Life/Health
Consoli- dation Group
2017
Gross (16,531) (10,089) 41 (26,579)
Ceded 975 251 (41) 1,185
Net (15,556) (9,838) - (25,394)
2016
Gross (16,419) (10,416) 39 (26,797)
Ceded 1,258 289 (36) 1,511
Net (15,162) (10,127) 3 (25,286)
24 – Change in reserves for insurance and investment contracts (net)
CHANGE IN RESERVES FOR INSURANCE AND INVESTMENT CONTRACTS
(NET) € MN
six months ended 30 June
Property-Casualty Life/Health
Consoli-dation Group
2017
Gross (261) (6,605) 35 (6,832)
Ceded 3 131 - 134
Net (258) (6,474) 35 (6,697)
2016
Gross (256) (7,371) (74) (7,701)
Ceded 3 160 - 163
Net (254) (7,211) (74) (7,539)
25 – Interest expenses
INTEREST EXPENSES € MN
six months ended 30 June 2017 2016
Liabilities to banks and customers (75) (89)
Deposits retained for reinsurance ceded (21) (34)
Certificated liabilities (119) (142)
Subordinated liabilities (315) (286)
Other (51) (55)
Total (582) (606)
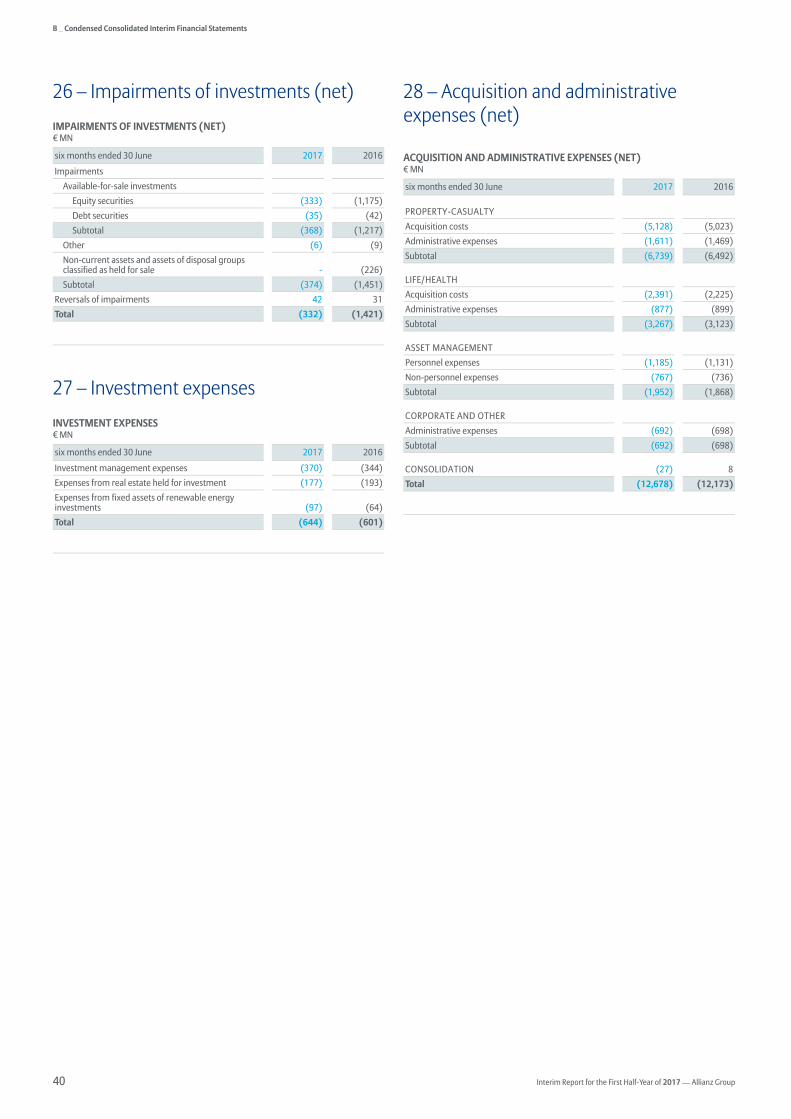
B _ Condensed Consolidated Interim Financial Statements
Interim Report for the First Half-Year of 2017 — Allianz Group 40
26 – Impairments of investments (net)
IMPAIRMENTS OF INVESTMENTS (NET) € MN
six months ended 30 June 2017 2016
Impairments
Available-for-sale investments
Equity securities (333) (1,175)
Debt securities (35) (42)
Subtotal (368) (1,217)
Other (6) (9)
Non-current assets and assets of disposal groups classified as held for sale - (226)
Subtotal (374) (1,451)
Reversals of impairments 42 31
Total (332) (1,421)
27 – Investment expenses
INVESTMENT EXPENSES € MN
six months ended 30 June 2017 2016
Investment management expenses (370) (344)
Expenses from real estate held for investment (177) (193)
Expenses from fixed assets of renewable energy investments (97) (64)
Total (644) (601)
28 – Acquisition and administrative expenses (net)
ACQUISITION AND ADMINISTRATIVE EXPENSES (NET) € MN
six months ended 30 June 2017 2016
PROPERTY-CASUALTY
Acquisition costs (5,128) (5,023)
Administrative expenses (1,611) (1,469)
Subtotal (6,739) (6,492)
LIFE/HEALTH
Acquisition costs (2,391) (2,225)
Administrative expenses (877) (899)
Subtotal (3,267) (3,123)
ASSET MANAGEMENT
Personnel expenses (1,185) (1,131)
Non-personnel expenses (767) (736)
Subtotal (1,952) (1,868)
CORPORATE AND OTHER
Administrative expenses (692) (698)
Subtotal (692) (698)
CONSOLIDATION (27) 8
Total (12,678) (12,173)

B _ Condensed Consolidated Interim Financial Statements
Interim Report for the First Half-Year of 2017 — Allianz Group 41
29 – Fee and commission expenses
FEE AND COMMISSION EXPENSES € MN
six months ended 30 June 2017 2016
PROPERTY-CASUALTY
Fees from credit and assistance business (663) (506)
Service agreements (201) (199)
Subtotal (864) (706)
LIFE/HEALTH
Service agreements (34) (28)
Investment advisory (315) (277)
Subtotal (350) (305)
ASSET MANAGEMENT
Commissions (694) (637)
Other (76) (31)
Subtotal (769) (668)
CORPORATE AND OTHER
Service agreements (859) (384)
Investment advisory and banking activities (168) (156)
Subtotal (1,027) (540)
CONSOLIDATION 838 296
Total (2,172) (1,923)
30 – Income taxes
INCOME TAXES € MN
six months ended 30 June 2017 2016
Current income taxes (1,367) (1,462)
Deferred income taxes (217) 156
Total (1,585) (1,306)
For the six months ended 30 June 2017 and 2016, the income taxes on
components of other comprehensive income consist of the following:
INCOME TAXES ON COMPONENTS OF OTHER COMPREHENSIVE INCOME € MN
six months ended 30 June 2017 2016
Items that may be reclassified to profit or loss in future periods
Foreign currency translation adjustments (50) (37)
Available-for-sale investments 245 (2,835)
Cash flow hedges 15 (109)
Share of other comprehensive income of associates and joint ventures 1 7
Miscellaneous 146 (12)
Items that may never be reclassified to profit or loss
Changes in actuarial gains and losses on defined benefit plans (120) 293
Total 237 (2,694)

B _ Condensed Consolidated Interim Financial Statements
Interim Report for the First Half-Year of 2017 — Allianz Group 42
31 – Financial Instruments and fair value measurement
FAIR VALUES AND CARRYING AMOUNTS OF FINANCIAL INSTRUMENTS The following table compares the carrying amount with the fair value
of the Allianz Group’s financial assets and financial liabilities:
FAIR VALUES AND CARRYING AMOUNTS OF FINANCIAL INSTRUMENTS € MN
as of 30 June 2017 as of 31 December 2016
Carrying amount Fair value
Carrying amount Fair value
FINANCIAL ASSETS
Cash and cash equivalents 17,154 17,154 14,463 14,463
Financial assets held for trading 3,297 3,297 2,907 2,907
Financial assets designated at fair value through income 5,157 5,157 5,426 5,426
Available-for-sale investments 511,147 511,147 512,268 512,268
Held-to-maturity investments 2,414 2,778 2,399 2,805
Investments in associates and joint ventures 7,624 9,528 7,161 9,031
Real estate held for investment 11,226 17,981 11,732 18,380
Loans and advances to banks and customers 104,496 120,899 105,369 124,422
Financial assets for unit-linked contracts 115,268 115,268 111,325 111,325
Derivative financial instruments and firm commitments included in other assets 473 473 677 677
FINANCIAL LIABILITIES
Financial liabilities held for trading 11,073 11,073 11,271 11,271
Liabilities to banks and customers 13,666 13,685 13,038 13,062
Financial liabilities for unit-linked contracts 115,268 115,268 111,325 111,325
Derivative financial instruments and firm commitments included in other liabilities 145 145 159 159
Financial liabilities for puttable equity instruments 2,669 2,669 2,894 2,894
Certificated liabilities 7,682 8,502 7,615 8,530
Subordinated liabilities 13,448 14,668 13,530 14,256
As of 30 June 2017, fair values could not be reliably measured for
equity investments whose carrying amounts totaled € 99 mn
(31 December 2016: € 100 mn). These investments are primarily
investments in privately held corporations and partnerships.
FAIR VALUE MEASUREMENT ON A RECURRING BASIS The following financial assets and liabilities are carried at fair value
on a recurring basis:
— Financial assets and liabilities held for trading, — Financial assets and liabilities designated at fair value through
income, — Available-for-sale investments, — Financial assets and liabilities for unit-linked contracts, — Derivative financial instruments and firm commitments included
in other assets and other liabilities, and — Financial liabilities for puttable equity instruments.
OTHER INFORMATION

B _ Condensed Consolidated Interim Financial Statements
Interim Report for the First Half-Year of 2017 — Allianz Group 43
The following tables present the fair value hierarchy for financial
instruments carried at fair value in the consolidated balance sheets
as of 30 June 2017 and 31 December 2016:
FAIR VALUE HIERARCHY (ITEMS CARRIED AT FAIR VALUE) € MN
as of 30 June 2017 as of 31 December 2016
Level 11 Level 2
2Level 3
3Total Level 1
1Level 2
2 Level 3
3Total
FINANCIAL ASSETS
Financial assets carried at fair value through income
Financial assets held for trading 366 2,918 13 3,297 447 2,451 9 2,907
Financial assets designated at fair value through income 3,966 1,045 145 5,157 4,205 1,043 178 5,426
Subtotal 4,332 3,964 158 8,454 4,652 3,494 187 8,333
Available-for-sale investments
Corporate bonds 28,800 197,682 14,837 241,319 29,233 201,489 14,152 244,874
Government and government agency bonds 32,937 164,890 555 198,383 33,476 165,099 339 198,914
MBS/ABS 141 20,535 193 20,869 175 20,702 519 21,396
Other 789 1,515 2,675 4,979 783 1,018 2,504 4,305
Equity securities 36,698 781 8,118 45,598 34,169 781 7,829 42,779
Subtotal 99,364 385,404 26,379 511,147 97,836 389,089 25,342 512,268
Financial assets for unit-linked contracts 93,339 21,445 485 115,268 91,071 19,877 377 111,325
Derivative financial instruments and firm commitments included in other assets - 472 - 473 - 677 - 677
Total 197,035 411,285 27,022 635,342 193,560 413,137 25,906 632,603
FINANCIAL LIABILITIES
Financial liabilities held for trading 28 1,302 9,742 11,073 36 1,538 9,697 11,271
Financial liabilities for unit-linked contracts 93,339 21,445 485 115,268 91,071 19,877 377 111,325
Derivative financial instruments and firm commitments included in other liabilities 1 143 - 145 3 156 - 159
Financial liabilities for puttable equity instruments 2,472 53 145 2,669 2,657 92 145 2,894
Total 95,841 22,943 10,372 129,155 93,767 21,664 10,220 125,650 1_Quoted prices in active markets
2_Market observable inputs
3_Non-market observable inputs
The valuation methodologies used for financial instruments carried
at fair value, the policy for determining the levels within the fair value
hierarchy, as well as the significant Level-3 portfolios, including the
respective narratives and sensitivities, are described in the Allianz
Group’s Annual Report 2016. No material changes have occurred
since this report was published.
SIGNIFICANT TRANSFERS OF FINANCIAL INSTRUMENTS CARRIED AT FAIR VALUE In general, financial assets and liabilities are transferred from level 1
to level 2 when liquidity, trade frequency, and activity are no longer
indicative of an active market. The converse policy applies for trans-
fers from level 2 to level 1.

B _ Condensed Consolidated Interim Financial Statements
Interim Report for the First Half-Year of 2017 — Allianz Group 44
Reconciliation of level 3 financial instruments
The following tables show reconciliations of the financial instru-
ments carried at fair value and classified as level 3.
RECONCILIATION OF LEVEL 3 FINANCIAL ASSETS € MN
Financial assets carried at fair value
through income
Available-for-sale investments –
Debt securities1
Available-for-sale investments –
Equity securities
Financial assets for unit-linked
contracts Total
Carrying value (fair value) as of 1 January 2017 187 17,513 7,829 377 25,906
Additions through purchases and issues 24 2,604 1,082 149 3,858
Net transfers into (out of) Level 3 (36) (600) 1 (25) (660)
Disposals through sales and settlements 105 (692) (482) (9) (1,079)
Net gains (losses) recognized in consolidated income statement (125) (8) 13 3 (118)
Net gains (losses) recognized in other comprehensive income - 219 (74) - 145
Impairments - (18) (175) - (192)
Foreign currency translation adjustments 5 (742) (70) (10) (817)
Changes in the consolidated subsidiaries of the Allianz Group - (15) (6) - (21)
Carrying value (fair value) as of 30 June 2017 158 18,260 8,118 485 27,022
Net gains (losses) in profit or loss attributable to a change in unrealized gains or losses for financial assets held at the reporting date (9) (79) - 3 (85)
1_Primarily include corporate bonds.
RECONCILIATION OF LEVEL 3 FINANCIAL LIABILITIES € MN
Financial liabilities held
for tradingFinancial liabilities for unit-linked contracts
Financial liabilities for puttable equity
instruments Total
Carrying value (fair value) as of 1 January 2017 9,697 377 145 10,220
Additions through purchases and issues 505 149 - 654
Net transfers into (out of) Level 3 (1) (25) - (26)
Disposals through sales and settlements (427) (9) - (437)
Net gains (losses) recognized in consolidated income statement 727 3 - 730
Net gains (losses) recognized in other comprehensive income - - - -
Impairments - - - -
Foreign currency translation adjustments (759) (10) - (769)
Changes in the consolidated subsidiaries of the Allianz Group - - - -
Carrying value (fair value) as of 30 June 2017 9,742 485 145 10,372
Net gains (losses) in profit or loss attributable to a change in unrealized gains or losses for financial liabilities held at the reporting date 676 3 - 678
B _ Condensed Consolidated Interim Financial Statements
Interim Report for the First Half-Year of 2017 — Allianz Group 45
FAIR VALUE MEASUREMENT ON A NON-RECURRING BASIS Certain financial assets are measured at fair value on a non-recurring
basis when events or changes in circumstances indicate that the
carrying amount may not be recoverable. If financial assets are
measured at fair value on a non-recurring basis at the time of im-
pairment, or if fair value less cost to sell is used as the measurement
basis under IFRS 5, corresponding disclosures can be found in note 26.
32 – Other information
CONTINGENT LIABILITIES AND COMMITMENTS As of 30 June 2017, there were no significant changes in contingent
liabilities, compared to the consolidated financial statements for the
year ended 31 December 2016.
As of 30 June 2017, outstanding commitments to invest in pri-
vate equity funds and similar financial instruments amounted to
€ 11,175 mn (31 December 2016: € 9,640 mn) and outstanding com-
mitments to invest in real estate and infrastructure amounted to
€ 5,369 mn (31 December 2016: € 3,979 mn). All other commitments
showed no significant changes.
33 – Subsequent events
ALLIANZ AND LIVERPOOL VICTORIA TO LAUNCH JOINT VENTURE IN THE UNITED KINGDOM PERSONAL INSURANCE MARKET Liverpool Victoria (LV=) will receive £ 500 mn from Allianz in ex-
change for a 49 percent stake in Liverpool Victoria General Insurance
(LV= GI). The new, long-term joint venture LV= GI, will acquire
Allianz’s personal home and motor insurer’s renewal rights while
Allianz will obtain LV= GI’s commercial insurer’s renewal rights. The
first stage of the transaction is expected to close during the second
half of 2017. The second stage of the transaction will take place in
2019 and will see Allianz pay £ 213 mn for a further 20.9 percent stake
in LV= GI through an agreed, forward purchase, based on a total
valuation of £ 1.020 bn for 100 percent of LV= GI. Both stages are
subject to regulatory approvals.

B _ Condensed Consolidated Interim Financial Statements
Interim Report for the First Half-Year of 2017 — Allianz Group 46
This page intentionally left blank

Interim Report for the First Half-Year of 2017 − Allianz Group 47
FURTHER INFORMATION

C _ Further Information
Interim Report for the First Half-Year of 2017 — Allianz Group 48
To the best of our knowledge, and in accordance with the applicable
reporting principles for interim financial reporting, the condensed
consolidated interim financial statements give a true and fair view of
the assets, liabilities, financial position and profit or loss of the group,
and the interim group management report includes a fair review of
the development and performance of the business and the position
of the group, together with a description of the material opportuni-
ties and risks associated with the expected development of the group
for the remaining months of the financial year.
Munich, 3 August 2017
Allianz SE
The Board of Management
RESPONSIBILITY STATEMENT

C _ Further Information
Interim Report for the First Half-Year of 2017 — Allianz Group 49
To Allianz SE, Munich
We have reviewed the condensed interim consolidated financial
statements of Allianz SE, Munich – comprising the consolidated
balance sheets, consolidated income statements, consolidated
statements of comprehensive income, consolidated statements of
changes in equity, consolidated statements of cash flows and select-
ed explanatory notes – together with the interim group management
report of Allianz SE, Munich, for the period from 1 January to 30 June
2017, that are part of the semi-annual financial report according to
§ 37w WpHG [“Wertpapierhandelsgesetz”: “German Securities Trad-
ing Act”]. The preparation of the condensed interim consolidated
financial statements in accordance with International Accounting
Standard IAS 34 “Interim Financial Reporting” as adopted by the EU,
and of the interim group management report in accordance with the
requirements of the WpHG applicable to interim group management
reports, is the responsibility of the Company’s management. Our
responsibility is to issue a report on the condensed interim consoli-
dated financial statements and on the interim group management
report based on our review.
We performed our review of the condensed interim consolidated
financial statements and the interim group management report in
accordance with the German generally accepted standards for the
review of financial statements promulgated by the Institut der
Wirtschaftsprüfer (IDW). Those standards require that we plan and
perform the review so that we can preclude through critical evalua-
tion, with a certain level of assurance, that the condensed interim
consolidated financial statements have not been prepared, in mate-
rial respects, in accordance with IAS 34 “Interim Financial Reporting”
as adopted by the EU, and that the interim group management report
has not been prepared, in material respects, in accordance with the
requirements of the WpHG applicable to interim group management
reports. A review is limited primarily to inquiries of company em-
ployees and analytical assessments and therefore does not provide
the assurance attainable in a financial statement audit. Since, in
accordance with our engagement, we have not performed a financial
statement audit, we cannot issue an auditor’s report.
Based on our review, no matters have come to our attention that
cause us to presume that the condensed interim consolidated finan-
cial statements have not been prepared, in material respects, in
accordance with IAS 34, “Interim Financial Reporting” as adopted by
the EU, or that the interim group management report has not been
prepared, in material respects, in accordance with the requirements
of the WpHG applicable to interim group management reports.
Munich, 3 August 2017
KPMG AG
Wirtschaftsprüfungsgesellschaft
Klaus Becker Andreas Dielehner
Wirtschaftsprüfer Wirtschaftsprüfer
(Independent Auditor) (Independent Auditor)
REVIEW REPORT

Financial calendar
Important dates for shareholders and analysts1
Financial Results 3Q _____________________________________________________________ 10 November 2017
Financial Results 2017 _____________________________________________________________ 16 February 2018
Annual Report 2017 __________________________________________________________________ 9 March 2018
Annual General Meeting _______________________________________________________________ 9 May 2018
Financial Results 1Q __________________________________________________________________ 15 May 2018
Financial Results 2Q/Interim Report 6M __________________________________________________ 3 August 2018
Financial Results 3Q ______________________________________________________________ 9 November 2018
1_The German Securities Trading Act (“Wertpapierhandelsgesetz”) obliges issuers to announce immediately any information which may have a substantial price impact. Therefore we cannot exclude that we
have to announce key figures related to quarterly and financial-year results ahead of the dates mentioned above. As we can never rule out changes of dates, we recommend checking them on the internet at
www.allianz.com/financialcalendar.
Allianz SE – Königinstrasse 28 – 80802 Munich – Germany – Phone + 49 89 3800 0 – www.allianz.com Interim Report on the internet: www.allianz.com/interim-report – Front page design: hw.design GmbH – Date of publication: 4 August 2017 This is a translation of the German Interim Report of Allianz Group. In case of any divergences, the German original is legally binding.