first half results 2015 - amazon s3s3-eu-west-1.amazonaws.com/.../2015/q2-presentation-.pdfno...
TRANSCRIPT

First Half Results 2015 Jeremy Darroch

2
This document contains certain forward looking statements with respect to the Group’s financial condition, results of operations and business and our strategy, plans and objectives for the Group. These statements include, without limitation, those that express forecasts, expectations and projections, such as forecasts, expectations and projections in relation to new products and services, the potential for growth of free-to-air and pay television, fixed line telephony, broadband and bandwidth requirements, advertising growth, DTH and OTT customer growth, Multiscreen, On Demand, NOW TV, Sky Go, Sky Go Extra, Mobile, Sky+HD and other products and services penetration, revenue, administration costs and other costs, advertising growth, churn, profit, cash flow, product penetration, our broadband network footprint, content, wholesale, marketing and capital expenditure.
These statements (and all other forward-looking statements contained in this document) are not guarantees of future performance and are subject to risks, uncertainties and other factors, some of which are beyond the Group's control, are difficult to predict and could cause actual results to differ materially from those expressed or implied or forecast in the forward-looking statements. These factors include, but are not limited to, the fact that the Group operates in a highly competitive environment and faces competition from a broad range of organisations, the effects of laws and government regulation upon the Group's activities, the fact that the Group’s business is based on a subscription model and its future success relies on building long-term relationships with its customers, its reliance on a complex technical infrastructure which is subject to risk of failure, change and development, failure of key suppliers, ensuring the effective management of the Group’s financial exposures, the fact that the Group must protect its customer and corporate data and prevent breaches of security, risks inherent in the implementation of large-scale capital expenditure projects, the fact that the Group relies on intellectual property and proprietary rights which may not be adequately protected under current laws or which may be subject to unauthorised use and the fact that people at Sky are critical to the Group’s ability to meet the needs of its customers and achieve its goals as a business.
Information on the significant risks and uncertainties are described in the "Principal risks and uncertainties" section of Sky's Annual Report for the full year ended 30 June 2014 and Interim Report for the half year ended 31 December 2014. Copies of the Annual Report and Interim Report are available from the Sky plc web page at www.sky.com/corporate. All forward-looking statements in this presentation are based on information known to the Group on the date hereof. The Group undertakes no obligation publicly to update or revise any forward-looking statements, whether as a result of new information, future events or otherwise.

3
First half highlights
Financials
Plans for 2015
4
Excellent first half of the year
• Strong financial performance
• Good growth in products and customers
• Increasing customer loyalty in all markets
5
Creating the new Sky
• Completed Sky Deutschland and Sky Italia transaction
• Good progress with integration planning
• Clear set of priority workstreams
• Sharing expertise and best practice
• Opening up expanded growth opportunity
6
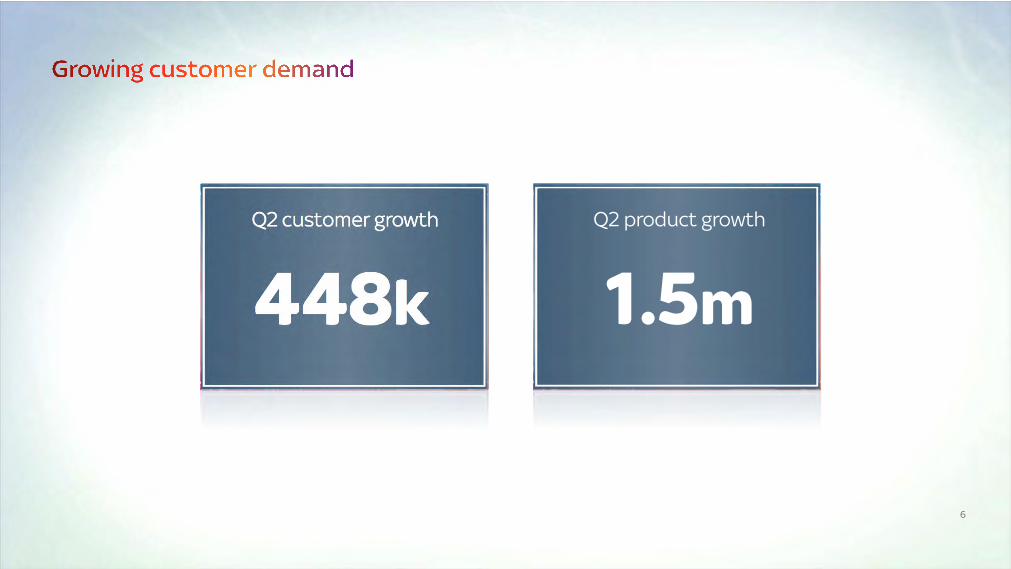
448k
Q2 customer growth
1.5m
Q2 product growth

7
EBIT
£675m
EPS
27.1p
Group revenue
£5,604m
Group revenues and Group EBIT on an adjusted basis assumes contribution from Italy and Germany from 1 July to 31 December 2014. Adj EPS assumes contribution from 13 Nov to 31 Dec 2014 All measures are from continuing operations and adjusted for exceptional items
+5% +16% +3%

8
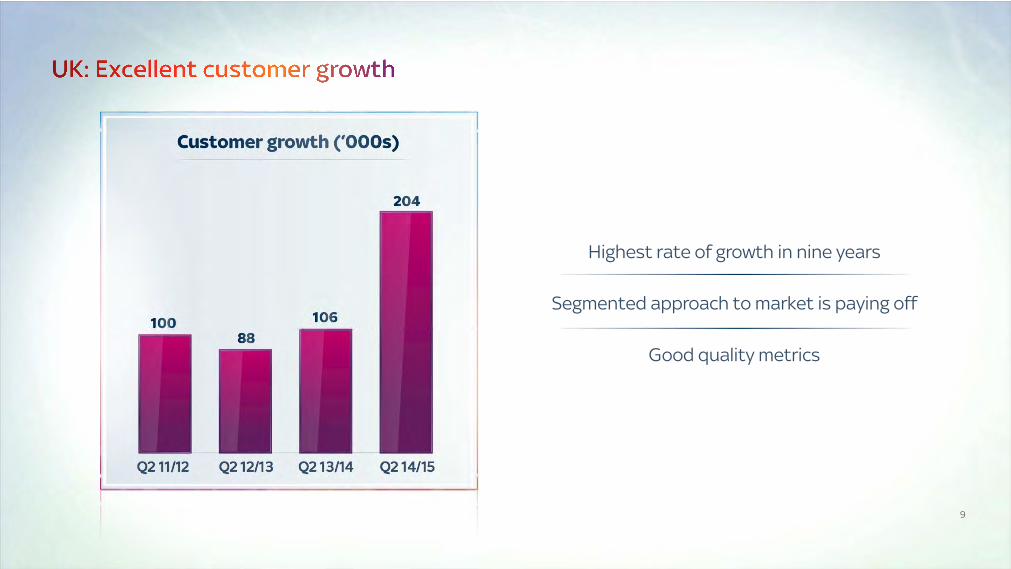
Q2 11/12 Q2 12/13 Q2 13/14 Q2 14/15
More than 1 million products added
TV growth more than doubled to 202,000
Strong performance in broadband
Monthly ARPU up to £47
Strong operational delivery across the board
9
Q2 11/12 Q2 12/13 Q2 13/14 Q2 14/15
Highest rate of growth in nine years
Segmented approach to market is paying off
Good quality metrics

10 Quarterly annualised churn
10/11 11/12 12/13 13/14 14/15
Best performance since 2003
Investment in connected home paying dividends
Focus on acquisition quality

11
12/13 13/14 14/15 12/13 13/14 14/15 13/14 14/15 12/13
12 month rolling churn

12
12/13 13/14 14/15 12/13 13/14 14/15 13/14 14/15 12/13
12 month rolling churn

Summary
• Excellent start to the year
• Significant outperformance in UK business
• Germany and Italy performing well
• Strong financial results
• Clear set of plans for 2015

Financial Results Andrew Griffith

15
Summary
• Excellent financial results
• Strong revenue growth
• Good performance on costs
• Double digit growth in profit and cash flow
Scandal

16
Enlarged group reporting
• Aligning calculation and definition of KPI’s
• Moving to the same accounting periods
• Aligning accounting policies
• Sky De will report locally under pre-existing basis
How to Train your Dragon 2
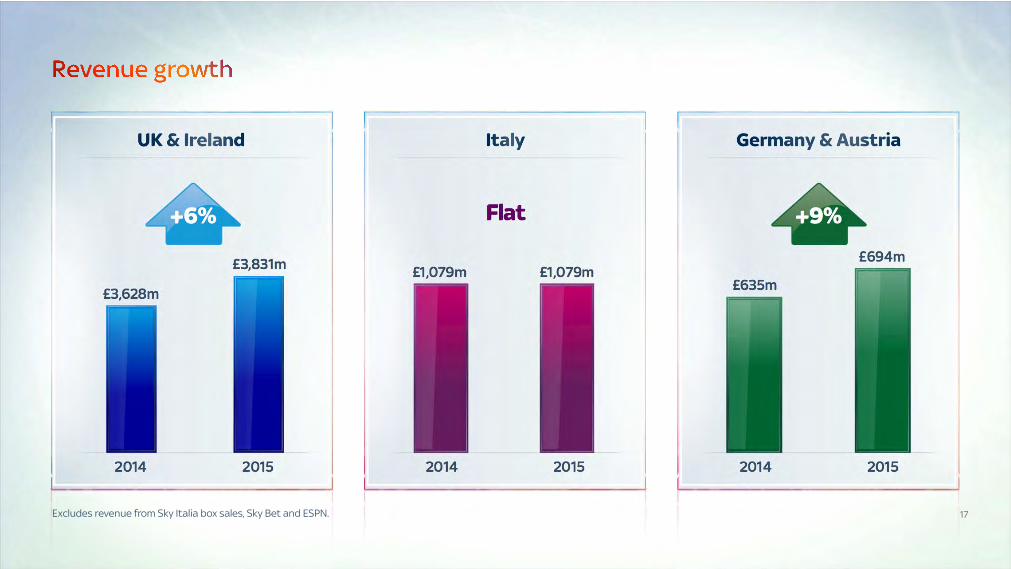
17
2014 2015
£3,628m
£3,831m
+6% +9% Flat
2014 2015
£1,079m £1,079m
2014 2015
£635m
£694m
Excludes revenue from Sky Italia box sales, Sky Bet and ESPN.
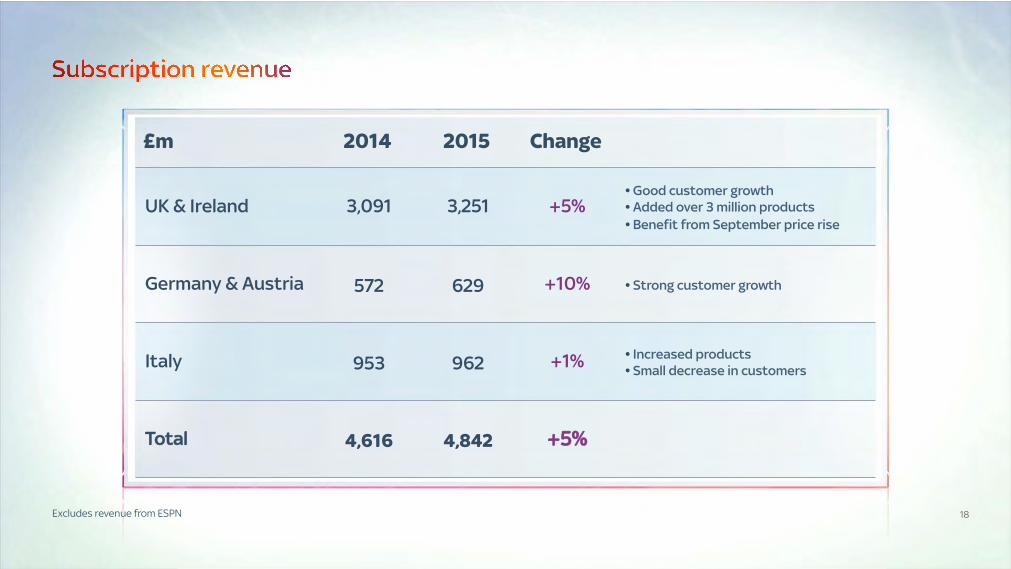
18
UK & Ireland 3,091 3,251 +5% • Good customer growth • Added over 3 million products • Benefit from September price rise
Germany & Austria 572 629 +10% • Strong customer growth
Italy 953 962 +1% • Increased products • Small decrease in customers
Total 4,616 4,842 +5%
£m 2014 2015 Change
Excludes revenue from ESPN

19
Transactional revenue from continuing operations and excludes the Froch Groves PPV events in 2014 and 2015 NOW TV year on year growth; Buy & Keep quarter on quarter growth
+16% CAGR
2015
£75m
£62m £56m
2014 2013
NOW TV transactions trebled
Buy & Keep revenue up over 100%
Future opportunities across the wider group
Accelerating growth
UK and Ireland Italy Germany
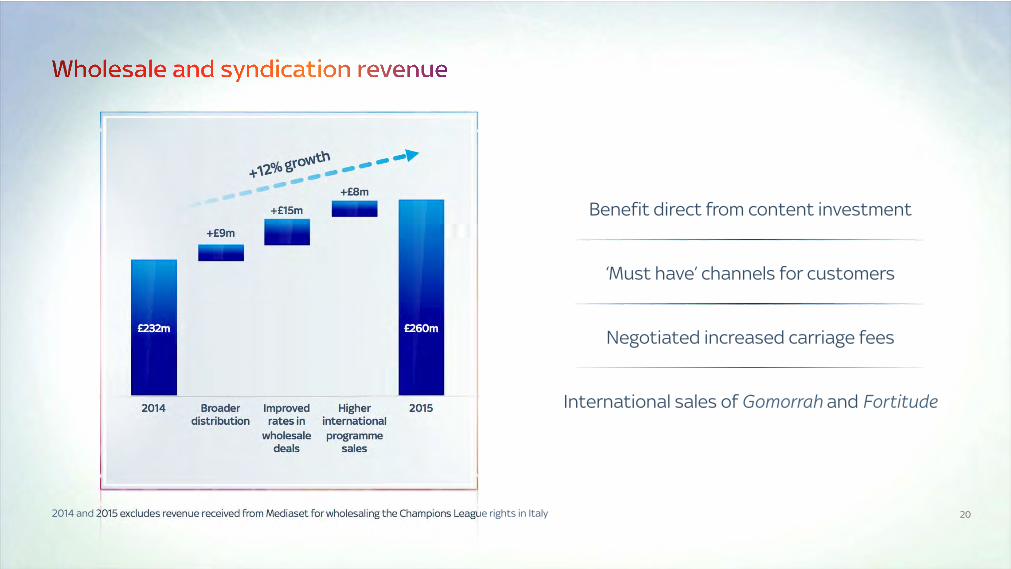
20 2014 and 2015 excludes revenue received from Mediaset for wholesaling the Champions League rights in Italy
‘Must have’ channels for customers
Negotiated increased carriage fees
International sales of Gomorrah and Fortitude
+12% growth
2014 Broader distribution
Higher international programme
sales
Improved rates in
wholesale deals
2015
£232m £260m
+£15m
+£8m
+£9m
Benefit direct from content investment
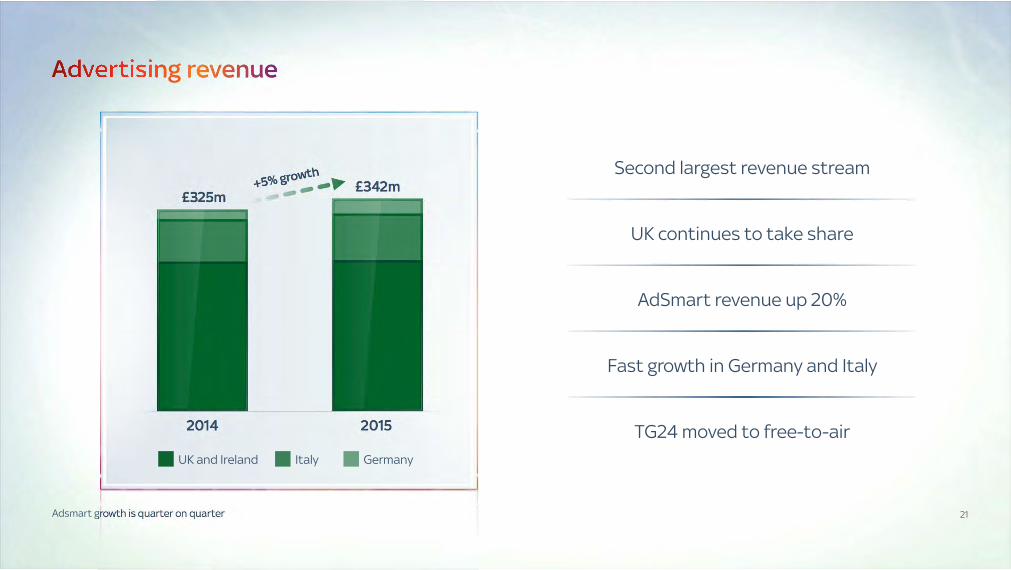
21 Adsmart growth is quarter on quarter
UK continues to take share
AdSmart revenue up 20%
Fast growth in Germany and Italy
TG24 moved to free-to-air
£325m +5% growth
£342m
2014 2015
Second largest revenue stream
UK and Ireland Italy Germany

Costs
23
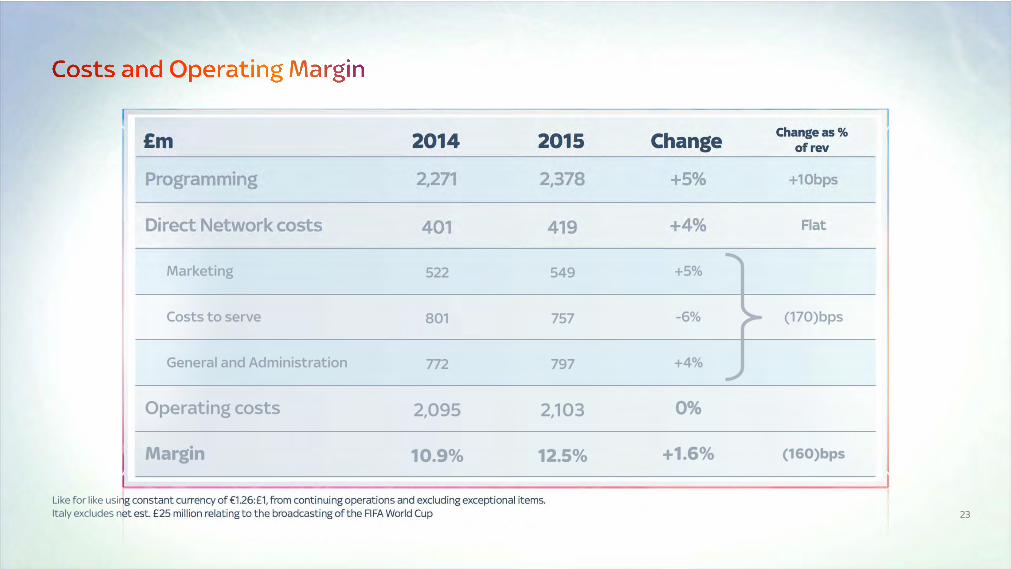
£m 2014 2015 Change Change as % of rev
Like for like using constant currency of €1.26:£1, from continuing operations and excluding exceptional items. Italy excludes net est. £25 million relating to the broadcasting of the FIFA World Cup
Programming 2,271 2,378 +5% +10bps
Direct Network costs 401 419 +4% Flat
Marketing 522 549 +5%
Costs to serve 801 757 -6% (170)bps
General and Administration 772 797 +4%
Operating costs 2,095 2,103 0%
Margin 10.9% 12.5% +1.6% (160)bps

24
£m 2014 2015 Change Change as % of rev
Like for like using constant currency of €1.26:£1, from continuing operations and excluding exceptional items. Italy excludes net est. £25 million relating to the broadcasting of the FIFA World Cup
Programming 2,271 2,378 +5% +10bps
Direct Network costs 401 419 +4% Flat
Marketing 522 549 +5%
Costs to serve 801 757 -6% (170)bps
General and Administration 772 797 +4%
Operating costs 2,095 2,103 0%
Margin 10.9% 12.5% +1.6% (160)bps

25
£m 2014 2015 Change Change as % of rev
Like for like using constant currency of €1.26:£1, from continuing operations and excluding exceptional items. Italy excludes net est. £25 million relating to the broadcasting of the FIFA World Cup
Programming 2,271 2,378 +5% +10bps
Direct Network costs 401 419 +4% Flat
Marketing 522 549 +5%
Costs to serve 801 757 -6% (170)bps
General and Administration 772 797 +4%
Operating costs 2,095 2,103 0%
Margin 10.9% 12.5% +1.6% (160)bps

26
£m 2014 2015 Change Change as % of rev
Like for like using constant currency of €1.26:£1, from continuing operations and excluding exceptional items. Italy excludes net est. £25 million relating to the broadcasting of the FIFA World Cup
Programming 2,271 2,378 +5% +10bps
Direct Network costs 401 419 +4% Flat
Marketing 522 549 +5%
Costs to serve 801 757 -6% (170)bps
General and Administration 772 797 +4%
Operating costs 2,095 2,103 0%
Margin 10.9% 12.5% +1.6% (160)bps
27
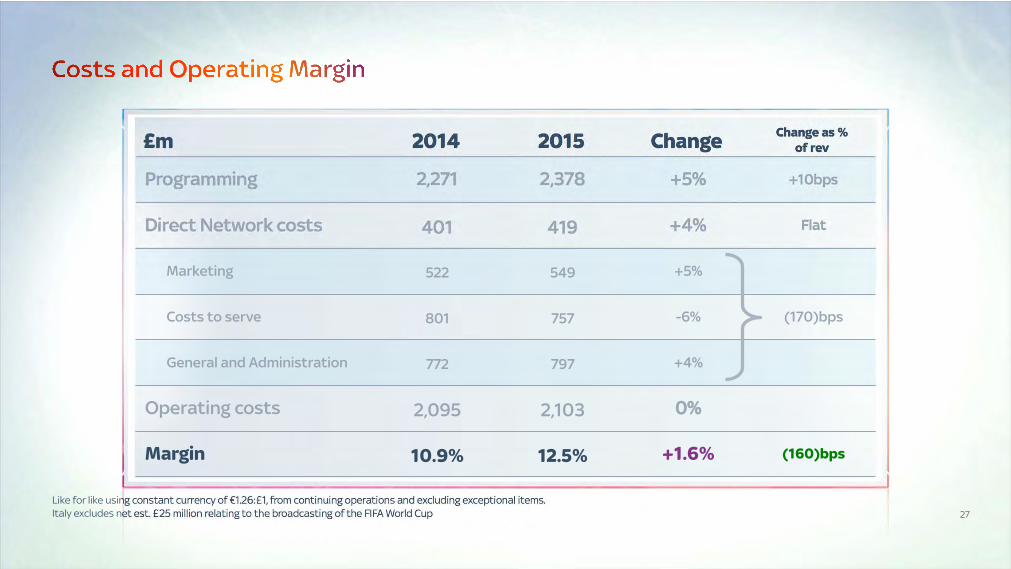
£m 2014 2015 Change Change as % of rev
Like for like using constant currency of €1.26:£1, from continuing operations and excluding exceptional items. Italy excludes net est. £25 million relating to the broadcasting of the FIFA World Cup
Programming 2,271 2,378 +5% +10bps
Direct Network costs 401 419 +4% Flat
Marketing 522 549 +5%
Costs to serve 801 757 -6% (170)bps
General and Administration 772 797 +4%
Operating costs 2,095 2,103 0%
Margin 10.9% 12.5% +1.6% (160)bps

28
Production and commissioning
New revenue opportunities
Back office, IT and procurement
Product and set top box development
Agreed common product roadmap
Leveraging scale in procurement
Synergies on-track
Good progress on integration
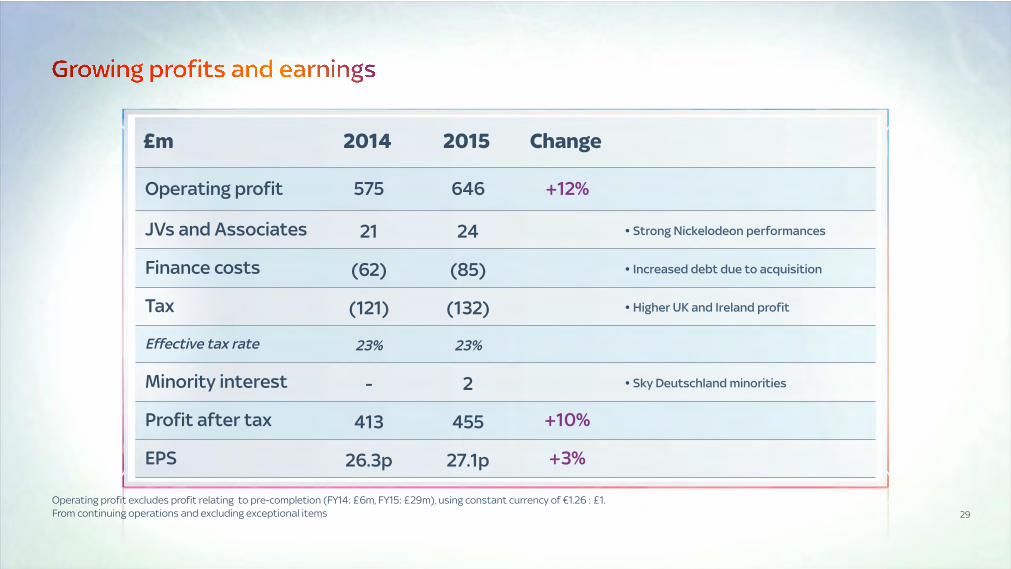
29
Operating profit 575 646 +12%
JVs and Associates 21 24 • Strong Nickelodeon performances
Finance costs (62) (85) • Increased debt due to acquisition
Tax (121) (132) • Higher UK and Ireland profit
Effective tax rate 23% 23%
Minority interest - 2 • Sky Deutschland minorities
Profit after tax 413 455 +10%
EPS 26.3p 27.1p +3%
£m 2014 2015 Change
Operating profit excludes profit relating to pre-completion (FY14: £6m, FY15: £29m), using constant currency of €1.26 : £1. From continuing operations and excluding exceptional items

30
Adjusted EBITDA 791 867 +10%
Working Capital (29) 51
Capex (Underlying) (226) (276)
Share-based payment expense 31 46
Operating free cash flow 567 688 +22%
Capex (Campus redevelopment) (18) (64)
Interest and tax (203) (185)
Joint ventures and associates 15 11
Free cash flow 361 450 +25%
£m 2014 2015 Change
Germany and Italy cash flow has been consolidated from 12 Nov 2014, using constant currency of €1.26 : £1 From continuing operations and excluding exceptional items

31
Hercules
Balance sheet well placed
• Net debt/EBITDA of 3.2x
– Lower than expected
– Medium term target of 2.0x
• Investment grade credit rating
• Pending £600 million of Sky Bet proceeds
Calculated by annualising the H1 FY15 EBITDA of £993 million

32
Game Of Thrones Series 4
Conclusion
• Strong financial results
• Grown revenues in every category
• Strong operating momentum
• Double digit growth in profit and cash

2015

34
Sell more to customers
Drive pay TV penetration
Develop adjacent businesses
Increase content investment
Programme sales
Advertising
Channel distribution
DTH
OTT
Additional TV products
Communications
Transactional services
Acquired content
Original production
Sport
I
Greater impact
Reduced cost
Increased speed

2015: UK

36
Making Sky even better for customers
Extending our lead in content
Efficient, flexible and agile organisation
Cross-selling at scale
Segmenting the market broadly
37
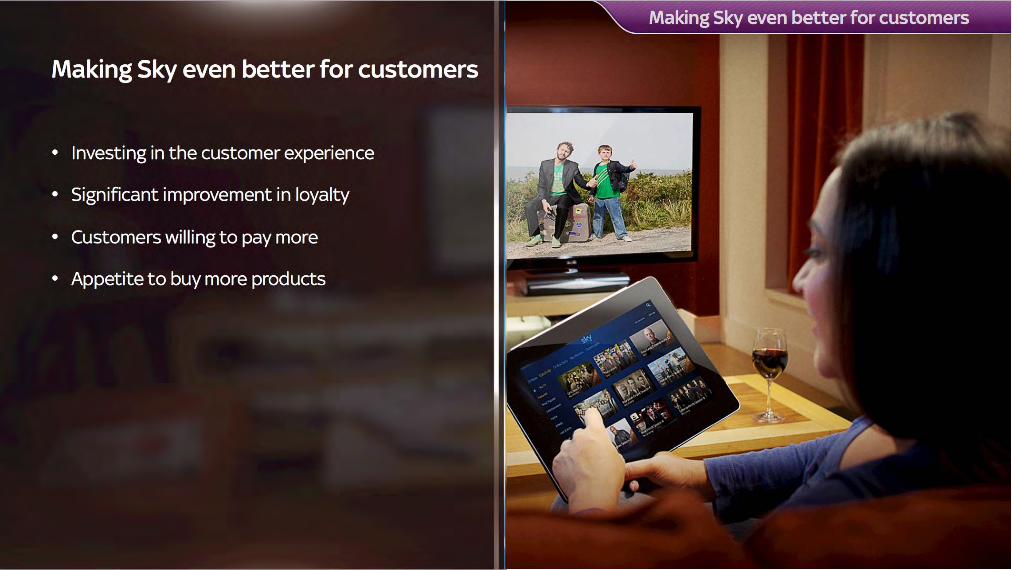
Making Sky even better for customers
• Investing in the customer experience
• Significant improvement in loyalty
• Customers willing to pay more
• Appetite to buy more products

38
• Increased flexibility with Sky Go and On Demand
• 8 million boxes connected by end-2015
• New homepage aiding content discovery
• Two thirds of On Demand downloads are pay content
• On Demand users are the best Sky advocates

39
• New source of revenue growth
• Clear market leadership
– 50% more latest titles than any other service
– 30 million monthly views across devices
• Pushing further in 2015
– Focus on adding more of the best titles
– Extending license periods
– Increased marketing support

40
• Leading brand with proven ability to stretch
• Broad product set for diverse customer needs
• Best go-to-market operation
– Data and analytics expertise
– PromoSmart targeting specific segments
• 40% triple play and growing
• Transactional revenue up 41%

41
1. Q. Which one of these brands do you believe is best able to bring together your household's entertainment and communication needs in the future? (Source: Populus January 2015; 1050 UK population) 2. Average products per customer
1.2
Q2 06/07
Q2 14/15
3.5
3.0
2.5
2.0
1.5
1.0
3.1
Virgin BT TalkTalk Netflix
35%
22%
13%
4% 3% 4% 1%
Apple EE
Which brand best brings together entertainment and communications?1
“”

42

43
• MVNO partnership with Telefonica UK
• Wholesale access to O2 network
• Voice and data services launching 2016
• Building on success in mobile content

44
Immediate
Flexible
Personal
Premium brand
Whole household
Unrivalled breadth of choice
Distinctive propositions
Differentiated cost models
Targeted marketing
NOW TV attracting new segment of customers
Almost 90% had not considered joining Sky
45
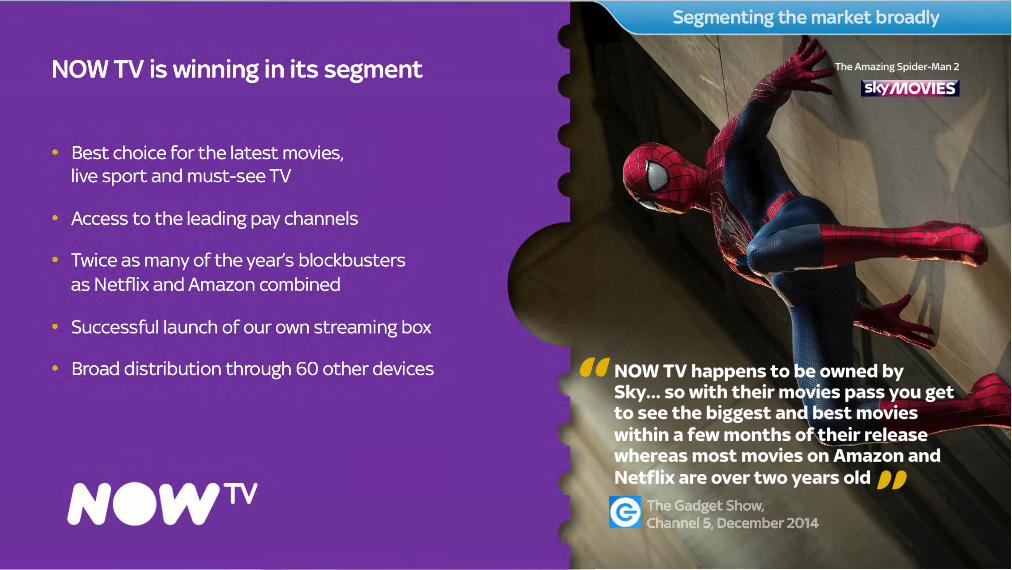
NOW TV is winning in its segment
• Best choice for the latest movies, live sport and must-see TV
• Access to the leading pay channels
• Twice as many of the year’s blockbusters as Netflix and Amazon combined
• Successful launch of our own streaming box
• Broad distribution through 60 other devices
The Amazing Spider-Man 2
NOW TV happens to be owned by Sky… so with their movies pass you get to see the biggest and best movies within a few months of their release whereas most movies on Amazon and Netflix are over two years old
“
”

46
Pushing harder with NOW TV in 2015
• Maintain sales momentum
• Increase marketing support with brand campaign
• Upgrade user interface and experience
• Leverage best ever content line-up
• Launch next-generation NOW TV Box

47
51%
Source: Populus January 2015 Base: 2073 UK Population Question: Which one of these brands do you think is the leader in TV entertainment?
Who is the leader in TV entertainment? “ ”

48
• Sky channels account for 44% of pay viewing
• All of the top five ‘must-have’ pay channels are Sky channels
• Premium customers watch more basic content than sport or movies
• Overall channel offering is the key reason for joining Sky
49
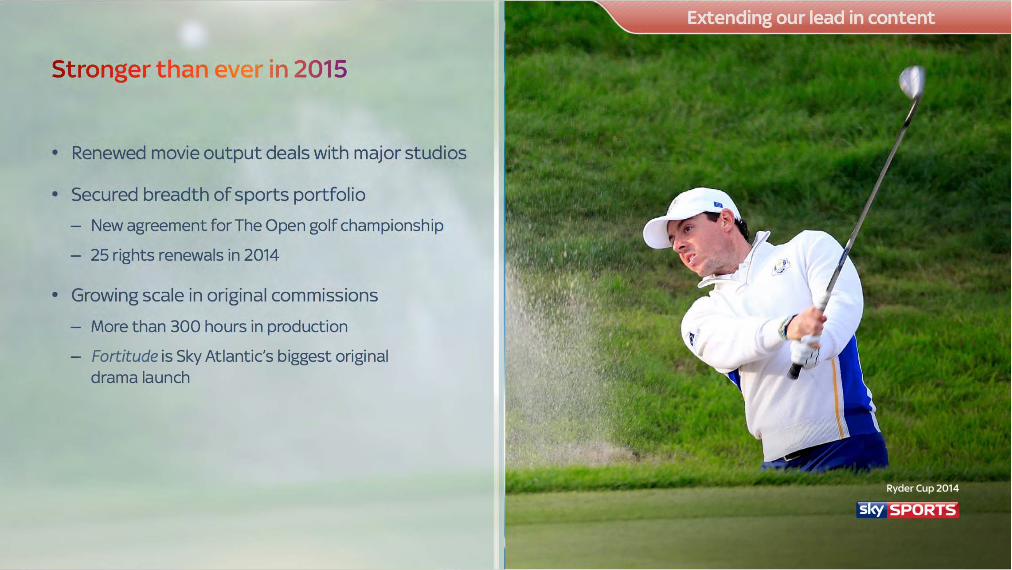
• Renewed movie output deals with major studios
• Secured breadth of sports portfolio
– New agreement for The Open golf championship
– 25 rights renewals in 2014
• Growing scale in original commissions
– More than 300 hours in production
– Fortitude is Sky Atlantic’s biggest original drama launch
Ryder Cup 2014

50

Efficient, flexible and agile organisation
• Creating capacity to invest
• Three key principles
– Product reliability
– Right first time
– Self-service
• 170 bps reduction in other operating costs as % of sales
• 24% improvement in service NPS
52
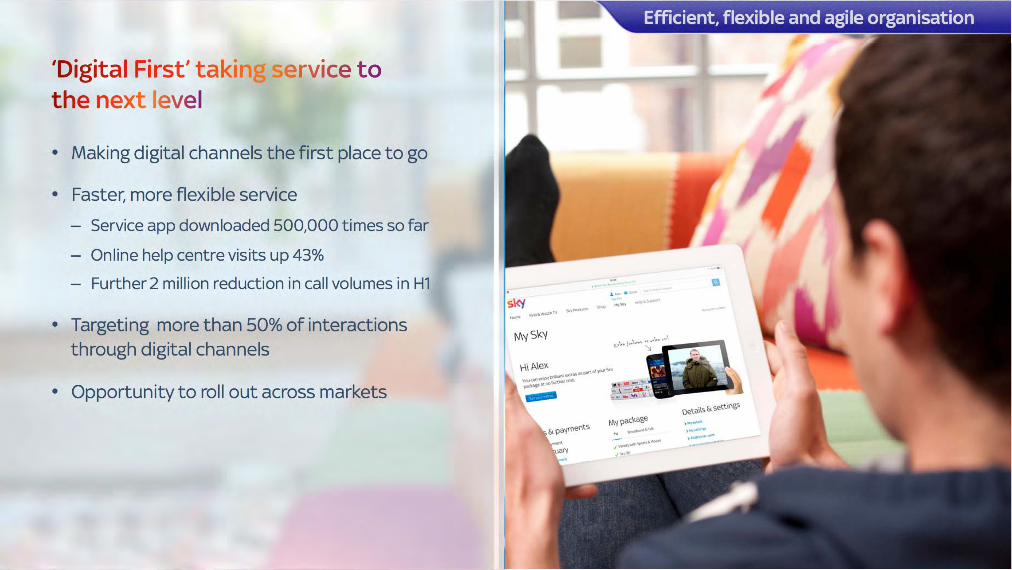
• Making digital channels the first place to go
• Faster, more flexible service
– Service app downloaded 500,000 times so far
– Online help centre visits up 43%
– Further 2 million reduction in call volumes in H1
• Targeting more than 50% of interactions through digital channels
• Opportunity to roll out across markets

Summary: Strong set of UK growth plans
• Clear plan for year ahead:
– Making Sky even better for customers
– Cross-selling at scale
– Segmenting the market broadly
– Extending our lead in content
– Efficient, flexible and agile organisation
• Broadly based revenue growth
• Increased capacity to invest

2015: Italy and Germany
55
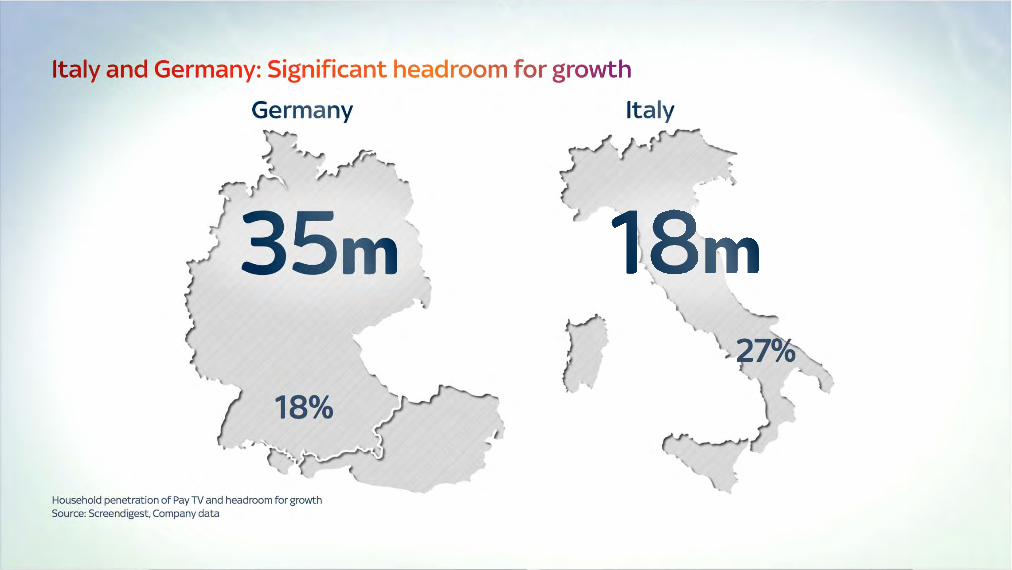
Household penetration of Pay TV and headroom for growth Source: Screendigest, Company data
27%
18%

56
Household penetration of Pay TV and headroom for growth Source: Screendigest, Company data

57
Italy and Germany: Extending leadership in content
• Market-leading position in premium movies and sport
• Developing strong entertainment offering
– Growing opportunity with Sky Atlantic
– Exploiting exclusivity on Sky Uno for franchises including X-Factor and Italia’s Got Talent
• Building capability in original programming
Gomorrah

58
• Targeting new segments with IPTV and OTT
– Extending reach with Sky Online
– Establishing own streaming box
• Monetising investment more broadly
– Extending FTA offering with cielo and TG24
– Growing international programme sales

59
• New products and services adding value and increasing loyalty
• Sky Go registered customers up over 75%
• 70% growth in On Demand usage
• ‘Restart’ feature coming to the UK

Conclusion
• The new Sky is performing well in all markets
• Clear set of growth plans
• Leveraging strengths in core areas
• Expanded headroom
• Enhanced value creation

Q & A
APPENDIX

63 Germany financials translated at exchange rate of 1 GBP: 1.26 EUR
Revenue 882 (10) (4) 6 874 694
Costs (877) 10 (6) (18) (891) (707)
EBITDA 58 (4) (18) 36 29
EBIT 5 - (4) - (18) (17) (13)
€’m
Sky DE reported
result
Sky DE period end 31 Dec
versus Sky Group
period end 28 Dec
Bring forward subscription
discounts over offer period rather than customer contract
Minor reclassification
between revenue and
cost to bring in line with the UK
Phasing of football rights costs over the season rather
than match day
Sky DE as within
Sky Group
Converted to GBP
(£)
64
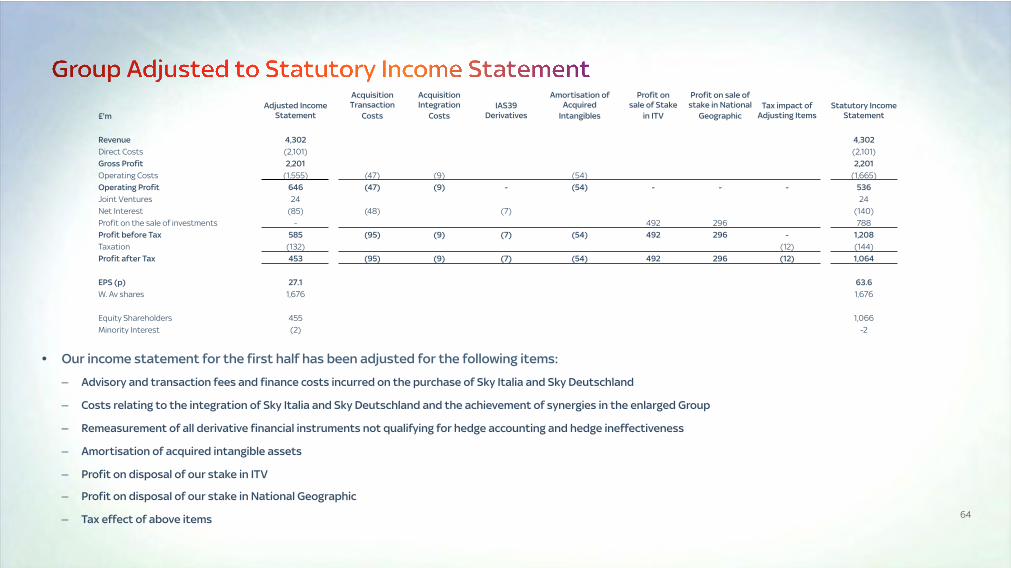
• Our income statement for the first half has been adjusted for the following items:
– Advisory and transaction fees and finance costs incurred on the purchase of Sky Italia and Sky Deutschland
– Costs relating to the integration of Sky Italia and Sky Deutschland and the achievement of synergies in the enlarged Group
– Remeasurement of all derivative financial instruments not qualifying for hedge accounting and hedge ineffectiveness
– Amortisation of acquired intangible assets
– Profit on disposal of our stake in ITV
– Profit on disposal of our stake in National Geographic
– Tax effect of above items
£'m Adjusted Income
Statement
Acquisition Transaction
Costs
Acquisition Integration
Costs IAS39
Derivatives
Amortisation of Acquired
Intangibles
Profit on sale of Stake
in ITV
Profit on sale of stake in National
Geographic Tax impact of
Adjusting Items Statutory Income
Statement
Revenue 4,302 4,302 Direct Costs (2,101) (2,101) Gross Profit 2,201 2,201 Operating Costs (1,555) (47) (9) (54) (1,665) Operating Profit 646 (47) (9) - (54) - - - 536 Joint Ventures 24 24 Net Interest (85) (48) (7) (140) Profit on the sale of investments - 492 296 788 Profit before Tax 585 (95) (9) (7) (54) 492 296 - 1,208 Taxation (132) (12) (144) Profit after Tax 453 (95) (9) (7) (54) 492 296 (12) 1,064
EPS (p) 27.1 63.6 W. Av shares 1,676 1,676
Equity Shareholders 455 1,066 Minority Interest (2) -2