firm-level implications of early stage venture capital investment — an empirical investigation
TRANSCRIPT
ier.com/locate/jempfin
Journal of Empirical Finance 14 (2007) 150–167www.elsev
Firm-level implications of early stage venture capitalinvestment — An empirical investigation☆
Dirk Engel a, Max Keilbach b,⁎
a Rheinisch-Westfälisches Institut für Wirtschaftsforschung, Hohenzollernstr. 1-3, D-45128 Essen, Germanyb Max-Planck Institute of Economics, Kahlaische Str. 10, D-07745 Jena, Germany
Accepted 3 March 2006Available online 30 August 2006
Abstract
We analyze the impact of venture capital finance on growth and innovation of youngGerman firms. On thebasis of statistical matching procedures we confirm findings that venture-funded firms have a higher numberof patent applications than those in the control group. However, these are obtained even before the venturecapitalists' investment, hence venture capitalists choose firms with demonstrated innovative output. Afterinvestment, the number of firms' patents does not differ significantly anymore, however their growth rates aresignificantly larger. This suggests that the higher innovativeness of venture-funded firms is due to theselection process of the venture capitalist prior to the funding rather than to the venture funding itself. Venturecapitalists seem to focus rather on commercialization of existing innovations and growth of the firm.© 2006 Elsevier B.V. All rights reserved.
JEL classification: L21; D21; D92; C14; C33Keywords: Firm demography; Firm start-ups; Firm growth; Venture capital; Patented inventions; Microeconometricevaluation methods
1. Introduction
Between 1995 and 2000 the German venture capital market evolved extraordinarily: Thevolume of newly closed deals has increased by a factor of nearly 8.1 One major factor in this regard
☆ Large parts of this paper were written while we were researchers at the Centre for European Economic Research(ZEW) in Mannheim, Germany. We gratefully acknowledge financial support by the German Science Foundation (DFG)within research focus “Interdisziplinäre Gründungsforschung” under contract number STA 169/10-1. We are indebted toone of the editors and to two anonymous referees for helpful comments.⁎ Corresponding author. Tel.: +49 3641 686 770; fax: +49 3641 686 710.E-mail address: [email protected] (M. Keilbach).
1 Between 2001 and 2004, the number and volume of newly closed deals has decreased considerably.
0927-5398/$ - see front matter © 2006 Elsevier B.V. All rights reserved.doi:10.1016/j.jempfin.2006.03.004

151D. Engel, M. Keilbach / Journal of Empirical Finance 14 (2007) 150–167
was certainly the implementation of the “Neuer Markt”, the German equivalent to the UnitedStates' NASDAQ, and the exit opportunities related to it. A second major factor was the diffusionand adoption of information and communication technologies and a corresponding wave of firmstart-ups. These start-ups were expected to exhibit large growth rates but also required large initialinvestments that classic banks were usually not able or willing to finance. A third factor inGermany was the influence of the “Technologiebeteiligungsgesellschaft (tbg)”, a public orga-nization that co-invests with private lead investors to double the financial volume of the deal.Moreover, it acts like an insurance by partly covering the risk that the deal may fail.
The commitment of the German government to make it easier for young technology-orientedfirms to access venture funds is based on the assumption that these firms are more innovative andare able to open or capture new market niches more easily. Thus, these firms are believed to growfaster, therefore generating employment and fostering structural adjustments to the Germaneconomy. If these firms are provided with venture capital along with corresponding services (suchas management support), so the implicit assumption, they will perform even better.
In this paper, we investigate these assumptions empirically. More specifically, we aim toinvestigate whether venture-funded firms perform better in terms of employment growth ratesand innovative output. To do so, we set up a new dataset on young German firms. For each ofthese firms we identify a number of variables on the firm level, the industry level and the regionallevel. Moreover, we identify whether the firm has been venture-funded. By merging this datasetwith data from the German Patent Office, we are able to describe the innovative behavior of thesefirms using the number of patent applications as a proxy variable for innovative output. Firmsfunded with venture capital are then compared with others in terms of growth rate and innovativeoutput using a statistical matching approach. This approach corrects for statistical biases thatoccur when firms of different characteristics are compared on the basis of standard econometricmethods.
The paper provides evidence on several levels: Firms with a higher number of patents have ahigher probability of receiving venture capital. Once a venture capitalist is involved, firms showgreater employment growth rates but no significant differences in the innovative output measuredas number of patents granted. We conclude from these findings that after the involvement of aventure capitalist, firms switch from innovation to commercialization of their products andtherefore are able to realize superior growth rates. This suggests that the higher innovativeness ofventure-funded firms is due to the selection process of the venture capitalist prior to the fundingrather than to the venture funding itself. These findings are in line with Hellmann and Puri (2000)but throw a new perspective on the findings of Kortum and Lerner (2000) concerning the impact ofventure funding on innovation.
The following section gives an overview on the literature that deals with the implications ofventure capital funding on firm growth and innovation. Section 3 presents the dataset, Section 4presents the evaluation procedure, and the results are dicussed in Sections 5 and 6.
2. The impact of venture capital funding on growth and innovative behavior of firms
Venture capital is a financing form suitable for projects or ventures that have great financialneeds and great risks involved, but at the same time, they also have a high potential for growth andhence for potentially large profits. A deal between a venture capitalist and a portfolio firm impliesthat the former provides not only venture funding but also management advice to close the gap inmanaging non-technical shortcomings (Amit et al., 1998; Berger and Udell, 1998; Gompers andLerner, 1999; Hellmann and Puri, 2002).

152 D. Engel, M. Keilbach / Journal of Empirical Finance 14 (2007) 150–167
Very often, the selection of portfolio firms is made under the assumption that innovative firmshave a greater growth potential and therefore offer larger potential profits. In this section wesurvey on the literature on venture capital and its relation to firm performance and innovation.
2.1. Venture capital and firm growth
A number of studies empirically examine the relationship between venture funding and firmperformance (see Schefczyk (2000) for a detailed overview). Sapienza (1992) found that theprovided services are positively related to the performance of venture-funded firms. Jain and Kini(1995) show that publicly listed venture-funded firms in the U.S. have a higher growth in cashflow and sales compared to non-venture-funded ones. Bottazzi and da Rin (2002), who analyzedthe growth performance of 270 venture-funded firms listed at European Stock Exchanges, cannotsupport these findings. While both studies use an adequate number of variables to select a controlgroup, the selection of the venture-funded firms itself does not seem to be appropriate: since onlysuccessfully funded firms go public, the growth impact of venture capital is overstated by thisselection.
Lerner (1999) evaluates the long run success of firms participating in the Small BusinessInnovation Research (SBIR) program, a major public assistance initiative in the United States forhigh-technology firms. Those firms receiving assistance from SBIR achieved significantly higheremployment and sales growth rates than similar firms that were not assisted by SBIR between1983 and 1995. These differences are even more pronounced in regions with high venture capitalactivity. The findings of Manigart and Hyfte (1999) for 187 Belgian venture-funded firms arequite different. Belgian venture-funded firms do not achieve a significantly higher employmentgrowth than non-venture-funded firms of the same industries, of similar size, and similar age.However, they observe higher growth rates in total assets and cash flow. Buergel et al. (2000) donot observe any significant effect of venture capital finance on firms' sales and employmentgrowth. Their multivariate analysis of the determinants of firm growth is based on a survey of 500German and British high-tech start-ups. Coopers & Lybrand and EVCA (1996) found thatventure-funded firms grew more than seven times faster than the top 500 European firms.Although this is impressive, it remains unclear how this difference is derived since the choice ofthe control group does not seem to be appropriate in that study. In setting up the approach to beused in this paper (in Section 4), we will discuss this further and suggest a more appropriatemethod.
2.2. Venture capital and firms' innovative bevahior
Despite the increasing importance of venture capital investment, the relation between this typeof investment and the innovative behavior of firms has rarely been analyzed. For Germany, wehave been unable to find any analysis.
Kortum and Lerner (2000) examine the influence of venture capital on patented innovation inthe manufacturing industries in the US. Using different structural forms of a patent productionfunction, they estimate the productivity of innovation projects financed through venture capital tobe significantly higher than projects financed by private R&D funds, although these estimatesdiffer widely according to the specification of the regression equation.2
2 Depending on the form of the regression equation, they estimate that the productivity of venture-funded firms is between1.5 and 40 times larger compared to non-venture-funded ones, most of the estimation results lying between 1.5 and 3.

153D. Engel, M. Keilbach / Journal of Empirical Finance 14 (2007) 150–167
Furthermore, Kortum and Lerner show that venture-funded firms receive not only a largernumber of patent awards but also higher scores concerning different variables that can be expectedto be correlated with the value of the patent.3 They take these findings as evidence in favor of thehypothesis that venture-funded firms are more innovative, producing a larger and higher valuedstock of patents. They state that venture capital accounted for 8% of overall industrial innovation in1983–1992.
Hellmann and Puri (2000) analyze a set of cross-section data on 149 Silicon Valley firms in thecomputer, telecommunications, medical and semiconductor industries. This dataset containsinformation concerning the founding strategy of the firm, namely whether the firm follows aninnovator strategy or an imitator strategy. Based on a probit regression they find that firmsthat pursue an innovation strategy are more likely to obtain venture funding than imitating firms.On the basis of Cox regressions, the authors find that innovators also obtain venture capital morequickly. Furthermore, they find that receiving venture capital funding is associated with asignificant reduction in the time to bring a product to market.
The approach chosen in this paper differs from the ones chosen by the authors cited above.Since we use firm-level data instead of industry data, we are able to identify a number of firm-specific variables that can be expected to influence firms' growth and innovative performance.Specifically, we are able to identify two effects. First, for venture-funded firms, we can identifythe exact moment of the venture involvement and thus the ex ante and ex post performance ofthese firms. Second, we are able to identify “twin” firms, i.e. firms that are similar with respect toage, size, industry affiliation and other variables while only one firm of each twin receives venturefunding. By building these matched pairs, and analyzing their behavior statistically, we implicitlycorrect for industry affiliation and timing effects that might bias the results by Kortum and Lerner.Based on our data we find that while on the aggregate level, venture-funded firms do indeed growfaster and show stronger innovative behavior, a microeconometric, i.e. firm-level analysis leads todifferent results.We conclude that an aggregate analysis might not be appropriate and thatprevious studies on this level might be biased.
3. The data
Our analysis is based on a microlevel database on German firms that is developed andmaintained by ZEW in Mannheim, Germany. The raw data of this firm-specific information hasbeen provided by Creditreform, the largest German credit rating agency (see Almus et al. (2000)for more details on this data). The data is updated and extended twice a year which allows theZEW to build up a panel structure. These updates cover information on previously surveyed firmsand information about newly created firms.
This dataset comprises virtually all firms registered in the German trade register. However,firms are only entered in the database with a time lag. Thus, only 60% of the firms created in 2000are recorded by January 2002; virtually full coverage is attained after a 4 year time lag. Therefore,we limit our analysis on new firms with foundation date between 1995 and 1998. Plausibilitychecks with data from the German Venture Capital Association (BVK, 2000b) indicate that ourdatabase covers virtually all firm start-ups from that time period that received venture capital, i.e.we have full coverage for this period.
This database covers a number of firms-specific variables, such as number of a firm'semployees, foundation date, main economic activity (i.e. industry affliation expressed by NACE
3 See e.g. Lanjouw et al. (1998), Lanjouw and Schankerman (1999), Harhoff et al. (2003) for a discussion of this issue.

154 D. Engel, M. Keilbach / Journal of Empirical Finance 14 (2007) 150–167
classification), legal state, details on natural and legal owners, owners liability status and firms'addresses. A number of variables concerning the spatial environment of firms can be derived fromthe latter. This includes e.g. information on the population density of the region where the firm islocated or distances to different types of scientific research centers. The database does notexplicitly cover information on the firms' growth rate, on whether the firm is venture-funded oron the number of patents applied for by each firm. These variables are either computed or mergedto our dataset from other sources.
The identification of venture-funded firms is based on a computer-assisted string search(including information on names and addresses of venture capital companies) in the variablescovering ownership information. All venture capital companies that are private equity investorsand full members of European Venture Capital Association (EVCA) or German Venture CapitalAssociation e.V. (BVK) come into question.We identify these on the basis of the correspondingregisters (BVK, 2000a,b; EVCA, 2000). Associate members are not taken into considerationbecause their business activities focus exclusively onmanagement support. Additionally, membersof U.S. National Venture Capital Association are considered with activities in 1999 at the U.S.venture capital market (VentureOne, 1999) and a search for key words like “venture capital” or“private equity”was carried out to identify firms with obvious venture capital activities.We did notinclude ventures with a silent partner (such as e.g. business angels) since they are not recorded inthe trade register (Jacobs and Scheffler, 1998). However, exclusively silent partnerships do notplay an important role in early stage financing of profit accounting venture capitalists (see Engel(2004) for further explanations).
In this study we use two measures of firm performance: firm growth and firms' innovativebehavior. We measure firm growth as the rate of average annual employment growth gi for eachfirm i, hence
ɡi ¼ 1nEi;tl−1nEi;tk
tl−tk; ð1Þ
where tk, tl denote points in time (tlN tk) and Ei,t denotes the number of employees at firm i at time t.Note that tk and tlmight be different for firms of different cohorts. Of course, employment growth isnot part of the objective function of venture capital investors. Their interest lies more in the growthof the firm value, which determines the rentability of the venture investment at the time of exit.However, a measure for the value of the firm is not available for the firms in our dataset. Othermeasures that are closely related to firm value such as sales or returns4 are also not available.Measuring firm performance by employment growth has three advantages. First, it allows us torelate our findings to other studies (cited in Section 2.1) that also used employment growth asperformance measure. Second, although employment growth might not be in the objective functionof venture capitalists, it is certainly in that of public venture capitalists. Indeed the SBIR program(Lerner, 1999) or the activity of the German tbg are motivated by the expectation of such impactson employment. Third, using another database on small and medium-sized German firms, we foundsales and number of employees to be nearly linearly correlated,5 leading us to expect that growth ofboth variables is also highly correlated. We therefore consider the development of the employmentlevel as the best appropriate measure of the potential of the business idea.
4 Highly innovative start-ups rarely generate profits in the early stage of their life-cycle. Indeed, in our observationperiod, the value of a firm when going public was often large even though the firm had generated considerable financiallosses. Hence returns are not an appropriate value measure here.5 The correlation coefficient is at 0.94 and statistically significant. The database used is the Mannheim Innovation Panel
(MIP), which is based on questionnaires. Although it is small, it is very detailed.
155D. Engel, M. Keilbach / Journal of Empirical Finance 14 (2007) 150–167
Innovative behavior is measured using count data on patent applications at the German PatentOffice (DPA). To apply for a patent at the DPA implies lower fees as compared to applications atthe European Patent Office (EPO). This implies that smaller firms that are not able (or willing) tobear the higher fees will apply only at the DPA. On the other hand, applications at the EPO thatcover the German territory will appear in the DPA dataset (PATDPA) as well. Hence, we canexpect the German database to be more complete.
The assignment of patent applications to firms is realized using a computer-assisted mergingprocedure similar to the one used for identification of venture-funded firms. Both data bases, the firmdata and the patent application data, cover information on the firms' names and their location. Themerging algorithm synchronizes both databases using the information in these strings.
The use of patent applications as an output measure of innovative behavior has often beencriticized. Patents are primarily legal titles that protect the output of an innovation process frombeing copied. Hence firms can be expected to apply for a patent if they believe that this is ameaningful way of protecting their intellectual property. However firms might use other strategiesto protect their innovations, such as secrecy or speed of innovation. Thus, for at least three reasons,not all innovative output can be expected to be patented. First, not all innovations are patentablesuch as e.g. innovations in the service sector. Second, even if an innovation is patentable, a firmmight choose not to apply for a patent because the duration of the procedure is too long relative tothe duration of the innovation cycle. And third, a firm might not apply because it must disclose atleast some of the knowledge that is imbedded in the innovation (see Griliches (1990) for anextended discussion of this topic).
Nevertheless, using patent applications is still the dominant approach to measuring innovativeoutput (e.g. Kortum and Lerner, 2000) since it is the most detailed and best documented data oninnovative output available. Other datasets, such as the Community Innovation Survey of theEuropean Union, give more general measures of innovative output. However the number ofobservations is very small and in connection with our research question not viable. We thereforefollow Kortum and Lerner (2000) and refer to patent applications as the measure of firms'innovation output. We control for the strategic aspect of patenting by controlling for industryaffiliation in our analysis, assuming that the strategies of protecting innovative output are similarwithin industries.
We limit our analysis to industries where we observed at least one venture-funded firm. Also,we only consider firms with Limited Partnership (GmbH or GmbH & Co. KG) or Public LimitedCompanies (AG) as legal forms. The registration of the start-up date of a firm with other legalforms can be very biased (i.e. delayed). Note however that all firms in our database that receivedventure capital had limited legal forms, i.e. we do not reduce our sample of venture-funded firmsdue to this restriction. Moreover, we include only firms that have at least two entries with respectto their firm size so that we can compute a growth rate according to Eq. (1) and we limit ouranalysis to industries that have at least one patent application. On the basis of these requirements,our sample covers 21,375 non-venture-funded and 142 venture-funded firms (i.e. 0.66% of thefirms in the sample).
Table 1 enumerates the variables in the dataset. We use an ad-hoc mixture of 2-digit and 3-digitindustry classifications such that industries with higher shares of venture funding (mainly in theservice sector) are implemented on a more detailed level. The corresponding NACE codes aregiven in brackets. Columns 2 (VF: venture-funded) and 3 (NVF: non-venture-funded) of thistable show the mean value of each variable for both sets of firms as well as the results of astatistical test for identity (with significance levels denoted by stars). The values express sharesunless denoted otherwise.

Table 1Difference between venture-funded and non-venture-funded firms in our dataset
Firm characteristics at foundation Shares (unless denoted otherwise)
VF NVF
Firm-specific characteristicsStart-up size (number of employees) 6.979 5.165⁎⁎
Limited partnership (GmbH & Co KG) 0.148 0.092⁎
Public limited company (AG) 0.099 0.016⁎⁎⁎
Involvement of other (non VC) firms 0.472 0.279⁎⁎⁎
Team foundation 0.620 0.451⁎⁎⁎
Founding team of mixed gender 0.106 0.123Founders are of female gender 0.014 0.103⁎⁎⁎
Gender unknown 0.120 0.083
Education of foundersDoctoral degree 0.289 0.078⁎⁎⁎
Postgraduate degree 0.528 0.385⁎⁎⁎
Higher education on the job 0.014 0.074⁎⁎⁎
Medium education on the job 0.254 0.389⁎⁎⁎
Low education 0.021 0.028Education level unknown 0.296 0.244
Patenting behaviorNo patents before foundation date 0.894 0.979⁎⁎⁎
One patent before foundation date 0.035 0.009⁎
2…4 patent before foundation date 0.028 0.0085…19 patent before foundation date 0.042 0.004⁎
20...49 patent before foundation date 0.000 0.000
Industry affiliation (with Nace code)Manuf. of food products etc. (15) 0.007 0.021⁎
Manuf. of wearing apparel etc. (18) 0.007 0.005Manuf. of wood and its products etc. (20) 0.014 0.015Publishing, printing etc. (22) 0.021 0.045⁎
Manuf. of chemicals and chemical products (24) 0.028 0.014Manuf. of rubber and plastic products (25) 0.007 0.020⁎
Manuf. of other non-metallic mineral products (26) 0.021 0.023Manuf. of fabricated metal products etc. (28) 0.021 0.071⁎⁎⁎
Manuf. of machinery and equipment n.e.c. (29) 0.021 0.060⁎⁎⁎
Manuf. of office machinery and computers (30) 0.021 0.011Manuf. of electrical machinery and apparatus n.e.c. (31) 0.042 0.015Manuf. of radio, television and communication equipment (32) 0.021 0.010Manuf. of medical, precision and optical instruments etc. (33) 0.035 0.039Manuf. of motor vehicles, trailers and semi-trailers (34) 0.014 0.012Manuf. of furniture; manufacturing n.e.c. (36) 0.007 0.022⁎⁎
Recycling (37) 0.021 0.014Postal and telecommunication services (64) 0.007 0.005Computer and related activities (72) 0.197 0.129⁎⁎
Research and development (73) 0.148 0.024⁎⁎⁎
Other business activities (740) 0.007 0.006Business related services (741) 0.148 0.144Architectural and engineering activities (742) 0.049 0.135⁎⁎⁎
156 D. Engel, M. Keilbach / Journal of Empirical Finance 14 (2007) 150–167

Table 1 (continued )
Firm characteristics at foundation Shares (unless denoted otherwise)
VF NVF
Technical testing and analysis (743) 0.000 0.000Advertising (744) 0.042 0.047Industrial cleaning (747) 0.007 0.016Misc. business activities n.e.c. (748) 0.085 0.098
Foundation date1995 0.070 0.152⁎⁎⁎
1996 0.134 0.237⁎⁎⁎
1997 0.373 0.304⁎
1998 0.423 0.307⁎⁎⁎
Regional characteristicsFirm is located in Eastern Germany 0.204 0.207Located in Bavaria 0.197 0.151Firm is located in Brandenburg 0.028 0.036Population density in 1996 (corresponding counties) 6.940 6.389⁎⁎⁎
Distance to nearest science or technology park 2.704 2.760Scientific personnel in universities within 50 km dist. 7.609 7.657Distance to next Fraunhofer-Institute 2.725 3.126⁎⁎⁎
Distance to next Helmholtz-Institute 3.053 3.492⁎⁎⁎
R&D employees in resp. industry 7.350 6.523⁎⁎⁎
OtherAverage annual employment growth 0.326 0.174⁎⁎⁎
Entry has been edited within last year 0.923 0.877⁎⁎
Nr. of observations 142 21,375
⁎⁎⁎/⁎⁎/⁎ Difference of mean is significant from zero at 1/5/10% level of significance.VF: venture-funded firms, latest begin of involvement is 12 months after foundation date, NVF: non-venture-funded firms.Data sources: ZEW Foundation Panels, German Patent Agency, Federal Office for Regional Planning.
157D. Engel, M. Keilbach / Journal of Empirical Finance 14 (2007) 150–167
This table shows that on average, venture-funded firms have a larger start-up size. They have alarger management team6, their founders are better educated, they have a larger number of patentsat the foundation date7, they are less frequent in traditional sectors (such as mechanicalengineering) but more frequent in R&D intensive and computer-related industries. Finally, theyare mainly founded after 1996 (the takeoff year of the German venture capital market), and theyare created in more densely populated areas, but with larger distance to applied research centers.Also, we see at the bottom of Table 1 that firms differ significantly in their average annualemployment growth rate.
Table 2 compares average growth rates of venture-funded and non-venture-funded firmsgrouped into different industry aggregates. These figures suggest that venture-funded firms growfaster on average, however this difference is driven by the technology intensive service subgroup(which includes software developers). Section 5 will show whether these results hold aftercorrecting for potential selection biases.
6 We derive this from the fact that they are founded as a Public Limited Company more frequently and have more thanone founder.7 While roughly 10% of venture-funded firms have at least one patent at foundation date, only 2% of non-venture-
funded firms do so. For these start-ups, the innovation that underlies the patent might be considered as the motive to startup a new firm. Think e.g. of a patent that is owned by a university researcher who starts up a new firm on this basis.

Table 2Comparison of annual growth rates of venture-funded and non-venture-funded firms
Means p-value⁎
VF NVF
All firms (number of firms) 0.367 (216) 0.193 (37,122) 0.003Manufacturing industry (number of firms) 0.286 (65) 0.180 (14,118) 0.183Technology intensive services (number of firms) 0.451 (88) 0.203 (10,934) 0.005Other business Related services (number of firms) 0.334 (63) 0.198 (12,070) 0.224
VF: venture-funded; NVF: non-venture-funded.⁎p-values express probabilities of means to be identical, based on a two-sided t-test.
158 D. Engel, M. Keilbach / Journal of Empirical Finance 14 (2007) 150–167
Table 3 compares the average number of patent application by firms in the sample at theindustry level using the same industry aggregates as above. The computation of these numbershas been done on the industry level, therefore Table 3 is similar to Table 6 in Kortum and Lerner(2000, p.690). The results of the t-tests on identical means suggest that venture-funded firmsshow a significantly larger number of patent applications compared to their non-venture-fundedcounterparts. While the numbers in our table differ in magnitude from those given by Kortum andLerner (2000, Table 6), the ratio of patent applications from venture-funded firms to non-venture-funded firms is roughly the same. This difference is due to the fact that we consider only youngfirms. As for firm growth, these results will be reconsidered in Section 5.
4. Description of the evaluation procedure
4.1. Background: Evaluation and the selection problem
To assess the contribution of venture capital funding to firms' growth and innovative behavior,we aim to quantify the difference between the state of the firms after funding and the hypotheticalstate of the innovative behavior they would exhibit if they had not been funded by a venturecapitalist. Of course, this latter state – called counterfactual – is not observable, and therefore hasto be estimated (e.g. Heckman et al., 1999). Let “(1)” denote venture funding (or treatment) and“(0)” denote non-venture funding (or non-treatment). Then Y (1) denotes the outcome of the targetvariable of treated firms (in our case growth and innovative behavior of venture-funded firms) andY (0) the outcome of this variable for non-treated firms. Then the evaluation task is expressedformally as measuring the average treatment effect
hð1Þ ¼ E½ Yð1Þ− Y
ð0ÞjVC ¼ 1� ¼ E½ Yð1ÞjVC ¼ 1�− ¯E½Yð0ÞjVC ¼ 1�|fflfflfflfflfflfflfflfflfflfflfflffl{zfflfflfflfflfflfflfflfflfflfflfflffl}c
;
where c denotes the counterfactual and VC=1 indicates venture funding. If we were able toassume that venture-funded firms did not differ significantly from non-funded firms in theircharacteristics, it would be straightforward to estimate this counterfactual using observations onthe latter. However, two factors make it impossible to maintain this assumption, i.e. they lead to asystematic difference in treated and non-treated firms and therefore to a statistical bias whencomparing both (Lechner, 1998 discusses this problem in detail). First, venture capitalists tend toinvest only in those firms that have survived an extensive pre-investment screening process. Thatis, venture-funded firms are selected on the basis of superior performance. Second, firms whobelieve that their performance will not be sufficient for being considered for venture funding will

Table 3Comparison of the average number of patent applications by venture-funded and non-venture-funded firms
Means p-value⁎
VF NVF
All firms (number of firms) 1.084 (274) 0.134 (50,754) 0.000Manufacturing industry (number of firms) 2.524 (82) 0.265 (17,957) 0.000Technology intensive services (number of firms) 0.620 (108) 0.090 (14,919) 0.000Other business related services (number of firms) 0.274 (84) 0.052 (17,878) 0.122
VF: venture-funded; NVF: non-venture-funded.⁎p-values express probabilities of means to be identical, based on a two-sided t-test.
159D. Engel, M. Keilbach / Journal of Empirical Finance 14 (2007) 150–167
not apply for venture funding, i.e. they will not even participate in the screening process. Thisphenomenon leads to a statistical bias through self-selection.
Table 1 has made these differences between venture-funded and non-venture-funded firmsexplicit. However, due to the implicit bias in the selection of firms into one of the groups, thesedifferences cannot yet be taken as evidence in favor of a positive contribution of venture funding tofirm growth or to firms' innovative behavior. This selection bias can be corrected for by explicitlymodelling the selection process. Different approaches have been suggested to do just that (e.g.Heckman et al. (1999) or Keilbach (2005) for a survey). In this paper we choose a statisticalmatching procedure, which is described in the following section.
4.2. Description of the matching procedure
Microeconomic evaluation studies would be straightforward if the “treated participants” (i.e.the venture-funded firms) could be chosen at random and the number of firms would besufficiently large to assure that we can find identical (or “twin”) firms, one of which is treatedwhile the other is not. This approach of a randomized experiment is used in other disciplines suchas pharmaceutics. However, due to the systematic selection of firms into venture funding, wecannot expect such a random assignment.
Assume, however, that we can identify a set of k variables X that are correlated with theselection process. The conditional independence assumption (CIA), put forward by Rubin (1977)states that different firms i with nevertheless identical realizations of Xi (denoted xi) differ in theirtarget variable Yi significantly only through the implications of their treatment. Put formally, inthe case of venture capital financing, the CIA states
E½Yð0ÞjVC ¼ 1;X ¼ x� ¼ E½Yð0ÞjVC ¼ 0;X ¼ x�;
If this assumption is met, the average treatment effect θ(1) can be estimated as
hð1Þ ¼ E½ Yð1ÞjVC ¼ 1;X ¼ x�−E½ Yð0ÞjVC ¼ 0;X ¼ x�:
Given the large number of variables, their metric nature and the implied high dimensionality ofthe matching procedure, however, it is virtually impossible to find two firms with identicalrealization of Y,8 i.e. to find exact matches (“twin pairs”) of venture-funded and non-venture-funded firms.
8 The first column of Table 1 enumerates the variables in the database.
160 D. Engel, M. Keilbach / Journal of Empirical Finance 14 (2007) 150–167
Rosenbaum and Rubin (1983) show that if there exists a function b: ℝk↦ℝ1, the use of b(X )is equivalent, i.e. the average treatment effect θ(1) can be estimated with
hð1Þ ¼ E½ Yð1ÞjVC ¼ 1; bðXÞ ¼ bðxÞ�−E½ Yð0ÞjVC ¼ 0; bðXÞ ¼ bðxÞ�:
Once this function is identified, the matching task simplifies considerably since thedimensionality of the task reduces to 1 and the matching partner can be found through simplecomputation of differences in b(x) between treated i and non-treated counterpart j. There existmainly two main approaches to realize this computation. One is caliper matching (Cochran andRubin, 1973), defining j to match i if the difference of their realization of b(x) is within apredefined range δ, hence if [b(x)i −b(x)j]bδ. On the other hand, nearest neighbor matching9
defines j to match i such that mini,j [b(x)i−b(x)j]. While the first approach accepts all counterpartswithin a certain distance between b(x)i and b(x)j (usually a fraction of the standard deviation ofthe estimate of that distance), the second approach chooses the counterpart with minimal distance.The second approach is therefore more efficient as long as the distributions of the propensityscores of treated and non-treated groups overlap.
An intuitive and often used realization of b(·) is the propensity score that expresses the firms'conditional probability (i.e. their.propensity.) to be subject to venture funding (conditional on X).This probability can be estimated with a standard probit model of the form
EðVCijxiÞ ¼ PrðVCi ¼ 1jxiÞ ¼ Φðxi VbÞ 8i ¼ ð1; 2; . . . ;NÞ:
where Φ(·) represents the cumulated density function of the standard normal distribution. Basedon these estimation results, it is possible to compute each firm's propensity score ps via
psi ¼ xi VV b ð2Þ
which is a scalar for each firm.10 With an estimated propensity score for each firm at hand, thematching procedure simplifies to finding for each venture-funded firm i a non-venture-fundedcounterpart j using one of the distance definitions given above. This approach is referred to aspropensity score matching (e.g. Rosenbaum and Rubin, 1983).
The main advantage of propensity score matching – simplicity –may be outweighed by the factthat this procedure may identify matching pairs that are close in their propensity score but actuallydiffer in a number of characteristics or variables that should be strictly identical given the topic ofinvestigation (such as industry affiliation). Of course it is possible to require matching partners tohave identical realizations of these variables. This more generalized approach preselects on thesevariables and then chooses the matching partner under this restriction using a multidimensionaldistance measure. This method is known in the literature as balancing score matching.11 The cost ofthis increased accuracy is a reduction in the number of potential matching partners, i.e. this method issuitable for large datasets with a small share of treated individuals or firms.
9 See Heckman et al. (1998) or Heckman et al. (1999, p. 1953) for a discussion of this method. Cochran and Rubin(1973) compare caliper matching and nearest neighbor matching.10 Average values of estimated propensity scores are given in Table 5.11 See e.g. Heckman et al. (1999), Lechner (1998) or Keilbach (2005) for more detailed and formalized presentations ofthis approach.

161D. Engel, M. Keilbach / Journal of Empirical Finance 14 (2007) 150–167
Once the matching partners are identified (i.e. we have determined Y (c)), we can estimate theaverage treatment effect (i.e. the average contribution of venture capital funding to firms'innovative behavior) consistently as (Lechner, 1998)
hð1Þ ¼ 1
N ð1ÞXN ð1Þ
i¼1
Y ð1Þi −
XN ð1Þ
j¼1
YðcÞj
!: ð3Þ
The variance of θ(1) can be estimated with
Varð hð1ÞÞ ¼ 1
N ð1Þ ½Sð1Þ�2 þ ½SðcÞ�2� �
; ð4Þ
S ( j ) being the standard deviation of subsample j.
4.3. Implementation and result of the matching procedure
Firm-level variables that can be expected to influence the venture capitalists' selection toinvest or not (i.e. variables that should enter X) are mainly the firm's industry affiliation andprevious excellence in innovation.We approximate self-selection through contacts and networksby using locational variables, i.e. population density and distance to scientific facilities. Thus, thematching approach implicitly assumes that the two groups do not differ with respect tounobservable variables such as commitment of firm founders or scope of the business idea.
Based on this set of variables we run a probit estimation of the propensity score using oursample of 142 German venture-funded firms and 21,375 control firms. The results are shown inTable 4. These estimation results can be interpreted economically. Thus, Table 4 provides evidencethat firms size has a positive influence on the probability of being venture-funded or not. However,firms with limited legal forms have a significantly higher probability of being funded. Firms whosemanagers have high educational degrees and firms with a larger number of patents at foundationdate also have a higher probability of being venture-funded. This confirms the findings ofHellmann and Puri (2000). The estimation results for industry variables point at the expecteddirection, i.e. firms in R&D oriented industries are more likely to be venture-funded. Again, thisprobably reflects the dynamic development of the German venture capital market during ourobservation period, especially for early stage investments. It is remarkable that the probability ofbeing venture-funded decreases significantly with increasing regional density of scientificpersonnel. We leave this for further research.
With the results of this estimation we can compute the propensity score for each firm as isspecified in Eq. (2). On this basis, we employ different matching procedures. First, we use astandard propensity score with nearest neighbor propensity score matching. However, aspreviously discussed, the protection of innovation is done with different strategies within differentindustries. To control for this effect, in a second procedure, we require matching partners to haveidentical industry affiliation12, identical year of firm creation and similar number of patents at thetime of the venture capital investment. Given that our control group is roughly 200 times largerthan the group of treated firms, these requirements can be met without loss of data.We refer to thesecond procedure as balancing score matching. Both procedures are done without replacement,i.e. non-venture-fundedfirms can be selected only once.13
12 Our industry classification is implicitly given in Tables 1 and 4.13 The results for matching procedure with replacement are nearly identical. They are available from the authors uponrequest.

Table 4Determinants of venture capitalist's involvement, probit estimation
Dependent variable: involvement of venture capital companywithin one year after foundation date
Characteristics at foundation date Coeff. p-value⁎
Firm-specific characteristicsStart-up size (number of employees) 0.0080 0.023Limited partnership (GmbH & Co. KG) 0.0810 0.522Public limited company (AG) 0.5964 0.000Involvement of other (non-VC) firms 0.1996 0.024Team foundation 0.1977 0.006Founding team of mixed gender −0.1690 0.128Founders are of female gender −0.5302 0.023Gender unknown −0.0159 0.896
Education of foundersDoctoral degree 0.4158 0.000Postgraduate degree 0.1448 0.096Higher education on the job −0.3187 0.170Low level of education 0.0656 0.772Low education 0.2799 0.004
Patenting behaviorOne patent before foundation date 0.4426 0.0362…4 patent before foundation date 0.3657 0.1145…19 patent before foundation date 0.9311 0.000
Industry affiliation (with NACE code)Manuf. of food products etc. (15) −0.1601 0.638Manuf. of wearing apparel etc. (18) 0.4644 0.242Manuf. of wood and its products etc. (20) 0.2462 0.384Publishing, printing etc. (22) −0.1725 0.447Manuf. of chemicals and chemical products (24) 0.2364 0.317Manuf. of rubber and plastic products (25) −0.2004 0.575Manuf. of other non-metallic mineral products (26) 0.0451 0.849Manuf. of fabricated metal products etc. (28) −0.1575 0.478Manuf. of machinery and equipment. n.e.c. 29) −0.3049 0.197Manuf. of office machinery and computers (30) 0.2841 0.289Manuf. of electrical machinery and apparatus n.e.c. (31) 0.5718 0.005Manuf. of radio, television and communication equipment (32) 0.3221 0.230Manuf. of medical, precision and optical instruments etc. (33) −0.0055 0.976Manuf. of motor vehicles, trailers and semi-trailers (34) 0.0653 0.810Manuf. of furniture; manufacturing n.e.c. (36) −0.1284 0.711Recycling (37) 0.3057 0.219Post and telecommunications (64) 0.0092 0.984Computer and related activities (72) 0.2020 0.123Research and development (73) 0.5732 0.000Other business activities (740) 0.1671 0.682Business related services (741) 0.0312 0.818Architectural and engineering activities (742) −0.2780 0.093Advertising (744) 0.0917 0.617
162 D. Engel, M. Keilbach / Journal of Empirical Finance 14 (2007) 150–167
Table 4 (continued )
Dependent variable: involvement of venture capital companywithin one year after foundation date
Characteristics at foundation date Coeff. p-value⁎
Foundation date1996 0.0232 0.8651997 0.3319 0.0081998 0.3445 0.006
Regional characteristicsFirm is located Eastern Germany −0.0652 0.515Located in Bavaria 0.0920 0.337Firm is located in Brandenburg 0.1114 0.610Population density in 1996 (corresponding counties) 0.0869 0.056Distance to nearest science or technology park −0.0124 0.711Scientific personnel in universities 50 km dist. −0.0609 0.009Distance to next Fraunhofer-Institute −0.0043 0.904Distance to next Helmholtz-Institute −0.0295 0.332R&D-employees in resp. industry 0.0359 0.218Constant −3.5279 0.000Number of observations (of which venture-funded) 21,571 (142)Wald-test (p-value) 332.9 0.000Pseudo R2 0.1548
⁎p-value: probability of coefficient estimate not to differ significantly from zero.Data sources: ZEW, DPA, Federal Office for Regional Planning.
163D. Engel, M. Keilbach / Journal of Empirical Finance 14 (2007) 150–167
To obtain a measure of the quality of each match we computed the mean of the distribution of therespective propensity scores and the standard deviation thereof aswell as the difference of themeans.Table 5 compares score estimates for both matching approaches. While the difference is roughly0.005 times the standard deviation of the untreated propensity score for propensity score matching, itamounts to 0.08 for balancing score matching. This increase is due to the stronger restrictions in thesecond procedure. Nevertheless, both results can be considered to be close matches.14
5. Results
Table 6 reports the results of the twomatching procedures, denoting the estimated average treatmenteffects for threemeasures: firm growth, probability of applying for at least one patent and the number ofpatents applied for. Since balancing score matching imposes stronger restrictions and therefore leads tobetter matches, we refer to this procedure in the interpretation of the estimation results. Hence, in ourdiscussion,we refer to the last column of Table 6.Nevertheless, we show the results of the othermatchingmethod in the middle column for illustrative purposes. Let us consider the result for firm growth first.
5.1. Estimated treatment effects for firm growth
The upper part of Table 6 compares venture-funded firms (i.e. treated) and non-venture-fundedmatched firms on the basis of their average employment growth rates. Venture-funded firms in oursample grow roughly twice as large as their non-venture-funded counterparts, the difference being
14 Cochran and Rubin (1973, p.421) consider a value of 0:2ffiffiffiffiffiffiffiffiffiffiffiffiffiffiffiffiffiffiffiffiffiffiffiffiðr21 þ r22Þ=2
pto be one that removes practically all the
bias. Our estimates are below that value, so we meet this criterion.
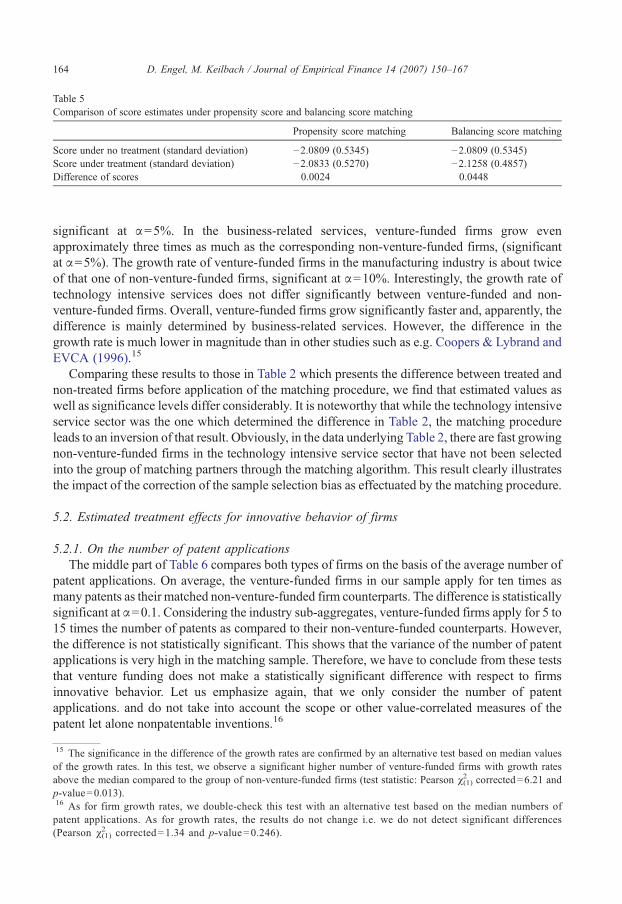
Table 5Comparison of score estimates under propensity score and balancing score matching
Propensity score matching Balancing score matching
Score under no treatment (standard deviation) −2.0809 (0.5345) −2.0809 (0.5345)Score under treatment (standard deviation) −2.0833 (0.5270) −2.1258 (0.4857)Difference of scores 0.0024 0.0448
164 D. Engel, M. Keilbach / Journal of Empirical Finance 14 (2007) 150–167
significant at α=5%. In the business-related services, venture-funded firms grow evenapproximately three times as much as the corresponding non-venture-funded firms, (significantat α=5%). The growth rate of venture-funded firms in the manufacturing industry is about twiceof that one of non-venture-funded firms, significant at α=10%. Interestingly, the growth rate oftechnology intensive services does not differ significantly between venture-funded and non-venture-funded firms. Overall, venture-funded firms grow significantly faster and, apparently, thedifference is mainly determined by business-related services. However, the difference in thegrowth rate is much lower in magnitude than in other studies such as e.g. Coopers & Lybrand andEVCA (1996).15
Comparing these results to those in Table 2 which presents the difference between treated andnon-treated firms before application of the matching procedure, we find that estimated values aswell as significance levels differ considerably. It is noteworthy that while the technology intensiveservice sector was the one which determined the difference in Table 2, the matching procedureleads to an inversion of that result. Obviously, in the data underlying Table 2, there are fast growingnon-venture-funded firms in the technology intensive service sector that have not been selectedinto the group of matching partners through the matching algorithm. This result clearly illustratesthe impact of the correction of the sample selection bias as effectuated by the matching procedure.
5.2. Estimated treatment effects for innovative behavior of firms
5.2.1. On the number of patent applicationsThe middle part of Table 6 compares both types of firms on the basis of the average number of
patent applications. On average, the venture-funded firms in our sample apply for ten times asmany patents as their matched non-venture-funded firm counterparts. The difference is statisticallysignificant at α=0.1. Considering the industry sub-aggregates, venture-funded firms apply for 5 to15 times the number of patents as compared to their non-venture-funded counterparts. However,the difference is not statistically significant. This shows that the variance of the number of patentapplications is very high in the matching sample. Therefore, we have to conclude from these teststhat venture funding does not make a statistically significant difference with respect to firmsinnovative behavior. Let us emphasize again, that we only consider the number of patentapplications. and do not take into account the scope or other value-correlated measures of thepatent let alone nonpatentable inventions.16
15 The significance in the difference of the growth rates are confirmed by an alternative test based on median valuesof the growth rates. In this test, we observe a significant higher number of venture-funded firms with growth ratesabove the median compared to the group of non-venture-funded firms (test statistic: Pearson χ(1)
2 corrected=6.21 andp-value=0.013).16 As for firm growth rates, we double-check this test with an alternative test based on the median numbers ofpatent applications. As for growth rates, the results do not change i.e. we do not detect significant differences(Pearson χ(1)
2 corrected=1.34 and p-value=0.246).

Table 6Results of different matching procedures
VF NVF1) NVF2)
Employment growth rateAll firms (142) (p-value) 0.326 0.166 (0.001) 0.157 (0.001)Manufacturing industry (44) (p-value) 0.299 0.203 (0.242) 0.113 (0.052)Technology intensive services (50) (p-value) 0.317 0.172 (0.033) 0.230 (0.190)Other business related services (48) (p-value) 0.361 0.109 (0.019) 0.123 (0.013)
Number of patentsAll firms (142) (p-value) 0.732 0.204 (0.187) 0.070 (0.090)Manufacturing industry (44) (p-value) 1.545 0.563 (0.417) 0.114 (0.227)Technology intensive services (50) (p-value) 0.520 0.036 (0.168) 0.800 (0.213)Other business related services (48) (p-value) 0.208 0.000 (0.274) 0.021 (0.327)
Probability of patent applicationAll firms (142) (p-value) 0.092 0.049 (0.165) 0.049 (0.165)Manufacturing industry (44) (p-value) 0.182 0.104 (0.296) 0.068 (0.110)Technology intensive services (50) (p-value) 0.060 0.036 (0.566) 0.060 (1.000)Other business related services (48) (p-value) 0.042 0.000 (0.160) 0.021 (0.562)
VF: venture-funded firms; NVF: non-venture funded firms.1)Propensity score matching; 2)Balancing score matching;p-values denote probabilities that respective estimates for NVF are identical to corresponding values for VF.
165D. Engel, M. Keilbach / Journal of Empirical Finance 14 (2007) 150–167
Nevertheless, since this finding is in contradiction with previous studies (such as Kortum andLerner, 2000, who used the same variable – number of patent applications – to measure inno-vation), we ran another test to investigate if this result is sensitive with respect to the specification.
5.2.2. On the probability of applying for at least one patentTo compare venture-funded and matched non-venture-funded firms on the basis of a separate
test, we analyzed if the firms applied for at least one patent. This leads to a binomial distributedvariable indicating “1” if the firm applied for a patent and “0” if otherwise. The lower part ofTable 6, displays the share of firms that applied for at least one patent. Avalue of 0.092 means that9.2% of all firms applied for at least one patent.
For the group of “All Firms”, roughly twice the number of firms applied for at least one patent.However this difference is not significant. This also holds for the industry sub-aggregates, thedifferences are insignificant in all cases. It is noteworthy, however, that in “Technology IntensiveServices”, the number of firms that applied for at least one patent is higher for non-venture-fundedfirms than for venture-funded matched firms. Apparently, a larger share of firms applied for asmaller number of patents in this industry (both differences being insignificant).
6. Summary and conclusion
In this paper, we have investigated the implication of venture capital funding on firms' growthperformance and innovative behavior at the firm level. This was done using a sample of 21,541German firms of which 0.66% are venture-funded. On the basis of this sample, we determined thegrowth rate of firm sizes and innovative behavior of venture-funded and non-venture-fundedfirms. Using a probit estimation, we found evidence that firms with higher innovative output(measured by the number of patent applications, corrected for size) and with a highly educatedmanagement have a larger probability of getting venture capital.

166 D. Engel, M. Keilbach / Journal of Empirical Finance 14 (2007) 150–167
Then we identified matched pairs with non-venture-funded firms, where we required start-upsize, age, number of patents, industry classification, as well as an estimated measure of the firms'probability to receive venture funding to be identical or of minimal distance. On this basis, wewere able to compare venture-funded and non-venture-funded firms with respect to growth andinnovative behavior while minimizing the statistical bias due to systematic selection of firms forventure funding.
Based on this approach we found evidence that venture-funded firms display significantlyhigher growth rates compared to their non-venture-funded counterparts, hence venture capitalfirms make a significant contribution in this respect. For patenting behavior, the finding is diffe-rent. Overall, venture-funded firms do show a significantly larger number of patent applications(corrected for firm size) compared to their non-venture-funded counterparts; however they do soeven before the involvement of the venture capitalist. After a venture capitalist invests, the numberof patent applications by venture-funded firms is still larger. However the difference is notsignificant for the industry sub-aggregates, it is only weakly significant overall. Similarly, theprobability to apply for at least one patent is larger, but the difference between venture-funded andnon-venture-funded firms is insignificant. Hence, there is only very weak evidence that thepatenting behavior of venture-funded firms differs from the behavior of non-venture-funded ones.
These results give rise to the following hypothesis on the sequence of innovation, venturefunding and firm growth: Venture capital firms screen potential portfolio firms to select out thosewith the best growth perspectives. The innovative potential (as signaled by patent applicationsand by the founders' education levels) plays an important role in that respect. Although thisscreening process is very selective, it is also successful: venture capital funded firms in our sampleindeed display an average growth rate that is twice as large as the control group's. Assuming thatGerman venture capitalists behave like their American counterparts,17 this stronger growth rate isprobably a result of the commercialization of innovations that have been done before the venturefunding. This would imply that venture capital investors assist their portfolio firms mainly incommercialization, rather than in further innovation, to maximize the value of their portfoliofirms, hence their return. This commercialization is done not only by financial means but also bymeans of management assistance. In that respect, the contribution of venture capital investors isnot only a financial one but could also be in the access to their network of business partners andthus a larger number of possible commercialization channels.
Overall, these findings underline the importance of commercialization and marketing ofinnovation, and hence of funding these activities. Non-venture-funded firms might improve theirgrowth perspectives by putting more emphasis on these aspects of the business.
References
Almus, M., Engel, D., Prantl, S., 2000. The ZEW Foundation Panels and the Mannheim Enterprise Panel (MUP) of theCentre for European Economic Research (ZEW). Schmollers Jahrbuch 120 (2), 301–308.
Amit, R., Brander, J., Zott, C., 1998. Why do venture capital firm exist? Theory and Canadian evidence. Journal ofBusiness Venturing 13, 441–466.
BVK, 2000a. Directory. BVK, Berlin.BVK, 2000b. Jahrbuch. BVK, Berlin.Berger, A.N., Udell, G.F., 1998. The economics of small business finance: the roles of private equity and debt markets in
the financial growth cycle. Journal of Finance 22, 613–673.
17 Hellmann and Puri (2000) provide evidence that venture capital investments in the Silicon Valley are related withshorter time to bring a product to market. Schefczyk (2000) identifies similar behavior for German venture capitalists.

167D. Engel, M. Keilbach / Journal of Empirical Finance 14 (2007) 150–167
Bottazzi, L., da Rin, M., 2002. Venture capital in Europe and the financing of innovative companies. Economic Policy 17,229–269.
Buergel, O., Fier, A., Licht, G., Murray, G., 2000. Internationalisation of High-Tech Start-Ups and Fast Growth. Evidencefor UK and Germany (Discussion Paper No. 00-35). ZEW, Mannheim.
Cochran, W., Rubin, D., 1973. Controlling bias in observational studies. Sankyha 35, 417–446.Coopers & Lybrand, EVCA, 1996. The Economic Impact of Venture Capital in Europe.EVCA, 2000. Yearbook. EVCA, Zaventem.Engel, D., 2004. Venture Capital für junge Unternehmen. Nomos, Baden-Baden.Gompers, P., Lerner, J., 1999. The Venture Capital Cycle. MIT Press, Cambridge, Mass.Griliches, Z., 1990. Patent statistics as economic indicators. Journal of Economic Literature 28, 1661–1707.Harhoff, D., Scherer, F.M., Vopel, K., 2003. Citations, family size, opposition and the value of patent rights. Research
Policy 32 (8), 1343–1363.Heckman, J., Ichimura, H., Todd, P., 1998. Matching as an econometric evaluation estimator. Review of Economic Studies
65, 261–294.Heckman, J.J., LaLonde, R.J., Smith, J.A., 1999. The economics and econometrics of active labor market programs.
Handbook of Labor Economics, vol. 3A. Elsevier.Hellmann, T., Puri, M., 2000. The interaction between product market and financing strategy: the role of venture capital.
The Review of Financial Studies 13 (4), 959–984.Hellmann, T., Puri, M., 2002. Venture capital and the professionalization of start-up firms: empirical evidence. The Journal
of Finance LVII (1), 169–197.Jacobs, O., Scheffler, W., 1998. Unternehmensbesteuerung und Rechtsform, Handbuch zur Besteuerung deutscher
Unternehmen, 2 ed. Beck, München.Jain, B., Kini, O., 1995. Venture capitalist participation and the post-issue operating performance of IPO firms. Managerial
and Decision Economics 5, 593–606.Keilbach, M., 2005. Quantitative, Non−Experimental Approaches to theMicroeconomic Evaluation of Public Policy
Measures. A Survey. Papers on Entrepreneurship, Growth and Public Policy, vol. 30-2005. Max Planck Insititue ofEconomics, Jena, DE.
Kortum, S., Lerner, J., 2000. Assessing the contribution of venture capital to innovation. RAND Journal of Economics 31(4), 674–692.
Lanjouw, J.O., Schankerman, M., 1999. The Quality of Ideas: Measuring Innovation With Multiple Indicators. WorkingPaper, vol. 7345. NBER.
Lanjouw, J.O., Pakes, A., Putnam, J., 1998. How to count patents and value intellectual property: use of patent renewal andapplication data. Journal of Industrial Economics 46 (4), 405–433.
Lechner, M., 1998. Training the East German Labour Force — Microeconometric Evaluations of continuous VocationalTraining after Unification. Physica, Heidelberg.
Lerner, J., 1999. The government as venture capitalist. Journal of Business 72 (3), 285–318.Manigart, S. Hyfte, M., 1999. Post-Investment Evolution of Belgian Venture-Capital Backed Companies: An Empirical
Study. Paper presented at the Babson Entrepreneurship Conference.Rosenbaum, P., Rubin, D., 1983. The central role of the propensity score in observational studies for causal effects.
Biometrica 70, 41–55.Rubin, D.B., 1977. Assignment of treatment group on the basis of covariate. Journal of Educational Statistics 2, 1–26.Sapienza, H.J., 1992. When do venture capitalists add value? Journal of Business Venturing 7, 9–27.Schefczyk, M., 2000. Erfolgsstrategien deutscher Venture Capital—Gesellschaften, 2 ed. Schaeffer-Poeschel, Stuttgart.VentureOne, 1999. The Venture Capital Industry Report. VentureOne, San Francisco.