firm-level drivers of export performance and external ... · manuel romagnoli and antonello zanfei....
TRANSCRIPT

6
EUROPEAN ECONOMY
Economic and Financial Affairs
ISSN 2443-8022 (online)
EUROPEAN ECONOMY
Firm-level Drivers of Export Performance & External Competitiveness in Italy
Emanuele Brancati, Raffaele Brancati, Dario Guarascio, Andrea Maresca, Manuel Romagnoli and Antonello Zanfei
DISCUSSION PAPER 087 | SEPTEMBER 2018

European Economy Discussion Papers are written by the staff of the European Commission’s Directorate-General for Economic and Financial Affairs, or by experts working in association with them, to inform discussion on economic policy and to stimulate debate. The views expressed in this document are solely those of the author(s) and do not necessarily represent the official views of the European Commission. Authorised for publication by István Pal Székely, Director for Economies of the Member States III.
LEGAL NOTICE Neither the European Commission nor any person acting on behalf of the European Commission is responsible for the use that might be made of the information contained in this publication. This paper exists in English only and can be downloaded from https://ec.europa.eu/info/publications/economic-and-financial-affairs-publications_en. Luxembourg: Publications Office of the European Union, 2018 PDF ISBN 978-92-79-77424-9 ISSN 2443-8022 doi:10.2765/598054 KC-BD-18-014-EN-N
© European Union, 2018 Non-commercial reproduction is authorised provided the source is acknowledged. For any use or reproduction of material that is not under the EU copyright, permission must be sought directly from the copyright holders.

European Commission Directorate-General for Economic and Financial Affairs
Firm-level Drivers of Export Performance and External Competitiveness in Italy Emanuele Brancati, Raffaele Brancati, Dario Guarascio, Andrea Maresca, Manuel Romagnoli and Antonello Zanfei Abstract This paper provides an in-depth study on the main firm-level drivers of external competitiveness during the recent crisis in Italy. We contribute to the debate on the Italian international position by presenting evidence based on a unique sample survey database (the MET dataset). Overall, our results confirm the high degree of heterogeneity of the Italian corporate sector and the well-known differences between internationalised and domestic companies in terms of performance as well as structure and behaviour. In particular, the data highlight not only the correlation between internationalisation and innovative activities but also a positive change of attitude of Italian firms towards these strategies. Our analysis shows that, whilst structural factors play a key role for external competitiveness (size, location, industry, etc.), other critical firm-level aspects, especially those related to strategic profiles, technological capabilities, and ‘proactive’ behaviour, trigger superior performances. To this extent, our policy suggestions focus on the need to sustain and foster innovative activities to improve aggregate competitiveness. JEL Classification: F14; L25; O31; O33. Keywords: Italy; export performance; external competitiveness; internationalisation; innovation; extensive margins; intensive margins; firm-level study. Acknowledgements: Report prepared for the Commission, Directorate General for Economic and Financial Affairs (DG ECFIN), under contract ECFIN/117/2016/733754. Contact: Raffaele Brancati, Monitoraggio Economia e Territorio, [email protected]. The closing date for this document was August 2017.
EUROPEAN ECONOMY Discussion Paper 087


CONTENTS 1. Introduction ..................................................................................................................................... 5
2. Background ..................................................................................................................................... 8
3. Related literature ......................................................................................................................... 17
2.1 Analysing competitiveness at the firm-level: the Italian case ........................................................ 17
4. Data ............................................................................................................................................... 23
5. Econometric strategy ................................................................................................................. 24
6. Results ............................................................................................................................................ 27
6.1 Extensive margins.................................................................................................................................... 27
6.2 Intensive margins and extensions ........................................................................................................ 33
7. Concluding remarks and policy suggestions .......................................................................... 36
8. REFERENCES .................................................................................................................................. 40
9. ANNEX: TABLES ............................................................................................................................. 53
10. APPENDIX ...................................................................................................................................... 70
3


1. INTRODUCTION1
The external competitiveness and export performance of the Italian economy has been a much researched and debated topic in recent years. The discussion centres on the appraisal of the national competitive position. On the one hand, some scholars emphasise that the decline of the Italian export market share follows from a decreasing degree of aggregate competitiveness. According to this perspective, the drop in the share of Italian exports is linked to the deterioration of cost competitiveness indicators (e.g. unit labour costs, real effective exchange rates etc.), mainly due to stagnant productivity (Hassan and Ottaviano, 2013). This issue has been often ascribed to the high presence of micro and small firms within the Italian industrial sector (Barba Navaretti et al., 2011; Bugamelli et al., 2012; Pellegrino and Zingales, 2014), coupled with a low propensity to innovate and undertake R&D activities (Faini and Sapir, 2005; Bugamelli et al., 2012) as well as lower positions along the global value chains (Accetturo and Giunta, 2016). Within this perspective of decreasing external competitiveness, the high degree of fragmentation of the industrial sector is also paired with an insufficient resorting to external management, often bound to the family dimension of many business companies (Bugamelli et al., 2012; Pellegrino and Zingales, 2014; Lippi and Schivardi, 2014). Moreover, several scholars highlight the aggregate disadvantages connected with the institutional setting such as administrative inefficiencies (Giordano et al., 2015; Lanau and Topalova, 2016), market rigidities (Calligaris et al., 2016; Gopinath et al., 2017), and the labour market reforms implemented in the 1990’s (Larch, 2004; Daveri and Parisi, 2015).
Conversely, an alternative view underlines the presence of highly competitive segments embedded within an extremely heterogeneous industrial system. Some scholars highlighted how the international performances of Italian companies experienced stable trends over recent years when compared with their main European competitors (Lanza and Quintieri, 2007; CSC, 2010, 2011). With this perspective, several studies stressed the ongoing presence of major restructuring processes connected with the repositioning of many firms within market segments characterised by higher value added, the improvement of the product quality, and, more in general, an increasing effort to adapt to the fast-evolving competitive scenario (De Nardis and Pensa, 2004; De Nardis and Traù, 2005; Cipolletta and De Nardis, 2012; Arrighetti and Ninni, 2014). These pressures also challenged traditional Italian industrial districts triggering profound transformations in firms’ internationalisation, innovation, and organisation strategies (De Marchi et al., 2013; Brancati et al., 2017).
Our work aims at contributing to this widely debated topic by adopting a firm-level perspective to explicitly account for the heterogeneity of companies populating the Italian system. We contribute to the discussion by providing an in-depth study on the relevant microeconomic factors underpinning the Italian external competitiveness, so as to give useful insights for the design of effective policy schemes. There are several contributions of this work that are worth emphasising:
First of all, compared to most papers, our analysis does not focus on a single specific aspect, but rather takes on a broad approach by encompassing a wide range of dimensions of external competitiveness. Those range from aggregate dynamics, to firm-level determinants of export probabilities, shares, and actual performances. This is a critical issue if potential drivers of external competitiveness have heterogeneous impacts along different dimensions. Moreover, our work does not rely on a unique
1 This paper is an elaboration of a broader analysis performed by a large study group composed of Emanuele Brancati, Raffaele Brancati, Anna Giunta, Dario Guarascio, Lelio Iapadre, Andrea Maresca, Mario Pianta, Manuel Romagnoli, Stefano Usai, and Antonello Zanfei.
5

driver of external competitiveness, but rather it puts an emphasis on the importance of behavioural and strategic factors by highlighting both their direct and indirect effects on export performances. In doing so, we explore several dimensions of heterogeneity aimed to pinpoint targeted segments for granular policies (i.e., identify companies with the highest expected gains from the intervention). Finally, we exploit a large amount of information in the recent financial crisis based on different data sources. This is essential to dig deeper into the high degree of heterogeneity that characterise the Italian industrial system. Moreover, the use of up-to-date data is paramount in studying firms’ behaviours and strategies adopted during the financial crisis episode. Indeed, the recent period came with deep changes of firms’ strategies and performance leading to an increasing polarisation within the population of enterprises. In this complex and fast-evolving scenario, the use of newly-available datasets is critical to properly interpret and assess these structural developments, as well as designing a set of effective policy measures.
On the top of aggregate statistics based on the entire population of Italian manufacturing firms (‘Rapporto sulla competitività dei settori’ dataset, ISTAT) we take advantage of a newly-available survey data, the MET database on the Italian industry, to explicitly analyse firms’ strategic profiles such as innovation, R&D, and networking relationships. This survey is specifically conceived to study a massive amount of firms’ characteristics and strategies, with a particular focus on their internationalisation and innovative patterns. The sampling scheme, ensuring a very high degree of representativeness once coupled with a large number of interviews, is stratified along three dimensions: sector, geographical region, and size class. Unlike many other firm-level databases, the MET survey also accounts for firms with less than ten employees representing the vast majority of companies within the Italian industrial system. The survey is made of five waves (2008, 2009, 2011, 2013, and 2015) and covers a time span starting right before the collapse of Lehman Brothers in 2008 until recent years. This large amount of information is exploited to derive accurate results at the firm level aimed at identifying the main drivers of external competitiveness in a period characterised by deep changes in the economic scenario.
Our econometric analysis emphasises the importance of both structural characteristics and strategic behaviours in determining firms’ international performance. The empirical strategy, in order to correct for unobserved heterogeneity, mainly employs random-effect probit models (with Mundlak correction) and within estimator (with firm and time fixed effects) to dig deeper into the drivers of external competitiveness, both in terms of extensive and intensive margins of export. Our analysis delivers a set of results with some important policy implications.
As expected, we confirm the presence of a self-selection mechanism of more productive companies into international markets. Although productivity is associated to higher likelihood of exporting, once accounted for persistent characteristics that do not vary over time, its role is found to be largely reduced in explaining the change in the exporting status. On the other hand, productivity has a critical impact on firms’ international performance (i.e., intensive margins) and decision to exit the foreign markets. Moreover, other characteristics play a critical role in firms’ export propensity, especially size and the affiliation to a corporate group. Finally, being an importer of intermediate products is largely associated to a higher probability of exporting, confirming how import policies may affect aggregate productivity, resource allocation, and industry export activity.
A critical driver for external competitiveness is found to be linked to firms’ strategic behaviour and investment in dynamic strategies. The innovation, the involvement in R&D projects, as well as undertaking new investments, induce a significant positive effect on export strategies and performance. The introduction of innovations is even more important in reaching extra-EU
6

destinations and in affecting firms’ switching strategies (i.e., the choice of entry or exit from the international market). Interestingly, on the top of their direct impact, there are significant cumulative effects of dynamic strategies. First, the integration of innovation and R&D activities implies premia on both the extensive and intensive margins of export. The coefficients of innovative strategies, paired with R&D investment, is two-to-three times larger than isolated innovations. Moreover, the path followed by the set of dynamic strategies undertaken in the past (adding or reducing the set of strategies, i.e., upgrading/downgrading paths) has additional effects on firms’ international attitude. Among the different types of innovations, new products dominate other forms of innovativeness (process or organizational/managerial), especially in case of previously non-exporting companies. However, we find process and organisational innovations to have an additional indirect effect on export by boosting firms’ productivity.
Furthermore, innovative strategies are found to have disproportionate effects for the international performance of (originally) less productive and small companies, pointing at innovativeness as a potential tool to fill the gap between large/productive companies and the set of less structured firms, a segment that represents an ideal target for policy measures.
A simultaneous equation model also explores the main determinants of firms’ innovativeness. In this regard, structural characteristics significantly affect the introduction of innovations, especially for larger, younger, and more productive companies. The existence of R&D projects is clearly correlated to huge increases in the probability of introducing innovations. Importantly, this effect is not limited to the investment in R&D performed within the firm (internal R&D), but extends to firms outsourcing R&D activities, even though with smaller magnitudes. This evidence emphasises the importance of research-oriented networks to overcome the lower innovativeness of less structured companies. Another critical factor in driving firm innovative activity is related to the operating environment of a company, such as the affiliation to a corporate group and the establishment of close relationships with other domestic enterprises. Finally, financial constraints are found to significantly affect a firm’s capacity to innovate and the establishment of close ties with its main bank is documented to be extremely important in reducing informational asymmetries penalising innovative SMEs.
Overall, we contribute to the debate on Italian external competitiveness by pointing out the importance of behavioural and strategic factors in shaping firm-level competitive advantages. Whilst our results confirm the positive effect of structural characteristics, such as size and productivity, they also highlight the existence of additional factors that help boost firm internationalisation. Among these, innovation and R&D play a crucial role and affect external competitiveness both directly and via productivity improvements. Even though the positive effect of innovative activities and R&D is certainly not new, we explore several new levels of heterogeneity, as well as indirect effects that may provide a sound base for the construction of granular policy implications. In particular, the analysis allows for the identification of segments of potentially innovative companies with the highest expected gains from international activity. The last section will provide a more in-depth discussion of the main policy implications.
The remainder of the paper is organised as follows. Section 2 further analyses the background scenario. Section 3 reviews the related literature with a specific focus on firm-level drivers of external competitiveness. Section 4 presents the data used in the empirical analysis, section 5 deals with the main identification challenges at the econometric level, while section 6 discusses the results. Finally, section 7 concludes the paper by presenting the main policy implications derived from the empirical analysis.
7

2. BACKGROUND
Italy has been suffering from a slow growth trend that can be traced back to the 90’s, long before the outbreak of the global recession. This dynamic might reflect many factors, including its lower openness to the international environment (even in comparison with other European countries of similar size) and the resulting limited exposure to the beneficial effects of global integration.
One of the most discussed weaknesses of the Italian economy is linked to its low and stagnant labour productivity, often ascribed to the very composition of the industrial structure characterised by a high diffusion of small and micro-sized companies. This interpretation, however, does not seem to be consistent with Table 9.1 providing a cross-country comparison of the size/class distribution within the main European peer economies. The share of micro-sized companies (1-9 employees), over the entire population of manufacturing firms, whilst being much larger than the German one, is actually similar to -and slightly below- the French and Spanish ones. However, the Italian industrial structure is characterised by a lower (and decreasing) diffusion of large enterprises.
When considering the dynamics of labour productivity the picture significantly changes. Aggregate data on Italian labour productivity hide a large degree of heterogeneity among the different size classes. Figure 2.1 plots the evolution of the apparent labour productivity, measured as gross value added per employee, by size class across the European countries of interest. Overall, the productivity level of Italian manufacturing ranks in the last position, even though, in recent years, its trend has been in line with the other countries. The scarce aggregate productivity mainly follows from the conduct of micro and large firms, while Italian medium-sized companies show relatively positive trends. This suggests that the productivity gap between Italy and the other countries is largely driven by the relatively negative performance of smallest enterprises. Thus, rather than by their high presence, Italy is hindered by micro-sized firms’ ability to reach the same productivity levels of their European counterparts.
8

Figure 2.1 Apparent labour productivity by size class
Source: EUROSTAT. Gross value added per person employed, thousands of Euros.
This clearly translates in a differential external competitiveness, which is a result of the self-selection of more productive companies into international markets. In line with findings by many other studies including those that adopt different approaches, the productivity distribution of internationalised firms is shifted rightward with respect to the bulk of the distribution referred to domestic companies.2 Furthermore, the general result holds even when the comparison is performed within each size class separately, as shown by Figure 2.2. However, this correlation seems to be only partially connected with the one linking the ability to export and firm size. In fact, starting from small firms, the
2 Even though there is a very small group of highly productive non-exporting firms. Unreported kernel density functions show an overlap of domestically-oriented activities with the ones of internationalized companies. Whilst the reasons underpinning this outcome may be manifold -ranging from market niches through to rent positions-, this evidence does not affect the general result that companies reaching foreign markets tend to be more productive than those remaining within the national borders.
9

percentiles associated with the group of exporters exceed those associated with the group of non-exporting firms belonging to the subsequent class. To this extent, small exporters exhibit higher labour productivities than medium-size domestic companies and medium-sized exporters turn out to be more productive than large domestic enterprises.
Figure 2.2 Labour productivity distribution by size
Note: Data refer to the population of manufacturing sectors in 2014.
Source: Elaborations on microdata from the Italian National Institute of Statistics (ISTAT).
As such, the data suggest that the structural weakness of the Italian company has not to be only traced in the high number of micro-sized companies (indeed frequencies are similar to the Spanish or French economy), but rather in their technical inefficiency vis-à-vis other countries. The latter is strictly related to poor performances in terms of innovative behaviours, human capital absorption, and degree of international openness. As largely emphasised by the evolutionary literature on industrial dynamics, technological and organisational innovations play a central role in this matter for they represent the way through which business organisations seek to gain an advantage over their competitors (Dosi and Nelson, 2010). In this way, they represent a key element for external competitiveness (Dosi et al., 2015) as well as an indirect signal for the presence of dynamic capabilities, i.e. of those organisational abilities of coordinating internal and external resources to promptly deal with the changing surrounding environment (Teece and Pisano, 1994). In addition, the innovative process of competitiveness is a multifaceted and complex phenomenon that can be studied from different perspectives. Each of the perspectives can be characterised by strengths and drawbacks (for a discussion of many innovation indicators see for example Smith, 2004 and Castellani and Koch, 2015). Thanks to the information contained in the MET database, the analyses in this document focus both on innovation output and input variables. The former refers to the final outcome of the process
10

while the latter to the factors involved in its ‘production’. The possibility of taking advantage of both types is very important for it allows to draw a thorough picture of the technological advancements of the Italian firms and, hence, of their level of competitiveness.
Figure 2.3 presents the diffusion of innovators among exporters and domestically-oriented companies, both at the aggregate and at the size/class levels. The data are drawn from the pooled MET dataset and refer to the entire time span of the crisis 2008-2015. The height of the bars represents the share of business activities that have introduced at least one type of innovation (either technological or organisational) during the period of reference of each survey wave.
In line with the empirical evidence (Bernard and Jensen, 2004; Wagner, 2007; Dosi et al. 2015), export and innovation activities appear to be strongly positively correlated. Indeed, the share of innovators among the firms selling (part of) their products on foreign markets doubles the one detected among the domestically-oriented business activities (39 % against 19 %). This association holds even within each size class and seems to be particularly strong for micro-organisations. The percentage of innovators among the exporters belonging to this group is almost twice as much as the one detected among non-exporting micro-firms (33 % against 18 %).
Moreover, similarly to the dynamics of productivity, the innovation-export nexus seems to be only partly linked to the number of employees. As a matter of fact, despite the positive relationship between the share of innovators and firm size, the share of innovating exporters within a class outstrips the share non-exporting innovators within the subsequent class. For example: small exporters tend to innovate more frequently than medium-sized domestically-oriented firms (45 % versus 35 %). As before, then, size is important in relative terms. Although smaller organisations struggle more than larger ones to access and manage the resources and capabilities necessary to carry out innovative activities, innovations do not require a very large number of employees to be accomplished.
Figure 2.3 Firms’ innovativeness by exporting status
Note: Data refer to firms belonging to industrial sectors. ‘Innovators’ include all the business activities that stated of having introduced at least one type of innovation during the period of reference of the MET questionnaire. Types of innovation encompass: new products, new processes, new organisational, marketing and managerial practices.
Source: MET sample survey, waves from 2008 to 2015 (pooled dataset).
Table 9.2 provides further information on the export-innovation relationship by reporting the share of business activities per each type of innovation introduced. In particular, the analysis accounts for the
11

introduction of new products, new processes, and new organisational/managerial/marketing practices3. Overall, exporters’ higher propensity to innovate does not appear to be bound to a specific variety but it is equally detectable in each single category. As such, companies that sell (part of) their products abroad turn out to be more inclined than other ones to undertake all the types of technological and organisational changes. Provided that, it is however worth pointing out that product innovations are the most frequent type of innovation introduced both by exporters and by domestic firms while process and organisational/managerial/marketing innovations lag behind.
The widest gap (in percentage points) between the two groups of companies occurs precisely with regard to product innovations. Whilst this outcome follows from a multitude of phenomena, it nevertheless highlights the fact that the introduction of new varieties of goods is extremely sensitive to demand conditions, i.e. that it is a demand pulled process (see for example Guarascio, Pianta, and Bogliacino, 2016). Indeed, as any change in the portfolio of firm’s products is strictly bound to the targeted market, the large bias of product innovators for international environments represents a further sign of the difficult conditions of the domestic market.
At the same time, the strong correlation between the introduction of new products and firm’s ability to export underlines the strategic importance of this type of innovative activities for entering and surviving fast-changing environments. In this regard, the literature has emphasised that the production of new varieties is a fundamental way whereby business companies may reach market niches and/or obtain quasi-rents erecting barriers against their competitors (Dosi et al., 1990; Coad, 2009). In addition, the permanence on a specific market may also help the firm to learn from the tastes and needs of its customers as well as to get in touch with new technologies, spurring the introduction of new products and, thus, reinforcing the relationship between these two phenomena (learning by exporting).
In terms of process and organisational/managerial/marketing innovations, the differences in the behaviours of exporters and non-exporting firms are less strong. Indeed, whilst the former introduces new production methods and new management practices more frequently than the latter do, the propensities to innovate of the two groups are closer than what happens in the case of product innovation. This outcome is both due to lower shares of exporters undertaking these activities as well as to higher percentages of domestic businesses changing processes and practices to cope with the fallouts of the crisis. As a matter of fact, among large and medium firms that remained on a local/national scale, the number of organisational and (to a certain degree) process innovators outstrip the number of companies that introduced new products. As such, this evidence suggests that process and organisational innovations may be employed either to compete on foreign markets or to survive within national borders.
A second perspective to study the innovation-export nexus focuses on the procedures set up by an organisation to improve its knowledge base. Indeed, the high degree of competitiveness characterising the international environments require business activities not only to renew their range of products, production processes and organisational routines, but also to manage and process a great amount of information in order to be able to create new varieties of innovations. These activities may be both formal and informal depending on whether the innovative effort translates into dedicated R&D routines, or it is carried out during other stages of the production process, as it is the case, for example,
3 In the MET questionnaire the organizational, managerial and marketing innovations are grouped together. Although these categories refer to different aspects of firm’s organization, they represent three types of innovation that, at least in principle, do not require any investment to be carried out. Under this perspective, then, they can be treated as three similar phenomena.
12

of learning by doing phenomena or of patent acquisitions (Nelson and Winter, 1982). Whilst both types play an important role for firm’s technological advancements, codified R&D activities are often regarded as potentially more productive. Moreover, as already mentioned in the background scenario, the lack of a sufficient level of effort devoted to these procedures has been often pointed out as one of the major weakness of the Italian industrial system.
To this extent, Figure 2.4 reports the MET estimates on the diffusion of R&D among exporters and non-exporting firms and on the amount of resources invested in these projects by these two groups. In particular, the height of the blue and yellow bars indicates the percentage of business activities that carried out a research and development operation during the reference period of the corresponding MET wave, whereas the red squares indicate the average R&D expenditure, expressed in terms of firm total turnover, during the year the survey was conducted. The data are drawn from the pooled MET dataset in order to embrace the entire span of the crisis (2008-2015), and the information reported in the chart is detailed by size class.
As for the innovation output variables, the ability of reaching foreign markets and the tendency of investing in research and development activities are strongly positively correlated. As a matter of fact the percentage of exporters engaged in R&D activities is five times greater than the one referred to the domestically oriented businesses (24 % versus 5 %). The propensity of exporters of being more frequently active in R&D projects holds even within each size class, even though the extent of this difference increases along with the number of employees. In line with what was observed before, this evidence may be the result of two different dynamics. On the one hand, smaller exporters face higher difficulties in undertaking research and development activities due to the high costs they entail and, thus, many of them may fail to start these projects. On the other hand, among non-exporting companies, the incentive to devote resources to these operations does not increase with size as fast as among their exporting counterparts. As a result, despite the relatively large size, many domestic companies do not undertake formal R&D activities. Once more the explanations for this evidence are manifold, ranging from the drop of the domestic aggregate demand to the lack of the necessary resources to start a new research activity.
In accordance with these interpretations, the ability to carry out research projects seems to be only partially related to the size of the organisation. In fact, the share of exporters engaged in R&D within each class outstrips not only the corresponding share of non-exporting companies, but also the one referred to the group of domestic firms falling within the subsequent class. For example: small exporters carry out R&D activities more frequently than small and medium domestic firms (31 %, 11 % and 18 % respectively).
Similar results can be detected when focusing on the amount of resources devoted to the research activities rather than to their diffusion. Indeed, on average, business companies that sell (part of) their products on foreign markets invest a greater share of their revenues in R&D projects than non-exporting firms (1.52 % versus 0.44 %). In line with the evolutionary perspective (Dosi et al., 2015), then, highly competitive organisations are associated with higher efforts to win the technological competition on international markets. Moreover, this evidence holds true not only within each size class, but also between each group of exporters and the group of non-exporting firms falling within the subsequent class.
13

Figure 2.4 R&D activity by exporting status and size class
Note: Data refer to firms belonging to industrial sectors. The graph reports the diffusion of R&D activities and the effort in terms of R&D expenditure over total turnover among manufacturing firms broken down by size class and export status. Blue bars represent the share of business activities undertaking research and development activities (left axis), whereas red squares indicate the average weight of R&D expenditure on total revenue (right axis).
Source: MET sample survey, waves from 2008 to 2015 (pooled dataset).
The unquestioned importance of dynamic strategies, i.e., innovation, R&D, and investment, which needs to be further investigated at the econometric level, played an even more critical role in the light of the deep changes in the economic scenario characterising the time span under consideration. Italy has been strongly hit by the crisis and the Great Recession had a deep repercussion on the evolution of the population of firms as well as their business strategies.
During the second phase of the crisis Italy witnessed a diverging trend between domestic and foreign demand. While many European peers started to recover from the fallout of the financial crisis, Italy continued to struggle in the face of a dwindling internal demand. Indeed, the outbreak of this new downturn dampened the mild rebound started in the wake of 2009. As a result, after almost 10 years, the overall economic performance has not recovered yet and the aggregate value added still lags behind its pre-crisis levels, despite a tepid recovery displayed since 2015.
The significant drop of domestic demand pushed an increasing number of firms to look abroad for new survival opportunities, especially micro-sized firms, leading to a sizable growth of both extensive and intensive margins of export.4 As a result, the long-lasting decline of Italian export shares stopped in 2010. The value of Italian exports experienced a positive growth, which was roughly in line with the one for Germany, and even higher than other relevant peers such as France, UK, the Netherlands, and Belgium.5
Nevertheless, many of the newly-internationalised companies turned out to be weak performers (unstructured and not competitive enough) and unable to persistently sell on foreign markets. Once
4 ISTAT census data show that, between 2011 and 2014, the number of exporters went through a mild increase (+1.8 % within the entire population and +0.04 % within manufacturing sectors), while the number of business activities selling their products and/or services within national borders experienced a significant reduction (about 4.8 % for the whole economy and 8.5 % among manufacturing sectors). 5 This trend has been positively affected both by the geographical composition of the Italian export markets and by the favourable world demand for products of the Italian industrial specialization.
14

again, the ability to succeed on the international markets was strictly connected to the degree of international complexity entailing, among others, a higher innovative propensity.
In the end, we can say that the crisis has acted on firms’ innovative activities in different ways. First of all, the uncertainty generated by the turmoil on domestic and international markets and the shortage of resources to whom companies could access dampened both the propensity to innovate and the propensity to improve technological knowledge by means of codified R&D activities. This is especially true for the introduction of new varieties of products entailing a disproportionally high risk that could potentially undermine firms’ probability of survival. During the second phase of the crisis, however, the prolonged lack of an adequate domestic demand influenced companies’ expectations by spurring a larger and larger share of them to act proactively against the economic cycle. These factors may have generated a rebound of both innovation and R&D, as shown in Figure 2.5. This general pattern is not bound to a specific form of innovation but is similar, albeit not identical, in product, process, and organisational/managerial/marketing innovators.
An additional effect of the crisis episode concerns the significant changes in firms’ mode to carry out innovative activities. During the 2008-2015 period, the share of innovators undertaking R&D projects have been steadily increasing, from 20% to 40% (Figure 2.5); this evidence is consistent across size classes and not isolated in a specific group of companies. In other words, business activities started to take into account that innovations require the support of codified knowledge in order to constitute a competitive advantage over rivals. Indeed, this evidence points at a deep change in companies’ behaviours that were traditionally based on innovation modes relying on informal research activities, such as learning-by-doing.
Figure 2.5 Types of innovators by exporting status
Note: Data refer to firms belonging to industrial sectors. ‘Innovators’ include all the business activities that stated of having introduced at least one type of innovation during the period of reference of the MET questionnaire. Types of innovation encompass: new products, new processes, new organisational, marketing and managerial practices.
Source: MET sample survey, waves from 2008 to 2015 (pooled dataset).
Overall, descriptive statistics showed that, whilst size and productivity play a key role for external competitiveness, there are also other fundamental aspects that triggered superior performances. In particular, a non-negligible part of heterogeneity stems from firms’ strategic profiles, technological
15

capabilities and ‘proactive’ behaviours, especially innovative activities. Paired with a general improvement in Italy’s external performance, the sovereign debt crisis came with a decreasing diffusion of the “traditional” Italian model characterised by incremental innovations without R&D activities. Moreover, after an initial collapse in the share of innovative firms, the Italian industrial system has been witnessing a gradual rebound in the diffusion of proactive firms. It is then natural to examine whether there is a causal nexus linking firms’ dynamic strategies and export performance behind these correlations.
16

3. RELATED LITERATURE
This section provides a thorough review of the academic literature on the patterns and determinants of firm-level competitiveness, with a specific focus on Italian firms. As a starting point, we acknowledge the need of framing the notion of competitiveness as a multidimensional concept. First, competitiveness has different meanings depending on whether it is considered at the micro, meso, and macro levels. Even if the main focus is on micro-level analyses, we need to account for the interdependency of firm-level competitiveness with sectoral and national characteristics and priorities. Second, one needs to distinguish between the contextual enablers of competitiveness, i.e. quality of institutions, business environment, and infrastructures; the structural conditions underlying competitiveness, that can be measured in terms of innovative capacities, technological conditions, and productivity; as well as the competitive performance, expressed in terms of exports, FDIs, market shares, and other indicators. Third, whichever the level of analysis, competitiveness issues are largely shaped by the way global value chains (GVCs) are organised and governed. All these facets of competitiveness are addressed reviewing theoretical, empirical, and policy oriented contributions. With specific reference to Italy, we review an extensive empirical literature that has investigated Italy's (long lasting) weak productivity dynamics (see, for example, Codogno, 2009). In addition, we provide an overview of contributions focusing on the heterogeneity of firms’ performance in Italy (Tiffin, 2014). Finally, we take into account the importance of some specific features of the Italian firms such as corporate governance and ownership structure, family management, and managerial characteristics.
2.1 ANALYSING COMPETITIVENESS AT THE FIRM-LEVEL: THE ITALIAN CASE
What are the features of firms that successfully compete in international markets? To what extent do they contribute to productivity and employment? What are the policies that can improve a nation’s foreign trade performance? These are some of the questions addressed empirically by authors as Ottaviano and Mayer (2007), Barba Navaretti et al. (2010) and Altomonte et al. (2011, 2012). In their work, Altomonte et al. (2011, p. 2) provide a definition of firm-level competitiveness: ‘…we define competitiveness as the ability of firms in a given country – not of the country itself – to mobilise and efficiently employ (also beyond the country’s borders) the productive resources required to offer goods and services. The factors affecting this ability range from firm-specific variables (such as the sector of activity, size, technology and so on) to macro/institutional ones (e.g., price/cost structure, investment environment and so on)’.
In what follows we review the contributions that have tried to answer to the abovementioned questions focusing on Italian firms’ competitiveness. Since the mid-nineties, the Italian productivity trend has been sluggish if not dramatically weak (Borin and Mancini, 2016; Calligaris et al., 2016). This is particularly true if the Italian dynamics is compared with the ones of its main competitors such as Germany. In this respect, stylised facts show that, in Italy, a moderately sustained labour market performance has come together with a weak real GDP growth. It emerged how a robust contribution of labour utilisation to GDP growth has been more than offset by a reduction in the contribution from labour productivity, resulting in weak overall GDP growth. Such persistently poor dynamics of productivity has been analysed by a large number of contributions aimed at identifying the drivers laying behind it (for a review, see Codogno, 2009 and Calligaris et al. 2016). In particular, efforts have been put forth to understand to what extent these weaknesses – detected at the aggregate level - negatively affect international performance when the micro level is accounted for.
17

In a recent study, Calligaris et al. (2016) pose a major emphasis on resource misallocation and on its effect on aggregate productivity dynamics. What emerges is a clear slowdown in Italy’s TFP dynamics since the middle of the 1990’s, whereas TFP continued to grow in France and Germany until the global financial crisis. One of the factors which is connected to such productivity slowdowns has to do with a set of reforms undertaken in Italy form the mid-1990s onwards. In particular, the authors detect a relationship between such reform intervention and the resource misallocation put at the basis of the weak TFP performance. Calligaris et al (2016) point to the large set of privatisations – directed at privatising former state-owned firms. This process may have shifted resources from industrial or services activities with a high level of productivity to services characterised by low competition, high rents, and low productivity. Another set of reforms on which Calligaris et al (2016) point their attention are the intervention that aimed at increasing flexibility of the Italian labour market. The authors note that, in Italy, the reform has created a ‘dual’ labour market where some workers are highly protected while others are highly ‘flexible’. Such segmentation may eventually lead to more labour misallocation and to a de-anchoring of wages from labour productivity (Manasse and Manfredi, 2014).
An additional element potentially driving the Italian weak competitive performance regards the poor market selection dynamics6. That is, market mechanisms expected to kick out firms when characterised by poor productivity performance seems to be not particularly effective in Italy (Landini, 2016). Such poor market selection is commonly related to rigidities ensuring competitive rents - i.e., market advantages due to idiosyncrasies of the firm’s demand. Comparing the dynamics of market selection during the Great recession in the EU, Landini (2016) finds that such dynamics is weakest in countries – i.e. such as Italy – more severely hit by the crisis, thus suggesting that policy makers should devote more attention - beside measures aimed at reducing rigidities in product market - to policies that foster firm competition and eliminate the sources of competitive rents (transportation costs or institutional elements such as long-term buyer-supplier ties7).
Besides a poor productivity performance registered at the aggregate level, Italy seems to be characterised by a relevant degree of heterogeneity in terms of competitiveness and international performance. Particularly, Italy reveals sustained export dynamics during the last two decades, a dynamic continuing even after the 2008 crisis (Tiffin, 2014). In this respect, Italy seems to be affected by dualism: on the one hand, firms characterised by weak productivity performances and mainly relying on domestic demand; on the other, internationalised firms showing remarkable competitive performances and ability to increase their market shares (on these topics, see Castellani and Zanfei, 2007; D’Aurizio e Cristadoro, 2015; Cozza and Zanfei 2014; Bogliacino et al. 2016).
In acknowledging the existence of such heterogeneity, a growing number of studies explored the characteristics of Italian exporters. These efforts are aimed at identifying elements explaining the international success of such (small) cluster of Italian firms. A particular emphasis is given to: the relative importance of price and non-price competitiveness factors, such as product and process innovation, products quality, and complexity (Basile, 2001; Castellani and Giovannetti, 2010; Bogliacino et al. 2016); the role of firm size, ownership structure and management strategies (Borin and Mancini, 2016); the linkages with local institutions and GVCs.
Basile (2001) analyses the relationship between export behaviour and innovation capabilities considering three different years between 1991 and 1997. Studying both the probability for a firm to
6 For a review of the recent empirical contributions analysing the dynamics of market selection in various economies see the previous sub-section. 7 See Landini, 2016 p. 4.
18

export and the propensity to export for the exporting firms, Basile (2001) studies the correlation between the latter and a set of covariates including new products, new processes, labour cost, firm size, ownership characteristics, and geographical localisation of firms. The export performance of the set of Italian firms analysed by Basile (2001) turns out to be significantly driven by product innovation. Contrarily, cost factors - as labour costs per unit of product - seem to play a marginal role. Another set of contributions explores the heterogeneity of Italian firms’ performances based on the evolutionary approach (Dosi and Nelson, 2010; Dosi, 2012). These authors show that firms' international performance is characterised by persistent heterogeneity, and by cumulative processes that are specific to firms sharing specific characteristics in their knowledge base and business strategies (Dosi et al., 2010). On similar lines, Dosi (2007) explores the statistical distribution of Italian manufacturing firms’ performance variables. It emerges how the idiosyncratic components of firms - principally their innovation efforts - drive the process of change in such distributions. However, the process of market selection is confirmed to play a minor role in affecting the patterns of growth because differential efficiencies do not reward more successful firms in terms of growth. Using a large dataset on Italian manufacturing microdata produced by ISTAT, Dosi et al. (2012) find a strong intra-sectoral heterogeneity of firms along labour productivity and growth rates.
Focusing on Italy, a large number of works focused on the differences between internationalised and domestically-oriented firms (see, among the others, Ferragina and Quintieri (2000), and Castellani (2002)). Another stream of literature analyses heterogeneity focusing on firms performing FDIs and on multinationals (Barba Navaretti and Castellani, 2004; Casaburi et al., 2009; Castellani and Zanfei, 2007; Castellani and Giovannetti, 2010, Cozza and Zanfei, 2014). Relying on a matching model, Barba Navaretti and Castellani (2004) compare productivity dynamics of a group of firms observed after their decision of locating their production abroad; against a control group, which is not internationalised. Internationalised firms result to substantially outperform the control group. These results are supported by the findings in Castellani and Zanfei (2004) showing that internationalised companies perform relatively better in terms of both value added and TFP. Furthermore, Castellani and Giovannetti (2010) find that firms’ innovative performance is positively correlated with the degree of internationalisation. In their contribution, Barba Navaretti et al. (2004) test whether the attitude towards internationalisation and offshoring is one of the drivers of better economic performance of Italian firms. They focus on MNFs aiming at identifying the effects of investments in “cheap-labour” countries on firm performance – measured in terms of sales and employment growth. Implementing a propensity-score matching model, the authors find no evidence of a negative effect of outward investments to cheap labour countries. Firms that invest in cheap labour countries seem to enhance the efficiency of home activities, with also positive long-term effects on output and employment growth. Focusing again on the impact of foreign investments on Italian firms’ performance, Barba Navaretti and Castellani (2004) find that investing abroad significantly enhances domestic performance.
The role of labour force quality and skills as drivers of Italian firms’ competitiveness is explored by Castellani and Giovannetti (2010). In their paper, the authors examine the relationship between the share of high-skill workers and TFP dynamics. The analysis is conducted exploiting an original dataset on Italian firms and distinguishing between R&D workers, workers in managerial and clerical occupations. According to their results, TFP differences are not only the outcome of different constant in the production function between international and non-international firms; but they rather reflect differences in the slopes of the production function. The interpretation of this result points to the fact that MNEs are both more capital intensive and exhibit higher returns to capital. Furthermore, they find that managers and capital are complements in the productivity of multinational firms. This element is
19

consistent with the idea that multinational firms have superior organisational capabilities and managerial practices.
From a policy perspective, the evidence reported above highlights the importance of FDI inflows and market selection as elements favouring the enlargement of the cluster of competitive firms. In particular, the presence of MNEs can result in cooperation and knowledge spillover towards domestic firms. Similarly, a larger number of internationalised firms may work as an incentive to push other firms towards more intense international activities. On the other hand, product market regulation, administrative and judicial efficiency may emerge as crucial factors favouring FDI inflows and MNEs’ investments (Ciriaci et al., 2016). In this respect, structural reforms aimed at cutting down rigidities in the product market or at spurring judicial efficiency may affect positively the rate of FDI inflows.
Borin and Mancini (2016) investigate if and to what extent Italian firms’ internationalisation strategies affect their productivity. The authors use a propensity-score matching technique to properly identify the effects of internationalisation on firms’ performance. The effect appears to depend on the country of destination of the investment and on the industry of the firm. More specifically, MNEs investing in advanced economies seem to be characterised by better performance along a broad array of measures (turnover, value added, employment and capital). D’Aurizio and Cristadoro (2015) perform a descriptive analysis comparing firms according to their ‘international status’. The set of Italian firms included in their sample are distinguished between those selling their products only domestically, firms exporting but not making any FDI, as well as firms both exporting and performing FDIs. The analysis highlights remarkable heterogeneities across the three groups. Firms belonging to the exporters-FDI cluster are characterised by a relatively-stronger performance in terms of sales, value added, and employment. Such cluster is followed by the one including exporters while firms selling their products only domestically show poorer performance with respect to all the considered indicators.
The international performance of firms has been analysed with respect to a number of additional factors playing a significant role in shaping the Italian economic context. A branch of literature deals with the links between family management and international performance of Italian firms. Expanding on previous contributions by Corbetta (1995) and Montemerlo (2000, 2005), Cerrato and Piva (2012) exploit a large sample of Italian manufacturing SMEs, and show that the involvement of the owning family in management negatively influences export propensity. However, they also find that once the choice to go international has been made, the degree of internationalisation of the firm is not significantly different with respect to the composition of the management team. An analogous exercise is carried out in Bannò et al. (2015) empirically studying a set of 293 Italian MNEs. Bannò et al. (2015) attempt to answer to the following question: does family management affect the internationalisation capabilities of Italian MNEs? The authors find that family management – intended as both ownership and management held by family members – has a negative impact on MNEs’ ability to compete in international markets. On the contrary, the involvement of family’s new generations as managers seems to have a positive effect on internationalisation.
A related issue is the education of managers and the impact the latter has on companies’ competitiveness and performance. Focusing on middle managers, Feltrinelli et al. (2015) investigate through an econometric model if training activities improve managerial practices being, in turn, a driver of companies’ competitive advantage. Their econometric exercise relies on a sample of Italian manufacturing firms observed over the 2006-2011 period and reporting information on both balance sheet data and internal training. Using GMM techniques, Feltrinelli et al. (2015) find robust evidence in favour of a positive relationship between middle managers vocational training and a set of
20

performance measures as ROI, ROE, and TFP. Similar findings are in Cucculelli and Micucci (2008) where the impact of the founder–chief executive officer (CEO) succession is analysed. Their results show that the maintenance of management within the family has a negative impact on a firm's performance. All these evidences confirm the findings in Bianco et al. (2013) in exploring the differential sensitivity to uncertainty of family and non-family firms in Italy. It emerges that family firms’ investments are significantly more sensitive to uncertainty than non-family firms. They interpret such evidence as related to the greater opacity of family firms and to their higher risk aversion, rather than to the degree of sunk fixed capital as argued by the previous literature on investment decisions.
The relation between quality of institutions and Italian firms’ competitiveness is examined, among the others, in Daniele and Marani (2011) and in Lasagni et al. (2015). The aim of both contributions is to test the hypothesis that macro factors, particularly the quality of institutions, play a role in explaining the heterogeneity of performance within Italian firms. More specifically, Daniele and Marani (2011) test whether the presence of organised crime – an element signalling strong weaknesses and fragility of institutions – affects the inflow of FDIs in Italian provinces. This element is particularly relevant since - as it has been shown previously - foreign ownership and participation in GVCs is a key element driving the international performance of firms localised in Italy. They find that organised crime is negatively and significantly associated with firm FDIs. This result holds even when an indicator of financial incentives for investment is included in the model.
Nifo and Vecchione (2012) propose a multidimensional Institutional Quality (IQ) indicator merging governance quality indexes stemming from official sources and surveys conducted by public, private and non-governmental institutions. Lasagni et al. (2015) exploit this indicator to empirically test if institutions’ quality contributes to explain firms’ heterogeneity in TFP. Analysing a sample of Italian manufacturing companies observed between 1998 and 2007, the authors find that firms showing a relatively stronger TFP dynamics are those localised in areas where the IQ displays higher levels. That is, in line with previous contributions exploring this relationship, a good institutional framework contributes to spur firms’ competitiveness.
The factors analysed above – i.e., quality of institutions, education of managers, and family management – testify the presence of relevant country specificities affecting the performance of Italian firms. In this respect, policy actions directed at fostering firms’ competitiveness should be designed accounting for such characteristics. Concerning the quality of institutions, administrative efficiency turns out to be the major issue in Italy. The role of institutions quality in affecting competitiveness has been recently analysed by Giordano et al. (2015). They study the effect of public sector efficiency on firm productivity using data from more than 400.000 firms across Italy’s provinces. Public sector inefficiencies turns out to significantly reduce private firms’ productivity. Remarkably, Giordano et al. (2015) find that if public sector efficiency rose to the frontier in all provinces firm productivity may therefore increase up to 22 percent while gross value added per employee costs could rise from 2 to10 percent. For the average firm, output would expand by 3 percent. However, the presence of inefficient institutions having a negative effect on firms’ performance is found to be largely uneven across regions and provinces. From this point of view, policy actions should focus particularly on the areas lagging behind in terms of both institutions’ quality and economic dynamics. Regarding the education of managers, an effective policy strategy to enhance the latter may be based on instruments favouring both firms’ partnerships and internationalisation (the positive effects of internationalisation are detected by Bogliacino et al. 2016). In fact, opening up firms’ organisation to international collaborations and foreign competition is likely to stimulate the acquisition of new managerial
21

practices. Internationalisation, moreover, may emerge as an effective tool to soften the distortions related to family management practices.
The role of financial markets and credit rationing as factors affecting export performance is studied by Minetti and Zhu (2011). They estimate the impact the effect that credit rationing exerts on Italian firm exports. They show that the probability of exporting is 39% lower for rationed firms and that rationing reduces foreign sales by more than 38%. Moreover, it emerges that credit rationing impacts more than proportionally on foreign sales rather than on domestic turnover. The role of credit rationing is explored also by Caggese and Cunat (2013). They study the interaction between financing constraints and export activity. It turns out that credit constraints reduce productivity gains deriving from trade liberalisation, as constrained firms are less likely to enter the export market.
A different stream of literature focuses on the linkage between labour market institutions and companies’ productivity. The main hypothesis is that different labour market institutions can have heterogeneous effect on firms’ competitiveness strategies. Focusing on labour market flexibility Saltari and Travaglini (2009) and Fana et al. (2016) connected the Italian poor productivity performance to the flexibilisation introduced in Italy from the late nineties onwards. These arguments are in line with the findings in Lucidi and Kleiknecht, (2009). Both Saltari and Travaglini (2009) and Fana et al. (2016) point to the fact that the flexibilisation of labour markets may have pushed firms towards strategies of cost competitiveness rather than to gain market shares through innovation. In this respect, the hypothesis of a negative relationship between labour market flexibility and the diffusion of technological competitiveness strategies is in line with the results reported in Daveri (2006). Exploring a sample of Italian firms, Daveri (2006) shows that the weak propensity towards innovation is at the roots of the poor productivity performance of these firms. All in all, shape and dynamics of Italian firms' competitiveness seems to be characterised, on one side, by a significant degree of heterogeneity (a cluster of innovative and internationalised firms capable of significant performances on the international markets and another one displaying poor productivity and relying mostly on domestic demand).
22

4. DATA
The econometric analysis exploits the large amount of information obtained by combining 2006-2014 balance sheet data (Crif-Cribis D&B) with the wide set of firm-specific data of the MET survey.
This survey is specifically conceived to study a massive amount of firms’ characteristics and strategies, with a particular focus on their internationalisation and innovative patterns. The sampling scheme, ensuring a very high degree of representativeness once coupled with a large number of interviews, is stratified along three dimensions: sector, geographical region, and size class. Unlike many other firm-level databases, the MET survey also accounts for firms with less than ten employees representing the vast majority of companies within the Italian industrial system. The survey is made of five waves (2008, 2009, 2011, 2013, and 2015) and covers a time span starting right before the Lehman collapse until recent years. The population of interest includes the enterprises operating within either Industry (construction excluded) or Production Services sectors (38 NACE Rev.2 3 digit sectors), with a total number of interviews of 120,000 companies, roughly 24,000 observations per wave (see Table 9.3).
The employed calibration estimators allow the survey, under predetermined circumstances, to reproduce known population parameters as well as to recover possible sample biases following from the (non-random) missing responses’ distribution. The computation of the calibration estimators takes also advantage of a set of auxiliary information (other than the one employed to identify the strata) drawn from the population of interest. This auxiliary information constitutes a further binding constraint the final sample has to reproduce. All the constraints are drawn from ISTAT Italian Statistical Business Register (ASIA) while the calibration procedure makes use of an ad-hoc iterative algorithm. As for the longitudinal part of the sample, a specific calibration estimator has been computed to account for firms interviewed in two succeeding waves.
In addition and starting from the wave 2009, the sampling scheme employs Bayesian techniques in order to ensure high precision estimates on a selected range of topics that represent the core part of the survey (R&D, innovation and internationalisation strategies among others). These techniques draw on a tree-based classification model able to detect, in the preceding wave, the strata showing higher rates of enterprises undertaking these relevant activities. This procedure has required further constraints leading to an oversampling of the targeted strata. Clearly, such sample bias is accounted for during the calibration estimator’s procedure.
23

5. ECONOMETRIC STRATEGY
The econometric strategy aims at analysing several dimensions of firms’ external competitiveness, ranging from probabilities of export, entrance, or exit, to international performance and productivity dynamics. The baseline equation tests the effect of different drivers of external competitiveness on the
a xpo e f exporting) according to the following specification: extensive m rgins of e rt (i. ., probability oPr = 1 = Φ + + + ( 1 )
where is either a dummy dependent variable identifying export activity (Export), or other dimensions of firms’ internationalisation. Equation 1 is a standard reduced form including a rich set of regressors ( ) to capture structural characteristics (productivity, size, age, capitalisation, group belonging, degree of vertical integration, cost of labour), financial issues (leverage, trade credit, bank debt, ROA, sales, cash flow) and especially firms’ behaviours (innovativeness, R&D, investments, affiliation to networks, import propensity, and human capital). We also include time effects ( ) to capture common shocks and cyclical components that vary over time. Finally, is a factor controlling for firms’ unobserved heterogeneity, also accounting for permanent industrial/geographical effects (12 controls for the firms’ belonging industry, 20 for region, and 110 for geographical province). More details on the definition of all the variables employed can be found in the Appendix.
The common factors and industrial or geographical components may have critical effects within this context. Indeed, the economic cycle, aggregate investment, as well as fluctuations of industrial demand and the external environment (among other common, industrial, or regional factors) are likely to have significant impact on both the extensive and intensive margins of export. Even though these factors are removed (through time fixed effects and sectorial/geographical interacted time controls) to obtain unbiased estimates useful for policy indications, they allegedly had a prominent role in the definition of a firm’s international performance.8
There are two main issues we need to take into account for assessing the effect of different drivers on firms’ external competitiveness. The first one has to do with reverse causality, whereby characteristics and behaviours do not foster export performance but instead result from the (a priori) successful penetration into new markets. The second interrelated point is the clear self-selection of more productive and dynamic companies into international environments. Because of the lack of a natural experiment allowing to define a strictly exogenous set of instruments, we try to address these issues in several alternative ways.
First of all, we alleviate problems of reverse causality by ruling out simultaneity bias. Matching current export status with lagged regressors partially solves reverse causation but may leave residual endogeneity in case of relevant unobserved heterogeneity or high persistence of Y and Z.
Accounting for firms’ unobserved heterogeneity is extremely important to derive policy implications requiring an identification of causal relationships. In general, unobserved heterogeneity refers to relevant variables (in addition to the ones under study) that are unobserved (or not measurable) but are correlated with the observed measures employed. If some firms’ characteristics that affect both the left and right-hand side variables are omitted because they are not observable, the regressors will be correlated with the error term and the regression coefficients will be biased (the direction of the bias 8 We avoid exploring heterogeneities along industrial or geographical components as they hide unobserved shocks that may reflect other common characteristics across firms that are spuriously correlated with the belonging stratum.
24

will then depend on the correlation between the omitted, dependent, and explanatory variables). For instance, our research aims at studying the effect of firms’ innovative strategies on their international propensity. On the top of the rich set of observable characteristics included in all regressions, there will always be some factors that the econometrician cannot measure, such as the specific skills or attitude of a firm’s manager. Eventually, the latter may drive both a broader openness to the international markets and a higher propensity to innovate. If we neglected this component, we would get a positive effect of innovation on export that is simply due to unobserved heterogeneity driving the relationship of interest. This issue can be generalised to any unobserved factor having effects on any of the variables included in the specification. The major motivation for employing panel data is the ability to control, at least, for the possibly correlated, time-invariant heterogeneity; that is, the longitudinal model will be purged from any unobserved and observed characteristic that is persistent over the considered time span.
Dealing with unobserved heterogeneity in a binary-response framework is not trivial. On the one hand, standard random effects (RE) models impose unrealistic assumptions on the type of heterogeneity that takes place (i.e., must be uncorrelated with the entire set of regressors). On the other, fixed-effects models, that do not impose any hypothesis on , are computationally difficult and introduce an incidental parameter problem leading to inconsistent estimates. Our strategy is in-between the two approaches and relies on RE-probit models augmented with the time average of each regressor (i.e., Mundlak-type controls).
The standard RE-probit model on the full set of coPr = + + ( 2 )
variates 1| , = Φimposes | ∼ 0, , which implies the assumption of strict independence between firm-specific unobserved heterogeneity ( ) and the full set of regressors. Because this unrealistic hypothesis would generate biased results in our setup, we follow Wooldridge (2010) and relax it by focusing on the effect of each variable in terms of deviations from its time average. This allows us to purge the model from persistent heterogeneity across firms and to derive cleaner policy implications.9 Moreover, to further control for persistence of , we also provide results for the subset of firms with = 0. In the unlikely case that residual heterogeneity is still affecting our findings, we run several additional robustness checks. We account for the introduction of unrestricted firm fixed effects through linear probability (within estimators) models purging all the firms’ characteristics that are stable over time. Finally, we further take care of self-selection by employing matching techniques (Coarsened Exact Matching) to recover a subsample of companies with the same ex ante probability of export. We then re-estimate our baseline specification for the new subsample of balanced firms to make inference on the treatment effect and provide additional robustness to our results.
The last econometric issue that is worth discussing is the possibility of correlated shocks. In other words, if there is a polarisation of companies within specific industries or geographical areas, the set of parameters may be affected by the firms’ reaction to unobserved shocks and no longer reflect the
9 Our estimator can be viewed as a Mundlak (1978) version of the Chamberlain (1980)’s assumption on the correlation between and Z, which requires the milder hypothesis of: | ∼ + ̅ , , where is the variance of in = + ̅ + , and ̅ is the time-average of (see Brancati et al., 2017). This approach is equivalent to a fixed-effects model in which the heterogeneity is projected on the time-mean of the regressors ( ̅ ), allowing to write the latent variable as ∗ = + + ̅ + + , with ∼ 0,1 . As usual, the estimator hinges on the exogeneity of
conditional on . We verify this hypothesis by adding the vector to our specification and testing the significance of its estimates (as proposed by Wooldridge, 2010). The test never rejects the null, thus providing at least some justification for the strict exogeneity assumption.
25

impact of some specific drivers. To tackle this concern, we enrich our baseline specifications with an extensive set of time-fixed effects specific for firm belonging industry (12 macro industries × 5 periods), region (20 ×5), and geographical province (110 × 5). This broad set of fixed effects permits us to control for most of the unobserved shocks induced by the Great Recession.
Further analyses are largely in line with the baseline specification. We take advantage of within estimators and quantile regression models (with Mundlak correction) for the intensive margins, as well as linear probability models with firm and time fixed effects.10
26
10 In RE-Tobit models the dependent variable is allowed to be censored. In our setup, the share of turnover from exported products is bounded in [0,100]. Alternatively, we employ within estimator with firm and time fixed effects accounting for continuous dependent variables. If the latter is applied to a dummy variable, a linear probability model is estimated. Even though such a model (born for continuous measures) does not impose any constraint on the admissible values of the dependent variable, it has the advantage of avoiding any restriction on the type of fixed effects that are included. Thus, it provides useful indications on the robustness of the results. The estimates from linear probability models can be directly interpreted in terms of marginal effects (i.e., any estimated coefficient represents the percentage change in the probability of Y=1 as a result of a one-unit increase in the value of the regressor).

6. RESULTS
6.1 EXTENSIVE MARGINS
This section presents the results of the analysis on firms’ probability of export (i.e., extensive margins). Table 9.4 shows some preliminary evidence obtained through pooled probit estimators (estimated coefficients with robust standard errors are reported). Even though this approach neglects firms’ unobserved heterogeneity and reverse causality issues, it may still provide useful guidance in the establishment of clean correlations between exporting status and firms’ characteristics and behaviours.
There are several issues that are worth mentioning. First, more productive companies are found to be largely associated with higher probabilities of export: a one-standard deviation increase in productivity is associated to a 1.5% higher probability of export. This evidence is broadly in line with the dominant literature on firms’ internationalisation. However, given the type of econometric analysis performed, that neglects persistent heterogeneity across firms, little can be said on whether this effect is linked to reverse causality, the ex-ante self-selection of more productive companies into international markets, or even learning by exporting phenomena. The role of productivity on firms’ probability of export will be further explored in the following analyses.
Second, structural characteristics play a critical role for firms’ exporting status. In particular, firm size and the belonging to corporate groups are associated with increases in a company’s probability of exporting. On the other hand, firms’ age is found to be largely insignificant, and the coefficients of firms’ degree of capitalisation is very unstable across specifications.
A prominent effect is found for firms’ strategic behaviours. Being an importer of intermediate products is largely associated to a higher probability of exporting (33% probability). This result is in line with the extant literature emphasising how import policies may affect aggregate productivity, resource allocation, and industry export activity along both the extensive and intensive margins (see for instance Amiti and Konings, 2005; Halpern, Koren, and Szeidl, 2015; Kasahara and Lapham, 2013; Kasahara and Rodrigue, 2008). Importantly, the introduction of innovations, the involvement in R&D projects, as well as undertaking new investments, are strongly correlated with export strategies. At this stage though, the estimates do not allow to make inference on the direction of causality underlying these relationships.
As expected, past performances are positively related to firms’ exporting status, but, once again, this analysis does not shed light on whether the direction of causality is reversed (i.e., the access to international markets allowed firms to experience higher sales growth).
Consistently with the recent trends in international trade that brought the surge of Global Value Chains, increasing fragmentation of the production process (i.e., low degree of vertical integration) is associated with a positive probability of internationalisation, allegedly capturing a higher propensity to participate in the production on global scale. Furthermore, large weights of labour cost (on total costs of production) are negatively affecting a firm’s probability of export, possibly capturing a component of cost competitiveness (once controlling for the level of capital intensity).
Financial issues play a critical role too. Highly leveraged companies, rationed out of the credit market, have a lower capacity of penetrating international markets, possibly because of the difficulties in
27

tapping external funds. In line with this finding, a firm’s ability to access bank debt and trade debt is positively associated to export activity. Finally, the quality of human capital (defined as the share of graduated employees) fosters firms’ international propensity, while the existence of relevant domestic networks seems to be negatively related to firm export status. The last finding may be linked to the lower demand shock experienced by domestic companies involved in stable networks.
These results, are stable across a number of robustness checks controlling for more detailed geographical components (province fixed effects), for correlated shocks at the region and/or industry levels through the introduction of industry*time and region*time fixed effects. Finally, the estimates are virtually unchanged if we focus on the subsample of companies operating in the manufacturing sector only (in untabulated robustness checks).
The sample size varies considerably across columns because additional variables require detailed information in the balance sheet data that sometimes is not reported. This is a common problem in every econometric estimation that has to deal with the trade-off between sample size and problems of model misspecification. By adding more and more variables, the so-called omitted-variable bias is reduced, but the price to pay is a reduced size of the sample. However, the unbiasedness of the results is ensured by the stability of the coefficients presented.11 Vice versa, little can be said on unstable coefficients whose changes can be either driven by sample selection or due to omitted variable bias. This is why, in the following estimations we focus our discussion only on features and strategies that across specifications are found to have consistent effects on firms’ internationalisation.
Since these results may be affected by persistent unobserved heterogeneity across firms (such as managers’ attitudes and skills), Table 9.5 accounts for this issue by presenting RE-probit models with Mundlak correction (columns 1 to 4) and within estimators with firm and time fixed effects (columns 5 to 8).
Once purged the model from persistent heterogeneity across firms, the role of productivity in fostering export activity is found to be strongly reduced. This result is unchanged across the two estimators and is qualitatively similar if we employ TFP as an alternative measure of productivity (Levinsohn and Petrin, 2003). We note that the comparison of Table 9.4 and Table 9.5, is implicitly confirming the self-selection hypothesis (largely emphasised by the literature), whereby persistently more productive companies are self-selecting into international markets, driving the positive association in Table 9.4. However, once this persistent heterogeneity is accounted for, the effect of productivity tends to be small or even insignificant. Because columns 1 to 4 of Table 9.5 include the Mundlak correction, the estimates have to be interpreted as effects of changes in each measure from its time average. In other words, the model is purged from any persistent characteristic, including any high/low level of productivity that is stable over time. Once accounted for this issue, and directly controlled for other structural and strategic determinants, the variation in firms’ productivity (on average) is not sufficient to explain the change in their exporting status. On the one hand, this is because productivity tends to be quite sticky over time. On the other, most of the variation of productivity in the short run is caused by the strategies undertaken by the company and its operating environment, which are added as separate regressors in our specification as they represent the drivers of productivity and implementable objectives for policy. The insignificance of the estimates implies that the remaining component does not have enough variation to induce any change in the international attitude.
11 Indeed, the progressive insertion of additional variables, and the resulting loss of observations, does not pose any threat as long as the key coefficients of interests keep having the same sign, statistical significance, and similar magnitudes. This indicates that the selection imposed on the model is close to be orthogonal to the main regressors.
28

This result is largely confirmed by the linear probability models in columns 5 to 8 (especially in the richest specifications), that do not impose any restriction on the type of unobserved heterogeneity that takes place. This finding does not have to be interpreted as an evidence that productivity does not play any role in firms’ exporting status. The significant effect documented in Table 9.4 suggests a clear positive association between productivity and export. The insignificance portrayed in Table 9.5 is exclusively indicating that most of the effect is due to a self-selection of persistently more productive companies into the international environment rather than variations in the level of productivity (not driven by dynamic strategies) causing a change in the export propensity.
This interpretation is confirmed in Table 9.6 where we model a firm’s entry in the international markets by focusing on the sample of previously non exporting companies. This result suggests that the productivity premium of internationalised companies is mainly confined to firms that are persistently operating in the international markets. Vice versa, because of the stickiness of the productivity dynamics, changes in productivity do not seem to be capable of explaining a firm’s entry choice once persistent heterogeneity is purged by the model.
Noticeably, firms’ dynamic strategies keep playing a critical role in their international propensity. The introduction of innovations, the involvement in R&D projects, and firms’ investments have a positive, large, and significant effect on the probability of export even if the persistent heterogeneity across firms is properly accounted for in Table 9.5 (roughly 2% higher probability for the introduction of innovations and investments). This is confirmed in Table 9.6, showing that a firm’s innovativeness significantly increases its probability to start exporting. The (apparently small) coefficient of R&D has to be interpreted as the effect of a 1% increase in the expenditure in R&D. For instance, a firm increasing R&D expenditure up to 10% of its total sales has a 3% higher probability of exporting. Other estimates are largely insignificant, suggesting that the results of Table 9.4 were mostly driven by persistent differences or sticky characteristics that do not vary over time and may be spuriously associated with unobserved factors. This is the case for profitability measures and indicators of vertical integration that tend to be quite smoothed across consecutive years. On the other hand, financial issues (also quite persistent) are likely to have indirect effects through firms’ investment strategies; this issue will be further explored in the upcoming analyses. Finally, the insignificance of the variable human capital is also likely to come from the explicit control for R&D, which is capturing most of its positive effect.
Table 9.7 explores heterogeneity along the (maximum) geographical extension of the destination market. To this end, we run two distinct regressions, one for a firm’s probability of exporting within the EU area (Export(EU)), and the other for exporting beyond the Euro zone. The two sets of results confirm the critical role played by firms’ strategy in affecting their exporting status. Interestingly, the effect of innovation is found to be way more important for farer markets, with a magnitude that is roughly twice as much as the impact for export activity within the Euro zone. On the other hand, the effect of R&D seems to be somewhat reduced.
Given the prominent role played by firms’ dynamic strategies, in Table 9.8 we examine whether, on the top of their direct impact, the upgrading/downgrading paths of a firm have additional effects on its international attitude. In other words, two identical companies having the same set of dynamic strategies, may differ in terms of international propensity depending on the pattern undertaken in the recent past (i.e., stable, increasing, or decreasing number of dynamic activities). To this end, we enrich the baseline specification of Table 9.5 with the change in the number of dynamic strategies (innovation, R&D, and investment) between t-2 and t-1. This measure (Upgrading) takes positive values if the company incremented its array of dynamic behaviours, is zero if the firm experienced
29

constant strategies, and takes negative values in case of a reduction in the number of dynamic activities (i.e., downgrading).
Results clearly show that, besides the positive effects of innovation, R&D, and investment, the path of dynamic strategies undertaken in the recent past has significant effects. In particular, integrating more and more strategies is associated with a positive premium leading to a higher probability of export (ranging between 4% and 8%). Furthermore, the same coefficient suggests that a reduction in the array of dynamic behaviours tends to lower firms’ likelihood of exporting. We note that these results highlight disproportionate benefits for firms that in the past presented low or reduced innovativeness. For this set of companies, the introduction of one or more dynamic activities would allow to (partially) fill the gap with the group of most dynamic firms.
Table 9.9 replicates the analysis in Table 9.5 by providing a breakdown for product, process, and organisational/managerial innovations to explore some heterogeneities along the type of improvement introduced. As expected, product innovations dominate other forms of innovativeness (process or organisational/managerial innovations). This strict dominance is partly related to the fact that new products are the main form of innovation which is not reflected in the level of productivity (which we control for). Importantly, the comparison of column 1 and 3 (or 2 and 4), shows that the impact of product innovations is especially relevant for new exporters (columns 3 and 4), with a magnitude that is roughly twice the impact on the entire sample (4% increase in the probability to start exporting).
However, besides its direct effect on export, a firm’s innovativeness may also have indirect effects by boosting firms’ productivity, especially process and organisational innovations. To explore this additional channel Table 9.10 shows this indirect effect by testing the role of innovations on firm productivity growth. Columns 1 and 2 present the results from within estimators with firm and time fixed effects. As expected, higher innovativeness is linked to more pronounced productivity growth (+4% growth rate) that may, in turn, further foster a firm’s probability of export. Interestingly, this indirect effect is largely driven by less radical forms of improvements such as process and organisational/managerial innovations (column 2), while the introduction of new products does not seem to be linked to any productivity growth (i.e., they only induce direct effects documented in Table 9.9).
To deal with the possible reverse causality affecting the estimates, we also take advantage of matching techniques in columns 3 and 4. We employ Coarsened Exact Matching to recover a subsample of firms with similar characteristics (size, age, geographical location, industrial features, and, especially, with the same productivity at the beginning of the sample, 2008) that only differ for the actual introduction of innovations (the treatment variable). We then re-estimate the regressions in columns 1 and 2 on the new (balanced) sample employing matching weights. Once again, firms’ innovativeness is found to have a positive and significant effect on their productivity growth, with a dominant role for process and organisational/managerial innovations (associated to a 15% higher productivity growth).
Noticeably, import choices significantly affect productivity growth too. This evidence is largely in line with the empirical and theoretical literature, suggesting that productivity gains from importing intermediates may allow some importers to start exporting, leading to a resource reallocation along the intensive margin (Amiti and Konings, 2005; Halpern, Korn, and Szeidl, 2015; Kasahara and Rodrigue, 2005; Kasahara and Lapham, 2013).
The analysis presented so far, despite providing clear indications on the role of dynamic strategies for firms’ internationalisation patterns, misses to acknowledge two important issues. The first one has to do with the simultaneity of the innovation and export decisions. While we always match current export
30

activity with lagged innovative choices, there is still the possibility of significant correlation between the two equations that may invalidate the coefficients of interest. For instance, firms’ may choose to invest in innovations to penetrate international markets. If this is the case, the two choices are simultaneously determined and this issue should be properly accounted for. The second point has to deal with the identification of the determinants of firms’ innovative strategies, which are especially useful to provide some policy guidance.
To this aim, we account for the simultaneity of the phenomena by employing bivariate probit models (with Mundlak correction). The specification estimates firms' probability of exporting conditionally on its (lagged) innovative status. The model can be summarised by the following system of equations:
= 1 ∗ = + + > 0 + = 0 ∗ = + ≤ 0= 1 ∗ = + > 0= 0 ∗ = + ≤ 0
where and are the observed (dummy) dependent variables, ∗ and ∗ are latent variables, while and are the two error terms, assumed to be i.i.d. as a bivariate normal with unitary variance and correlation coefficient = , . The system of equations allows to estimate the impact of innovativeness on export, and to jointly analyse the drivers of innovative strategies. is the standard set of regressors in Table 9.5, while is a vector of determinants for innovations, including R&D choices (internal vs outsourcing), structural characteristics (size, age, capitalisation, and productivity), proxies for demand conditions (past sales growth), operating environment (group belonging and participation in local networks), as well as measures aimed at capturing firms’ financial conditions.
Table 9.11 presents the main results. First, even after accounting for the simultaneity of the phenomena, and perfectly controlling for third factors that jointly affect export and innovation, firms’ innovative strategies are found to have strong and significant effects on their international propensity. In other words, the main results of the previous analyses are found to be robust and not to depend on simultaneity issues.
The analysis on the determinants of firms’ innovativeness present interesting results. As expected, structural characteristics are significantly affecting the introduction of innovations, especially in case of larger, younger, and more productive companies. Similarly, past sales growth, which can be thought of as a proxy for demand trends, is positively associated to firms’ innovativeness. The existence of R&D projects is clearly correlated to huge increases in the probability of introducing innovations. Importantly, this effect is not limited to the investment in R&D performed within the firm (internal R&D), but extends to firms outsourcing R&D activities, even though with smaller magnitudes (+8% vs. +27% probability). This is a relevant result, as the outsourcing of R&D projects is widely employed by very small firms that are not structured enough to undertake internal research projects.12 Another important factor in driving firms’ innovativeness is related to the operating environment of a firm. Belonging to a corporate group significantly increases the probability of innovating by roughly 5%, as well as the insertion into domestic networks with other companies (4.5%). This result is largely in line with the dominant literature on domestic districts, whereby close proximity with other
12 The variable human capital is largely insignificant, possibly because R&D measures are capturing most of its effect.
31

companies may foster the innovative process through iterated exchanges of knowledge flows. As before, the insignificance of human capital may be driven by its persistence (we always account for Mundlak correction) as well as controls for R&D capturing most of its effect.
Finally, columns 1 and 2 emphasise the critical role played by financial constraints in the development of innovative projects. By their very own nature, innovative firms, especially SMEs, are more likely to suffer from financial problems. Because of their informational opaqueness, their little tangible assets to pledge as collateral, and the riskiness of their strategies, most potentially innovative firms are credit-rationed and face relevant obstacles in financing their investments. In this regard, the type of innovation to be financed, the characteristics of the firm, and its relationship with the lender bank play a crucial role in the actual capability of introducing innovations.
We analyse this effect in two alternative ways. In column 1, we employ a synthetic measure of firms’ creditworthiness (or bankability), defined as the first principal component (Creditworthiness) of several financial rations that are traditionally used by banks to compute internal credit scores (leverage, ability to pledge collateral, age, size, cash flow to total assets ratio, sales to total assets ratio, proxies for rollover risk, …).13 As expected, this measure is positively associated with firms’ innovativeness, possibly because of its correlation with firm access to external credit.
As an alternative measure, column 2 employs the predicted probability of being financially constrained. In particular, the MET survey contains information on the existence of positive net present value investment projects that were not undertaken because of a lack of financial means. This measure can be thought of as a direct proxy for financial constraints (dummy variable) and is employed in Table 9.12 as a dependent variable.
Besides including some structural characteristics, we employ a set of measures that are traditionally used by the literature as proxies for relationship lending. Relationship lending represents the informational privilege that a bank accumulates over time by establishing close ties with its borrower so to overcome problems of informational asymmetry, especially when dealing with innovative projects. The amount of soft information gathered by banks can be critical in determining credit access, especially for opaque SMEs whose hard information is not enough to correctly evaluate firm creditworthiness. In other words, the existence of close ties with the lender bank significantly helps overcoming credit constraints.
Given the unobservability of the stock of prior information accumulated by the bank, we employ three main measures to capture this phenomenon. The first one, bank distance, is the physical distance between the belonging province of a company and the headquarter of the lending bank (in log-Km). This measure is correlated with the “informational distance” between the lender and the borrower; the larger the distance, the higher banks’ difficulties in transmitting soft information to the headquarters. Similarly, banks' degree of hierarchisation (here proxied by bank size, i.e., the log of banks’ total assets) significantly affects the transmission of soft information gathered from delocalised branches to the upper levels. Finally, the higher the number of banks each firm is borrowing from, the weaker the relationship that is established with the lender, and the lower the amount of soft information that is allegedly gathered.
Table 9.12 presents results that are in line with a priori expectations and emphasise the critical role played by relationship lending in reducing a firm’s probability of being financially constrained.
13 The first principal component accounts for 65% of the total variance and loads on all the coefficients unambiguously indicating increases in creditworthiness.
32

Finally, in column 2 of Table 9.11 we employ the predicted probability from Table 9.12 to show the detrimental effect of financial constraints on firms’ innovativeness, which is always very negative and extremely significant, suggesting that finance may represent a severe obstacle for financing innovative activities of SMEs.
Before moving to the analysis of the intensive margins of export, it is worth to provide some evidence on firms’ exit. Because of the sensible drop in domestic demand, a large fraction of companies entered the international environment in the aftermath of 2011. At the same time, a significant flow of firms exited international markets within the same period. Table 9.13 digs deeper into this issue by modelling a firm’s probability of exiting the international market after 2011. These firms tend to be on average smaller, younger, and, especially, less productive. After accounting for unobserved heterogeneity, firms’ productivity did not play any role in firms’ entrance, as it has a very negative and significant effect on exit strategies (a one-standard deviation increase in productivity is linked to a -1.4% probability of exiting the international markets). These combined results point at and outflow of companies that attempted to succeed in the international environment despite being less structured and fragile. Importantly, the adoption of dynamic strategies, especially innovation and investment, may help overcoming structural characteristics by significantly lowering a firm’s probability of exit (by -8.5% and -4.7%, respectively).
6.2 INTENSIVE MARGINS AND EXTENSIONS
Table 9.14 presents the result for the intensive margins of export, which is captured with two different measures. The first one is the share of sales from exported products (as a percentage of total sales, in columns 1 and 2), which, however, may provide unclear indications in case of relevant shocks to the domestic demand (i.e., this measure may increase for companies that keep exporting the same value while reducing at the same time the overall domestic sales). To overcome this drawback, we also present results on the growth rate of export sales (in columns 3 and 4) as an alternative proxy.
While accounting for unobserved heterogeneity made productivity irrelevant in determining a firm’s probability of export, productivity plays a critical role for the intensive margins. Increasing productivity allows firms to better compete on the international markets, resulting into increasing share of exported products and positive trends in export growth (a one standard deviation increase in productivity leads to a 4% increase in the growth rate of exported products).
Importantly, the effect of firms’ innovativeness on export is not limited to the extensive margins, but extends to the performance on the international markets, and causes a 8.3% increase in export growth. As before, columns 2 and 4 show a strict dominance of product innovations compared to alternative forms of improvements.
Importantly, the effect of dynamic strategies on extensive and intensive margins of export tend to be multiplicative. Table 9.15 shows the differential impact of innovation on export depending on whether or not the firm paired the improvement with investment in R&D activities. The analysis sheds light on significant heterogeneities based on the differential degree of innovativeness embedded in the new products or processes developed. Innovation strategies that are combined with R&D projects increase a firm’s probability of exporting twice as much as the introduction of less radical innovations (4% vs 1.7%). In the same vein, they increase the growth rate of exported value by roughly 12%, compared to the 6.6% of innovation without R&D. These effects are always over and above the mere effect of R&D (which is controlled for in any regression). Given the large diffusion of the phenomenon of “innovation without R&D” in Italy, this result identifies a set of suitable targets for industrial policies
33

by pointing at the importance of pushing companies to integrate innovation strategies with R&D activities in order to improve international performances.
Table 9.16 presents estimates from quantile regressions on the share of exported products. The analysis aims at shedding light on potential nonlinearities in the effect of firms’ innovativeness and other factors on export. In other words, if there are structural differences between marginal exporters and firms exporting a large share of their production, quantile regressions allow testing for these heterogeneities.
Results highlight that research activities are fundamental to improve the performance on foreign markets except in case of firms that are already large exporters. In particular, the positive role played by R&D projects increases along with the degree of dependency from international markets. For large exporters, however, this effect turns out to be low and insignificant, probably due to the fact that highly internationalised firms lean on other types of strategies (e.g. outsourcing, market power exploitation, strict connection with foreign markets) to gain/preserve the competitive advantage over their rivals.
In a similar vein, the introduction of new products/processes/organisational practices is a relevant strategy for companies with a low share of revenues stemming from export activities. Indeed, the estimated coefficients point out that the first half of the export share conditional distribution associated with innovators is shifted rightward with respect to the first half of the conditional distribution associated with non-innovating firms. On the contrary, innovation plays a minor role for large exporters, probably because these business activities have already reached an established position on foreign markets.
Clearly, large exporters may face tougher competition in some industries, but to further increase the share of exported products innovations seem not to be a critical issue. In particular, productivity is a fundamental determinant of the magnitude of the international success, as emphasised by coefficients that are strictly increasing along with the intensive margins. In a similar vein, the number of employees and the share of exported turnover are significantly and positively correlated, with a coefficient that increases (at least until the 90th percentile) along the distribution of intensive margins. In between the 75th and 90th percentiles the importance of size dwindles in magnitude but not in significance. Moreover the number of employees remains more important for large exporters than for the marginal and small ones.
Overall, the estimates of quantile regression suggest that R&D and innovation are fundamental for penetrating foreign markets. Once the firm has reached a significant degree of dependence from the international environment, however, the organisational complexity and efficiency (i.e. size and productivity) stand out as the key elements for further improvements of competitive advantages.
Having established the effect of dynamic strategies on firms’ international propensity, we turn the attention to potential non-linearities in the effects of interest. In particular, smaller and less productive firms may have disproportionate benefits from the introduction of innovations and the investment in R&D projects. To test for this heterogeneity, Table 9.17 and Table 9.18 interact the effect of innovation and R&D with dummy indicators of high and low productivity and large and small size. The thresholds used to identify the companies are listed in the third rows (33rd or 25th percentile of the 2008 cross-sectional distribution of size and productivity).
Both the extensive (columns 1 and 2) and the intensive (columns 3 and 4) margins of export present significant non-linearities pointing at larger benefits for smaller and less productive companies (for
34

instance, innovations of less productive companies are linked to a 5.3% increase in the probability of export and 17% higher export sales growth, which are reduced to 1.7% and 7.1% in case of innovations undertaken by a productive firm). This is a critical finding as it identifies innovative strategies as a potential tool to fill the gap between large/productive companies and the set of less structured firms that are ideal targets for policy measures.
Finally, before moving the attention to a focus on global value chains, Table 9.19 explores differential performance in the second part of the crisis (after 2011) across persistently internationalised companies and new entrants.
The drop in domestic demand has pushed a second wave of internationalisation for companies that were originally domestic. The self-selection hypothesis emphasises the existence of a productivity gap between long-lasting exporters and the new entrants. This analysis highlights substantial differences in the international performance across the two groups. Table 9.19 focuses on exporters only and shows that new entrants experienced significantly lower performance in terms of exported values (the benchmark is the subset of persistently internationalised companies). Column 2 instead shows the overall performance of new entrants and persistently internationalised companies compared to the domestic ones. Interestingly, the entrance in the international markets allowed firms to increase their overall sales by roughly 6.7%, with a growth rate that is significantly larger than the one experienced by companies that were already internationalised (2.2%). This result confirms the relative poor performance of domestic companies, largely affected by the drop in domestic demand, and emphasises the significant role played by international strategies in offsetting the collapse of domestic sales. Moreover, even if new entrants were characterised by lower exported values, their relative higher growth rates of sales indicate a process of catching up if the international strategy is pursued continuously.
35

7. CONCLUDING REMARKS AND POLICY SUGGESTIONS
The aim of this paper is to better understand the drivers of competitiveness of Italian industrial companies and their business activity during the Great Recession. Our work highlights the well-known structural factors underlying external competitiveness, but emphasised the major role played by knowledge-creating activities, such as R&D and innovations, as well as several relevant dimensions of heterogeneity. The main findings and policy suggestions can be grouped into the following four major areas of contents.
Productivity
Our analysis confirms the critical role played by productivity for international competitiveness: a one standard deviation increase in productivity is associated with a 1.5% higher probability to export. This evidence is consistent with the literature that emphasises a self-selection of companies in international markets. Moreover, productivity has a critical impact on firms’ intensive margin to trade and on the decision to exit the foreign markets (+4% export sales growth and -2% probability of going back domestic). This is a critical issue since firms’ exit from international markets has been very sizable (roughly 20% of companies previously active abroad between 2011 and 2014) even in times of relatively low domestic demand.
However, once accounted for persistent characteristics that do not vary over time (including the higher average productivity of some companies), productivity is found to be largely insignificant in explaining the change in firms’ exporting status for domestic enterprises. The new entry into international markets, also in absence of R&D and innovation, has a particularly virtuous effect on sales performance.
In the light of our findings, productivity represents an essential driver for the success and the permanence on the international markets, but is not found to be a significant driver of new internationalisation choices (i.e., new entrances). In this regard, policy measures should account for such a heterogeneous effect. Specifically, policy measures should be able to differentiate between interventions aimed at increasing the number of internationalised companies, which is a relevant issue for the growth of competitiveness through learning-by-exporting mechanisms, and those measures oriented to strengthening the international position and performance of previously-internationalised companies.
Research and innovation
Besides structural characteristics, a prominent effect is found for firms’ strategic behaviours and investment in dynamic strategies. The introduction of innovations, the involvement in R&D projects, as well as undertaking new investments, induce a significant effect on export strategies (roughly +2% in export probability) and performance (innovations induce on average a 8% increase of export sales growth).
The introduction of innovations is even more important in reaching extra-EU destinations and in affecting firms’ switching strategies; i.e., entrance (+2.3%) and exit (-8.5%) from the international markets. Besides their direct impact, there are significant cumulative effects of dynamic strategies. First, the integration of innovation and R&D activities implies premia on both the extensive and intensive margins of export. The coefficients of innovative strategies paired with R&D investment is
36

two to three times larger than isolated innovations (4.1% vs 1.7% in the probability of export, and +11.7% vs +6.6% in export sales growth). Moreover, the path followed by the set of dynamic strategies undertaken in the past (adding or reducing the set of strategies, i.e., upgrading/downgrading paths) has additional effects on firms’ international attitude (roughly, +5% probability of exporting).
Among the different types of innovations, new products dominate other forms of innovativeness (process or organisational/managerial), especially in case of previously non-exporting companies (4% higher probability of exporting). This is because new products are the main form of innovation which is not reflected in the level of productivity. However, we find process and organisational innovations to have an additional indirect effect on export by boosting firms’ productivity (+2% productivity growth, +15% if based on matching techniques), while the introduction of new products does not seem to be linked to any productivity growth.
Innovative strategies are found to have disproportionate effects for the international performance of (originally) less productive and small companies: 17% and 21% increase in export growth compared to 7% and 8% increase for more productive and larger firms, respectively. This result may point to innovative strategies as a potential tool to fill the gap between large/productive companies and the set of less structured firms, which are ideal targets for policy measures.
A simultaneous equation model (bivariate probit) also emphasises the main determinants of firms’ innovativeness. In this regard, structural characteristics are significantly affecting the introduction of innovations, especially for larger, younger, and more productive companies. The existence of R&D projects is clearly correlated with a large increase in the probability of introducing innovations. Importantly, this effect is not limited to the investment in R&D performed within the firm (internal R&D), but extends to firms outsourcing R&D activities, even though with smaller magnitudes (+8% vs +27% probabilities). Another important factor in driving firms’ innovativeness is related to the operating environment of a firm, such as the affiliation to a corporate group (+5%) and the establishment of close relationships with other domestic companies (i.e., networks, +4.5%). Finally, financial constraints are found to significantly affect a firm’s capacity to innovate and the establishment of close ties with the main bank is documented to be extremely important in reducing informational asymmetries penalising innovative SMEs.
In terms of potential policy recommendations, we confirm the critical role played by R&D and innovations (new products directly influencing international competitiveness, and process/organisational innovations operating through higher productivity growth). Our analysis sheds lights on some pertinent factors. First, we show the disproportionate effect of dynamic strategies for more fragile (smaller and less productive) companies that are paired with a premium linked to integrated strategies (innovation and R&D) and the documented need to reduce the discontinuity of proactive behaviours, typically characterising more fragile (and often smaller) companies. These factors should be all taken into account when designing specific policies.
Similarly, financial constraints severely limit the activity of potentially innovative firms. The role of financial constraints goes beyond generic frictions in the credit market, such as informational asymmetries that can affect the entire set of relationships of SMEs with the banking system. Financial constraints can be dramatically exacerbated in the presence of direct funds to innovative projects (characterised by higher uncertainty, opacity, and typically associated to investment in immaterial capital that cannot be pledged as collateral).
37

Firm size and corporate groups
The dominant academic view on the Italian productive system emphasises the excessive number of micro-sized companies within the economy, as well as a very fragmented industry paired with a reduced diffusion of large enterprises. Our analyses and the available comparisons allow to draw a more detailed picture of the industrial system.
The few existing academic econometric studies on firm-level information are not adequately capable of capturing the role of micro-sized companies, because they exclude very small firms from the sample design due to their mainly survey data.
Aggregate descriptive statistics seem to document that the main weakness of the Italian system is not due to the high diffusion of micro firms (whose share is not far from the one in France and Spain), but rather to their relatively poor performance. Our analysis suggests that the heterogeneity of the set of dynamic strategies leads, even within the same size class, to substantially different economic outcomes and efficiency levels. Moreover, within the class of small firms there is a significant difference between companies below and above ten employees. For the latter (>10), descriptive and empirical evidence emphasises higher performance of Italy compared to other European peer economies.
The econometric analyses always confirm the positive role of size and affiliation to corporate groups (respectively, +3% and +2% probability of exporting). In this regard, however, innovative strategies seem to display disproportionate incremental effects for smaller companies.
Obviously, firms’ size cannot be easily implemented as a specific objective for policies, at least not directly. It is however clear from the empirical results that policy measures oriented to the reinforcement of innovative and knowledge-creating activities and the specific financial constraints to their implementation may explicitly help smaller firms that are willing to undertake dynamic paths.
Industrial networks and global value chains
The role played by networks of firms and industrial districts is central in the economic literature about the Italian industrial sector. It has often been argued as a factor capable of offsetting the inefficiencies of small firms by allowing them to reach a larger scale at the network level compared to the small dimension of the single units. Similarly, firms’ involvement in Global Value Chains is often cited as a determinant factor in explaining success and weakness on the international markets, depending on their diffusion and the different modes of participation of the firms involved. Our analysis confirms the role of the environment and the involvement in local networks to increase firm innovativeness, through the opportunity of knowledge exchanges.14
Overall and given that our analysis does not specifically explore the effect of macroeconomic policies and structural reforms, the key potential policy suggestions from our work and empirical results can be summarised as follows:
• the support to firms’ R&D and innovation remains one of the main focus of policy measures for competitiveness. The choice of instruments has to explicitly consider needs and constraints of the targeted businesses;
• similarly, policies aimed at increasing innovative propensity should carefully account for qualitative upgrading of both the labour force and managers;
14 For an extensive discussion of the results (on the same dataset) see Brancati et al. 2017.
38

• an essential issue of the work is represented by the research of differential effects due to the integration of three fundamental dynamic strategies (R&D, innovation and internationalisation), whereby the effect of integrating dynamic strategies by firms following a path of modernisation that is not yet completed appears to be very significant. The completion of this strategy and the integration of activities is characterised - in our view - as one of the main goal of a strategy to support firms’ growth and to improve international competitiveness. Policy measures must be specifically targeted to these goals;
• similarly, the elimination or reduction of discontinuity in strategic business activities (for example with reference to the intermittent presence on foreign markets or with discontinuous innovative activities and R&D), in particular of smaller enterprises, seems to represent an “effective” policy target. The discontinuity can be directly influenced by appropriate and specific policy measures;
• financial constraints still constitute a substantial limitation to the growth of the most dynamic companies and to the improvement of their development strategies; paradoxically, financial constraints are stronger for companies oriented towards innovation and R&D than the static ones because of the significant market and technological risk and for the higher credit demand: access to credit (as well as other financial instruments) could usefully have a specific orientation towards innovative projects, while the practice of current policy for credit access and equity support is more in the sense of general targeting.
39

8. REFERENCES
Accetturo, A., and Giunta, A. (2016). “Value chains and the great recession: evidence from Italian and German firms.” Bank of Italy Occasional Paper No. 304.
Aghion, P. and Howitt, P. (1992). “A model of growth through creative destruction.” Econometrica, 60: 323-351.
Altomonte, C., Aquilante, T. and Ottaviano, G. I. (2012). “The triggers of competitiveness: the EFIGE cross-country report.” Bruegel Blueprint.
Altomonte, C., Barba Navaretti, G., di Mauro, F. and Ottaviano, G. (2011). “Assessing competitiveness: how firm-level data can help.” Bruegel Policy Contribution.
Altomonte, C. and Rungi, A. (2013). “Business groups as hierarchies of firms: determinants of vertical integration and performance.” Working Papers 2013/33, Fondazione Eni Enrico Mattei.
Amiti, M., and Konings, J. (2005). “Trade liberalization, intermediate inputs and productivity: evidence from Indonesia.” CEPR Discussion Papers No. 5104.
Antràs, P., and Chor, D. (2013). “Organizing the global value chain.” Econometrica, 81: 2127-2204.
Antràs, P., and Yeaple, S. (2013). “Multinational firms and the structure of international trade.” NBER Working Paper 18775.
Arduini, D. and Zanfei, A. (2014). “An overview of scholarly research on public e-services? A meta-analysis of the literature.” Telecommunications Policy, 38: 476-495.
Aristei, D., Castellani, D. and Franco, C. (2013). “Firms’ exporting and importing activities: is there a two-way relationship?” Review of World Economics, 149: 55-84.
Arnold, J. M. and Hussinger, K. (2005). “Export behaviour and firm productivity in German manufacturing: a firm-level analysis.” Review of World Economics, 141: 219-243.
Arrighetti, A. and Ninni, A. (2014). “Cambiamento dei sistemi manifatturieri e percorsi evolutivi delle imprese italiane”. In A. Arrighetti and A. Ninni (eds), La trasformazione “silenziosa”, University of Parma, Collana di Economia Industriale e Applicata, pp. 5-49.
Arrighetti, A., and Traù, F. (2012). “Far from the Madding Crowd, Sviluppo delle competenze e nuovi percorsi evolutivi delle imprese italiane”. L’industria, 33: 7-60.
Atkinson, A. and Stiglitz, J. (1969) “A new view of technological change.” The Economic Journal, 79: 573-578.
Baldwin, R. (2009) The great trade collapse: causes, consequences and prospects. London: CEPR.
Baldwin, R. (2012). “Trade and industrialisation after globalisation’s second unbundling: how building and joining a supply chain are different and why it matters.” In R. Feenstra and A. Taylor (eds) Globalization in an age of crisis: multilateral economic cooperation in the twenty-first century. Chicago: University of Chicago Press.
40

Baldwin, R., and Lopez‐Gonzalez, J. (2015). “Supply‐chain trade: a portrait of global patterns and several testable hypotheses.” The World Economy, 38: 1682-1721.
Banno', M., Pozza, E. and Trento, S. (2015). “La famiglia fa male all'internazionalizzazione dell'impresa?” DEM Discussion Papers 2015/03, Department of Economics and Management.
Barba Navaretti, G., Bugamelli, M., Ottaviano, G., Schivardi, F., Horgos, D. and Maggioni, D. (2011). “The global operations of European firms.” EFIGE Policy Report.
Barba Navaretti, G. and Castellani, D. (2004). “Investments abroad and performance at home: evidence from Italian multinationals.” CEPR discussion papers No. 4284.
Barba Navaretti, G., Castellani, D. and Disdier, A. C. (2006). “How does investing in cheap labour countries affect performance at home? France and Italy.” CEPR Discussion Papers No. 5765.
Basile, R. (2001). “Export behaviour of Italian manufacturing firms over the nineties: the role of innovation.” Research Policy, 30: 1185–1201.
Berglas E. and Jones, R. (1977). “The export of technology.” In K. Brunner and A. Meltzer (eds) Optimal policy, control theory and technology exports. Amsterdam: North Holland.
Bernard, A. B. and Bradford J. (1999). “Exceptional exporter performance: cause, effect, or both?” Journal of International Economics, 47: 1-25.
Bernard, A. B., and Jensen, J. B. (2004). “Why some firms export.” Review of Economics and Statistics, 86: 561-569.
Bernard, A. B., Jensen, J. B., and Lawrence, R. Z. (1995). “Exporters, jobs, and wages in US manufacturing: 1976-1987.” Brookings Papers on Economic Activity. Microeconomics 1995, 67-119.
Bernard, A. B., Jensen, J. B., and Schott, P. K. (2009). “Importers, exporters and multinationals: a portrait of firms in the U.S. that trade goods.” In T. Dunne, J. B. Jensen, M. J. Roberts, (eds) Producer dynamics: new evidence from micro data. Cambridge, MA: National Bureau of Economic Research.
Berthou, A., and Vicard, V. (2015). “Firms' export dynamics: experience versus size.” The World Economy, 38: 1130-1158.
Bianco, M., Bontempi, M.E., Golinelli, R. and Parigi, G. (2013) “Family firms’ investment, uncertainty and opacity.” Small Businness Economics, 40: 1035-58.
Bogliacino, F. and Gomez, S. (2014). “Capabilities and investment in R&D: an analysis on European data.” Structural Change and Economic Dynamics, 31: 101-111.
Bogliacino, F., Lucchese, M., Nascia, L., and Pianta, M. (2015). “The virtuous circle of innovation in Italian firms.” University of Urbino Working Papers Series in Economics, Mathematics and Statistics.
Bogliacino, F. and Pianta, M. (2013). “Profits, R&D and innovation: a model and a test.” Industrial and Corporate Change, 22: 649-678.
Borin, A., and Mancini, M. (2016). “Foreign direct investment and firm performance: An empirical analysis of Italian firms.” Review of World Economics, 152: 705–732.
41

Bottazzi, G., Cefis, E., Dosi, G. and Secchi, A. (2007). “Invariances and diversities in the evolution of Italian manufacturing industry.” Small Business Economics, 29: 137–159.
Bottazzi, G., Dosi, G., Jacoby, N., Secchi, A., and Tamagni, F. (2010). “Corporate performances and market selection: some comparative evidence.” Industrial and Corporate Change, 19: 1953-1996.
Bottazzi, G. and Secchi, A. (2006) “Explaining the distribution of firms growth rates.” RAND Journal of Economics, 37: 235–256.
Brancati, R. (ed) (2015). Le strategie per la crescita: imprese, mercati, Stato. Indagine MET 2015. Roma: Meridiana Libri.
Brancati, E., Brancati, R. and Maresca, A. (2017). “Global value chains, innovation, and performance: firm-level evidence from the great recession.” Journal of Economic Geography, doi:10.1093/jeg/lbx003.
Brancati, R., Centra, M., Falorsi, P.D., and Maresca, A. (2015). “L’indagine MET: logica, conduzione e metodologia.” In R. Brancati (ed) Le strategie per la crescita: imprese, mercati, Stato. Indagine MET 2015. Roma: Meridiana Libri.
Breschi, S., Malerba, F. and Orsenigo, L. (2000). “Technological regimes and Schumpeterian patterns of innovation.” The Economic Journal, 110: 388-410.
Bugamelli, M., Cannari, L., Lotti, F., and Magri, S. (2012). “The innovation gap of Italy’s production system: roots and possible solutions”, Bank of Italy Occasional Paper No.121.
Bundesbank (2016). “The impact of alternative indicators of price competitiveness on real exports of goods and services.” Deutsche Bundesbank Monthly Report January 2016.
Caggese, A. and Cuñat, V. (2013). “Financing constraints, firm dynamics, export decisions, and aggregate productivity.” Review of Economic Dynamics, 16: 177-193.
Calligaris, S., Del Gatto, M., Hassan, F., Ottaviano, G. I. P., and Schivardi, F. (2016). “Italy’s productivity conundrum. A study on resource misallocation in Italy.” Directorate General Economic and Financial Affairs (DG ECFIN), European Commission.
Cantwell, J. (1989). Technological innovation and multinational corporations. Cambridge, MA: B. Blackwell.
Cantwell, J. (2000). “A survey of theories of international production.” In C. N. Pitelis and R. Sugden (eds) The nature of the transnational firm. London: Routledge.
Cantwell, J., and Piscitello, L. (2000). “Accumulating technological competence: its changing impact on corporate diversification and internationalization.” Industrial and Corporate Change, 9: 21-51.
Carlin, W., Glyn, A. and Van Reenen, J. (2001). “Export market performance of OECD countries: an empirical examination of the role of cost competitiveness.” The Economic Journal, 111: 128-162.
Casaburi, L., Gattai, V. and Minerva, G. A. (2009). “Firms’ international status and heterogeneity in performance: Evidence from Italy.” In L. Lambertini (ed) Firms’ objectives and internal organisation in a global economy. London: Palgrave Macmillan.
42

Castellani, D. (2002). “Firms’ technological trajectories and the creation of foreign subsidiaries.” International Review of Applied Economics, 16: 359–71.
Castellani, D., and Giovannetti, G. (2010). “Productivity and the international firm: dissecting heterogeneity.” Journal of Economic Policy Reform, 13: 25-42.
Castellani, D. and Koch, A. (2015). “Mapping competitiveness with European data.” Bruegel Blueprint.
Castellani, D. and Zanfei, A. (2004). “Choosing international linkage strategies in the electronics industry: the role of multinational experience.” Journal of Economic Behavior & Organization, 53: 447-475.
Castellani, D. and Zanfei, A. (2006). Multinational firms, innovation and productivity. Cheltenham: Edward Elgar.
Castellani, D. and Zanfei, A. (2007). “Internationalisation, innovation and productivity: how do firms differ in Italy?” The World Economy, 30: 156-176.
Centro Studi Confindustria (2010). “Nuovi produttori, mercati e filiere globali. Le imprese italiane cambiano assetto”, Scenari Industriali 6/2010, Centro Studi Confindustria.
Centro Studi Confindustria (2011). “Effetti della crisi, materie prime e rilancio manifatturiero. Le strategie di sviluppo delle imprese italiane”, Scenari Industriali 6/2011, Centro Studi Confindustria.
Cepparulo, A., Arduini,A., Reggi, L. and Zanfei, A. (2013). “Patterns of e-service development across European cities.” 2ndEiburs-Taips conference on innovation in the public sector and the development of e-services, University of Urbino, April, 18-19.
Cerrato, D. and Piva, M. (2012). “The internationalization of small and medium-sized enterprises: The effect of family management, human capital and foreign ownership.” Journal of Management & Governance, 16: 617-644.
Cerulli, G. and Potì, B. (2012). “Evaluating the robustness of the effect of public subsidies on firms' R&D: an application to Italy.” Journal of Applied Economics, 15: 287-320.
Chipman, J. (1970). “External economies of scale and competitive equilibrium.” The Quarterly Journal of Economics, 84: 347-85.
Cincera, M. and Ravet, J. (2010). “Financing constraints and R&D investments of large corporations in Europe and the USA.” Science and Public Policy, 37: 455-466.
Cipolletta, I. and De Nardis, S. (2012). “L’Italia negli anni duemila: poca crescita, molta ristrutturazione”, Economia Italiana, 1: 63-98.
Ciriaci, D., Grassano, N. and Vezzani, A. (2016). “Regulation, red tape and location choices of top R&D investors.” Institute for Prospective Technological Studies, Joint Research Centre.
Cirillo, V. and Guarascio, D. (2015). “Jobs and competitiveness in a polarized Europe.” Intereconomics – Journal of European economic policy, 50: 156-160.
Coad, A. (2009). The growth of firms: a survey of theories and empirical evidence. Cheltenham: Edward Elgar.
43

Codogno, L. (2009). “Two Italian Puzzles: are productivity growth and competitiveness really so depressed?” Government of the Italian Republic (Italy)-Ministry of Economy and Finance-Department of the Treasury Working Paper Collection.
Cohen, W. (2010). “Fifty years of empirical studies of innovative activity and performance.” In B. Hall. and N. Rosenberg (eds), Handbook of the economics of innovation, Amsterdam: Elsevier.
Cohen, W. M. and R. C. Levin (1989). “Empirical studies of innovation and market structure.” In R. Schmalensee, R. D. Willig (eds) Handbook of industrial organization. Amsterdam: North-Holland.
Corbetta, G. (1995). Le imprese familiari. Caratteri originali, varietà e condizioni di sviluppo. Milano: Egea.
Cozza, C., and Zanfei, A. (2014). “The cross border R&D activity of Italian business firms.” Economia e Politica Industriale, 41: 39-64.
Criscuolo, P., Narula, R., and Verspagen, B. (2005). “Role of home and host country innovation systems in R&D internationalisation: a patent citation analysis.” Economics of Innovation and New Technology, 14: 417-433.
Cucculelli, M. and Micucci, G. (2008). “Family succession and firm performance: Evidence from Italian family firms.” Journal of Corporate Finance, 14: 17-31.
Czarnitzki, D., Ebersberger, B. and Fier, A. (2007). “The relationship between R&D collaboration, subsidies and R&D performance: empirical evidence from Finland and Germany.” Journal of Applied Econometrics, 22: 1347-1366.
Damijan, J. P., Konings, J., and Polanec, S. (2013) “Pass-on trade: why do firms simultaneously engage in two-way trade in the same varieties?” Review of World Economics, 149: 85-111.
Daniele, V. and Marani, U. (2011). “Organized crime, the quality of local institutions and FDI in Italy: A panel data analysis.” European Journal of Political Economy, 27: 132-142.
D'Aurizio, L. and Cristadoro, R. (2015). “Le caratteristiche principali dell’internazionalizzazione delle imprese italiane (the Italian firms’ international activity).” Bank of Italy Occasional Paper No.261.
Daveri, F. (2006). “Perché la produttività ha smesso di crescere nell’economia italiana?” Centro Studi Confindustria; Quaderni di Ricerca No.2.
Daveri, F., and Parisi, M. L. (2015). “Experience, innovation, and productivity: empirical evidence from Italy’s slowdown.” ILR Review, 68: 889-915.
De Marchi, V., Lee, J. and Gereffi, G. (2014). “Globalization, recession and the internationalization of industrial districts: experiences from the Italian gold jewellery industry.” European Planning Studies 22: 866-884.
De Nardis, S. and Pensa, C. (2004). “How Intense is Competition in International Markets of Traditional Goods? The Case of Italian Exporters.” Economia Internazionale, 57: 275-304.
De Nardis, S. and Traù, F. (2005). Il modello che non c’era. L’Italia e la divisione internazionale del lavoro industriale. Soveria Mannelli: Rubbettino.
44

Del Prete, D and Rungi, A. (2015). “Organizing the global value chain: a firm-level test” IMT Working Papers No.4/2015.
Dosi, G. (1982). “Technological paradigms and technological trajectories: a suggested interpretation of the determinants and directions of technological change.” Research Policy, 11: 147-162.
Dosi G. (1988). “Sources, procedures and microeconomic effects of innovation.” Journal of Economic Literature, 26: 1120-71.
Dosi, G., Grazzi, M. and Moschella, D. (2015). “Technology and costs in international competitiveness. From countries and sectors to firms.” Research Policy, 44: 1795-1814.
Dosi, G., Grazzi, M., Tomasi, C., and Zeli, A. (2012). “Turbulence underneath the big calm? The micro-evidence behind Italian productivity dynamics.” Small Business Economics, 39: 1043-1067.
Dosi, G., Moschella, D., Pugliese, E. and Tamagni, F. (2015). “Productivity, market selection, and corporate growth: comparative evidence across US and Europe.” Small Business Economics, 45: 643-672.
Dosi, G., and Nelson, R. R. (2010). “Technical change and industrial dynamics as evolutionary processes.” In B. H. Hall and N. Rosenberg (eds) Handbook of the economics of innovation, Amsterdam: Elsevier.
Dosi, G., Pavitt K., and Soete L. (1990). The economics of technological change and international trade. Brighton: Harvester Wheatsheaf.
Dosi, G., Pereira, M., and Virgillito, M. E. (2016). “On the robustness of the fat-tailed distribution of firm growth rates: a global sensitivity analysis.” Mimeo.
Dunning, J. H. (1988). “The eclectic paradigm of international production: a restatement and some possible extensions.” Journal of international business studies, 19: 1-31.
Dunning, J. H. (1993). Multinational enterprises and the global economy. Wokingham, Berkshire: Addison Wesley.
Dunning, J. H. (1995). “Reappraising the eclectic paradigm in the age of alliance capitalism.” Journal of International Business Studies, 26: 461–491.
Dunning, J. H. and Narula, R. (1995). “The R&D activities of foreign firms in the United States.” International Studies of Management & Organization, 25: 39-74.
Enthorf, H. and Pohlmeier, W. (1990). “Employment, innovation and export activities.” In J.P. Florens (ed), Microeconometrics: surveys and applications, London: Basil Blackwell.
Ethier, W. (1979). “Internationally decreasing costs and world trade.” Journal of International Economics, 9: 1-24.
Ethier, W. (1982). “National and international returns to scale in the modern theory of international trade.” American Economic Review, 72: 389-405.
Fagerberg, J. (1988). “International competitiveness.” The Economic Journal, 98: 355-374.
45

Faini, R. and Sapir, A. (2005). “Un modello obsoleto? Crescita e specializzazione del modello italiano”, in T. Boeri, R. Faini, A. Ichino, G. Pisauro, and C. Scarpa (eds), Oltre il declino, Bologna: Il Mulino.
Fana, M., Guarascio, D. and Cirillo, V. (2016). “Did Italy Need More Labour Flexibility?” Intereconomics, 51: 79-86.
Feenstra, R. and Hanson, G. (2001). “Global production sharing and rising inequality: a survey of trade and wages.” NBER Working Paper No.8372.
Feltrinelli, E., Gabriele, R. and Trento, S. (2013). “Do middle managers matter?” DEM Discussion Papers 2013/11, Department of Economics and Management.
Ferragina, A. M. and Quintieri, B. (2000). “Caratteristiche delle imprese esportatrici italiane. Un'analisi sui dati Mediocredito e Federmeccanica” Istituto Nazionale per il Commercio Estero-ICE-Rome (Italy).
Findlay, R. (1978). “Relative backwardness, direct foreign investment, and the transfer of technology: a simple dynamic model.” The Quarterly Journal of Economics, 92: 1-16.
Foster, N., Stehrer, R. and Timmer, M. (2013). “International fragmentation of production, trade and growth: impacts and prospects for EU member states” The Vienna Institute for International Economic Studies Research Report No. 387.
Freeman, C. and Louca, F. (2001). As time goes by: from the industrial revolutions to the information revolution. Oxford: Oxford University Press.
Garicano, L. and Rossi-Hansberg, E. (2015). “Knowledge-based hierarchies: using organizations to understand the economy.” Annual Review of Economics, 7: 1-30.
Gereffi, G., Humphrey, J. and Kaplinsky R. (2001). “Introduction: globalisation, value chains and development.” IDS Bulletin, 32: 1-8.
Giordano, C. and Zollino, F. (2015). “Exploring price and non-price determinants of trade flows in the largest euro-area countries” ECB Working Paper Series No.1789.
Giordano, R., Lanau, S., Tommasino, P. and Topalova, P. B. (2015). “Does public sector inefficiency constrain firm productivity: evidence from Italian provinces.” IMF Working Paper series No. 15/168.
Giordano, R., and Tommasino, P. (2013). “Public-sector efficiency and political culture.” FinanzArchiv: Public Finance Analysis, 69: 289-316.
Giunta, A., Nifo, A. and Scalera, D. (2012) “Subcontracting in Italian industry: labour division, firm growth and the North-South divide.” Regional Studies, 46: 1067-1083.
Gomes-Casseres, B. (1989). “Ownership structures of foreign subsidiaries: theory and evidence.” Journal of Economic Behavior & Organization, 11: 1-25.
Gopinath, G., Kalemli-Özcan, Ş., Karabarbounis, L., and Villegas-Sanchez, C. (2017). “Capital allocation and productivity in South Europe” The Quarterly Journal of Economics, qjx024.
Granstrand, O., Håkanson, L., and Sjölander, S. (1993). “Internationalization of R&D—a survey of some recent research.” Research Policy, 22: 413-430.
46

Grazzi, M. and Moschella, D. (2016). “Small, young, and exporters: new evidence on the determinants of firm growth.” LEM-Working Paper series No.2016/07.
Grossman, M. and Helpman, E. (1990). “Trade, knowledge spillovers, and growth.” European Economic Review, 35: 517-526.
Grossman M. and Helpman E. (1991). “Trade, innovation and growth.” American Economic Review, 80: 86-91.
Grossman G. and Rossi-Hansberg E. (2008). “Trading tasks: a simple theory of offshoring.” American Economic Review, 98: 1978-1997.
Guarascio, D., Pianta, M., Bogliacino, F. and Luchese, M.(2015). “Business cycles, technology and exports.” Economia Politica: Journal of Analytical and Institutional Economics, 32: 167-200.
Guarascio, D., and Pianta, M. (2016). “The gains from technology: new products, exports and profits.” Economics of Innovation and New Technology, 1-26.
Guarascio, D., Pianta, M. and Bogliacino, F. (2016) “Export, R&D and new products. A model and a test on European industries.” Journal of Evolutionary Economics, 26: 869-905.
Hall, B. H. (2002). “The financing of research and development.” Oxford Review of Economic Policy, 18: 35-51.
Halpern, L., Koren., M. and Szeidl, A. (2015). “Imported inputs and productivity.” American Economic Review, 105: 3660-3703.
Hassan, F., Ottaviano, G.I.P. (2013). “Productivity in Italy: the Great Unlearning.” VoxEu, 14 December 2013.
Helpman, E., Melitz, M. J. and Yeaple, S. R. (2004). “Export versus FDI.” American Economic Review, 94: 300-316.
Hennart, J. F., and Larimo, J. (1998). “The impact of culture on the strategy of multinational enterprises: does national origin affect ownership decisions?.” Journal of International Business Studies, 29: 515-538.
Hirsch, S., and Bijaoui, I. (1985). “R&D intensity and export performance: a micro view.” Review of World Economics, 121: 238-251.
Hymer, S. H. (1960). The international operations of national firms: a study of direct foreign investment. Cambridge, MA: The MIT Press.
Ietto-Gillies, G. (1992). International production: trends, theories, effects. Oxford: Wiley-Blackwell.
Ijiri, Y. and Simon, H. A. (1977). Skew distributions and the sizes of business firms. Amsterdam: North Holland.
Italian Trade Agency (2016). L’Italia nell’economia internazionale. Rapporto ICE 2015-16. Rome: Italian Trade Agency.
47

Johanson, J. and Vahlne, J. E. (1977). “The internationalization process of the firm—a model of knowledge development and increasing foreign market commitments.” Journal of international business studies, 8: 23-32.
Jones, R. (1970). “The role of technology in the theory of international trade.” In R. Vernon (ed) The technology factor in international trade. New York: Columbia University Press.
Juncker, J. C., Tusk, D., Dijsselbloem, J., and Draghi, M. (2015). “Completing Europe's economic and monetary union.”
Kaldor, N. (1966). Causes of the slow rate of growth in the UK. Cambridge UK: Cambridge University Press.
Kaldor, N. (1970). “The case for regional policies.” Scottish Journal of Political Economy, 18: 337-348.
Kaldor, N. (1981). “The role of increasing returns, technological progress and cumulative causation in the theory of international trade and economic growth.” Economie Appliquée, 34: 593-617.
Kaplinsky, R., and Morris, M. (2001). A handbook for value chain research. Ottawa: IDRC.
Kasahara, H., and Lapham, B. (2013). “Productivity and the decision to import and export: theory and evidence.” Journal of International Economics, 89: 297-316.
Kasahara, H., and Rodrigue, J. (2008). “Does the use of imported intermediates increase productivity? Plant-level evidence.” Journal of Development Economics, 87: 106-118.
Kemp, M. and Wan, H. (1972). “The gains from free trade.” International Economic Review, 13: 509-522.
Krugman, P. (1979). “Increasing returns, monopolistic competition, and international trade.” Journal of International Economics, 9: 469-479.
Krugman, P. (1983). “New theories of trade among industrial countries.” American Economic Review, 73: 343-47.
Krugman, P. (1990). “Increasing returns and economic geography.” NBER Working Papers No. 3275.
Krugman, P. (1994). “Competitiveness: a dangerous obsession.” Foreign Affairs, 28-44.
Kumar, N., and Siddharthan, N. S. (1994). “Technology, firm size and export behaviour in developing countries: the case of Indian enterprises.” The Journal of Development Studies, 31: 289-309.
Lanau, S. and Topalova, P. (2016), “The impact of product market reforms on firms productivity in Italy.” IMF Working Paper No.16/119.
Landesmann, M., Leitner, S. and Stehrer, R. (2015). “Competitiveness of the European economy.” European Investment Bank Working Paper No.2015/01.
Landini, F. (2016). “Distortions in the process of firm selection during the Great Recession: a comparison across European countries.” LUISS School of European Political Economy Working Paper No. 2016/4.
48

Lanza A., Quintieri B. (eds) (2007). Eppur si muove. Come cambia l’export italiano. Soveria Mannelli: Rubbettino.
Larch, M. (2004). “Relegated to the league of laggards? Roots of Italy’s slow potential growth.” ECFIN Country Focus No. 1(8).
Lasagni, A., Nifo, A. and Vecchione, G. (2015). “Firm productivity and institutional quality: evidence from Italian industry.” Journal of Regional Science, 55: 774-800.
Levinsohn, J., and Petrin, A. (2003). “Estimating production functions using inputs to control for unobservables.” The Review of Economic Studies, 70: 317-341.
Lippi, F., and Schivardi, F. (2014). “Corporate Control and Executive Selection.” Quantitative Economics, 5: 417-456.
Lucchese, M., Nascia, L. and Pianta, M. (2016). “Industrial policy and technology in Italy.” Economia e Politica Industriale, 43: 233-260.
Lucchese, M. and Pianta, M. (2012). “Innovation and employment in economic cycles.” Comparative Economic Studies, 54: 341-359.
Lucidi, F., and Kleinknecht, A. (2009). “Little innovation, many jobs: an econometric analysis of the Italian labour productivity crisis.” Cambridge Journal of Economics, 34: 525-46.
Manasse, P. and Manfredi, T. (2014). “Wages, productivity, and employment in Italy: tales from a distorted labour market.” Vox EU. April, 19.
Markusen, J. R. (1989). “Trade in producer services and in other specialized intermediate inputs.” American Economic Review, 79: 85-95.
Markusen, J. R., and Melvin, J. R. (1981) “Trade, factor prices, and the gains from trade with increasing returns to scale.” Canadian Journal of Economics, 14: 450-469.
Mayer, P. and Ottaviano, G.I.P. (2007). “The happy few: the internationalisation of European firms” Bruegel Blueprint.
Mazzucato, M. (2015). The entrepreneurial state: Debunking public vs. private sector myths. London: Anthem Press.
Mazzucato, M., Cimoli, M., Dosi, G., Stiglitz, J., Landesmann, M., Pianta, M., Walz R. and Page, T. (2015). “Which industrial policy does Europe need?” Intereconomics: Review of European Economic Policy, 50: 120-155.
Melitz, M. J. (2003). “The impact of trade on intra‐industry reallocations and aggregate industry productivity.” Econometrica, 71: 1695-1725.
Melvin, J. R. (1969). “Increasing returns to scale as a determinant of trade.” The Canadian Journal of Economics, 2: 389-402.
Memedović, O., and Iapadre, L. (2010). “Industrial development and the dynamics of international specialization patterns.” United Nations Industrial Development Organization Working Paper No. 23/2009.
49

Minetti, R., and Zhu, S. C. (2011). “Credit constraints and firm export: microeconomic evidence from Italy.” Journal of International Economics, 83: 109-125.
Montemerlo, D. (2000). Il governo delle imprese familiari. Modelli e strumenti per gestire i rapporti tra proprietà e impresa. Milano: Egea.
Montemerlo, D. (2005). “La proprietà familiare: motore per la crescita o impianto frenante?” In G. Corbetta (ed) Capaci di crescere. L’impresa italiana e la sfida delle dimensione. Milano: Egea.
Mowery, D. (1988). International collaborative ventures in US manufacturing. Cambridge: Ballinger.
Narula, R. (2003). Globalisation and technology, Cambridge: Polity Press.
Nelson R. and Winter S. (1982). An evolutionary theory of economic change. Cambridge MA: The Belknap Press of Harvard University Press.
Nifo, A. and Vecchione, G. (2012). Migrazioni intellettuali e qualità delle istituzioni: il caso italiano. In M.R. Carillo (ed) Flussi migratori e capitale umano. Una prospettiva regionale. Roma: Carocci.
O’Connell, A. (2015). European crisis: a new tale of center–periphery relations in the world of financial liberalization/globalization? International Journal of Political Economy, 44: 174-195.
Oughton, C. (1997). “Competitiveness policy in the 1990s.” The Economic Journal, 107: 1486–1503.
Pasinetti L. (1981). Structural change and economic growth. Cambridge UK: Cambridge University Press.
Pellegrino, B., and Zingales, L. (2014). “Diagnosing the Italian Disease.” Chicago Booth Working Paper.
Pianta, M. (2001). “Innovation, demand and employment.” In P. Petit and L. Soete (eds) Technology and the future of European employment. Cheltenham: Edward Elgar.
Purvis, D. (1972). “Technology, trade and factor mobility.” The Economic Journal, 82: 991-999.
Ricardo, D. (1815). “An essay on the influence of a low price of corn on the profits of stock ; shewing the inexpediency of restrictions on importation: with remarks on Mr. Malthus' two last publications: ‘An inquiry into the nature and progress of rent’ and ‘The grounds of an opinion on the policy of restricting the importation of foreign corn’.” In P. Sraffa (ed). Works and correspondence of David Ricardo. Cambridge UK: Cambridge University Press, 1951.
Richardson, J. D. (1971). “Constant-market-shares analysis of export growth.” Journal of International Economics, 1: 227-239.
Roberts, M. J. and Tybout, J. R. (1997). “The decision to export in Colombia: an empirical model of entry with sunk costs.” American Economic Review, 87: 545-564.
Romer, P. (1986). “Increasing returns and long-run growth.” Journal of Political Economy, 94: 1002-1037.
Romer, P. (1990). “Are non convexities important for understanding growth?” American Economic Review, 80: 97-103.
50

Saliola, F. and Zanfei, A. (2009). “Multinational firms, global value chains and the organization of knowledge transfer.” Research Policy, 38: 369-381.
Saltari, E., and Travaglini, G. (2009). “The productivity slowdown puzzle. Technological and non-technological shocks in the labour market.” International Economic Journal, 23: 483-509.
Schank, T., Schnabel, C. and Wagner, J. (2007). “Do exporters really pay higher wages? First evidence from German linked employer–employee data.” Journal of International Economics, 72: 52-74.
Serti, F., Tomasi, C., and Zanfei, A. (2010) “Who trades with whom? Exploring the links between firms' international activities, skills, and wages.” Review of International Economics, 18: 951-971.
Simonazzi, A., Ginzburg, A. and Nocella, G. (2013). “Economic relations between Germany and southern Europe.” Cambridge Journal of Economics, 37: 653-675.
Smith, K. (2004). “Measuring Innovation.” In J. Fagerberg, D.C. Mowery, and R.R. Nelson (eds.). The Oxford handbook of innovation. Oxford: Oxford University Press.
Storm, S., and Naastepad, C. (2015). “Crisis and recovery in the German economy: the real lessons.” Structural Change and Economic Dynamics, 32: 11-24.
Sturgeon, T. J. (2001). “How do we define value chains and production networks?” IDS Bulletin, 32: 9-18.
Teece, D., and Pisano, G. (1994). “The dynamic capabilities of firms: an introduction.” Industrial and Corporate Change, 3: 537-556.
Thirlwall, A. and Vines, D. (1982). “The Harrod trade multiplier and the importance of export led growth.” Pakistan Journal of Applied Economics, 1: 1-21.
Tiffin, M. (2014). “European productivity, innovation and competitiveness: the case of Italy.” IMF Working Paper No. 14-79.
Timmer, M., Los, B., Stehrer, R. and Vries, J. G. (2013). “Fragmentation, incomes and jobs: an analysis of European competitiveness.” Economic Policy, 28: 613-661.
Verhoogen, E. (2008) “Trade, quality upgrading and wage inequality in the Mexican manufacturing sector.” The Quarterly Journal of Economics, 123: 489–530.
Wagner, J. (2007). “Exports and productivity: a survey of the evidence from firm‐level data.” The World Economy, 30: 60-82.
Wakelin, K. (1998). “Innovation and export behaviour at the firm level.” Research Policy, 26: 829-841.
Wooldridge, J. M. (2010). Econometric analysis of cross section and panel data. Cambridge MA: MIT press.
World Bank (1992). The East Asian miracle: economic growth and public policy. Washington, D.C.: World Bank
51

Zanfei, A. (2000). “Transnational firms and the changing organisation of innovative activities.” Cambridge Journal of Economics, 24: 515-542.
Zanfei, A. (2016). “Innovazione nei servizi pubblici e competitività del sistema paese.” In Musso, F., Zucchella, A., and Pissavino, P., Internazionalizzazione e oltre. Bari: Cacucci Editore.
52

9. ANNEX: TABLES
Table 9.1 Composition by size classes (manufacturing)
Source: Elaboration on Eurostat data. % of companies within the national population.
Employees: 0-9 10-19 20-49 50-249 250 or more
EU 28 82.9% 8.0% 5.1% 3.4% 0.8%
Germany 65.1% 17.4% 7.7% 7.8% 2.0%
Spain 84.1% 7.4% 5.5% 2.5% 0.4%
France 87.6% 5.4% 4.1% 2.4% 0.6%
Italy 82.9% 9.9% 4.8% 2.1% 0.3%
Table 9.2 Types of innovations by size classes and exporting status
Note: Data refer to firms belonging to industrial sectors. The types of innovation introduced are not mutually exclusively, i.e. a firm may have introduced a new product, a new process and a new set of organisational, managerial and marketing practices at the same time.
Source: MET sample survey, waves from 2008 to 2015 (pooled dataset).
Domestic (%) Exporters (%) Domestic (%) Exporters (%) Domestic (%) Exporters (%)
Micro 11.8 24.6 7.60 15.2 7.40 13.4
Small 18.6 33.6 16.9 24.5 16.3 22.6
Medium 20.0 43.0 18.1 33.1 21.9 31.1
Large 17.2 55.8 26.1 44.7 30.4 41.5
Total 12.6 29.2 8.60 19.8 8.40 17.9
Product innov ationOrganisational / managerial /
marketing innov ationProcess innov ation
Table 9.3 Composition of the MET database by firms’ size class.
2008 2009 2011 2013 2015
Micro (1-9) 38.4% 60.0% 61.6% 48.1% 46.9%
Small (10-49) 38.4% 26.0% 24.7% 33.6% 34.6%
Medium (50-249) 19.5% 10.5% 10.6% 13.5% 14.7%
Large (>250) 3.0% 3.5% 3.1% 4.8% 3.7%
Observ ations 24896 22340 25090 25000 23071
53

Table 9.4 Probability of export: baseline regression
Note: Pooled probit models (marginal effects). The dependent variable is the extensive margin of export (Export), a dummy variable identifying exporting companies. *, **, *** denote, respectively, significance at 10%, 5%, and 1% level. Robust standard errors in parentheses.
Source: yearly balance-sheet data (Cribis D&B) and MET surveys 2008, 2009, 2011, 2013, and 2015. All measures are defined in Appendix.
Dependent v ariable: Export
(1) (2) (3) (4) (5) (6)
Productiv ity 0.0151*** 0.0116*** 0.0167*** 0.0281*** 0.0208*** 0.0186***
(0.0016) (0.0016) (0.0022) (0.0022) (0.0046) (0.0056)
Size 0.0612*** 0.0464*** 0.0488*** 0.058*** 0.056*** 0.056***
(0.001) (0.001) (0.001) (0.001) (0.003) (0.003)
Age -0.001 0.001 -0.001 -0.003 -0.009** -0.0107***
(0.002) (0.002) (0.002) (0.002) (0.004) (0.004)
Capitalisation 0.0038*** 0.0035*** 0.0038*** 0.001 -0.006*** -0.006***
(0.001) (0.001) (0.001) (0.001) (0.002) (0.002)
Group 0.042*** 0.0325*** 0.0281*** 0.019*** 0.006 0.003
(0.005) (0.005) (0.005) (0.005) (0.008) (0.008)
Import 0.360*** 0.330*** 0.358*** 0.346*** 0.336*** 0.343***
(0.005) (0.005) (0.006) (0.006) (0.011) (0.011)
Innov ation -- 0.0558*** 0.0544*** 0.0531*** 0.0516*** 0.053***
-- (0.004) (0.004) (0.004) (0.007) (0.008)
R&D share -- 0.004*** 0.004*** 0.004*** 0.004*** 0.004***
-- (0.000) (0.000) (0.000) (0.000) (0.000)
Inv estment -- 0.0125*** 0.0123*** 0.0132*** 0.0100 0.009
-- (0.003) (0.004) (0.004) (0.007) (0.007)
Sales -- -- 0.001 -0.019*** -0.011* -0.010*
-- -- (0.002) (0.003) (0.005) (0.005)
Sales growth -- -- 0.004 0.0108** 0.017** 0.021**
-- -- (0.004) (0.004) (0.009) (0.009)
ROA -- -- 0.0109 0.028 -0.041 -0.023
-- -- (0.018) (0.019) (0.056) (0.056)
Vertical integration -- -- -- -0.253*** -0.222*** -0.232***
-- -- -- (0.011) (0.0325) (0.032)
Cost of labor -- -- -- -0.004 -0.074* -0.063
-- -- -- (0.004) (0.0404) (0.0404)
Lev erage -- -- -- -- -0.0272*** -0.027***
-- -- -- -- (0.004) (0.004)
Net acc. payable -- -- -- -- 0.112*** 0.111***
-- -- -- -- (0.0211) (0.0211)
Bank debt -- -- -- -- 0.102*** 0.107***
-- -- -- -- (0.024) (0.024)
Human capital -- -- -- -- -- 0.145***
-- -- -- -- -- (0.021)
Domestic network -- -- -- -- -- -0.031***
-- -- -- -- -- (0.007)
Constant -1.280*** -1.293*** -1.503*** -1.588*** -0.825*** -0.724***
(0.072) (0.073) (0.092) (0.092) (0.193) (0.195)
Controls
Region yes yes yes yes yes yes
Industry yes yes yes yes yes yes
Time yes yes yes yes yes yes
Mundlak no no no no no no
Observ ations 50242 50242 41757 41756 13420 13209
Pseudo R2 0.217 0.239 0.239 0.249 0.272 0.278
54
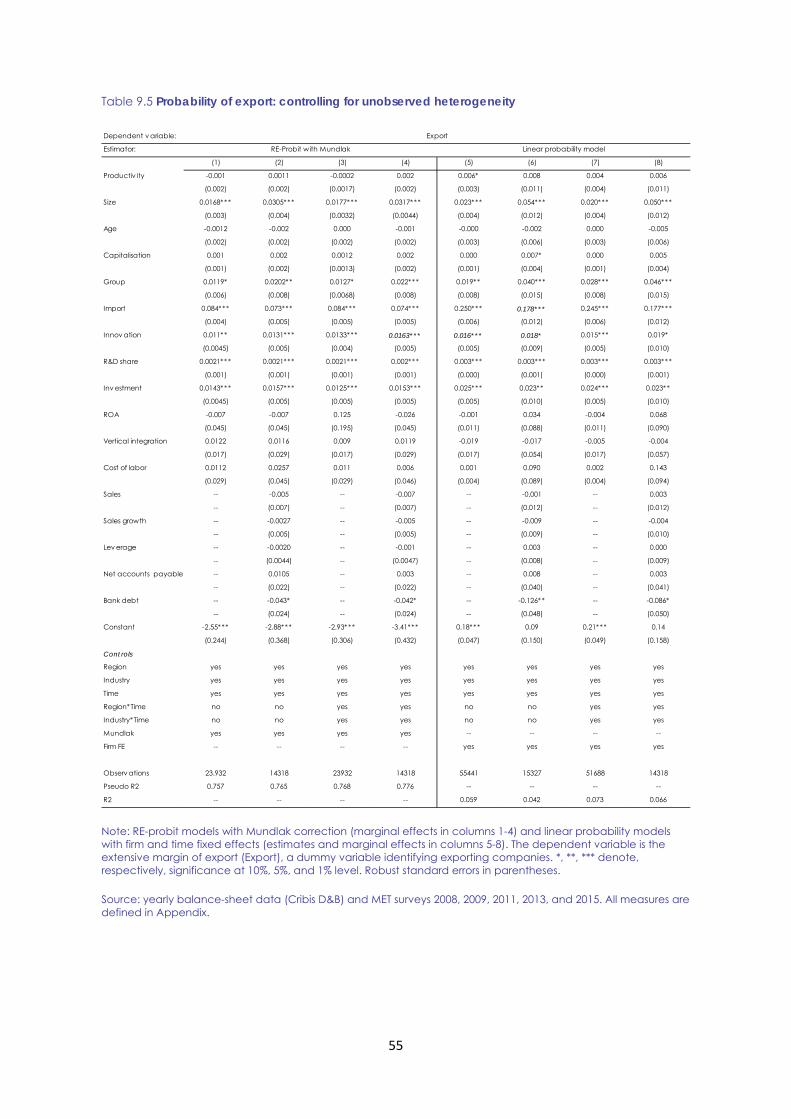
Table 9.5 Probability of export: controlling for unobserved heterogeneity
Note: RE-probit models with Mundlak correction (marginal effects in columns 1-4) and linear probability models with firm and time fixed effects (estimates and marginal effects in columns 5-8). The dependent variable is the extensive margin of export (Export), a dummy variable identifying exporting companies. *, **, *** denote, respectively, significance at 10%, 5%, and 1% level. Robust standard errors in parentheses.
Source: yearly balance-sheet data (Cribis D&B) and MET surveys 2008, 2009, 2011, 2013, and 2015. All measures are defined in Appendix.
Dependent v ariable:
Estimator:
(1) (2) (3) (4) (5) (6) (7) (8)
Productiv ity -0.001 0.0011 -0.0002 0.002 0.006* 0.008 0.004 0.006
(0.002) (0.002) (0.0017) (0.002) (0.003) (0.011) (0.004) (0.011)
Size 0.0168*** 0.0305*** 0.0177*** 0.0317*** 0.023*** 0.054*** 0.020*** 0.050***
(0.003) (0.004) (0.0032) (0.0044) (0.004) (0.012) (0.004) (0.012)
Age -0.0012 -0.002 0.000 -0.001 -0.000 -0.002 0.000 -0.005
(0.002) (0.002) (0.002) (0.002) (0.003) (0.006) (0.003) (0.006)
Capitalisation 0.001 0.002 0.0012 0.002 0.000 0.007* 0.000 0.005
(0.001) (0.002) (0.0013) (0.002) (0.001) (0.004) (0.001) (0.004)
Group 0.0119* 0.0202** 0.0127* 0.022*** 0.019** 0.040*** 0.028*** 0.046***
(0.006) (0.008) (0.0068) (0.008) (0.008) (0.015) (0.008) (0.015)
Import 0.084*** 0.073*** 0.084*** 0.074*** 0.250*** 0.178*** 0.245*** 0.177***
(0.004) (0.005) (0.005) (0.005) (0.006) (0.012) (0.006) (0.012)
Innov ation 0.011** 0.0131*** 0.0133*** 0.0163*** 0.016*** 0.018* 0.015*** 0.019*
(0.0045) (0.005) (0.004) (0.005) (0.005) (0.009) (0.005) (0.010)
R&D share 0.0021*** 0.0021*** 0.0021*** 0.002*** 0.003*** 0.003*** 0.003*** 0.003***
(0.001) (0.001) (0.001) (0.001) (0.000) (0.001) (0.000) (0.001)
Inv estment 0.0143*** 0.0157*** 0.0125*** 0.0153*** 0.025*** 0.023** 0.024*** 0.023**
(0.0045) (0.005) (0.005) (0.005) (0.005) (0.010) (0.005) (0.010)
ROA -0.007 -0.007 0.125 -0.026 -0.001 0.034 -0.004 0.068
(0.045) (0.045) (0.195) (0.045) (0.011) (0.088) (0.011) (0.090)
Vertical integration 0.0122 0.0116 0.009 0.0119 -0.019 -0.017 -0.005 -0.004
(0.017) (0.029) (0.017) (0.029) (0.017) (0.054) (0.017) (0.057)
Cost of labor 0.0112 0.0257 0.011 0.006 0.001 0.090 0.002 0.143
(0.029) (0.045) (0.029) (0.046) (0.004) (0.089) (0.004) (0.094)
Sales -- -0.005 -- -0.007 -- -0.001 -- 0.003
-- (0.007) -- (0.007) -- (0.012) -- (0.012)
Sales growth -- -0.0027 -- -0.005 -- -0.009 -- -0.004
-- (0.005) -- (0.005) -- (0.009) -- (0.010)
Lev erage -- -0.0020 -- -0.001 -- 0.003 -- 0.000
-- (0.0044) -- (0.0047) -- (0.008) -- (0.009)
Net accounts payable -- 0.0105 -- 0.003 -- 0.008 -- 0.003
-- (0.022) -- (0.022) -- (0.040) -- (0.041)
Bank debt -- -0.043* -- -0.042* -- -0.126** -- -0.086*
-- (0.024) -- (0.024) -- (0.048) -- (0.050)
Constant -2.55*** -2.88*** -2.93*** -3.41*** 0.18*** 0.09 0.21*** 0.14
(0.244) (0.368) (0.306) (0.432) (0.047) (0.150) (0.049) (0.158)
Controls
Region yes yes yes yes yes yes yes yes
Industry yes yes yes yes yes yes yes yes
Time yes yes yes yes yes yes yes yes
Region*Time no no yes yes no no yes yes
Industry*Time no no yes yes no no yes yes
Mundlak yes yes yes yes -- -- -- --
Firm FE -- -- -- -- yes yes yes yes
Observ ations 23.932 14318 23932 14318 55441 15327 51688 14318
Pseudo R2 0.757 0.765 0.768 0.776 -- -- -- --
R2 -- -- -- -- 0.059 0.042 0.073 0.066
Export
RE-Probit with Mundlak Linear probability model
55

Table 9.6 Probability of export: previously non-exporting companies
Note: RE-probit models with Mundlak correction (marginal effects in colums 1 and 3), and linear probability models with firm and time fixed effects (estimates and marginal effects in columns 2 and 4). The dependent variable is the extensive margin of export (Export), a dummy variable identifying exporting companies. *, **, *** denote, respectively, significance at 10%, 5%, and 1% level. Robust standard errors in parentheses.
Source: yearly balance-sheet data (Cribis D&B) and MET surveys 2008, 2009, 2011, 2013, and 2015. Additional regressors (untabulated) follow the specification in Table 9.4. All measures are defined in Appendix.
Dependent v ariable:
(1) (2) (3) (4)
Innov ation 0.022*** 0.022*** 0.023*** 0.019***
(0.007) (0.006) (0.007) (0.006)
R&D share 0.002*** 0.002*** 0.002*** 0.003***
(0.001) (0.001) (0.001) (0.001)
Inv estment 0.0121* 0.008 0.010 0.009
(0.007) (0.006) (0.006) (0.006)
Productiv ity 0.0011 0.010** 0.002 0.006
(0.002) (0.004) (0.002) (0.004)
Size 0.018*** 0.018*** 0.019*** 0.015***
(0.004) (0.005) (0.004) (0.005)
Age -0.003 -0.001 -0.002 0.001
(0.004) (0.004) (0.004) (0.004)
Import 0.099*** 0.321*** 0.102*** 0.310***
(0.006) (0.011) (0.006) (0.011)
Constant -1.806*** -0.197*** -1.451*** -0.171***
(0.323) (0.052) (0.422) (0.053)
Controls
Region yes yes yes yes
Industry yes yes yes yes
Time yes yes yes yes
Region*Time no no yes yes
Industry*Time no no yes yes
Mundlak yes -- yes --
Firm FE -- yes -- yes
Observ ations 11599 32889 11599 30540
Pseudo R2 0.554 -- 0.582 --
R2 -- 0.124 -- 0.164
export
56

Table 9.7 Probability of export by geographical extension
Note: RE-probit models with Mundlak correction (marginal effects). The dependent variable is the extensive margin of export by maximum geographical extention. Export(EU) is a dummy variable identifying companies exporting (at most) in the EU area, while Export(extraEU) is a dummy variable identifying companies exporting in farer countries. The two dependent variables are defined to be mutually explusive. *, **, *** denote, respectively, significance at 10%, 5%, and 1% level. Robust standard errors in parentheses.
Source: yearly balance-sheet data (Cribis D&B) and MET surveys 2008, 2009, 2011, 2013, and 2015. Additional regressors (untabulated) follow the specification in Table 9.4. All measures are defined in Appendix.
Dependent v ariable:
Export(EU) Export(extraEU)
(1) (2)
Innov ation 0.010*** 0.021***
(0.002) (0.002)
R&D share 0.002*** 0.001***
(0.000) (0.000)
Inv estment 0.007*** 0.005**
(0.002) (0.002)
Constant -3.040*** -2.068***
(0.212) (0.213)
Controls
Region yes yes
Industry yes yes
Time yes yes
Region*Time yes yes
Industry*Time yes yes
Mundlak yes yes
Observ ations 14318 14318
Pseudo R2 0.795 0.749
57

Table 9.8 Upgrading dynamic strategies
Notes: RE-probit models with Mundlak correction (marginal effects in columns 1 and 2) and linear probability models with firm and time fixed effects (estimates and marginal effects in columns 3 and 4). Upgrading is the change in the number of dynamic strategies (Innovation, R&D, and Investment) between t-2 and t-1, with the support [-3,+3]. The dependent variable is the extensive margin of export (Export), a dummy variable identifying exporting companies. *, **, *** denote, respectively, significance at 10%, 5%, and 1% level. Robust standard errors in parentheses.
Source: yearly balance-sheet data (Cribis D&B) and MET surveys 2008, 2009, 2011, 2013, and 2015. All measures are defined in Appendix.
Dependent v ariable:
Estimator:
(1) (2) (3) (4)
Upgrading 0.046*** 0.048*** 0.078*** 0.075***
(0.004) (0.004) (0.007) (0.007)
Innov ation 0.0396*** 0.0441*** 0.063*** 0.062***
(0.006) (0.006) (0.010) (0.011)
R&D share 0.002*** 0.002*** 0.004*** 0.004***
(0.000) (0.000) (0.001) (0.001)
Inv estment 0.016*** 0.016*** 0.023** 0.023**
(0.005) (0.005) (0.010) (0.010)
Productiv ity 0.001 0.002 0.010 0.007
(0.002) (0.002) (0.011) (0.011)
Constant -3.050*** -3.619*** 0.061 0.115
(0.373) (0.439) (0.149) (0.157)
Controls
Region yes yes yes yes
Industry yes yes yes yes
Time yes yes yes yes
Region*Time no yes no yes
Industry*Time no yes no yes
Mundlak yes yes -- --
Firm FE -- -- yes yes
Observ ations 14318 14318 14318 14318
Pseudo R-squared 0.771 0.783 -- --
R-squared -- -- 0.055 0.077
Export
RE-Probit with Mundlak Linear probability model
58

Table 9.9 Probability of export: heterogeneities by innovation type
Notes: RE-probit models with Mundlak correction (marginal effects in columns 1 and 4) and linear probability models with firm and time fixed effects (estimates and marginal effects in columns 2 and 4). The dependent variable is the extensive margin of export (Export), a dummy variable identifying exporting companies. The left panel reports estimates performed on the entire sample, while the right panel refers to the subsample of previously-non-exporting companies in t-1. *, **, *** denote, respectively, significance at 10%, 5%, and 1% level. Robust standard errors in parentheses.
Source: yearly balance-sheet data (Cribis D&B) and MET surveys 2008, 2009, 2011, 2013, and 2015. Additional regressors (untabulated) follow the specification in Table 9.4. All measures are defined in Appendix.
Dependent v ariable:
Sample:
(1) (2) (3) (4)
R&D share 0.002*** 0.004*** 0.002*** 0.003***
(0.000) (0.000) (0.000) (0.001)
Product innov ation 0.0121*** 0.020*** 0.021*** 0.040***
(0.003) (0.006) (0.005) (0.008)
Process innov ation 0.007* 0.014* 0.007 0.005
(0.004) (0.007) (0.006) (0.009)
Organizational innov ation 0.006* 0.013** 0.009* 0.007
(0.003) (0.006) (0.005) (0.007)
Constant -3.023*** 0.227*** -1.623*** -0.167***
(0.192) (0.049) (0.270) (0.053)
Controls
Region yes yes yes yes
Industry yes yes yes yes
Time yes yes yes yes
Region*Time yes yes yes yes
Industry*Time yes yes yes yes
Mundlak yes -- yes --
Firm FE -- yes -- yes
Observ ations 56955 57375 30301 37370
Pseudo R-squared 0.762 -- 0.551 --
R-squared -- 0.033 -- 0.144
Entire Prev iously non exporting
Export
59

Table 9.10 Indirect effect of innovation on productivity
Notes: Within estimator with firm and time fixed effects (estimates and marginal effects). The dependent variable is the growth rate of productivity (value added per worker). In columns 3 and 4 the analysis is performed after matching techniques (Coarsened Exact Matching) identifying a subsample of companies with the same characteristics (size, age, ex ante productivity, region, sector, …) that only differ for the actual introduction of innovations (the treatment variable). Estimates in columns 3 and 4 are performed employing the matching weights. *, **, *** denote, respectively, significance at 10%, 5%, and 1% level. Robust standard errors in parentheses.
Source: yearly balance-sheet data (Cribis D&B) and MET surveys 2008, 2009, 2011, 2013, and 2015. Additional regressors (untabulated) follow the specification in Table 9.4. All measures are defined in Appendix.
Dependent v ariable:
Estimator:
(1) (2) (3) (4)
Innov ation 0.041** -- 0.233*** --
(0.019) -- (0.037) --
Product innov ation -- 0.011 -- 0.066
-- (0.016) -- (0.049)
Process innov ation -- 0.018* -- 0.155***
-- (0.007) -- (0.059)
Organizational innov ation -- 0.022** -- 0.133**
-- (0.007) -- (0.056)
Import 0.023** 0.022** 0.321*** 0.328***
(0.009) (0.009) (0.038) (0.038)
Constant -0.117 -0.117 10.476*** 10.491***
(0.101) (0.101) (0.019) (0.019)
Controls
Region yes yes yes yes
Industry yes yes yes yes
Time yes yes yes yes
Firm FE yes yes yes yes
Matching & weights -- -- yes yes
Observ ations 13.827 13.827 5.519 5.519
R-squared 0.033 0.034 0.021 0.023
Productiv ity growth
Within estimator Matching & Within estimator
60

Table 9.11 Innovation and export: simultaneous equation model
Notes: bivariate probit models with Mundlak correction (marginal effects). The top panel reports estimates from the export equation (untabulated regressors follow the specification in Table 9.4). The bottom panel presents the innovation equation. External and Internal R&D are dummy variables identifying companies outsourcing R&D or performing R&D internally. Creditworthiness is a synthetic proxy for firms’ creditworthiness computed as the first principal component of several financial characteristics that may affect a bank’s decision to lend (leverage, collateral availability, size, rollover risk, age). Prob(financial constraints) is the predicted probability of being financially constrained as computed in the following table (9.12). Rho is the estimated correlation of the error terms of the two equations. *, **, *** denote, respectively, significance at 10%, 5%, and 1% level. Robust standard errors in parentheses.
Source: yearly balance-sheet data (Cribis D&B) and MET surveys 2008, 2009, 2011, 2013, and 2015. All measures are defined in Appendix.
(1) (2)
Export equation:
Innov ation 0.493*** 0.504***
(0.020) (0.019)
R&D 0.003*** 0.002***
(0.000) (0.000)
Inv estment 0.029*** 0.022***
(0.007) (0.007)
Innovation equation:
External R&D 0.061*** 0.082***
(0.011) (0.012)
Internal R&D 0.247*** 0.273***
(0.009) (0.010)
Creditworthiness 0.016*** --
(0.005) --
Probability (financial constraints) -- -0.419***
-- (0.167)
Human capital 0.008 0.023
(0.017) (0.017)
Size 0.027*** 0.027***
(0.003) (0.003)
Productiv ity 0.013*** 0.0115***
(0.003) (0.003)
Capitalisation -0.001 0.001
(0.001) (0.001)
Age -0.008** -0.0259***
(0.003) (0.005)
Sales growth 0.018** 0.021**
(0.008) (0.008)
Local network 0.045*** 0.040***
(0.006) (0.006)
Group 0.050*** 0.044***
(0.008) (0.009)
Controls
Region yes yes
Industry yes yes
Time yes yes
Mundlak yes yes
Observ ations 20.684 20.684
Rho -0.641*** -0.641***
61

Table 9.12 Probability of being financially constrained
Notes: Probit model (marginal effects, in units of standard deviations in columns 1-2). The dependent variable is a direct measure of financial constraints (self reported) identifying firms having positive net-present-value projects that were not undertaken because of a lack of financial resources. Bank distance is the physical distance (log-Km) between the belonging province of a firm and the headquarter of its lending bank (in case of multiple banking relationships, an average has been applied). Bank size is the log of total assets of the lending bank. N banking relationships is the number of banking relationships in place. *, **, *** denote, respectively, significance at 10%, 5%, and 1% level. Robust standard errors in parentheses.
Source: yearly balance-sheet data (Cribis D&B) and MET surveys 2008, 2009, 2011, 2013, and 2015. All measures are defined in Appendix.
Dependent v ariable: Financial Constraints
(1)
Age -0.032***
(0.001)
Size -0.015***
(0.002)
Bank distance 0.0104***
(0.000)
Bank size 0.002**
(0.001)
Number of banking relationships 0.003***
(0.001)
Observ ations 73865
Pseudo R2 0.122
62

Table 9.13 Firms’ exit after 2011
Notes: RE-probit models with Mundlak correction (marginal effects). The dependent variable is a dummy measure identifying firms exiting the international markets after 2011 (Exit). *, **, *** denote, respectively, significance at 10%, 5%, and 1% level. Robust standard errors in parentheses.
Source: yearly balance-sheet data (Cribis D&B) and MET surveys 2011, 2013, and 2015. Additional regressors (untabulated) follow the specification in Table 9.4. All measures are defined in Appendix.
Dependent v ariable:
(1) (2)
Innov ation -- -0.085***
-- (0.011)
R&D share -- -0.001
-- (0.001)
Inv estment -- -0.047***
-- (0.010)
Productiv ity -0.014** -0.012**
(0.004) (0.005)
Size -0.056*** -0.043***
(0.002) (0.003)
Age -0.014*** -0.015**
(0.004) (0.006)
Import -0.0208*** -0.193***
(0.012) (0.014)
Constant -1.806*** -0.197***
(0.323) (0.052)
Controls
Region yes yes
Industry yes yes
Time yes yes
Region*Time no no
Industry*Time no no
Mundlak yes yes
Observ ations 4951 4951
Prseudo R2 0.540 0.541
Exit
63

Table 9.14 Intensive margins of export
Notes: within estimators with firm and time fixed effects (estimates and marginal effects). The dependent variable is the intensive margin of export defined as the share of exported sales on total turnover (Export share in columns, 1 and 2) or as the growth rate of exported value (Export sales growth, in columns 3 and 4). *, **, *** denote, respectively, significance at 10%, 5%, and 1% level. Robust standard errors in parentheses.
Source: yearly balance-sheet data (Cribis D&B) and MET surveys 2008, 2009, 2011, 2013, and 2015. Additional regressors (untabulated) follow the specification in Table 9.4. All measures are defined in Appendix.
Dependent v ariable:
(1) (2) (3) (4)
Productiv ity 0.450*** 0.454*** 0.038** 0.038**
(0.131) (0.131) (0.018) (0.018)
Size 1.255*** 1.258*** 0.035 0.035
(0.157) (0.157) (0.024) (0.024)
Age -0.095 -0.098 -0.049*** -0.049***
(0.102) (0.102) (0.014) (0.014)
R&D share 0.107*** 0.102*** 0.007*** 0.007***
(0.016) (0.016) (0.001) (0.001)
Innov ation 0.584*** -- 0.083*** --
(0.187) -- (0.019) --
Product innov ation -- 0.956*** -- 0.061***
-- (0.235) -- (0.023)
Process innov ation -- 0.028 -- 0.012
-- (0.262) -- (0.026)
Organizational Innov ation -- 0.408* -- 0.040*
-- (0.223) -- (0.023)
Export sales -- -- -0.434*** -0.434***
-- -- (0.013) (0.013)
Constant 4.701*** 4.541** 7.213*** 7.211***
(1.778) (1.778) (0.571) (0.572)
Controls
Region yes yes yes yes
Industry yes yes yes yes
Time yes yes yes yes
Region*Time yes yes yes yes
Industry*Time yes yes yes yes
Firm FE yes yes yes yes
Observ ations 67108 67108 16954 16954
R2 0.008 0.009 0.184 0.184
Export sales growthExport share
64

Table 9.15 Cumulative effects of dynamic strategies: innovation with or without R&D
Notes: RE-probit models with Mundlak correction (marginal effects in columns 1 and 2) and within estimator with firm and time fixed effects (estimates and marginal effects in columns 3, 4, and 5). The dependent variable is the extensive margin of export (Export), a dummy variable identifying exporting companies in columns 1 to 4, or the growth rate of exported value (Export sales growth in column 5). Innovation with or without R&D are dummy variables identifying innovative firms performing or not performing R&D activity. *, **, *** denote, respectively, significance at 10%, 5%, and 1% level. Robust standard errors in parentheses.
Source: yearly balance-sheet data (Cribis D&B) and MET surveys 2008, 2009, 2011, 2013, and 2015. All measures are defined in Appendix.
Dependent v ariable: Export sales growth
Estimator: Within estimator
(1) (2) (3) (4) (5)
Innov ation with R&D 0.036*** 0.041*** 0.055*** 0.055*** 0.117***
(0.004) (0.007) (0.009) (0.013) (0.027)
Innov ation without R&D 0.010*** 0.017*** 0.017*** 0.025*** 0.066***
(0.003) (0.004) (0.006) (0.006) (0.021)
R&D share 0.002*** 0.002*** 0.003*** 0.003*** 0.006***
(0.000) (0.000) (0.000) (0.001) (0.002)
Productiv ity 0.001 0.002 0.004 0.004 0.038**
(0.001) (0.001) (0.004) (0.004) (0.018)
Constant -3.021*** -1.657*** 0.228*** -0.169*** 7.214***
(0.193) (0.270) (0.049) (0.053) (0.571)
Controls
Region yes yes yes yes yes
Indust ry yes yes yes yes yes
Time yes yes yes yes yes
Region*Time no yes no yes yes
Industry*Time no yes no yes yes
Mundlak yes yes -- -- --
Firm FE -- -- yes yes yes
Observ ations 56955 30301 57375 37370 16954
Pseudo R2 0.764 0.776 -- -- --
R2 -- -- 0.033 0.144 0.184
Export
RE-Probit with Mundlak Linear probability model
65

Table 9.16 Marginal vs. large exporters
Notes: quantile regressions with Mundlak correction (estimates). The dependent variable is the intensive margin of export defined as the share of exported sales on total turnover (Export share). The estimation is performed on the subsample of exporters only. Additional regressors (untabulated) follow the specification in Table 9.4. *, **, *** denote, respectively, significance at 10%, 5%, and 1% level. Robust standard errors in parentheses.
Source: yearly balance-sheet data (Cribis D&B) and MET surveys 2008, 2009, 2011, 2013, and 2015. All measures are defined in Appendix.
Dependent v ariable:
Quantile: q10 q25 q50 q75 q90
(1) (2) (3) (4) (5)
R&D 0.047*** 0.077*** 0.118*** 0.174** 0.089
(0.009) (0.021) (0.035) (0.070) (0.084)
Innov ation 0.439*** 0.467*** 0.838*** 0.432 0.070
(0.127) (0.151) (0.292) (0.508) (0.880)
Productiv ity 0.414*** 0.536*** 1.906*** 2.502*** 2.544***
(0.059) (0.116) (0.214) (0.425) (0.378)
Size 0.869*** 1.215*** 4.329*** 4.651*** 3.423***
(0.066) (0.190) (0.107) (0.296) (0.301)
Constant -3.488*** 0.210 -4.836*** 20.253*** 54.684***
(0.685) -1477 -1851 -5256 -4880
Controls
Region yes yes yes yes yes
Indust ry yes yes yes yes yes
Time yes yes yes yes yes
Region*Time yes yes yes yes yes
Industry*Time yes yes yes yes yes
Mundlak yes yes yes yes yes
Observ ations 28016 28016 28016 28016 28016
Export share
66

Table 9.17 Disproportionate effects for less productive firms
Notes: RE-probit models with Mundlak correction (marginal effects in columns 1-2) and within estimator with firm and time fixed effects (estimates and marginal effects in columns 3-4). The dependent variable is the extensive margin of export (Export), a dummy variable identifying exporting companies in columns 1 and 2, or the growth rate of exported value (Export sales growth in columns 3 and 4). Medium-High or Low productivity are dummy variables identifying firms whose ex ante productivity is above or below the threshold (33rd or 25th percentile in columns 1 and 3, or 2 and 4, respectively) of the productivity distribution at the beginning of the sample. *, **, *** denote, respectively, significance at 10%, 5%, and 1% level. Robust standard errors in parentheses.
Source: yearly balance-sheet data (Cribis D&B) and MET surveys 2008, 2009, 2011, 2013, and 2015. All measures are defined in Appendix.
Dependent v ariable:
Estimator:
Threshold (percentile): 33rd 25th 33rd 25th
(1) (2) (3) (4)
Innov ation*Medium-High productiv ity 0.017*** 0.016*** 0.071*** 0.080***
(0.003) (0.003) (0.020) (0.020)
R&D share* Medium-High productiv ity 0.002*** 0.002*** 0.007*** 0.007***
(0.000) (0.000) (0.002) (0.002)
Innov ation*Low productiv ity 0.053*** 0.051*** 0.175*** 0.161***
(0.003) (0.003) (0.035) (0.041)
R&D share*Low productiv ity 0.004*** 0.004*** 0.012*** 0.011***
(0.000) (0.000) (0.004) (0.004)
Constant -3.164*** -3.174*** 6.992*** 6.968***
(0.240) (0.240) (0.588) (0.588)
Controls
Region yes yes yes yes
Industry yes yes yes yes
Time yes yes yes yes
Region*Time yes yes yes yes
Industry*Time yes yes yes yes
Mundlak yes yes -- --
Firm FE -- -- yes yes
Observ ations 37710 37710 16424 16424
Pseudo R2 0.767 0.767 -- --
R2 -- -- 0.206 0.205
Export Export sales growth
RE-Probit with Mundlak Within estimator
67

Table 9.18 Disproportionate effects for small firms
Notes: RE-probit models with Mundlak correction (estimates in columns 1-2) and within estimator with firm and time fixed effects (estimates and marginal effects in columns 3-4). The dependent variable is the extensive margin of export (Export), a dummy variable identifying exporting companies in columns 1 and 2, or the growth rate of exported value (Export sales growth in columns 3 and 4). Medium-Large or Small are dummy variables identifying firms whose ex ante size is above or below the threshold (33rd or 25th percentile in columns 1 and 3, or 2 and 4, respectively) of the size distribution at the beginning of the sample. *, **, *** denote, respectively, significance at 10%, 5%, and 1% level. Robust standard errors in parentheses.
Source: yearly balance-sheet data (Cribis D&B) and MET surveys 2008, 2009, 2011, 2013, and 2015. All measures are defined in Appendix.
Dependent v ariable:
Estimator:
Threshold (percentile): 33rd 25th 33rd 25th
(1) (2) (3) (4)
Innov ation* Medium-Large 0.0124*** 0.011*** 0.078*** 0.089***
(0.003) (0.003) (0.020) (0.019)
R&D share* Medium-Large 0.002*** 0.002*** 0.007*** 0.007***
(0.000) (0.000) (0.002) (0.002)
Innov ation*Small 0.0442*** 0.0481*** 0.219*** 0.141**
(0.003) (0.003) (0.049) (0.068)
R&D share*Small 0.003*** 0.003*** 0.024*** 0.030***
(0.000) (0.000) (0.007) (0.011)
Constant -3.115*** -3.110*** 7.017*** 7.002***
(0.212) (0.212) (0.588) (0.588)
Controls
Region yes yes yes yes
Industry yes yes yes yes
Time yes yes yes yes
Region*Time yes yes yes yes
Industry*Time yes yes yes yes
Mundlak yes yes -- --
Firm FE -- -- yes yes
Observ ations 45401 45401 16424 16424
Pseudo R2 0.759 0.759 -- --
R2 -- -- 0.206 0.205
Export Export sales growth
RE-Probit with Mundlak Within estimator
68

Table 9.19 Persistent vs. new exporters: differential performance
Notes: within estimator with firm and time fixed effects (estimates and marginal effects). The dependent variable is the value of exported products in logn (ln(exports) in column 1) or the growth rate of total sales between the average of 2008-11 and 2012-2015 (Total sales growth in column 2). New entrants is a dummy variable identifying companies that started export activity after 2011 (and were only domestic before). Persistently internationalised is a dummy measure identifying companies that were exporters throughout the entire time span. The sample varies across columns and is indicated in the second row. *, **, *** denote, respectively, significance at 10%, 5%, and 1% level. Robust standard errors in parentheses.
Source: yearly balance-sheet data (Cribis D&B) and MET surveys 2008, 2009, 2011, 2013, and 2015. Additional regressors (untabulated) follow the specification in Table 9.4. All measures are defined in Appendix.
Dependent v ariable: ln(exports) Total sales growth
Sample: Internationalized Entire
(1) (2)
New entrants -0.407*** 0.067***
(0.046) (0.020)
Persistently internationalized -- 0.022*
-- (0.012)
Constant 2.530*** -0.761***
(0.176) (0.067)
Controls
Region yes yes
Industry yes yes
Time yes yes
Region*Time yes yes
Industry*Time yes yes
Firm FE yes yes
Observ ations 9.627 19.003
R-squared 0.674 0.305
69

70
10. APPENDIX
Table 10.1 Variable definition
Variable Definition
Export Dummy v ariable for exporting companies
Export(EU) Dummy v ariable for companies exporting only in the EU area
Export(extraEU) Dummy v ariable for companies exporting beyond EU area
Export share Share of sales from exported products
Export sales Value of exported products
Export sales growth ln(export sales)
Two-way Dummy v ariable for two-way traders (exporting & importing)
Import Dummy v ariable for importers
FDI Dummy v ariable for firms with foreign direct inv estments
Production Dummy v ariable for firms with foreign production processes abroad
Productiv ity ln(v alue added / # employees)
Size ln(# employees)
Age ln(1 + age)
Capitalisation ln(physical capital / # employees)
Group Dummy v ariable for group membership
Innov ation Dummy v ariable for the introduction of innov ations (independently of the type)
Product innov ation Dummy v ariable for the introduction of product innov ations
Process innov ation Dummy v ariable for the introduction of process innov ations
Organisational innov ation Dummy v ariable for the introduction of organisational-managerial innov ations
R&D Dummy v ariable for the existence of R&D projects
R&D share Expenditure in R&D (as a share of sales)
Sales Sales / total assets
Sales growth ln(sales)
ROA Net income / total assets
Vertical integration Value added / total turnov er
Cost of labour Cost of labour / total cost of production
Lev erage Total assets / equity
Net accounts payable (Accounts payable - accounts receiv able) / total assets
Bank debt Bank debt / total assets
Human capital % of graduated employees (tertiary education)
Domestic network Dummy v ariable for local domestic relationships with other companies

EUROPEAN ECONOMY DISCUSSION PAPERS European Economy Discussion Papers can be accessed and downloaded free of charge from the following address: https://ec.europa.eu/info/publications/economic-and-financial-affairs-publications_en?field_eurovoc_taxonomy_target_id_selective=All&field_core_nal_countries_tid_selective=All&field_core_date_published_value[value][year]=All&field_core_tags_tid_i18n=22617. Titles published before July 2015 under the Economic Papers series can be accessed and downloaded free of charge from: http://ec.europa.eu/economy_finance/publications/economic_paper/index_en.htm.


GETTING IN TOUCH WITH THE EU In person All over the European Union there are hundreds of Europe Direct Information Centres. You can find the address of the centre nearest you at: http://europa.eu/contact. On the phone or by e-mail Europe Direct is a service that answers your questions about the European Union. You can contact this service:
• by freephone: 00 800 6 7 8 9 10 11 (certain operators may charge for these calls),
• at the following standard number: +32 22999696 or • by electronic mail via: http://europa.eu/contact.
FINDING INFORMATION ABOUT THE EU Online Information about the European Union in all the official languages of the EU is available on the Europa website at: http://europa.eu. EU Publications You can download or order free and priced EU publications from EU Bookshop at: http://publications.europa.eu/bookshop. Multiple copies of free publications may be obtained by contacting Europe Direct or your local information centre (see http://europa.eu/contact). EU law and related documents For access to legal information from the EU, including all EU law since 1951 in all the official language versions, go to EUR-Lex at: http://eur-lex.europa.eu. Open data from the EU The EU Open Data Portal (http://data.europa.eu/euodp/en/data) provides access to datasets from the EU. Data can be downloaded and reused for free, both for commercial and non-commercial purposes.
