firhan malik, phd - honors bsc. thesis - laurentian university (c) 2005
TRANSCRIPT

Trace elements in human hair of Sudbury-area residents: A correlation study
examining the effect of age, gender, natural hair colour, area of residence, and
health status and their relationship to metal content in hair through
the use of ICP-MS
By
Firhan A. Malik
An Undergraduate Thesis
submitted to the Department of Chemistry and Biochemistry, Laurentian University in
partial fulfillment for an Honours Bachelor of Science Degree in Biochemistry
Approved by Supervisor: ________________________________________ Second Reader: ________________________________________ Date: ________________________________________
© 2005
II
ABSTRACT
Hair analysis can be used to measure environment exposure over a long-term
period, or to study ailments like hypertension, heart disease, epilepsy and others. This
examines the metal content in hair and investigates some of the major factors that affect
the metal content in hair. Then using statistical correlation tests to investigate the
relationships of the factors to one another and affect the trace metal content in hair. 504
participants from Sudbury and the surrounding area provided hair samples from the nape
of the neck and completed questionnaires requiring information about their health status,
area of residence, nutrition, hair status, age, gender and other factors. The hair strands
were then digested and the metal content was measured by ICP-MS. It was found that
metal content was higher in females relative to males and it may be possible to track
these differences to biochemical changes such as menstruation. It was also found that
Mg, Cr, and Cu varied with age. Cr in hair correlated with prevalence of cancer, heart
disease and hypertension (p<0.01). Correlations were also found with respect to area of
residence and is it related to environmental exposure.

III
TABLE OF CONTENTS 1. INTRODUCTION .......................................................................................................... 1
1.1 Nickel ........................................................................................................................ 1 1.2 Arsenic ...................................................................................................................... 9 1.3 Chromium ............................................................................................................... 11 1.4 Zinc ......................................................................................................................... 13 1.5 Cadmium ................................................................................................................. 19 1.6 Iron .......................................................................................................................... 20 1.7 Vanadium ................................................................................................................ 21 1.8 Copper ..................................................................................................................... 23 1.9 Hypoxia and Nickel ................................................................................................ 24 1.10 Analysis of hair for trace elements and other uses ............................................... 26 1.11 ICP-MS ................................................................................................................. 32
2. OBJECTIVES ............................................................................................................... 34 3. METHOD ..................................................................................................................... 35
3.1 Preparation of the questionnaire ............................................................................. 35 3.2 Recruitment of participants ..................................................................................... 37 3.3 Sampling and Collection of Hair ............................................................................ 38 3.4 Questionnaire Data Entry ........................................................................................ 40 3.5 Preparation of Hair .................................................................................................. 41 3.6 Preparation of ICP-MS ........................................................................................... 43 3.7 Summary of Procedure ........................................................................................... 47
4. RESULTS ..................................................................................................................... 48 4.1 Statistical Analysis .................................................................................................. 48 4.2 Distribution Maps ................................................................................................... 55 4.3 Relationships and Links between Metals ................................................................ 81 4.4 The Effect of Residence on Metal Content ............................................................. 82 4.5 The Effect of Gender on Metal Content ................................................................. 87 4.6 The Effect of Natural Hair Color on Metal Content ............................................... 92 4.7 The Effect of Age on Metal Content ....................................................................... 95 4.8 Health Status and Metal Content in Hair ................................................................ 98
5. DISCUSSION ............................................................................................................. 100 6. CONCLUSIONS ......................................................................................................... 108 7. REFERENCES ........................................................................................................... 109

IV
LIST OF FIGURES AND TABLES Figure 1.1 Concentration of Ni in hair of female Sudbury residents as it relates to distance
from the Copper Cliff smelter (Goldsack et al. 1975). ............................................... 2 Figure 1.2 The toxic effects of Ni (Beyersmann 2002) ...................................................... 6 Figure 1.3 Transport of Ni (Oller 2002) ............................................................................. 7 Table 1.1 Selected nickel compounds and effects on the biological system. ..................... 8 Table 1.2 Summary of main deficiency and toxicity symtoms for Ni. ............................... 9 Figure 1.4 The toxic effects of arsenic (Beyersmann 2002). .............................................. 9 Figure 1.5 Activation of NF-κB under normal conditions (Abbas and Lictman 2003). ... 10 Figure 1.6 Effects of Cr on gene expression and transcription (Beyersmann 2002). ....... 13 Table 1.3 Summary of main deficiency and toxicity symptoms for Cr. ........................... 13 Figure 1.7 Role of Zn in the immune response. ................................................................ 15 Figure 1.8 Pathway for cell death during Zn deficiency (Fraker and King 2004). ........... 18 Table 1.4 Summary of main deficiency and toxicity symptoms for Zn. .......................... 18 Figure 1.9 Effects of Cd on gene expression and protection of cells (Beyersmann 2002 19 Table 1.5 Summary of main deficiency and toxicity symptoms for Fe. ........................... 21 Table 1.6 Symptoms of deficiency versus toxicity for Cu. ............................................... 23 Figure 1.10 Reduction in oxygen causes hypoxia (Alberts et al. 2002). .......................... 25 Figure 1.11 Suggested mechanisms for Ni-induced hypoxia. .......................................... 26 Figure 1.12 Schematic of an ICP-MS (Schilling and Kingsley 2004). ............................. 34 Figure 2 Suggested and proven factors which affect the metal content in hair. ............... 35 Figure 3.1 Demonstration of hair sample collection procedure. ....................................... 39 Figure 3.2 Demonstration of hair sample collection procedure (TFO Panorama special on
the hair study). .......................................................................................................... 40 Table 3.1 Digestions of BCR hair standard. This table shows the amount of hair standard
utilized in ten tubes. .................................................................................................. 43 Table 3.2 ICP-MS parameters utilized during sample runs (modified from Varian ICP-
MS Expert® v.1.1 b46) ............................................................................................. 44 Figure 3.3 Example of a calibration curve for Cu (Varian ICP-MS Expert® v.1.1 b46). 45 Figure 3.4 Example of a calibration curve for Ni (Varian ICP-MS Expert® v.1.1 b46) .. 46 Figure 3.5 Schematic of peak distribution for Pb (Varian ICP-MS Expert® v.1.1 b46) .. 47 Table 4.1 Mean, range and standard deviation for content of Ni, Cu, Fe, Zn, Cr and Pb in
human hair of all participants in the study. ............................................................... 49 Table 4.2 Mean and standard deviation for content of Ni, Cu, Fe and Zn in hair of human
females in the region of Sudbury, Ontario from 1975 (Goldsack et al. 1975). ........ 49 Figure 4.1 Frequency histogram for concentration of Ni (ppm or µg of metal / g of hair)
found in hair strands for all study participants (STATISTICA®).. ........................... 50 Figure 4.2 Frequency histogram for concentration of Cu (ppm or µg of metal /g of hair)
found in hair strands for all study participants (STATISTICA®). ............................ 51 Figure 4.3 Frequency histogram for concentration of Fe (ppm or µg of metal /g of hair)
found in hair strands for all study participants (STATISTICA®). ............................ 52 Figure 4.4 Frequency histogram for concentration of Zn (ppm or µg/g of hair) found in
hair strands for all study participants (STATISTICA®). .......................................... 53 Figure 4.5 Frequency histogram for concentration of Cr (ppm or µg/g of hair) found in
hair strands for all study participants (STATISTICA®). .......................................... 54
V
Figure 4.6 Frequency histogram for concentration of Pb (ppm or µg/g of hair) found in hair strands for all study participants (STATISTICA®). .......................................... 55
Table 4.3 Ranges for low, medium and high concentration values as represented on the distribution plots. ...................................................................................................... 57
Figure 4.7 Distribution plot of residence locations for study participants (Sudbury and surrounding area). ..................................................................................................... 60
Figure 4.8 Distribution plot of residence locations for study participants (Sudbury and surrounding area). ..................................................................................................... 61
Figure 4.9a Distribution plot of Cu concentrations found in hair samples relative to area of residence (Sudbury-area and Toronto) ................................................................. 62
Figure 4.9b Distribution plot of Cu concentrations found in hair samples relative to area of residence (Sudbury-area) ...................................................................................... 63
Figure 4.9c Distribution plot of Cu concentrations found in hair samples relative to area of residence (Sudbury core relative to Copper Cliff smelter) ................................... 64
Figure 4.10a Distribution plot of Fe concentrations found in hair samples relative to area of residence (Sudbury-area and Toronto) ................................................................. 65
Figure 4.10b Distribution plot of Fe concentrations found in hair samples relative to area of residence (Sudbury-area) ...................................................................................... 66
Figure 4.10c Distribution plot of Fe concentrations found in hair samples relative to area of residence (Sudbury core relative to Copper Cliff smelter) ................................... 67
Figure 4.11a Distribution plot of Zn concentrations found in hair samples relative to area of residence (Sudbury-area and Toronto) ................................................................. 68
Figure 4.11b Distribution plot of Fe concentrations found in hair samples relative to area of residence (Sudbury-area) ...................................................................................... 69
Figure 4.11c Distribution plot of Zn concentrations found in hair samples relative to area of residence (Sudbury core relative to Copper Cliff smelter) ................................... 70
Figure 4.12a Distribution plot of Cr concentrations found in hair samples relative to area of residence (Sudbury-area and Toronto) ................................................................. 71
Figure 4.12b Distribution plot of Cr concentrations found in hair samples relative to area of residence (Sudbury-area) ...................................................................................... 72
Figure 4.12c Distribution plot of Cr concentrations found in hair samples relative to area of residence (Sudbury core relative to Copper Cliff smelter) ................................... 73
Figure 4.13a Distribution plot of Pb concentrations found in hair samples relative to area of residence (Sudbury-area and Toronto) ................................................................. 74
Figure 4.13b Distribution plot of Pb concentrations found in hair samples relative to area of residence (Sudbury-area) ...................................................................................... 75
Figure 4.13c Distribution plot of Pb concentrations found in hair samples relative to area of residence (Sudbury core relative to Copper Cliff smelter) ................................... 76
Figure 4.14a Distribution plot of Ni concentrations found in hair samples relative to area of residence (Sudbury-area and Toronto) ................................................................. 77
Figure 4.14b Distribution plot of Cu concentrations found in hair samples relative to area of residence (Sudbury-area) ...................................................................................... 78
Figure 4.14c Distribution plot of Cu concentrations found in hair samples relative to area of residence (Sudbury core relative to Copper Cliff smelter) ................................... 79
Figure 4.14d Distribution plot of Ni concentration relative to standard deviation value (Sudbury core and Copper Cliff) .............................................................................. 80
VI
Table 4.4 Correlation matrix comparing concentrations of Ni with Cr, Fe, Cu, Zn and Pb in human hair samples .............................................................................................. 81
Figure 4.15 Tree diagram using Ward’s method and Pearson’s correlation for cluster analysis of correlation patterns (STATISTICA®). .................................................... 82
Table 4.5 Mean and standard deviation for six important metals found in the entire population of hair samples (N=504). ........................................................................ 83
Table 4.6 Mean and standard deviation for six important metals found in the hair samples of Azilda residents (n=6). ......................................................................................... 83
Table 4.7 Mean and standard deviation for six important metals found in the hair samples of Chelmsford residents (n=8). ................................................................................. 83
Table 4.8 Mean and standard deviation for six important metals found in the hair samples of Elliot Lake residents (n=22) ................................................................................. 84
Table 4.9 Mean and standard deviation for six important metals found in the hair samples of Sudbury residents (n=232). ................................................................................... 84
Table 4.10 Mean and standard deviation for six important metals found in the hair samples of Toronto-area residents (n=7) .................................................................. 84
Figure 4.16 The variation in metal content in hair samples of residents from Sudbury and surrounding communities (as percentage difference from population mean). ......... 86
Figure 4.17 The variation in metal content in hair samples of residents from communities relative to the mean values found in Sudbury residents (percentage difference from Sudbury mean). ......................................................................................................... 87
Table 4.11 Average amount of various metals in female hair samples for Sudbury residents (n=247). ..................................................................................................... 88
Table 4.12 Average amount of various metals in male hair samples for Sudbury residents (n=117). ..................................................................................................................... 88
Figure 4.18 Gender distribution of study participants (Sudbury core) ............................. 89 Figure 4.19 Trace metal content in females relative to males (Sudbury residents)
expressed as a percentage value of the population of participants mean. ................. 90 Figure 4.20 Trace metal content in females relative to males (Sudbury residents)
expressed as a percentage difference from the population of participants mean values. ....................................................................................................................... 91
Table 4.13 Average amount of various metals in Sudbury residents with natural black hair (n=26). ............................................................................................................... 92
Table 4.14 Average amount of various metals in Sudbury residents with natural brown hair (n=259). ............................................................................................................. 93
Table 4.15 Average amount of various metals in Sudbury residents with natural blonde hair (n=58) ................................................................................................................ 93
Table 4.16 Average amount of various metals in Sudbury residents with natural gray hair (n=8). ......................................................................................................................... 93
Table 4.17 Average amount of various metals in Sudbury residents with natural red hair (n=7). ......................................................................................................................... 93
Figure 4.21 Trace metal content in hair of Sudbury residents as it relates to natural hair natural as a percentage value of the population of total participants mean. ............. 94
Figure 4.22 Trace metal content in hair of Sudbury residents as it relates to natural hair color expressed as a percentage difference from the population of total participants mean. ......................................................................................................................... 95

VII
Table 4.18 Correlation analysis for the relationship between metal content in hair and age of person at p<0.01 (N=366). ............................................................................................ 96 Figure 4.23 Age distribution of study participants (Sudbury core) .................................. 97 Figure 5 Amount of dust emissions containing Cu and Ni from the Copper Cliff smelter
over the past 30 years (courtesy Dr. G. A. Spiers). ................................................ 102

1
1. INTRODUCTION
Sudbury contains an ore-body rich in several metals, such as iron, copper, nickel
and other. Although the effects of mining on the environment have been examined
several times over the past three decades, the relationship between exposure to mining-
related emissions and human health has been examined in less detail. This is perplexing
since the human body at its core is a large reservoir of minerals and a variety of different
metals and elements. All enzymes either directly or indirectly rely on minerals and
metals.
1.1 Nickel Nickel mining has occurred in the region for more than 100 years and as a result
of the emissions produced by various smelting operations, in the community, it has
increased the contact of metals with the soils and waters. Although the mining operations
have significantly reduced the amount of metals introduced into the environment though
pollution abatement controls, an extensive study has not been done to determine the
accumulation of these metals in the residents of Sudbury relative to areas where mining is
a smaller portion of the economical infrastructure.
In a study done approximately 30 years ago, it was found that residents in
Sudbury had a greater amount of metal contaminants relative to areas where mining was
non existent (Goldsack et al. 1975). Interestingly, the residents in the aforementioned
study were found to have a significantly higher amount of nickel in their hair. The closer
the residents lived to the major smelter stack the greater the concentration of nickel in

2
their hair (Figure 1.1). This early study used hair, since it provides an ideal biological
marker for nutrition and contamination.
Figure 1.1 Concentration of Ni in hair of female Sudbury residents as
it relates to distance from the Copper Cliff smelter (Goldsack et al.
1975). A total of 76 females contributed hair strands and were analyzed using AAS for
Ni content. A direct correlation between distance from the Copper Cliff smelter and Ni
content was found.
The study found the nickel was higher in residents of Sudbury by 10-fold in
contrast to a region where nickel mining is non existent (e.g., Southern United States).
Nickel contamination is of concern due to its potential carcinogenic activity.
When inhaled as nickel-oxide, in the form of dust, there has been evidence for
DISTANCE FROM SMELTER (KM)
3
development of lung cancer (Oller 2002). In fact, it has been found the nickel exposure
leads to the reduction of the tumor suppressor FHIT (Kowara et al 2004), which could
lead to tumor development. Moreover, due to a higher affinity for proteins than DNA,
nickel may interact with chromatin proteins leading to chromosomal aberrations
(Chakrabarti et al 1999). In excess, nickel may lead to altered immunity and reduced
thyroid function by counteracting the effect of Vitamin E.
Nickel is one of a few significant carcinogenic metals. The ability of nickel to act
as a carcinogen is primarily related to its ability to form DNA-protein cross-links
(Chakrabarti et al 2001, Chakrabarti et al 1999), which may lead to chromosomal
aberrations (Coen et al 2001). Nickel was suggested to exhibit its carcinogenetic nature
by forming reactive oxygen species (ROS) that leads to the formation of cancerous cells
(Shi et al 1995). Recent research has shown that toxic oxygen intermediates are not
formed by nickel (Salacinski and O’Brien 2000).
Although nickel has several negative features, it is an essential component of the
human body. For example, Ni exists in a synergistic relationship with Vitamin C which
aids in blood clotting and even the prevention of gallstones. Interestingly, when nickel
exists in the presence of Vitamin C, Ni’s toxic nature is reduced and the ability to create
potentially tumor-causing reactive oxygen species is reduced (Salacinski and O’Brien
2000). Additionally, nickel deficiencies have been linked to liver disease, hyperglycemia
and depression.
Normally, the human body contains approximately 10 mg of nickel, the majority
of which are found in RNA and DNA.
4
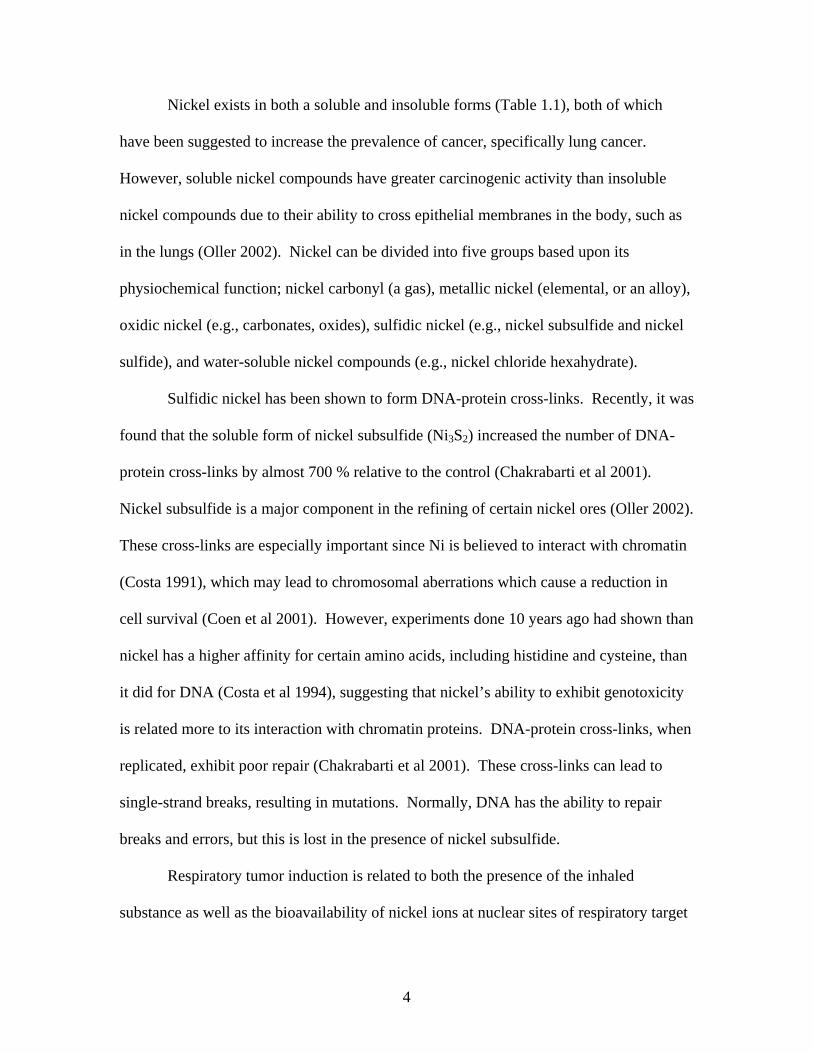
Nickel exists in both a soluble and insoluble forms (Table 1.1), both of which
have been suggested to increase the prevalence of cancer, specifically lung cancer.
However, soluble nickel compounds have greater carcinogenic activity than insoluble
nickel compounds due to their ability to cross epithelial membranes in the body, such as
in the lungs (Oller 2002). Nickel can be divided into five groups based upon its
physiochemical function; nickel carbonyl (a gas), metallic nickel (elemental, or an alloy),
oxidic nickel (e.g., carbonates, oxides), sulfidic nickel (e.g., nickel subsulfide and nickel
sulfide), and water-soluble nickel compounds (e.g., nickel chloride hexahydrate).
Sulfidic nickel has been shown to form DNA-protein cross-links. Recently, it was
found that the soluble form of nickel subsulfide (Ni3S2) increased the number of DNA-
protein cross-links by almost 700 % relative to the control (Chakrabarti et al 2001).
Nickel subsulfide is a major component in the refining of certain nickel ores (Oller 2002).
These cross-links are especially important since Ni is believed to interact with chromatin
(Costa 1991), which may lead to chromosomal aberrations which cause a reduction in
cell survival (Coen et al 2001). However, experiments done 10 years ago had shown than
nickel has a higher affinity for certain amino acids, including histidine and cysteine, than
it did for DNA (Costa et al 1994), suggesting that nickel’s ability to exhibit genotoxicity
is related more to its interaction with chromatin proteins. DNA-protein cross-links, when
replicated, exhibit poor repair (Chakrabarti et al 2001). These cross-links can lead to
single-strand breaks, resulting in mutations. Normally, DNA has the ability to repair
breaks and errors, but this is lost in the presence of nickel subsulfide.
Respiratory tumor induction is related to both the presence of the inhaled
substance as well as the bioavailability of nickel ions at nuclear sites of respiratory target

5
cells (Oller 2002). The bioavailability is primarily due to physical characteristics such as
size and texture, but the phagocytosis mechanism also plays a role. In fact, the particle
size will affect both the respiratory tract deposition and the uptake into target cells
(Abbracchio et al 1982).
The ability of nickel subsulfide to exhibit genotoxicity occurs when the
compound is present as a lung particle due to low solubility, ability to enter the epithelial
cells through phagocytosis, and finally ability to release a large amount of nickel ions
once inside the phagosomes (Oller 2002, Sen and Costa 1986, Costa and Mollenhauser
1980).
Nickel is believed to affect several genes, (Figure 1.2). One such gene encodes
for the transcription factor ATF-1 (Beyersmann 2002). ATF-1 is responsible for the
mobilization of calcium with its gene induced by nickel. This may cause higher
intracellular calcium levels, possibly leading to the activation of Protein Kinase C (PKC),
which will phosphorylate the molecules responsible for activation of the insulin receptor.
This may suggest either a role for nickel in hyperglycemia or possibly diabetes. ATF-1
is also involved in the apoptosis, or cell suicide, pathway of cells. (Jean et al 1998). To
cause these toxic effects Ni must first be transported across the epithelial layer of the
lungs. This occurs in either the crystalline or sulfide form due to the negative charge. It
is important to note that elemental Ni has little uptake because it is neutrally charged and
will not interact appreciably with cellular membranes. Once inside the cell it may be
transported to the nucleus where it causes fragmentation of heterochromatin, a type of
genetic material. Silencing of genes can also be induced. The health effects of various
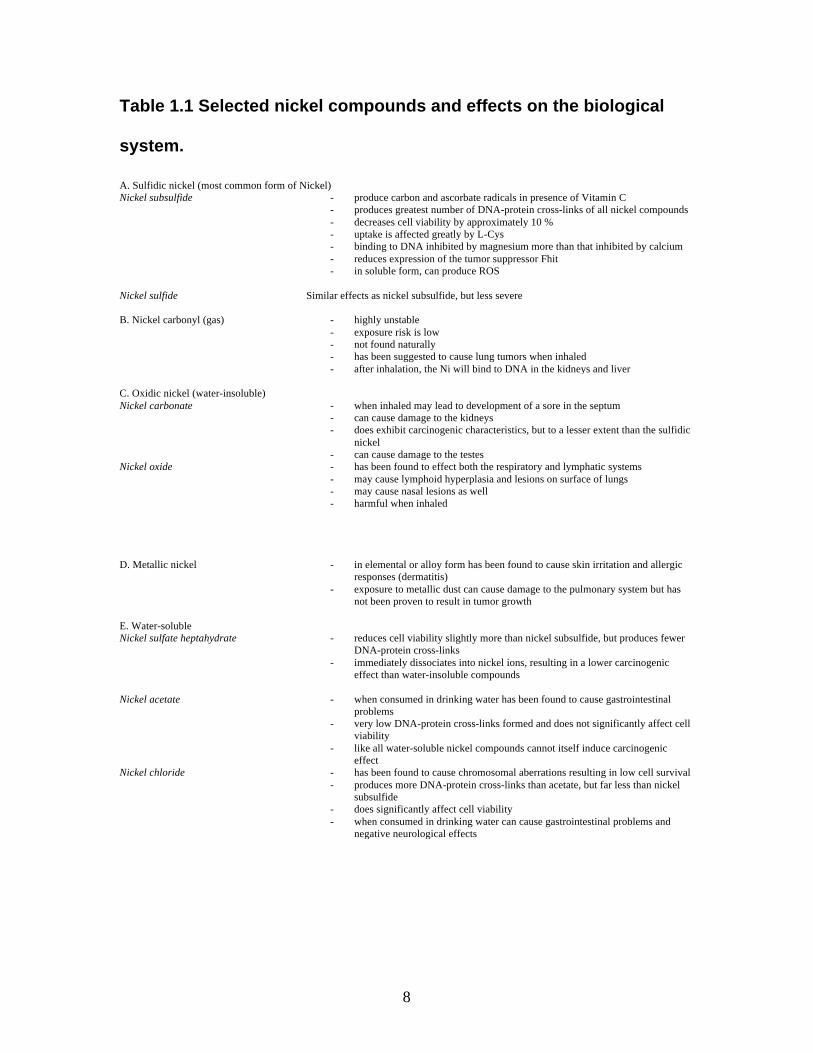
nickel compounds are summarized in Table 1.1.

6
Figure 1.2 The toxic effects of Ni (Beyersmann 2002. Ni can cause several
genes to be inactivated, induced or silenced. Of particular interest is cap43 which is
induced as part of hypoxic stress, which may lead to tumor growth.
7
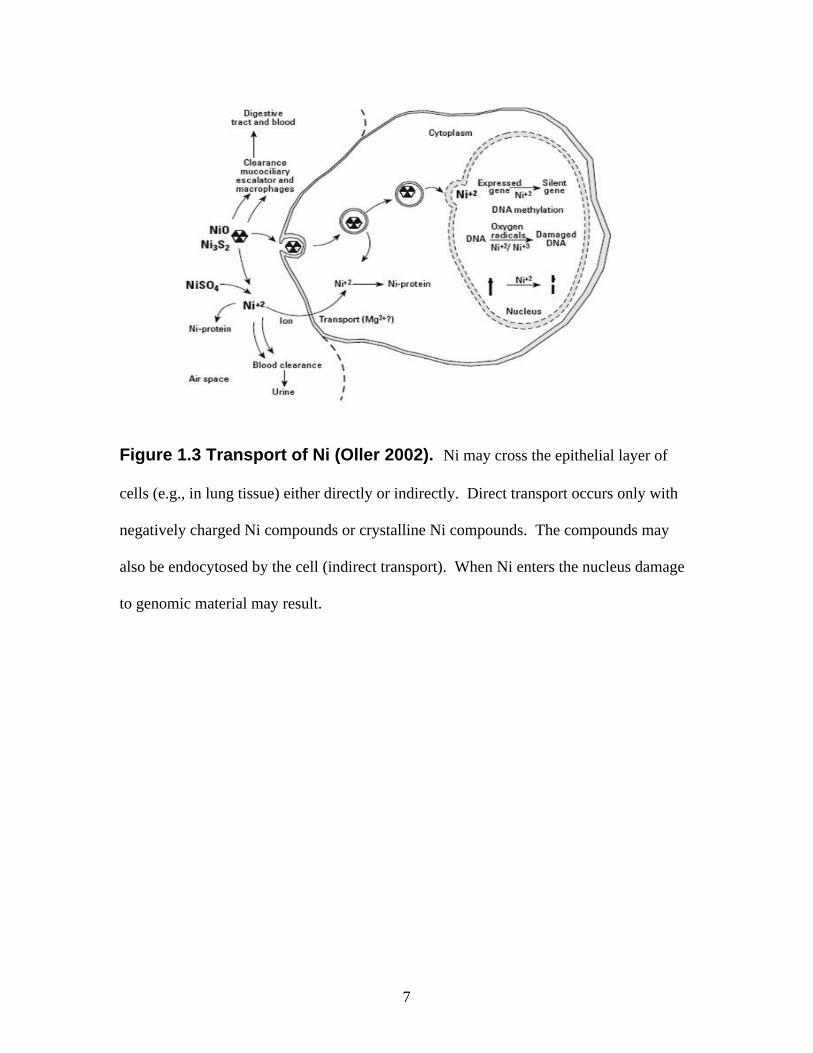
Figure 1.3 Transport of Ni (Oller 2002). Ni may cross the epithelial layer of
cells (e.g., in lung tissue) either directly or indirectly. Direct transport occurs only with
negatively charged Ni compounds or crystalline Ni compounds. The compounds may
also be endocytosed by the cell (indirect transport). When Ni enters the nucleus damage
to genomic material may result.
8
Table 1.1 Selected nickel compounds and effects on the biological
system.
A. Sulfidic nickel (most common form of Nickel) Nickel subsulfide - produce carbon and ascorbate radicals in presence of Vitamin C
- produces greatest number of DNA-protein cross-links of all nickel compounds - decreases cell viability by approximately 10 % - uptake is affected greatly by L-Cys - binding to DNA inhibited by magnesium more than that inhibited by calcium - reduces expression of the tumor suppressor Fhit - in soluble form, can produce ROS
Nickel sulfide Similar effects as nickel subsulfide, but less severe B. Nickel carbonyl (gas)
- highly unstable - exposure risk is low - not found naturally - has been suggested to cause lung tumors when inhaled - after inhalation, the Ni will bind to DNA in the kidneys and liver
C. Oxidic nickel (water-insoluble) Nickel carbonate - when inhaled may lead to development of a sore in the septum
- can cause damage to the kidneys - does exhibit carcinogenic characteristics, but to a lesser extent than the sulfidic
nickel - can cause damage to the testes
Nickel oxide - has been found to effect both the respiratory and lymphatic systems - may cause lymphoid hyperplasia and lesions on surface of lungs - may cause nasal lesions as well - harmful when inhaled
D. Metallic nickel
- in elemental or alloy form has been found to cause skin irritation and allergic responses (dermatitis)
- exposure to metallic dust can cause damage to the pulmonary system but has not been proven to result in tumor growth
E. Water-soluble Nickel sulfate heptahydrate - reduces cell viability slightly more than nickel subsulfide, but produces fewer
DNA-protein cross-links - immediately dissociates into nickel ions, resulting in a lower carcinogenic
effect than water-insoluble compounds
Nickel acetate - when consumed in drinking water has been found to cause gastrointestinal problems
- very low DNA-protein cross-links formed and does not significantly affect cell viability
- like all water-soluble nickel compounds cannot itself induce carcinogenic effect
Nickel chloride - has been found to cause chromosomal aberrations resulting in low cell survival - produces more DNA-protein cross-links than acetate, but far less than nickel
subsulfide - does significantly affect cell viability - when consumed in drinking water can cause gastrointestinal problems and
negative neurological effects
9
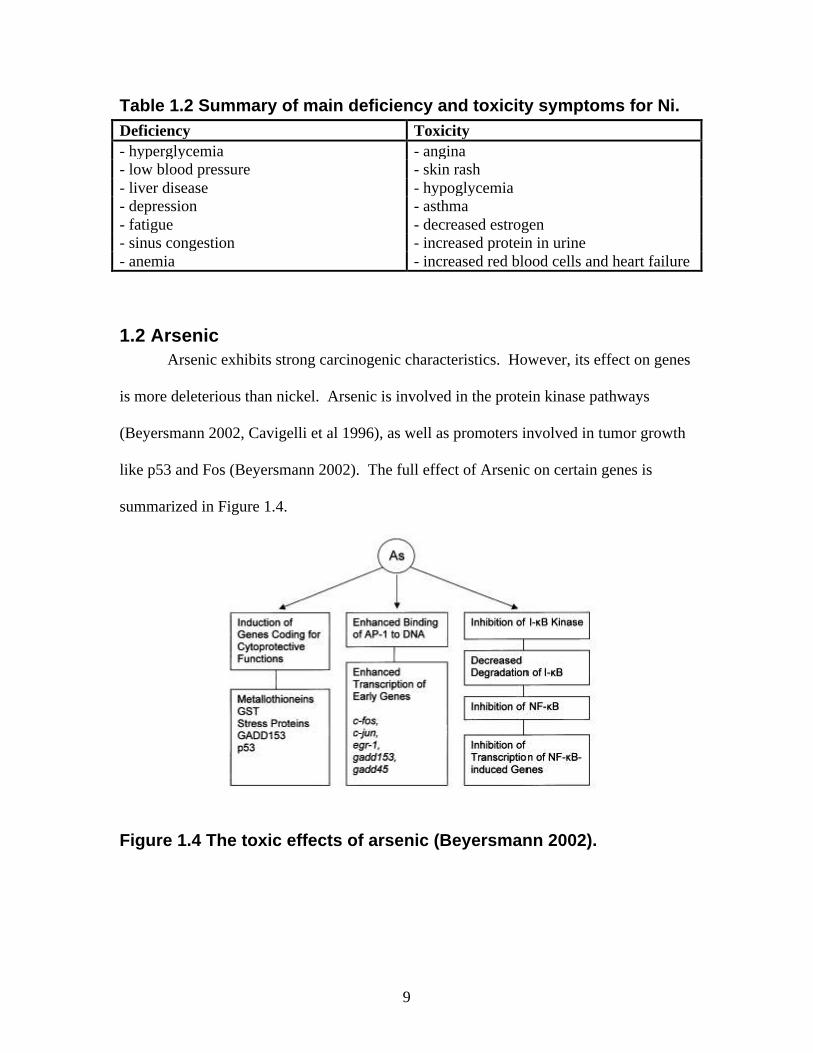
Table 1.2 Summary of main deficiency and toxicity symptoms for Ni. Deficiency Toxicity - hyperglycemia - angina - low blood pressure - skin rash - liver disease - hypoglycemia - depression - asthma - fatigue - decreased estrogen - sinus congestion - increased protein in urine - anemia - increased red blood cells and heart failure
1.2 Arsenic Arsenic exhibits strong carcinogenic characteristics. However, its effect on genes
is more deleterious than nickel. Arsenic is involved in the protein kinase pathways
(Beyersmann 2002, Cavigelli et al 1996), as well as promoters involved in tumor growth
like p53 and Fos (Beyersmann 2002). The full effect of Arsenic on certain genes is
summarized in Figure 1.4.
Figure 1.4 The toxic effects of arsenic (Beyersmann 2002).
10
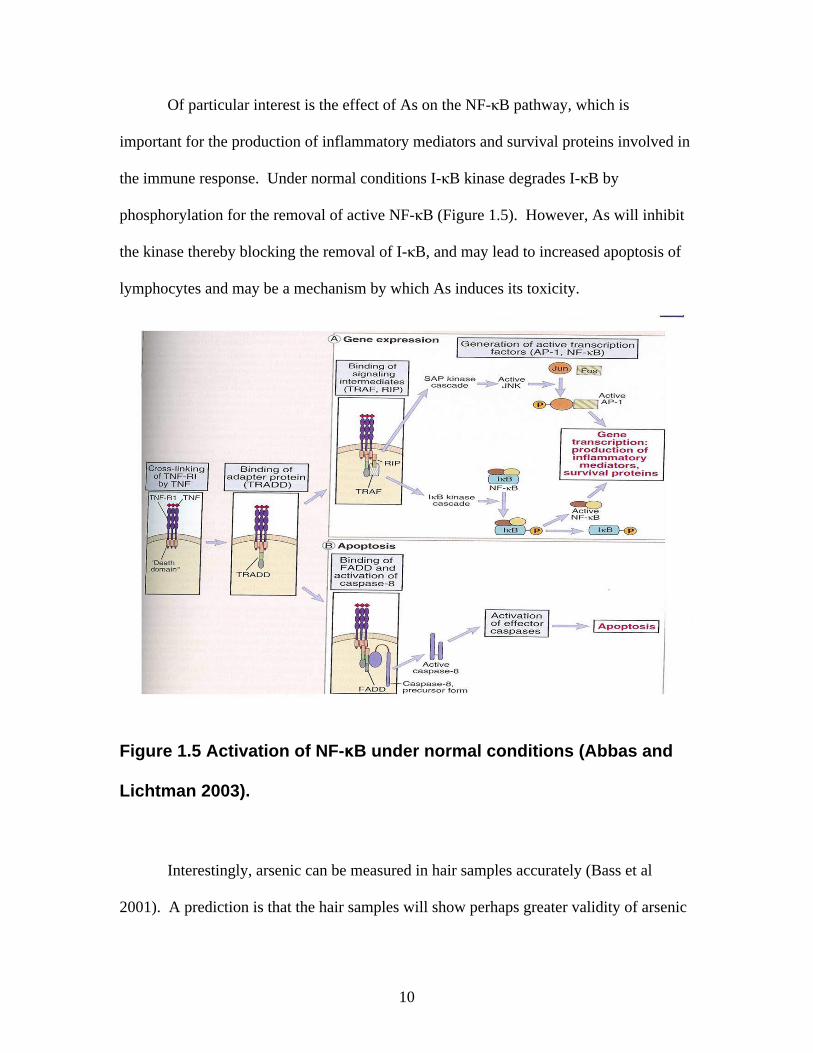
Of particular interest is the effect of As on the NF-κB pathway, which is
important for the production of inflammatory mediators and survival proteins involved in
the immune response. Under normal conditions I-κB kinase degrades I-κB by
phosphorylation for the removal of active NF-κB (Figure 1.5). However, As will inhibit
the kinase thereby blocking the removal of I-κB, and may lead to increased apoptosis of
lymphocytes and may be a mechanism by which As induces its toxicity.
Figure 1.5 Activation of NF-κB under normal conditions (Abbas and
Lichtman 2003).
Interestingly, arsenic can be measured in hair samples accurately (Bass et al
2001). A prediction is that the hair samples will show perhaps greater validity of arsenic

11
concentrations, since the element has accumulated over a longer period of time, providing
weight for the use hair analysis to measure chronic or long-term exposure.
Regardless of the analysis used, it would be of greater importance to measure the
concentrations of arsenic as an epidemiological study, and possibly relate the results to
cases of both skin and lung cancer.
1.3 Chromium
The normalization of elevated copper levels is accomplished by chromium, and in
supplementation studies it has been found to restore cartilage formation (Tang et al.
2003). Cr is mainly beneficial in its III oxidation state. The metal is further involved in
carbohydrate metabolism, and has also been found to regulate cholesterol levels. When
deficient such conditions as reduced glucose tolerance, impaired glucose metabolism, and
even nerve degeneration may occur. However, at high levels lymphatic swelling and
spinal degeneration may occur. The Zn/Cr ratio does have an apparent relationship with
coronary artery disease as well as hypertension (Tang et al 2003).
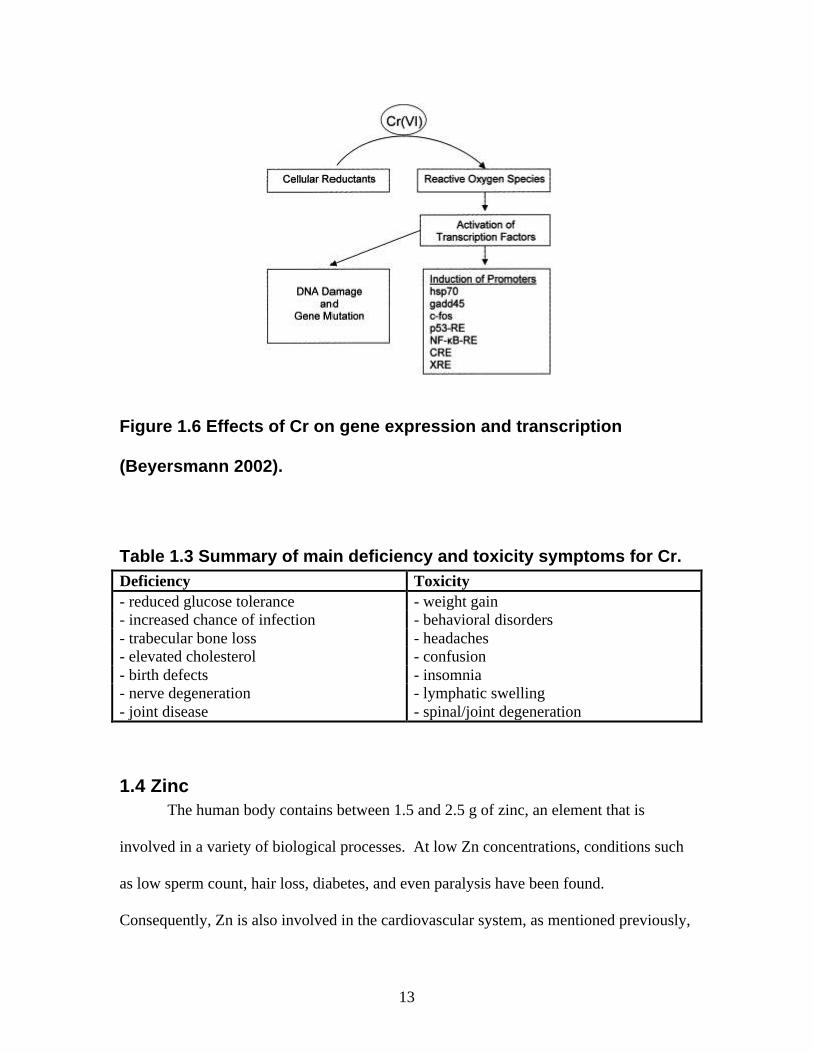
Chromium is also a carcinogen in the VI oxidation form (Beyersmann 2002), by
directly forming reactive oxygen species, leading to breaks in DNA, and has been found
to activate c-Fos, which is related to tumor growth (Tulley et al 2000). The full array of
genetic effects is shown in Figure 1.6. Moreover, the reactive oxygen species can also
cause severe damage to the DNA and to the cell. In fact, Cr (VI) will specifically induce
both proto-oncongenes (e.g., c-fos) and genes coding for detoxifying genes (e.g., heat
shock proteins). The activation of metallothionein promoters is the strongest for Cr
among all metals.

12
Cr is the only metal that can directly promote the formation of reactive oxygen
species by interacting with cellular reductants (Beyersmann 2002) shown in Figure 1.6.
Inflammatory responses can also be initiated by the activation of NF-κB, a transcription
factor which promotes survival of lymphocytes. Interestingly, NF-κB activation is
inhibited by As mentioned earlier. Cr can induce its effects in concentrations as low as 5-
10 µM. It has also been found that patients given stainless steel and cobalt chrome alloys
as implants can have metal poisoning (Doorn et al. 1996). These implants contain Cr
(VI), which has been found to cause cell death (Gunaratnam and Grant 2004).
Hepatocytes in primary culture exposed to a large amount of Cr (VI) showed significant
staining with phalloidin-FITC. This compound will only bind to phosphatidyl serine
(PS). Normally, due to asymmetric distribution of phospholipids in cellular membranes,
PS is found on the inner leaflet. During the induction of cell death, there is the
deactivation of an enzyme responsible for maintaining the asymmetry. This then causes
PS to move to the outer leaflet will it bind the phalloidin-FITC. The greater the
fluorescence, the greater the attachment, and the more significant the damage. Cr can be
measured with a high degree of precision (Bass et al. in 2001) where three measured
values (triplicate) were within 10 % standard deviation of the mean for the triplicate.
13
Figure 1.6 Effects of Cr on gene expression and transcription
(Beyersmann 2002).
Table 1.3 Summary of main deficiency and toxicity symptoms for Cr. Deficiency Toxicity - reduced glucose tolerance - weight gain - increased chance of infection - behavioral disorders - trabecular bone loss - headaches - elevated cholesterol - confusion - birth defects - insomnia - nerve degeneration - lymphatic swelling - joint disease - spinal/joint degeneration
1.4 Zinc The human body contains between 1.5 and 2.5 g of zinc, an element that is
involved in a variety of biological processes. At low Zn concentrations, conditions such
as low sperm count, hair loss, diabetes, and even paralysis have been found.
Consequently, Zn is also involved in the cardiovascular system, as mentioned previously,

14
its ratio with copper and chromium is an important mediator of both coronary disease and
hypertension. In fact, at low concentrations Zn has been implicated in hypertension.
Also, the zinc antagonist nickel has been found to prevent relaxation of coronary arteries
by selectively blocking the T-type calcium channels (Chen et al 2003) and has been
suggested to occur through direct effect on the smooth muscle (Chen et al 2003). This
suggests that not only is nickel an antagonist of zinc, but of calcium as well. At high
concentrations of zinc, conditions as mild as nausea and vomiting can excel to more
severe conditions like a weakened immune systems and greater susceptibility to cancer.
Additionally, zinc at optimal concentrations has been found to inhibit apoptosis
(Riley et al 2003) by serving as co-factor for enzymes involved in protection against free-
radical damage, and by inhibiting caspase-3 (Chai et al 1999). This may lead to a
possible therapeutic advantage, by inhibiting the amount of zinc it may be possible to
induce apoptosis in cancerous cells, which may be achieved using zinc antagonist like
nickel.
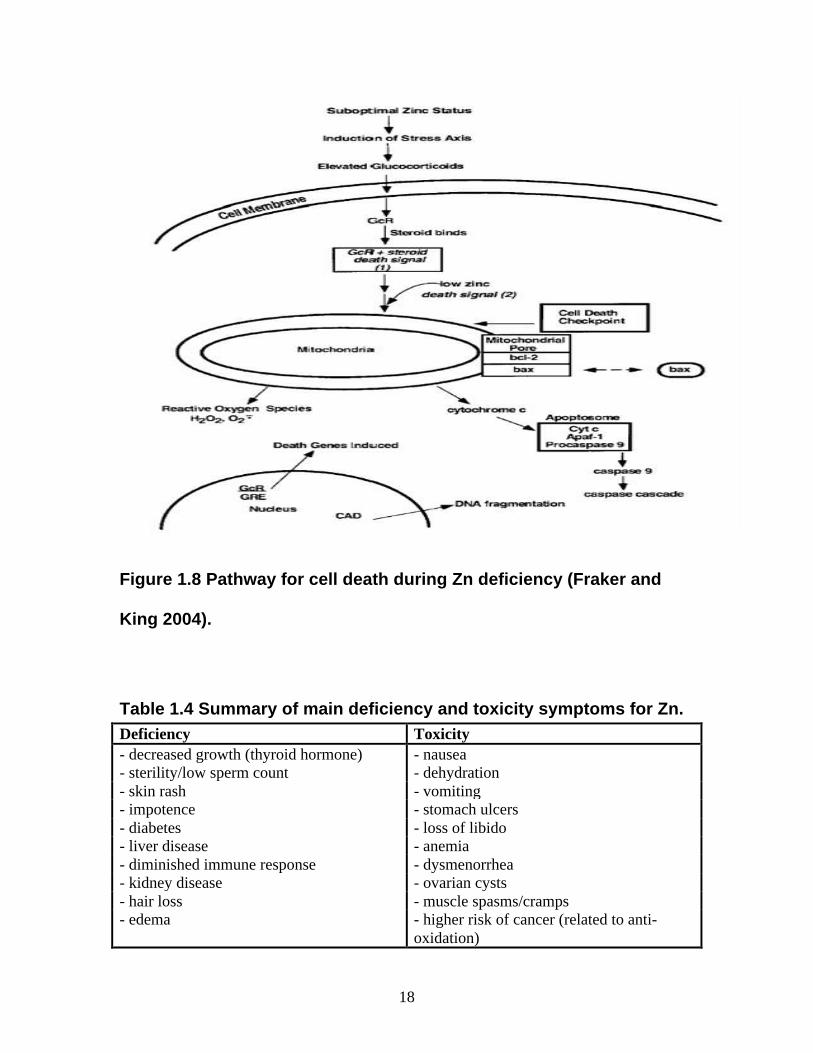
The role of Zn in the immune response (Figure 1.7) has been found to be related
to the ability to inhibit apoptosis of B and T-lymphocytes. During suboptimal zinc levels,
there is the induction of stress axis leading to an enhanced concentration of
glucocorticoids. The lipophilic compounds will then cross the lymphocyte cell
membrane binding to a receptor in the cytosol. The binding induces a death signal,
eventually leading to the release of cytochrome-c from the mitochondrial membrane
resulting in activation of caspases. In fact, the release of cytochrome-c is one of the
events which occur during apoptosis (Fraker and King 2004). This is shown in Figure
1.8. In other studies, mice fed a zinc deficient diet were found to have greater percent

15
apoptosis of both their pro and pre-T-lymphocytes (Salgueiro et al. 2000). Low Zn levels
have also been linked to the release of reactive oxygen species from the cell, further
causing damage. DNA cleavage occurs through the activation of caspase-activated
DNAse (CAD). Zn deficiency may also lead to an imbalance in T-helper cell (Th-1 and
Th-2) function.
Figure 1.7 Role of Zn in the immune response.
Zn has also been found to activate the thyroid hormone (Baltaci et al 2004).
Interestingly, incorrect functioning of thyroid hormone has been related to altered hair
growth, and possible hair loss (Credille et al 2001, Billoni et al 2000). More recent
research has shown that the hairless promoter gene in mice is regulated by thyroid
hormone (Engelhard and Christiano 2004). Moreover, a receptor of thyroid hormone
(β1) has been found to be specifically activated by the T3 thyroid hormone. When T3
binds to the receptor, present in the dermal papilla, it promotes both survival and growth
of hair follicles, in-vitro. This suggests a low Zn concentration decreases secretion of
Zn
Pro to Pre-Lymphocyte
Maturation of Lymphocytes
Inhibit apoptosis Erythropoiesis
Regulation of Delayed-type hypersensitivity

16
TSH, resulting in low plasma T3. Hence, there is less T3- β1 interaction resulting in
diminished hair follicle growth and survival.
There has also been evidence found that Zn deficiency leads to reduction in the
total food intake, in rats, resulting in symptoms similar to anorexia nervosa (Salgueiro et
al. 2000). Zn deficiency may lead to a lower secretion of neuropeptide Y, which is an
appetite stimulant (Browning et al. 1998), in the hypothalamus.
Zn plays a role in the synthesis and secretion of luteinizing hormone (LH) and
follicle stimulating hormone (FSH). In females, LH and FSH are involved in sex
characteristics, secretion of progesterone and estrogen, and formation of the corpus
luteum. In males, the two hormones play a role in secretion of testosterone and synthesis
of sperm. In fact, studies have shown that pregnant women on a Zn deficient diet had a
greater incidence of spontaneous abortion, prematurity or prolonged gestation (Salgueiro
et al. 2000).
Zn can act as an anti-oxidant by being a co-factor, along with copper, in the
superoxide dismutase (SOD) complex (Ho 2004). SOD acts to remove the superoxide
anion (O2-) preventing oxidative damage. Moreover, by being a component in zinc
fingers, Zn can help regulate the transcription of DNA (Ho 2004). Zn deficiency can lead
to activation of pro-apoptotic genes like p53, which play a role in tumor production.
Recent studies have examined a link between Zn deficiency and cancer
production. One possible link involves melatonin, an indole hormone secreted by the
pineal gland. In fact, one study found that mice fed a Zn-deficient diet had a lower
concentration of melatonin in their plasma; relative to those fed a Zn-adequate diet
(Baltaci et al. 2003). Conversely, supplementation with Zn leads to an increase in the

17
amount of melatonin. Melatonin has been found to decrease the risk of breast cancer, by
inducing an immunological response. This further emphasizes the role of Zn in the
immune response. Finally, mice given supplementation with either melatonin or Zn
survived for several months longer than mice given no supplements (Mocchegiani et al.
1998).
Zn, although not a carcinogen, has been found to cause epithelial damage to the
lungs (Riley et al 2003) by the ability to induce non-apoptotic, or oncotic, cell death.
Oncotic cell death was caused by a decrease in the metabolic activity of the cell, leading
to lowered production of ATP.
Elemental analysis in hair samples of Zn can be measured with a high degree of
precision (Bass et al 2001), suggesting a possible study that may be done relating the
levels of zinc with hair loss, with a standard deviation of approximately 2 % for a
triplicate run. Further research may lead to a possible commercial use for men who are
exhibiting baldness, but more importantly for patients who have undergone
chemotherapy.
18
Figure 1.8 Pathway for cell death during Zn deficiency (Fraker and
King 2004).
Table 1.4 Summary of main deficiency and toxicity symptoms for Zn. Deficiency Toxicity - decreased growth (thyroid hormone) - nausea - sterility/low sperm count - dehydration - skin rash - vomiting - impotence - stomach ulcers - diabetes - loss of libido - liver disease - anemia - diminished immune response - dysmenorrhea - kidney disease - ovarian cysts - hair loss - muscle spasms/cramps - edema - higher risk of cancer (related to anti-
oxidation)

19
1.5 Cadmium Cadmium (Cd) will induce two types of genes: (1) those that code for detoxifying
proteins (e.g., metallothionein); (2) proto-oncogenes (Beyersmann 2002). Cd is the
strongest inducer of metallothionein promoters. Cd has been found to affect calcium
homeostasis and inhibit DNA repair (Beyersmann 2002).
Cd is a toxic metal that is typically studied in terms of the ability to affect gene
expression (Beyersmann 2002). Cd has no important biological functions but can
interfere with the function of Zn by competing for binding sites. This suggests Cd has
the ability to inhibit enzymes and genes which rely on Zn. Typically a concentration
between 10-30 µM is required for it to induce toxic effects (Beyersmann 2002).
Figure 1.9 Effects of Cd on gene expression and protection of cells
(Beyersmann 2002).

20
1.6 Iron Iron (Fe) is one of the most important metals in the biological system, involved in
processes such as bone metabolism, red blood cell production and the immune response.
Interestingly, the level of stomach acidity is synergistic to the concentration of Fe.
Higher amounts of Fe will typically lead to an increase in acidity. Fe has been found to
interact with calcium, magnesium and zinc and forms a synergistic relationship with
nickel and vitamin C playing a role in the anti-oxidant action of both. The principal role
of Fe is to form heme, part of the hemoglobin complex used to carry oxygen by red blood
cells.
Research has also found that Fe deficiency can increase the toxicity of lead,
leading to anemia (Kwong et al. 2004). Fe deficiency will lead to increased expression of
DMT1, a divalent metal transporter also called nature-resistance associated macrophage
protein 2 (Nramp 2), causing an increased absorption of Pb.
Other studies have found that Fe-deficient mice had increased nickel absorption
(Salnikow et al. 2004), suggesting at first the two metals share the same absorptive
pathway but has now been disproved (Salnikow et al. 2004). Nickel has been found to
substitute for Fe in enzymes that regulate hypoxia, leading to their deactivation (Li et al.
2004). Moreover, excess nickel absorption leads to increased glycolysis causing an
accumulation of citrate. Citrate then chelates intracellular Fe and lead to the
disappearance of ferritin.
The effect of Fe on metabolic decrease is not as significant as other metals like
vanadium and nickel, suggesting at increasing concentrations it does not cause significant
cell damage relative to other metals (Riley et al. 2003), specifically with respect to
damage to the epithelial layer of the respiratory system suggesting that air borne Fe

21
particulate is less harmful to the body than vanadium and nickel, which may be due to
lung epithelial cells’ ability to sequester Fe by binding to ferritin (Riley et al. 2003).
Fe concentration has been found to be measured with good precision with a
standard deviation as low as 8 % between the individual sample and the mean for a
triplicate run (Bass et al. 2001).
Table 1.5 Summary of main deficiency and toxicity symptoms for Fe. Deficiency Toxicity - fatigue - hemochromatosis - anemia - heart disease - pale skin - high blood pressure - amenorrhea - fibroid tumors - learning difficulties - benign prostatic hypertrophy - Meniere’s disease - constipation - gastrointestinal disorders - migraine
1.7 Vanadium Vanadium (V) is another transition metal, in the same period as most of the other
metals mentioned. As the concentration of V increased, an experiment found there was a
significant decrease in the metabolic activity of lung epithelial cells in-vitro (Riley et al.
2003), but has been found to be counteracted with Zn. This suggests an antagonistic
relationship between V and Zn. Although V does exhibit toxic characteristics, studies are
now focused on the role of V in inhibition of diabetes and a possibility to act as an anti-
carcinogen (Mukherjee et al. 2004).
This metal has limited toxicity due to poor absorption in the gastrointestinal tract.
Once ingested, V is transformed into the cationic vanadyl form (VO2+). However, the
anionic form is absorbed in higher quantities (Mukherjee et al. 2004). In rats, the kidney,
spleen bone and liver have been known to accumulate high amounts of V.

22
The toxic effects of V are relatively minimal compared to other metals and
symptoms include local irritation of the eyes and respiratory tract (Guidotti et al. 1997).
Systemic effects are not seen. This is likely due to the poor absorption in the
gastrointestinal tract, as already mentioned.
Interestingly, V has been shown to decrease the level of fasting glucose in patients
with non-insulin dependant diabetes mellitus, when administrated as vandyl sulfate
(Boden et al. 1996).
When deficient there are lower levels of enzymes important for glycolysis and the
citric acid cycle (e.g., isocitrate dehydrogenase). This may manifest into physical
abnormalities like swollen tarsal joints and other skeletal deformations. Physiological
abnormalities include altered thyroid metabolisms and a decrease in the weight of the
thyroid gland severely affecting its role in the body. Other deficiency symptoms include
impairment of reproduction, retarded growth (related to the thyroid gland), lipid
metabolism disturbances, and inhibition of Na+/K+ ATPase activity in the kidney, brain
and in the heart (Mukherjee et al. 2004, Nriagu 1998).
V has been found to activate a variety of genes and proteins including tumor
necrosis factor-alpha (TNF-α), involved in the inflammatory response, Interleukin-8 (IL-
8), activator protein (AP-1), ras, and p70s6k (Jaspers et al. 1999, Ding et al. 1999).
Using analytical techniques (e.g., ICP-MS), V can be measured in hair with good
precision with a standard deviation of less than 5 % for a triplicate run (Bass et al. 2001).

23
1.8 Copper Copper (Cu) plays an important role in the anti-inflammatory reaction as a
component in the enzyme histaminase, responsible for breaking down histamine secreted
by eosinophils for control of allergies. As already mentioned, Cu plays a role in the
action of SOD along with Zn. Although present in all tissues, Cu is mainly stored in the
liver and is a co-factor in the enzyme which catalyzes the formation of hemoglobin.
Other enzymes in which Cu acts a co-factor include cytochrome oxidase (ATP
production), lysil oxidase (cross-links of collagen), tyrosinase (pigmentation due to
production of melanin), and dopamine-beta-hydroxylase (norepinephrine synthesis).
Toxic effects of Cu have been linked to angiogenesis, seen during hypoxia
discussed shortly. Other toxicity symptoms include depression, schizophrenia, arthritis,
and sleep disorders. Cu does form a synergistic relationship with calcium and potassium
(Beyersmann 2002).
High concentrations of Cu have been found to decrease metabolic activity of lung
epithelial cells, in-vitro, more significantly than Fe but less than V (Riley et al. 2003).
Moreover, Cu was also found to inhibit secretion of IL-6 in-vitro.
Cu can be measured in hair strands with good precision resulting in a standard
deviation of approximately 5 % for a triplicate run (Bass et al. 2001).
Table 1.6 Summary of deficiency versus toxicity symptoms for Cu. Deficiency Toxicity - anemia - Wilson’s disease - weakened immune response - ADHD - low activity of SOD - confusion - graying of hair - hemangioma - low white blood cell count - aneurysms - vascular degeneration - violent behavior - joint disease - abdominal pain
24
1.9 Hypoxia and Nickel Hypoxia (Figure 1.10) is a physiological event that occurs when the level of
oxygen in the blood drops. Under normal conditions, when there are adequate amounts
of oxygen, there is a low concentration of Hypoxia Inducible Factor-1 (HIF-1), a
transcription factor. However when the level of oxygen decreases the concentration of
HIF-1 increases leading to the secretion of Vascular Endothelial Growth Factor (VEGF),
causing angiogenesis. This leads to significant cellular damage if prolonged. In fact,
HIF-1 has been found to be over-expressed in patients with cancer of the breast, smooth
muscle and brain (Cangul et al. 2002).
Hypoxia selects for cells with enhanced glycolytic activity, an event seen during
tumor development. For example, increased glycolysis would lead to an increase in
lactic acid production (Warburg effect) causing cellular damage commonly seen in
tumors (Salnikow et al. 2003).
Ni has been found to lead to hypoxia-like symptoms specifically by inducing the
expression of HIF-1 and Cap43, a Ni-dependant hypoxia gene (Li et al. 2004). The
suggested mechanism for the ability of Ni to induce these symptoms is shown
schematically in Figure 1.11. Where there is oxygen present prolyl hydroxylase, an
enzyme which catalyzes the addition of a hydroxyl group to a proline residue and
requires both oxygen to iron to be active, will add a hydroxyl to Pro564 of HIF-1 on the α
subunit. Hydroxylation causes the recruitment of VHL leading to the degradation of
HIF-1, inhibiting the ability to promote VEGF secretion thereby blocking the hypoxia
pathway. When the oxygen level drops, prolyl hydroxylase is inactivated and there is
secretion of VEGF. However, Ni can bind to the enzyme at the position where Fe binds,
as already mentioned this is related to the antagonistic relationship between the two

25
metals. The relationship between Fe and Ni poses the question if Fe deficiency may also
lead to hypoxia-like symptoms such as increased lactic acid production. This binding of
Ni causes the inactivation of the enzyme, thereby blocking hydroxylation and HIF-1
remains active. Hence, even where there is adequate oxygen, Ni can cause hypoxia-like
symptoms. This schematic has been proven by Western blot analysis showing the
expression of prolyl hydroxylase in the presence of nickel and hypoxia (Salnikow et al.
2003). Other studies have shown that Ni compounds can increase the secretion of VEGF
in-vitro (Li et al. 2004).
Figure 1.10 Reduction in oxygen causes hypoxia (Alberts et al. 2002).
Shown below when the level of oxygen drops it results in an increased activation of HIF,
leading to secretion of VEGF. VEGF causes angiogenesis.

26
Figure 1.11 Suggested mechanisms for Ni-induced hypoxia.
1.10 Analysis of hair for trace elements and other uses Over the past 30 years there has been a great deal of debate over the validity of
using hair samples to measure the content of elements, although hair from the scalp
region has been used for over 70 years to measure the levels of elements (Althausen and
Gunther 1929). Moreover, hair analysis has shown to be of good use for larger
epidemiological studies (Bass et al 2001, Man et al 1996, Bencko 1995, Chatterjee et al
1994, Goldsack et al 1975). The major problem with using hair to analyze the metal
content is that the material composition of the sample is not only determined by
environmental exposure, but nutrition and other factors as well. This problem is further
augmented by the lack of a standard procedure for the collection, cleaning, and analysis
of the hair samples. Some of the factors that can affect hair analysis include: age, hair
color, race, the rate of hair grow, the area from which the sample was taken, and the hair
With Oxygen:
α Pro564
Fe
Pro564
OH
Deactivates Hypoxia Pathway
Ni2+ Ni2+
HIF-1
Prolyl hydroxylase
Activates Hypoxia Pathway

27
products used (e.g., shampoo, hair dyes). Hair sample findings should be confirmed by
both blood and urine tests. However, with large epidemiological studies it is very
difficult to obtain blood and urine samples from each participant. The cost of doing so
would be enormous and would still be subject to errors. For example, the amount of
water the person consumed before the sample was taken may lead to significant dilution
or an excess of sodium. Also, if the person is on a high-protein diet (e.g., Atkins) the
urine would contain a high concentration of urea, which is a polar molecule that may
interact through hydrophilic interactions with the metals.
Fortunately, technology has improved significantly over the past few decades.
The improved technology has allowed researchers to find links between the metal content
in hair with hypertension and coronary artery disease (Tang et al 2003) exposure to
harmful radiation (Chaterjee et al 1994), conditions affecting the vascular system (Huang
et al 1991), conditions affecting the nervous system (Cavdar et al 1991), and of course for
occupational exposure (Bencko 1995, Foo et al 1993). The use of hair samples allows for
a better time-course study. Urine and blood are better for current status (Bass et al 2001)
because both are subject to consistent biological variations. Urine, as mentioned
previously, cannot provide accurate information regarding long-term exposure since its
acidity is constantly changing. For example, in patients exhibiting disorders of the
lysosome M6P receptor, their urine is highly acidic due to the presence of lysosomal
proteins that have not been properly transported to the lysosome. Water consumption
would also alter the salt concentration of the body, providing an exaggerated value for the
levels of sodium. Blood is subject to similar variations. In diabetics, it has been
suggested that protein kinase C mutations result in an inactivation of the insulin and
28
insulin receptor. Protein kinase C is regulated by calcium, so diabetics may have slightly
altered values of calcium in their blood.
Furthermore, Ni has been found to drastically affect the level of blood glucose,
leading to hyperglycemia (Cartana and Arola 1992) and it has also been suggested that
nickel causes a significant increase in the levels cGMP and cNOS in the adrenals and the
brain and of i-NOS in the pancreas (Gupta et al 2000). The studies suggest that a long-
term study needs to be conducted relating the effect of Ni, as well as other metals, on the
overall gluconeogenesis process. A possible methodology may involve the use of hair
since it represents a longer timer frame.
Elemental content is also much higher in hair (Bass et al 2001) allowing a more
efficient analysis, and little discomfort to the participant since only a small sample is
required. However, before the analysis is performed standardization must be done.
For sample collection only the newest hair growth is suggested to be taken (Bass
et al. 2001, Puchyr et al. 1998). A common region is just above the back of the neck
(nape), to minimize the chance of external contamination. Bass et al. (2001) and
Goldsack et al. (1975) suggest that any hair that has been bleached, dyed, or permed is
excluded.
One possible way to further limit the amount of outside contamination is to have the
researcher use latex gloves and instruments that have been either disinfected with ethanol
or autoclaved to remove bacteria.
Preparation of the hair samples for analytical analysis involves removing all organic
content and contaminants involving a digestion technique. One recommended digestion
method weighs collected hair into disposable polypropylene centrifuge tubes, followed

29
by addition of nitric acid (trace-metal grade) this is then placed into a microwave oven or
some other heating device (Bass et al 2001). Several digestion procedures recommend
using nitric acid when performing the analysis with the highly-accurate ICP-MS.
The primary source of error lies in contamination of the hair sample, but this is the
case for all biological samples. Yet, for hair analysis there exists no standard protocol
that is generally followed by the majority of laboratories, however attempts have been
made (Puchyr et al 1998) with regard to procedural development for ICP-MS. For
accurate analysis the hair must be free of all proteins and other contaminants (e.g., lipids).
Sample selection is another source of error since it has not yet been determined if there
even distribution of metals in the hair shaft (Steindel and Howanitz 2001).
Although the sample selection and preparation are major sources of error, the actual
quantitative analysis of the metals has also been disputed. As noted previously, the debate
over the validity of the hair analysis for metals lies in the absence of primary standards
(Seidel et al 2001), and it was found that there was a great deal of discrepancy between
labs who conducted hair analysis. In fact, no proficiency testing exists for hair analysis
(Seidel et al 2001, Steindel and Howanitz 2001), thus resulting in the only accuracy
testing to involve splitting the samples between laboratories (Steindel and Howanitz
2001), which of course may be highly inaccurate when there is no standardized procedure
in place.
Currently there are several certified reference materials available for hair analysis
(Bass et al 2001), for example GBW 09101 from China that contains 30 elements.
If hair analysis is to have any legitimacy, all laboratories must agree on a specific set
of standards and protocols. Hair analysis may be a very powerful tool, and has been
30
found to have good use in forensic science (Goodpaster et al 2003), detection of illegal
drugs (Tassiopoulos et al 2004), and of course metal analysis (Bass et al 2001,
Christodoulopoulos et al 2003, Rush et al 2003, Hac et al 2002, Jones 2002). Recently,
hair shafts have been found to be of great use in genotype analysis (Chang et al 2002)
making it a powerful tool for identification of genetic predispositions related to cancer.
DNA may be isolated from hair shafts and amplified using PCR. This of course is very
valuable for cancer researchers since hair analysis, as mentioned previously, is non-
invasive and relatively inexpensive. Certified reference samples must be used as well to
verify accuracy, and the results must be able to be duplicated as all scientific results are,
before publishing.
Metal content in hair has been linked to a variety of factors. One study found that
females have higher concentrations of metals, including Cu and Zn, in their hair relative
to males (Sturaro et al. 1994), which may be related to hormonal differences. The same
study found that Zn content tends to increase with age, whereas Cu content tends to
decrease with age. The color of the hair has also been related to the amount of metals.
Darker hair colors have higher amounts of metals, including Cu, Zn and Ni relative to
darker colors (Sturaro et al. 1994). Black hair contains the most, followed by brown,
then red, and finally blonde. Blonde hair has the lowest concentration of metals. The
relationships have been found to hold for gender as well, for example males with black
hair contain less metal content than females with black hair (Sturaro et al. 1994).
Metal content in hair has been related to health status. Patients with epilepsy were
found to have lower concentrations of Zn and Mg, but higher concentrations of Cu
relative to healthy patients (Ihan et al. 1999). Interestingly, these concentrations changed

31
with the use of anti-epilepsy drugs like valproic acid (Doretto 2002, Shamberger 2002,
Ilhan et al. 1999). The use of these caused an increase in the content of Zn and Mg, but a
decrease in the Cu content. This suggests that hair analysis can be an adequate technique
to determine if anti-epilepsy therapy is successful, as a preliminary measurement.
Moreover, hair analysis and metal content has been used to diagnose behavioral problems
and other psychological disorders. For example, high lead in hair has been correlated
with a lower IQ (Shamberger 2002).
Hair analysis may be used as a preliminary diagnosis technique for breast cancer.
Patients with breast cancer were found to have higher levels of Cr but lower levels of
manganese in their hair (Killic et al. 2004). Hair analysis may also be used to diagnose
hypertension and coronary artery disease. Patients with hypertension and coronary artery
disease have been found to lower concentrations of both Zn and Cr, relative to healthy
patients (Tang et al. 2003). Additionally, these patients had a ratio of Zn to Cu smaller
than in healthy patients. These studies suggest metal content in hair can be related to
gender, age, hair color, and health status.
The 1975 study by Goldsack et al. found the metal content in hair to be related to area
of residence. In the 1975 study, it was determined the farther a person lived from smelter
operation, in Sudbury, ON, the lower concentration of Ni, Cu, Fe and Zn in their hair
(Goldsack et al. 1975).
In summary, hair samples can be obtained with no trauma to the patient and it can
also provide an ideal record of the past and recent exposure. It is the most efficient and
safe method for the proposed epidemiological study.

32
1.11 ICP-MS ICP-MS is an acronym for Inductively Coupled Plasma - Mass Spectrometry: a
fast, precise, accurate, and extremely sensitive multi-element analytical technique for the
determination of trace elements in a variety of liquid and solid sample materials
(Schilling and Kingsley 2004). ICP-MS uses a plasma excitation source to desolvate the
sample and atomize into constituent atoms or ions. The ions are then detected and
extracted from the central channel of the plasma as they pass into the mass
spectrophotometer. The ions are then separated based on their atomic mass-to-charge
ratio by a quadrupole, which is a magnetic sector analyzer. Chemical analysis with
inductively coupled plasma (a state of the matter containing electrons and ionized atoms)
is based on the principles of vaporization, dissociation, and ionization of chemical
elements when introduced into the hot plasma. The sample may experience temperatures
as high as 10000°C leading to the atomization of even the most refractory elements
(Schilling and Kingsley 2004). The ICP-MS instrument is computer controlled,
providing automation of sample analysis.
The ICP-MS consists of the following basic components:
• sample introduction system,
• inductively coupled plasma,
• plasma sampling interface,
• mass analyzer,
• detector,
• computer.
33
Using a stream of Ar carrier gas, liquid or solid sample from sample injection systems
is introduced into hot plasma which serves as an efficient source of positively charged
analyte ions. The Ar plasma is generated and maintained at the end of the glass torch
located inside the loops of a water cooled copper load coil (Schilling and Kingsley 2004).
A radio frequency (RF) potential applied to the coil produces an electromagnetic field in
the part of the torch located within its loops. A short electric discharge from a wire inside
the torch provides the electrons to ignite the plasma. In the electromagnetic field of the
load coil these electrons are accelerated and collide with Ar atoms in the Ar gas flowing
through the torch producing Ar+ ions and free electrons. Further collisions cause an
increasing number of Ar atoms to be ionized and result in the formation of plasma. The
plasma-forming process rapidly becomes self-sustaining and may be maintained as long
as Ar gas continues to flow through the torch (Schilling and Kingsley 2004).
The interface region contains two successive cones, made generally of Ni, with
millimeter-sized orifices through which the ions in the center of the plasma may be
sampled (TJA 2000). The ions are first extracted trough the orifice of the sample cone
into the region between two cones held at a pressure of about 1-3 torr by a large capacity
rotary vacuum pump (Schilling and Kingsley 2004). At this stage, most of the Ar atoms
are removed by a vacuum pump. The ion beam is further extracted through the orifice of
the skimmer cone into the front section of the mass spectrometer chamber that is
maintained at a pressure of about 10-3 - 10-4 torr by a large turbo molecular vacuum
pump. Ions with a specific mass/charge (m/z) ratio are transmitted sequentially to the
ion detection system. Ions with lower or higher mass/charge ratios have different
trajectories and are filtered out (Schilling and Kingsley 2004).

34
The most commonly used type of detector in ICP-MS is an electron multiplier. The
ion detection and counting system consists of an electron multiplier used in a dual-gain
pulse counting mode or low gain analog mode depending on the ion-beam intensity. The
signal intensity is measured simultaneously at two different points in the detector
(Schilling and Kingsley 2004). The upper stage is responsible for measuring high
intensity signals. Signals of exceedingly high intensities are prevented from entering the
detector. The lower measures low intensity signals as cps.
Figure 1.12 Schematic of an ICP-MS (Schilling and Kingsley 2004).
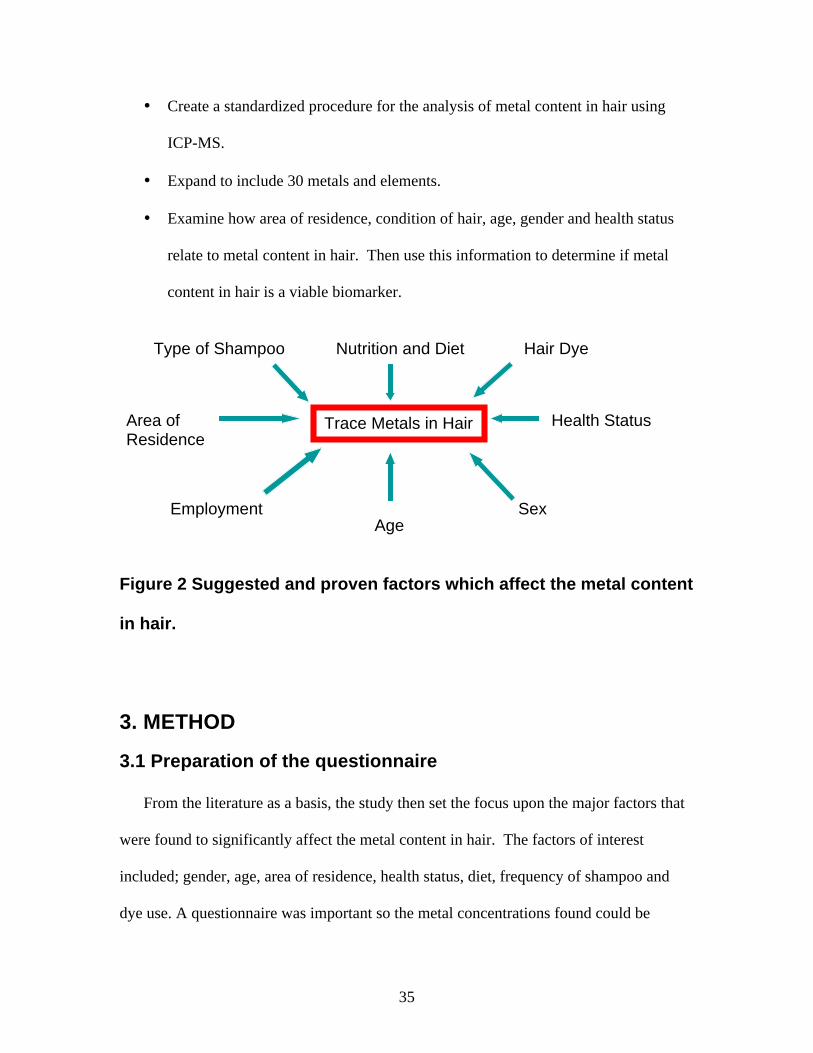
2. OBJECTIVES
The purpose of this thesis is to relate some of the major factors that affect trace metal
content in hair (Figure 2), and determine any patterns and trends. This correlation study
will then attempt to decipher which factors play a greater role and which play a lesser
role. Hence the objectives are:
• To perform an updated metal content in hair strands analysis, using the 1975
study by Goldsack et al. as a basis.
35
• Create a standardized procedure for the analysis of metal content in hair using
ICP-MS.
• Expand to include 30 metals and elements.
• Examine how area of residence, condition of hair, age, gender and health status
relate to metal content in hair. Then use this information to determine if metal
content in hair is a viable biomarker.
Figure 2 Suggested and proven factors which affect the metal content
in hair.
3. METHOD
3.1 Preparation of the questionnaire
From the literature as a basis, the study then set the focus upon the major factors that
were found to significantly affect the metal content in hair. The factors of interest
included; gender, age, area of residence, health status, diet, frequency of shampoo and
dye use. A questionnaire was important so the metal concentrations found could be
Trace Metals in Hair
Nutrition and Diet
Health Status Area of Residence
Age Sex
Type of Shampoo Hair Dye
Employment
36
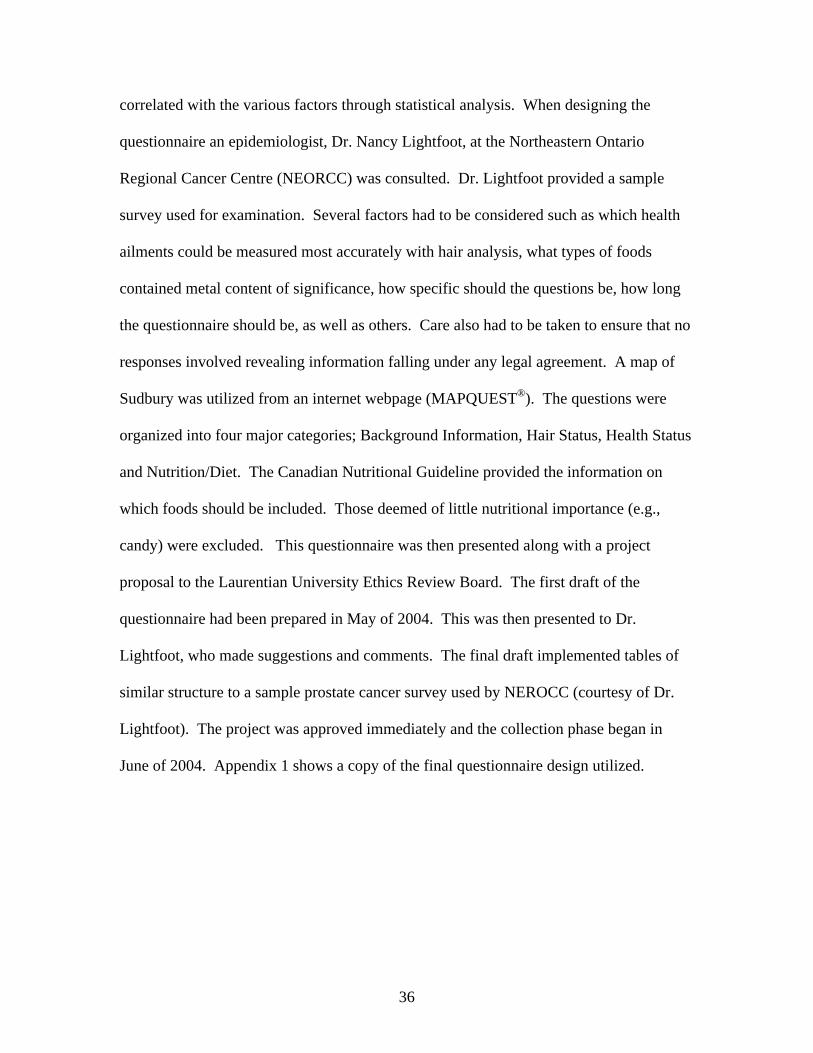
correlated with the various factors through statistical analysis. When designing the
questionnaire an epidemiologist, Dr. Nancy Lightfoot, at the Northeastern Ontario
Regional Cancer Centre (NEORCC) was consulted. Dr. Lightfoot provided a sample
survey used for examination. Several factors had to be considered such as which health
ailments could be measured most accurately with hair analysis, what types of foods
contained metal content of significance, how specific should the questions be, how long
the questionnaire should be, as well as others. Care also had to be taken to ensure that no
responses involved revealing information falling under any legal agreement. A map of
Sudbury was utilized from an internet webpage (MAPQUEST®). The questions were
organized into four major categories; Background Information, Hair Status, Health Status
and Nutrition/Diet. The Canadian Nutritional Guideline provided the information on
which foods should be included. Those deemed of little nutritional importance (e.g.,
candy) were excluded. This questionnaire was then presented along with a project
proposal to the Laurentian University Ethics Review Board. The first draft of the
questionnaire had been prepared in May of 2004. This was then presented to Dr.
Lightfoot, who made suggestions and comments. The final draft implemented tables of
similar structure to a sample prostate cancer survey used by NEROCC (courtesy of Dr.
Lightfoot). The project was approved immediately and the collection phase began in
June of 2004. Appendix 1 shows a copy of the final questionnaire design utilized.
37
3.2 Recruitment of participants In June of 2004, staff and students at MIRARCO and its associated research groups
(CEM, CIMTEC, and GRC) were approached about participation in the study. Individual
appointments were made for those who requested it. Participants were told that hair
would be taken from the nape of the neck and they would be asked to complete a
questionnaire. The investigators were always in close proximity and provided help when
requested. The collection at MIRARCO generated approximately 30 samples. The
investigators then approached government agencies in the Willet Green Miller Centre
(Laurentian University). Brief presentations were made about the study and any concerns
were dispelled. Care was taken to provide complete information to the managers of each
agency. Collection stations were set up at prior agreed locations and times. Local hair
salons were also approached. In the case of hair salons, a method utilized by Dr. D.E.
Goldsack in 1975 was implemented. Salons were told to collect sweepings from the floor
and put them into plastic bags for pickup by investigators to use for preparation of
internal reference materials. In addition they were also asked, when possible, to put the
hair into directly into provided bags after cutting (without landing on the floor), for those
customers who were interested in having their individual hair sample analyzed. All
salons were asked to inform customers that the information and results would be kept
confidential and they could obtain individual results.
Collection stations involving other organizations were utilized as well. For example,
in July 2004 employees at National Tilden Car Rentals participated. In July 2004,
employees at SMARTWORX, an agency located in City Hall, also participated. In both
cases, investigators held on-site collection.
38
By September 2004, approximately 300 participants had contributed hair. Once
classes resumed, students were recruited by speaking to individual classes. These
students included first year science, second year biochemistry and physical chemistry,
and others at Laurentian University (Sudbury, ON). At this time there was a rich
diversity of participants in terms of the factors mentioned previously. Ages ranged from
1 to 90 years.
Due to the increasing interest, media coverage yielded more participants from the
general public. In October 2004, this led to a large collection period at the Willet Green
Miller Centre having approximately 100 participants contribute. A background group
was also formed from residents in Elliot Lake. This occurred in November 2004 having
approximately 25 participants from this area to use as comparison to the Sudbury-area
residents.
3.3 Sampling and Collection of Hair Alcohol swabs (70 % isopropyl alcohol) were used to sterilize the skin at the nape of
the neck, so as to avoid any chance of skin irritation. The scissors were also sterilized to
avoid cross-contamination. The investigators wore latex gloves (FORMEDICA® Protect
Latex Medical Examination Gloves No. 6036) at all times. Hair was cut from the nape of
the neck using standard stainless-steel scissors. Hair was cut as close to the skin as
possible. Care was taken from more than one site at the nape of the neck to ensure an
even distribution. In other words, for all participants strands were taken from the middle
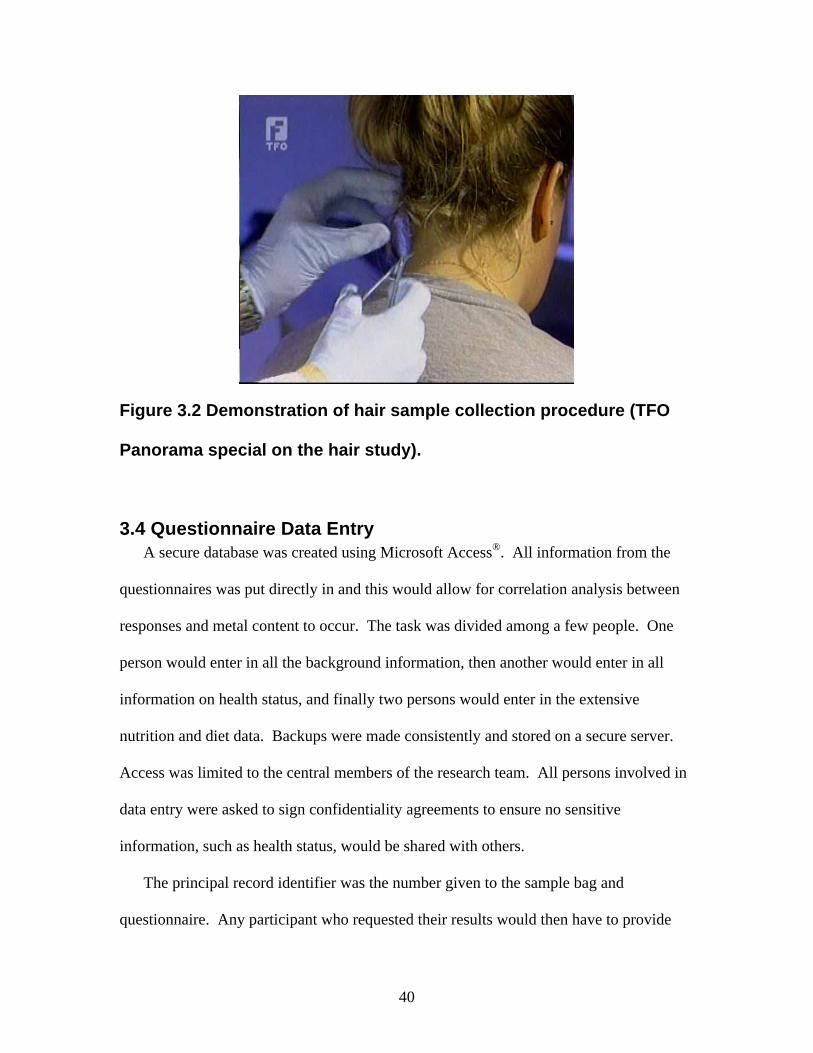
and the sides of the nape. This step is shown in Figures 3.1 and 3.2. As can be seen, only
a few small strands of hair (0.5 to 1 cm in length), of average weight 0.1 g. The hair was

39
stored in plastic bags (GLAD® Zipper Sandwich bags 16.8 cm x 14.9 cm), with a unique
identification number attached to ensure complete anonymity.
Each participant was then asked to complete a numbered questionnaire. The average
completion time for the questionnaire was 15 minutes.
The participants also signed two copies of a consent form. One copy was given to the
participant, containing their unique identification number. The second copy was retained
by the investigators.
Figure 3.1 Demonstration of hair sample collection procedure.
40
Figure 3.2 Demonstration of hair sample collection procedure (TFO
Panorama special on the hair study).
3.4 Questionnaire Data Entry A secure database was created using Microsoft Access®. All information from the
questionnaires was put directly in and this would allow for correlation analysis between
responses and metal content to occur. The task was divided among a few people. One
person would enter in all the background information, then another would enter in all
information on health status, and finally two persons would enter in the extensive
nutrition and diet data. Backups were made consistently and stored on a secure server.
Access was limited to the central members of the research team. All persons involved in
data entry were asked to sign confidentiality agreements to ensure no sensitive
information, such as health status, would be shared with others.
The principal record identifier was the number given to the sample bag and
questionnaire. Any participant who requested their results would then have to provide

41
the identification number, given to them on their copy of the consent form, and the data
would be located through the server.
3.5 Preparation of Hair The average weight of the samples was first determined. This was done by
randomly selecting sample bags (n=25) from among the larger batch, containing a
mixture of samples obtained from males and females. The average weight was 0.09014 ±
0.06660 g. Fisherbrand® plastic tweezers were used to remove 0.05 g of hair from the
plastic bags and put them onto Fisherbrand® weighing paper (4” x 4” Fisher Scientific
No. 09-898-12B). Samples were weighed on a calibrated Sartorius® five-place balance.
To minimize contamination, N-DEX® nitrile gloves (Best G7005) were worn at all times.
The samples were then transferred into sterile 50 mL Falcon Tubes® (Becton Dickinson)
and tapped on the bench counter to push most of the strands to the bottom. The samples
were digested in 1 mL of trace metal grade nitric acid (Fisher Scientific No. A509SK-
217) added using a Fisherbrand® 1000 µL micropipette (Fisher Scientific No. 5000DG)
and Redi-Tip® Reference Pipette Tips (101-1000 µL Fisher Scientific). The digestion
ratio of 0.05 g in 1 mL of trace metal grade nitric acid was chosen following extensive
tests with varying ratios using floor hair sweepings. These same digestion tests were
used to examine extensive concentration ranges to be expected in hair samples from
people for the Sudbury-area region. These tubes were then kept in batches at room
temperature for three hours for pre-digestion. The tubes were transferred to a digestion
block, on a hot plate (Thermolyne® Type 2200) at 90ºC. The tubes were kept at this
temperature for 24 hours so as to allow the fumes to digest any hair strands present on the
42
inside of the tube. The samples were allowed to cool for 3 to 4 hours, to allow the fumes
to condense. The samples were then diluted to 20 mL with distilled water.
Samples were chosen at random and arranged into batches of 25. These batches
included a NIST® Standard Reference Material. Three types were utilized: Trace
elements in Tomato Leaves (1573a), Spinach (1570a), and Pine Needles (1575a). These
were circulated continuously throughout all the batches. Each batch also contained a tube
with 0.05 g of bulk hair, serving as an internal standard, and a 1 mL metal grade nitric
acid blank. Replicates of two of the samples were also put into each batch. In total 25
batches were prepared. The plastic tweezers were wiped with alcohol swabs in between
samples to minimize cross contamination. The weighing paper was also consistently
changed and all tubes were kept closed until hair was ready to be transferred.
The heating and cooling conditions remained the same, and all tubes were diluted
to 20 mL with distilled water. The tubes were then shaken to allow homogeneity.
The plant reference materials required a few drops (250 µL) of hydrofluoric acid along
with the nitric acid to dissolve siliceous material.
Precision samples were also prepared. These contained 0.1 g of the bulk hair
digested in 2 mL of nitric acid and diluted to 40 mL with distilled water. Five of these
were prepared.
Finally, ten hair standards were prepared (Table 3.1). To produce these standards
0.1 g of Human Hair Reference Material (Commission of European Committees and
Community Bureau of Reference Materials BCR No.397) was digested in 2 mL of nitric
acid and diluted to 40 mL with distilled water.

43
Table 3.1 Digestions of BCR hair standard. This table shows the amount of
hair standard utilized in ten tubes.
Tube Material Weight (g) H1 0.0998 H2 0.1003 H3 0.0997 H4 0.1008 H5 0.0996 H6 0.0998 H7 0.1004 H8 0.0997 H9 0.1003 H10 0.1004
For some of the smaller strands of hair, an anti static wristband (Bekin F8E093tt)
was worn to dissipate static attraction occurring for these samples. A four-place balance
(Denver Instruments No. APX-100) was also utilized to weigh out the hair samples.
3.6 Preparation of ICP-MS Analysis of the digested hair solutions were performed using an ICP-MS (Varian®).
Using calibration standards of 1, 5, 10, 50 ppb metal content attenuations were done to
set the low and high concentration ranges. Fisherbrand® calibration solutions were
utilized for the 30 elements that were analyzed in total. This was done for approximately
30 elements, consisting mainly of the transition metals.
Calibration curves (Figures 3.3 and 3.4) were then generated using 30 scans per
replicate and 3 replicates per sample. Hence, each sample had 90 scans in total
performed. The scan time was 1725 msec and the replicate time was 52 seconds. Upon
calibration the Falcon tubes were loaded into auto sampler trays. Each tray held 21 tubes.
In this tray, space was left for a water blank and continuous calibration verifier (CCV).
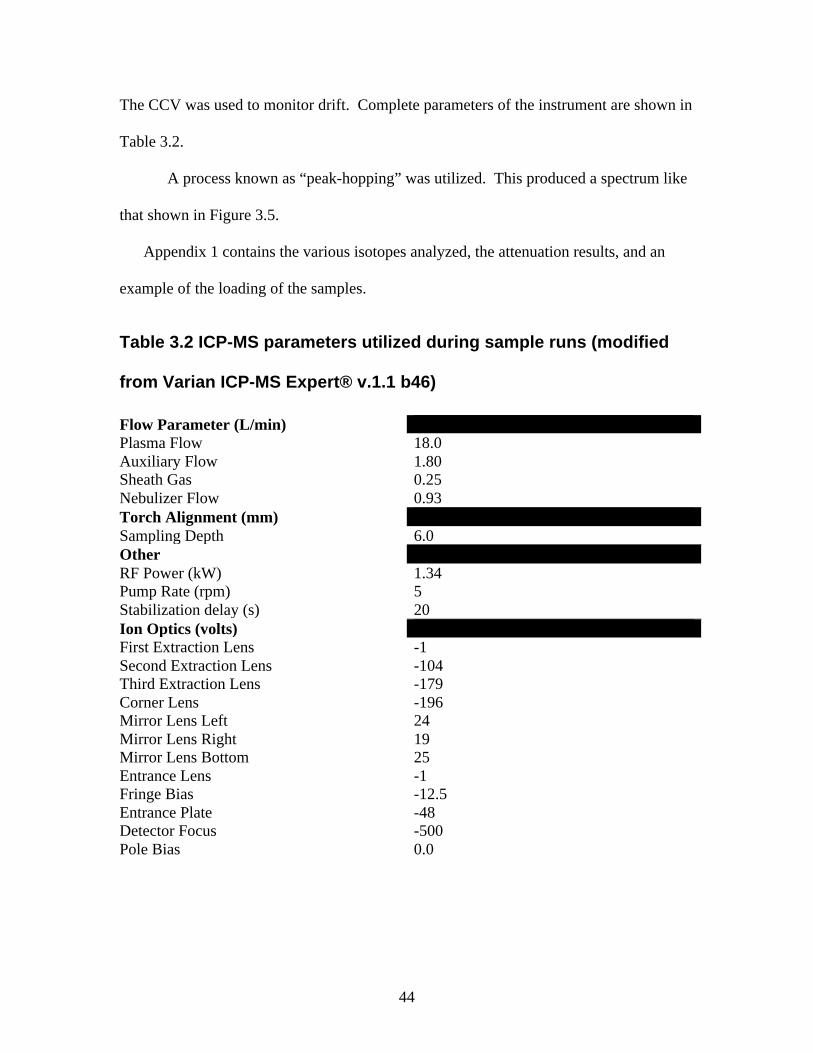
44
The CCV was used to monitor drift. Complete parameters of the instrument are shown in
Table 3.2.
A process known as “peak-hopping” was utilized. This produced a spectrum like
that shown in Figure 3.5.
Appendix 1 contains the various isotopes analyzed, the attenuation results, and an
example of the loading of the samples.
Table 3.2 ICP-MS parameters utilized during sample runs (modified
from Varian ICP-MS Expert® v.1.1 b46)
Flow Parameter (L/min) Plasma Flow Auxiliary Flow Sheath Gas Nebulizer Flow
18.0 1.80 0.25 0.93
Torch Alignment (mm) Sampling Depth 6.0 Other RF Power (kW) Pump Rate (rpm) Stabilization delay (s)
1.34 5 20
Ion Optics (volts) First Extraction Lens Second Extraction Lens Third Extraction Lens Corner Lens Mirror Lens Left Mirror Lens Right Mirror Lens Bottom Entrance Lens Fringe Bias Entrance Plate Detector Focus Pole Bias
-1 -104 -179 -196 24 19 25 -1 -12.5 -48 -500 0.0

45
Figure 3.3 Example of a calibration curve for Cu (Varian ICP-MS
Expert® v.1.1 b46).
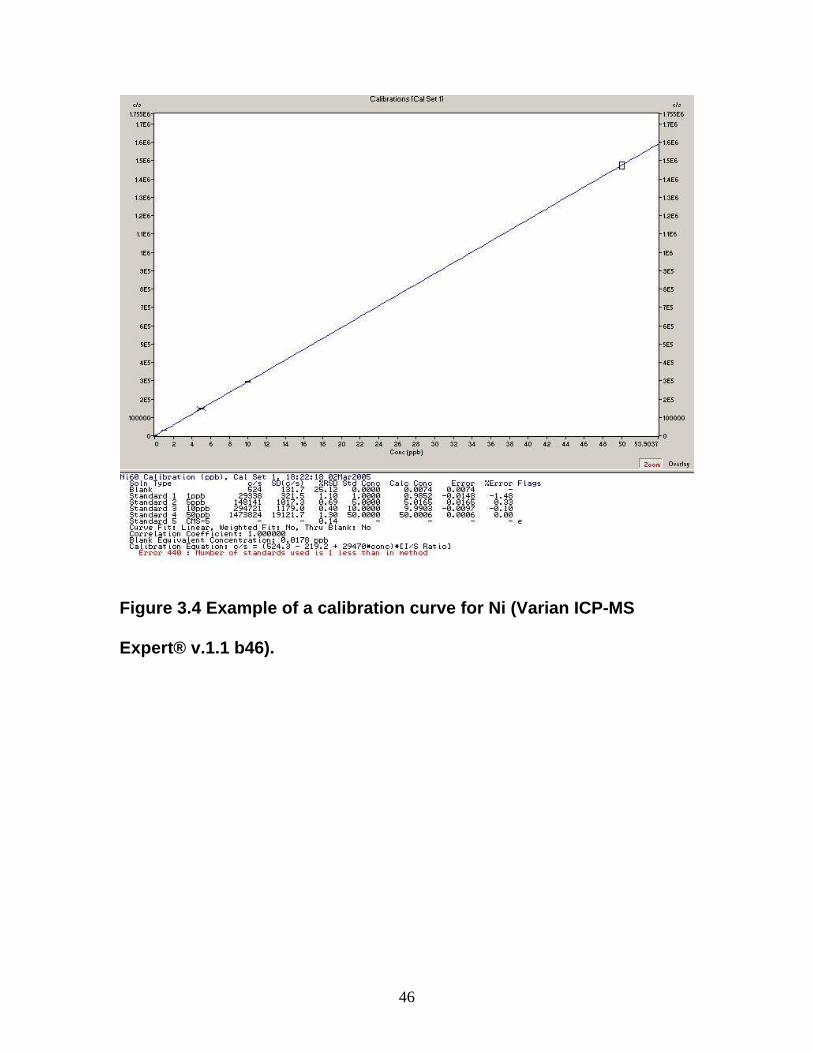
46
Figure 3.4 Example of a calibration curve for Ni (Varian ICP-MS
Expert® v.1.1 b46).

47
Figure 3.5 Schematic of peak distribution for Pb (screenshot from
Varian ICP-MS Expert® v.1.1 b46).
3.7 Summary of Procedure Small hair strands were taken from the nape of the neck, of participants, and
digested using trace metal grade nitric acid (1 mL acid, 24 hours at 90ºC, diluted to 20
mL with distilled water). The samples were prepared in batches of 25. The samples were
analyzed for various trace metals using ICP-MS which was calibrated with standard
solutions. An auto-sampler was utilized. A water blank, CCV, acid blank, and internal
standard were included as well.

48
4. RESULTS
4.1 Statistical Analysis Statistical analysis was performed using STATISTICA®, an analysis software
package, from data of the metal content in the samples. This thesis focuses on the six
metals measured of the greatest biological and environmental importance in Sudbury and
the surrounding area. The mean values for Ni, Cu, Fe and Zn (Table 4.1) were
significantly lower than the values obtained in 1975 (Table 4.2). The minimum value of
0.00 ppm is only an arbitrary concentration so as to allow creation of the distribution
plots. A concentration of 0.00 ppm refers to values that were below detection limits and
did registering an adequate ppm value (µg of metal per g of hair).
From the Pearson’s correlation matrix (Appendix 1) significant relationship
(p < 0.01) betweens Ca43 and Mg26 (r2 = 0.6790), V51 and Ti49 (r2 = 0.5278), Ni60 and
Cu63 (r2 = 0.5809), Cd111 and B10/B11 (r2= 0.4573 and 0.4534), Mg26 and Ba137 (r2=
0.6718), Mg26 and Sr88 (r2= 0.4182), Ti49 and Zn66 (r2=0.4673), Cr52 and Zn66
(r2=0.4481), were observed Tree diagrams were then developed using cluster analysis,
the Ward’s method and Pearson’s correlation to demonstrate the extent of relationships
between the various metals analyzed in hair.
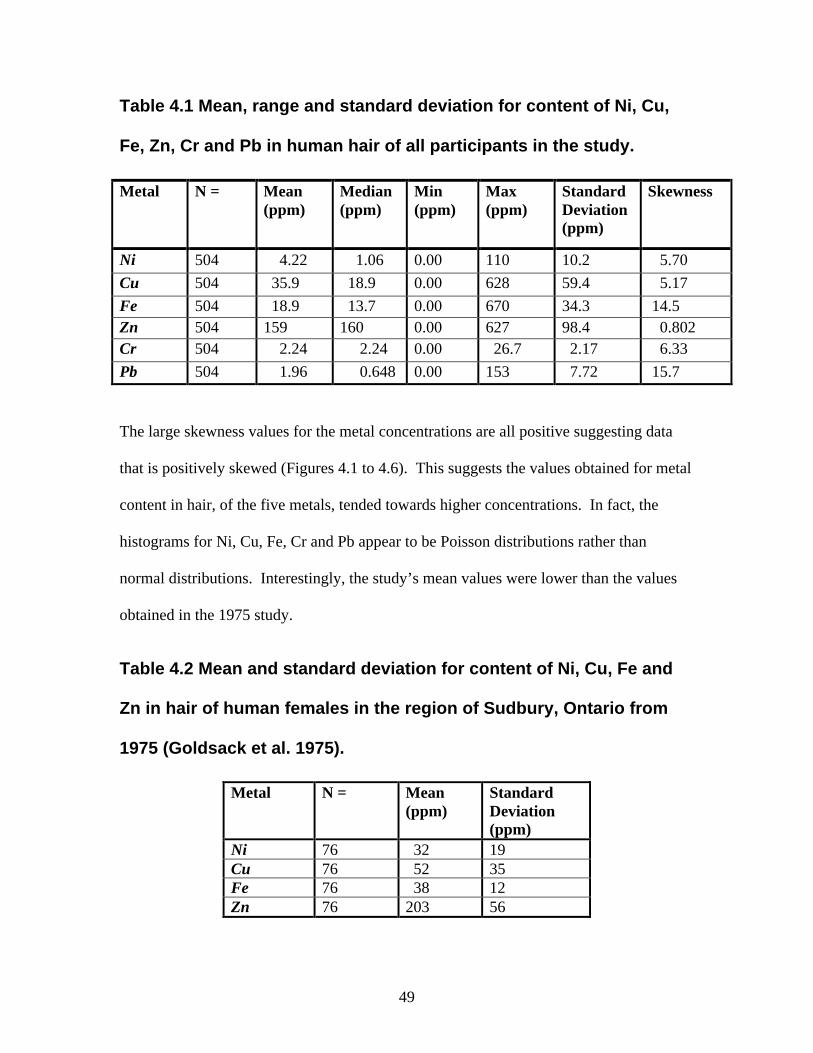
49
Table 4.1 Mean, range and standard deviation for content of Ni, Cu,
Fe, Zn, Cr and Pb in human hair of all participants in the study.
Metal N = Mean (ppm)
Median (ppm)
Min (ppm)
Max (ppm)
Standard Deviation (ppm)
Skewness
Ni 504 4.22 1.06 0.00 110 10.2 5.70
Cu 504 35.9 18.9 0.00 628 59.4 5.17
Fe 504 18.9 13.7 0.00 670 34.3 14.5 Zn 504 159 160 0.00 627 98.4 0.802 Cr 504 2.24 2.24 0.00 26.7 2.17 6.33
Pb 504 1.96 0.648 0.00 153 7.72 15.7
The large skewness values for the metal concentrations are all positive suggesting data
that is positively skewed (Figures 4.1 to 4.6). This suggests the values obtained for metal
content in hair, of the five metals, tended towards higher concentrations. In fact, the
histograms for Ni, Cu, Fe, Cr and Pb appear to be Poisson distributions rather than
normal distributions. Interestingly, the study’s mean values were lower than the values
obtained in the 1975 study.
Table 4.2 Mean and standard deviation for content of Ni, Cu, Fe and
Zn in hair of human females in the region of Sudbury, Ontario from
1975 (Goldsack et al. 1975).
Metal N = Mean (ppm)
Standard Deviation (ppm)
Ni 76 32 19 Cu 76 52 35 Fe 76 38 12 Zn 76 203 56

50
Histogram (PPM_results 18v*504c)
Ni60_ppm = 504*10*normal(x, 4.2172, 10.1901)
0 10 20 30 40 50 60 70 80 90 100 110 120 130
Ni60_ppm
0
20
40
60
80
100
120
140
160
180
200
220
240
260N
o of
obs
Figure 4.1 Frequency histogram for concentration of Ni (ppm or µg of
metal / g of hair) found in hair strands for all study participants
(STATISTICA®). The histogram plots only show the concentration values that were
within the detection limits. Those below the detection limits were not plotted (i.e., 0
ppm).

51
Histogram (PPM_results 18v*504c)Cu63_ppm = 504*100*normal(x, 35.8558, 59.3454)
0 100 200 300 400 500 600 700
Cu63_ppm
0
50
100
150
200
250
300
350
400
450
500N
o of
obs
Figure 4.2 Frequency histogram for concentration of Cu (ppm or µg of
metal /g of hair) found in hair strands for all study participants
(STATISTICA®).

52
Histogram (PPM_results 18v*504c)
Fe57_ppm = 504*100*normal(x, 18.875, 34.2755)
0 100 200 300 400 500 600 700 800
Fe57_ppm
0
100
200
300
400
500
600
700N
o of
obs
Figure 4.3 Frequency histogram for concentration of Fe (ppm or µg of
metal /g of hair) found in hair strands for all study participants
(STATISTICA®).

53
Histogram (PPM_results 18v*504c)
Zn66_ppm = 504*100*normal(x, 159.1549, 98.3664)
0 100 200 300 400 500 600 700
Zn66_ppm
0
20
40
60
80
100
120
140
160
180
200
220
240N
o of
obs
Figure 4.4 Frequency histogram for concentration of Zn (ppm or µg/g
of hair) found in hair strands for all study participants (STATISTICA®).

54
Histogram (PPM_results 18v*504c)Cr52_ppm = 504*5*normal(x, 2.235, 2.167)
0 5 10 15 20 25 30
Cr52_ppm
0
50
100
150
200
250
300
350
400
450
500N
o of
obs
Figure 4.5 Frequency histogram for concentration of Cr (ppm or µg/g
of hair) found in hair strands for all study participants (STATISTICA®).

55
Histogram (PPM_results 18v*504c)Pb207_ppm = 504*20*normal(x, 1.9637, 7.7195)
0 20 40 60 80 100 120 140 160 180
Pb207_ppm
0
100
200
300
400
500
600N
o of
obs
Figure 4.6 Frequency histogram for concentration of Pb (ppm or µg/g
of hair) found in hair strands for all study participants (STATISTICA®).
4.2 Distribution Maps The data was brought into a mapping program (ArcGIS®). Using satellite images
of Sudbury and the surrounding area, the points were plotted according to the postal code.
Postal code data corresponded to a specific set of coordinates (longitude and latitude) and
there exists more than one postal code for any given street. Hence, a single point on the
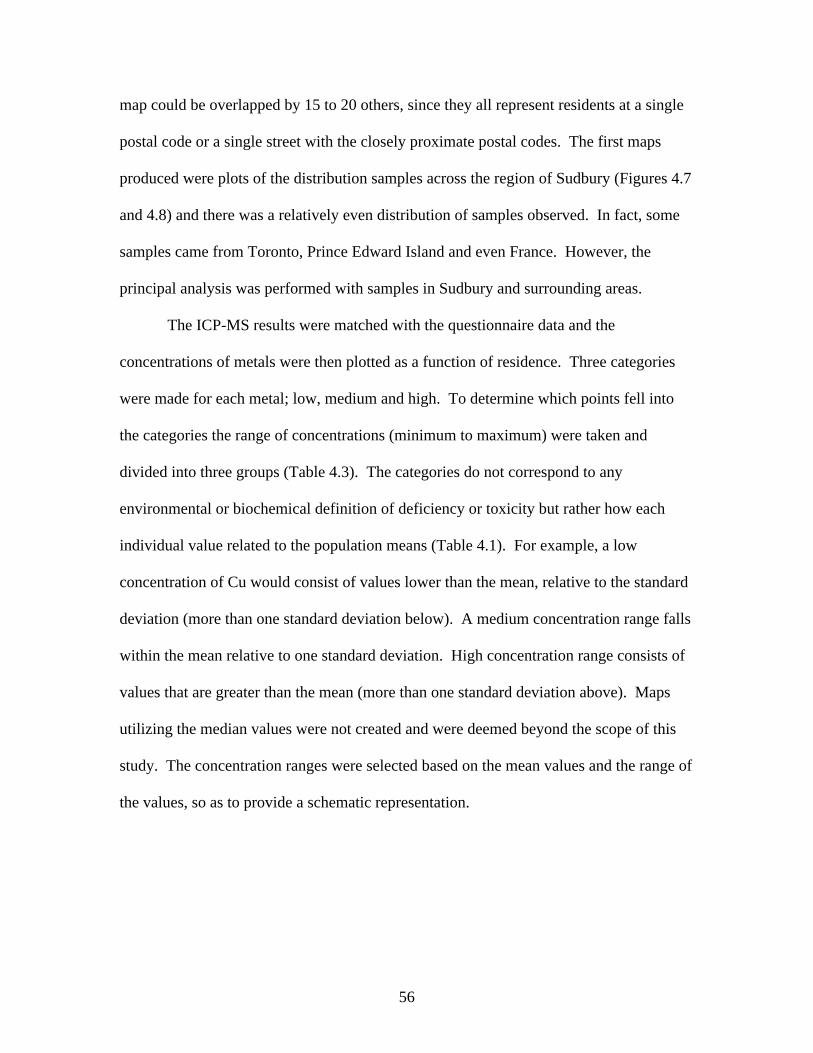
56
map could be overlapped by 15 to 20 others, since they all represent residents at a single
postal code or a single street with the closely proximate postal codes. The first maps
produced were plots of the distribution samples across the region of Sudbury (Figures 4.7
and 4.8) and there was a relatively even distribution of samples observed. In fact, some
samples came from Toronto, Prince Edward Island and even France. However, the
principal analysis was performed with samples in Sudbury and surrounding areas.
The ICP-MS results were matched with the questionnaire data and the
concentrations of metals were then plotted as a function of residence. Three categories
were made for each metal; low, medium and high. To determine which points fell into
the categories the range of concentrations (minimum to maximum) were taken and
divided into three groups (Table 4.3). The categories do not correspond to any
environmental or biochemical definition of deficiency or toxicity but rather how each
individual value related to the population means (Table 4.1). For example, a low
concentration of Cu would consist of values lower than the mean, relative to the standard
deviation (more than one standard deviation below). A medium concentration range falls
within the mean relative to one standard deviation. High concentration range consists of
values that are greater than the mean (more than one standard deviation above). Maps
utilizing the median values were not created and were deemed beyond the scope of this
study. The concentration ranges were selected based on the mean values and the range of
the values, so as to provide a schematic representation.

57
Table 4.3 Ranges for low, medium and high concentration values as
represented on the distribution plots.
Low (ppm) Medium (ppm) High (ppm)
Cu 0.00 – 25.0 25.1 – 100 100 – 800
Fe 0.00 – 25.0 25.1 – 100 100 – 670
Zn 0.00 – 150 150 – 300 300 – 627
Cr 0.00 – 1.00 1.10 – 10.0 10.1 – 26.7
Pb 0.00 – 5.00 5.10 – 25.0 25.1 – 153
Ni 0.00 – 10.0 10.1 – 25.0 25.1 – 85.5
The maps are shown in Figures 4.9a to 4.14d. Each of the six focus elements had
three maps produced. The first (Figures 4.9a, 4.10a, 4.11a, 4.12a, 4.13a, 4.14a) show the
entire region of Sudbury and surrounding areas, as well as Toronto. The second set
(Figures 4.9b, 4.10b, 4.11b, 4.12b, 4.13b, 4.14b) show close-ups of the city of Sudbury
boundary. Finally the third set (Figures 4..9c, 4.10c, 4.11c, 4.12c, 4.13c, 4.14c) show the
city of Sudbury core, relative to the Copper Cliff smelter. One interesting observation can
be seen when comparing Toronto to Sudbury. Toronto contained a greater number of
values that were in the low concentration range, whereas Sudbury had a greater number
of values that fell into the medium to high concentration ranges for the metals that were
examined. This trend is particularly evident for Cu (Figure 4.9a), Fe (Figure 4.10a) and
Ni (Figure 4.14a).

58
The focus was then on the core of Sudbury and also the area between the three
smelters and processing operations in the areas near Copper Cliff, Coniston, and
Falconbridge. Several things were observed:
• For Cu, Ni, Fe, Zn, Pb and Cr the medium to high concentration points are
located near the Copper Cliff smelter.
• The Falconbridge and Coniston smelters had more low concentrations points of
those metals.
• The lower concentration points for the six metals appeared to be positioned in
areas that were East of the downtown city core and up-wind from the smelter in
Copper Cliff. This may be due to changes in elevation, since the up-wind or
Eastern area is of lower elevation.
• The distribution maps for both Ni and Cu showed more points which fell into the
high concentration range than the distribution map for Fe.
• Cr had more medium concentration range (within the metal concentration mean
for the entire sample set) points than the other metals. In fact, these points were
found predominantly in areas of the city where the population was higher,
suggesting an “urban effect.” The more rural areas did not contain as many
medium concentration points.
• Interestingly, Cr was found to in the medium concentration range (within the
metal concentration mean for the entire sample set) for samples taken from
Toronto-area residents, a trend not seen for any of the other metals. None of the
Sudbury smelters are though to produce Cr in their dust emissions. This of

59
course assumes that participants in the Sudbury-area have similar lifestyles as
the participants in the Toronto-area.
• Zn was found to be in the medium to high concentration range even in areas
where the Ni and Cu content was also in that range.
• The majority of Sudbury-area participants had concentrations of Pb that were not
significantly higher than the concentration mean for the entire population set.
However, medium and high concentration points were found in areas more
heavily populated suggesting an “urban effect.”
• Ni and Cu concentration in hair for Sudbury-area residents positively correlate
with one another.
• The standard deviation plot produced for Ni content showed points found near
the Copper Cliff smelter had concentrations that were nearly 10-times the
standard deviation value from the population mean. This does suggest a strong
relationship between distance from the smelter and metal content in hair.
Moreover, points that were within one-to-two standard deviations from the mean
were located in areas West of the Copper Cliff smelter (e.g., Whitefish and
Naughton).

Figure 4.7. Distribution plot of residence locations for study participants (Sudbury and surrounding area).
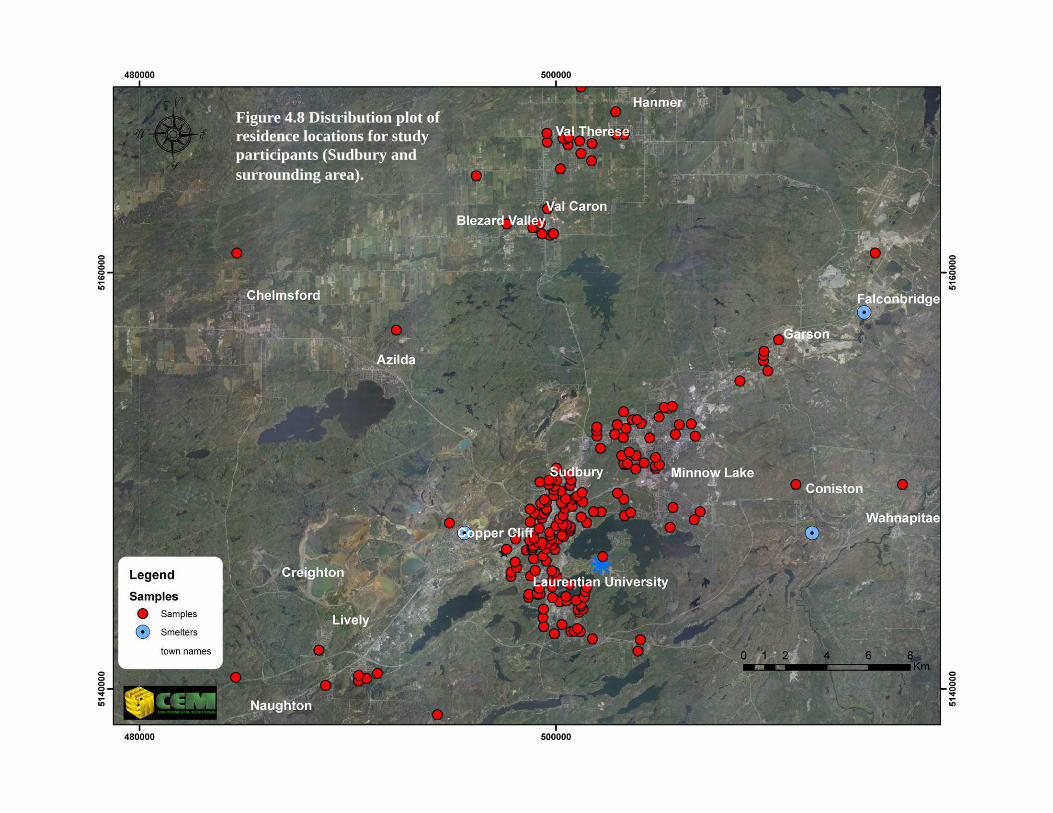
Figure 4.8 Distribution plot of residence locations for study participants (Sudbury and surrounding area).

Figure 4.9a Distribution plot of Cu concentrations found in hair samples relative to area of residence (Sudbury-area and Toronto)
Toronto-area

Figure 4.9b Distribution plot of Cu concentrations found in hair samples relative to area of residence (Sudbury-area)

Figure 4.9c Distribution plot of Cu concentrations found in hair samples relative to area of residence (Sudbury core relative to Copper Cliff smelter)
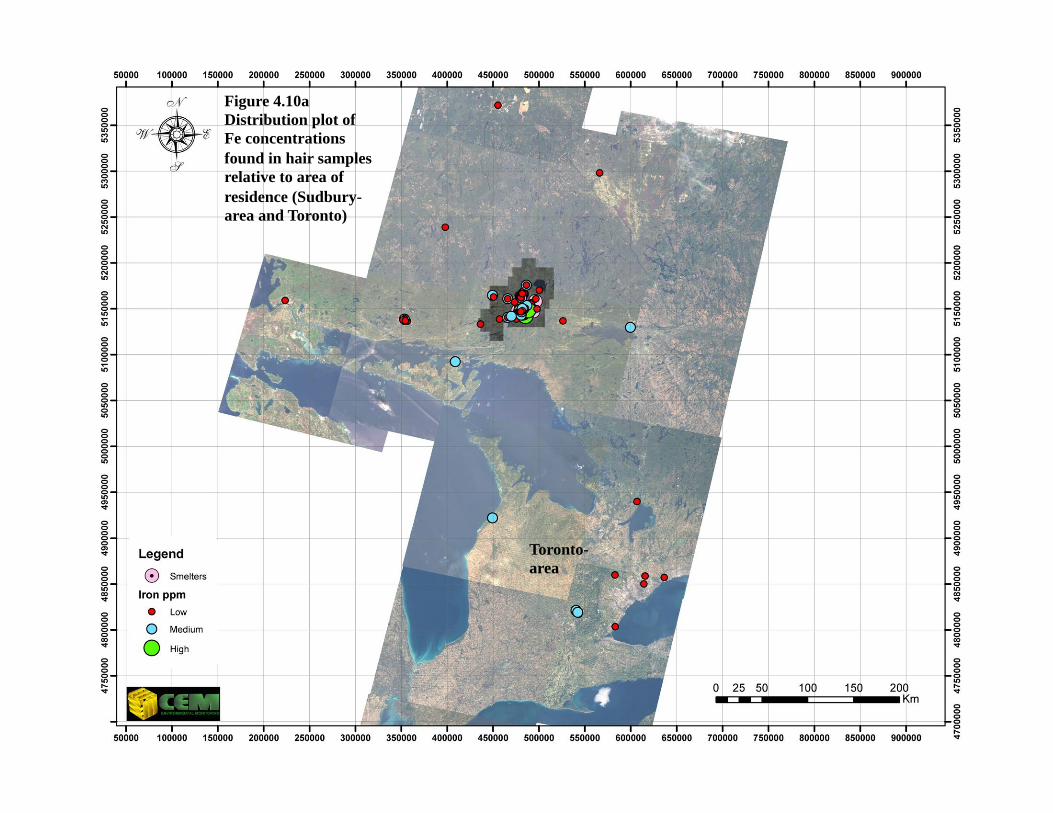
Figure 4.10a Distribution plot of Fe concentrations found in hair samples relative to area of residence (Sudbury-area and Toronto)
Toronto-area
Figure 4.10b Distribution plot of Fe concentrations found in hair samples relative to area of residence (Sudbury-area)

Figure 4.10c Distribution plot of Fe concentrations found in hair samples relative to area of residence (Sudbury core relative to Copper Cliff smelter)

Figure 4.11a Distribution plot of Zn concentrations found in hair samples relative to area of residence (Sudbury-area and Toronto)
Toronto-area

Figure 4.11b Distribution plot of Fe concentrations found in hair samples relative to area of residence (Sudbury-area)

Figure 4.11c Distribution plot of Zn concentrations found in hair samples relative to area of residence (Sudbury core relative to Copper Cliff smelter)

Figure 4.12a Distribution plot of Cr concentrations found in hair samples relative to area of residence (Sudbury-area and Toronto)
Toronto-area

Figure 4.12b Distribution plot of Cr concentrations found in hair samples relative to area of residence (Sudbury-area)

Figure 4.12c Distribution plot of Cr concentrations found in hair samples relative to area of residence (Sudbury core relative to Copper Cliff smelter)

Figure 4.13a Distribution plot of Pb concentrations found in hair samples relative to area of residence (Sudbury-area and Toronto)
Toronto-area
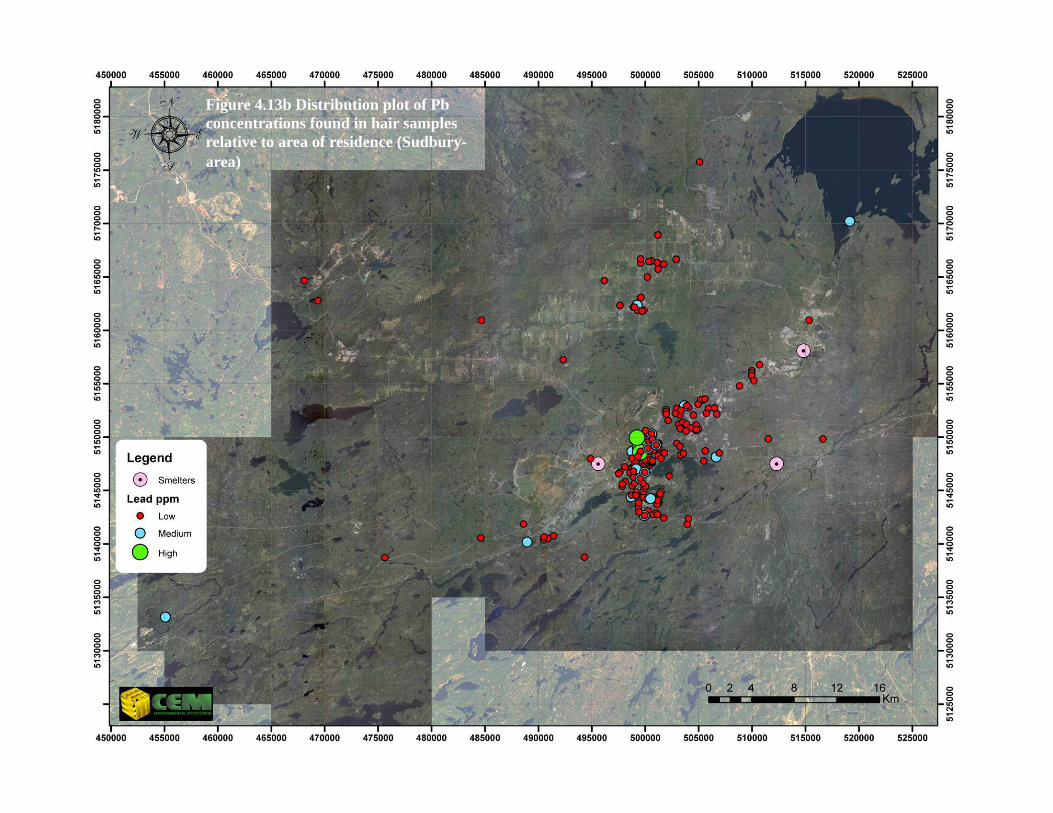
Figure 4.13b Distribution plot of Pb concentrations found in hair samples relative to area of residence (Sudbury-area)

Figure 14.3c Distribution plot of Pb concentrations found in hair samples relative to area of residence (Sudbury core relative to Copper Cliff smelter)

Figure 14.4a Distribution plot of Ni concentrations found in hair samples relative to area of residence (Sudbury-area and Toronto)
Toronto-area

Figure 14.4b Distribution plot of Cu concentrations found in hair samples relative to area of residence (Sudbury-area)

Figure 14.4c Distribution plot of Cu concentrations found in hair samples relative to area of residence (Sudbury core relative to Copper Cliff smelter)
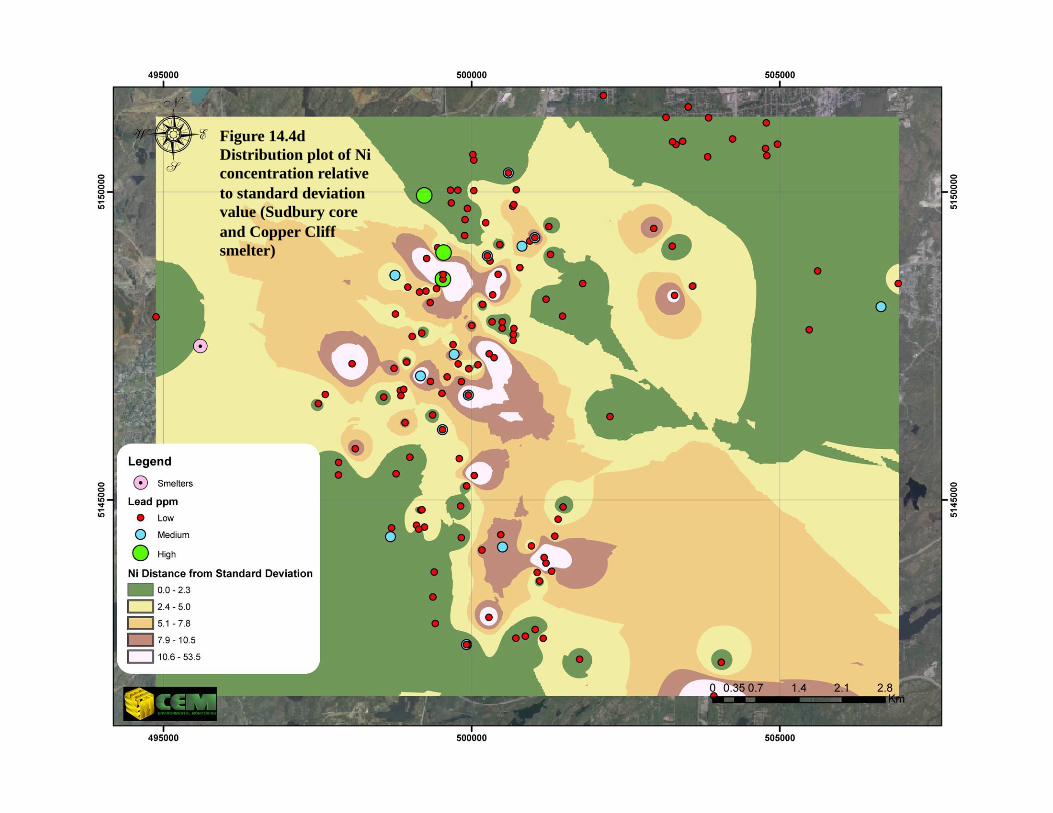
Figure 14.4d Distribution plot of Ni concentration relative to standard deviation value (Sudbury core and Copper Cliff smelter)
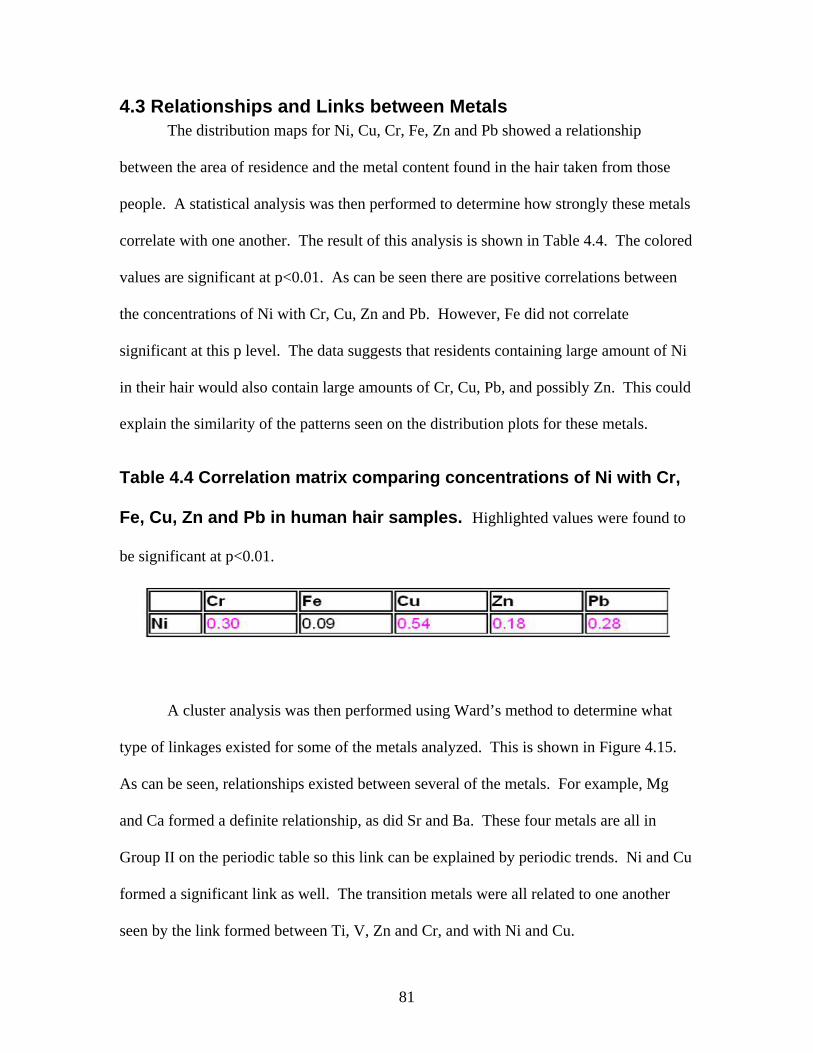
81
4.3 Relationships and Links between Metals The distribution maps for Ni, Cu, Cr, Fe, Zn and Pb showed a relationship
between the area of residence and the metal content found in the hair taken from those
people. A statistical analysis was then performed to determine how strongly these metals
correlate with one another. The result of this analysis is shown in Table 4.4. The colored
values are significant at p<0.01. As can be seen there are positive correlations between
the concentrations of Ni with Cr, Cu, Zn and Pb. However, Fe did not correlate
significant at this p level. The data suggests that residents containing large amount of Ni
in their hair would also contain large amounts of Cr, Cu, Pb, and possibly Zn. This could
explain the similarity of the patterns seen on the distribution plots for these metals.
Table 4.4 Correlation matrix comparing concentrations of Ni with Cr,
Fe, Cu, Zn and Pb in human hair samples. Highlighted values were found to
be significant at p<0.01.
A cluster analysis was then performed using Ward’s method to determine what
type of linkages existed for some of the metals analyzed. This is shown in Figure 4.15.
As can be seen, relationships existed between several of the metals. For example, Mg
and Ca formed a definite relationship, as did Sr and Ba. These four metals are all in
Group II on the periodic table so this link can be explained by periodic trends. Ni and Cu
formed a significant link as well. The transition metals were all related to one another
seen by the link formed between Ti, V, Zn and Cr, and with Ni and Cu.

82
Tree Diagram for 16 Variables
Single Linkage
1-Pearson r
0.2 0.3 0.4 0.5 0.6 0.7 0.8 0.9
Linkage Distance
Mn55_ppm
Fe57_ppm
Pb207_ppm
Cu63_ppm
Ni60_ppm
Al27_ppm
Cr52_ppm
Zn66_ppm
V51_ppm
Ti49_ppm
Ba137_ppm
Sr88_ppm
Ca43_ppm
Mg26_ppm
Cd111_ppm
B11_ppm
Figure 4.15 Tree diagram using Ward’s method and Pearson’s
correlation for cluster analysis of correlation patterns (STATISTICA®).
The cluster analysis and correlation matrix led to the comparison by the metal
content for a variety of communities.
4.4 The Effect of Residence on Metal Content All sample data was sorted according to town and city name, which was asked for
on the questionnaire and corresponded to the postal code coordinates used to create the
distribution maps. A few communities were then selected, based on proximity to
Sudbury and number of samples taken from those residents, to create small subsets of
data. Each subset had its mean and standard deviation calculated for the metals analyzed.

83
From these subsets, data for Ni, Cu, Cr, Fe, Zn and Pb was used and these values are
shown in the tables below. A graph was then plotted using the percentage difference
values. This was calculated first dividing each metal concentration mean for a
community by the total population mean (those who provided questionnaire data) and
multiplying by 100. These percentages were then plotted. This first plot is shown in
Figure 4.16.
Table 4.5 Mean and standard deviation for six important metals found
in the entire population of hair samples (N=504).
Cr Fe Ni Cu Zn Pb Mean (ppm) 2.29 19.2 3.89 32.6 161 2.18 Std. Dev (ppm) 2.36 37.6 8.57 51.6 98.6 8.96
Table 4.6 Mean and standard deviation for six important metals found
in the hair samples of Azilda residents (n=6).
Cr Fe Ni Cu Zn Pb Mean (ppm) 1.91 12.6 0.470 16.5 163 0.199 Std. Dev (ppm) 1.08 6.17 0.851 12.3 121 0.487
Table 4.7 Mean and standard deviation for six important metals found
in the hair samples of Chelmsford residents (n=8).
Cr Fe Ni Cu Zn Pb Mean (ppm) 2.21 18.5 0.243 32.0 218 1.74 Std. Dev (ppm) 0.46 7.56 0.457 26.1 53.3 1.87

84
Table 4.8 Mean and standard deviation for six important metals found
in the hair samples of Elliot Lake residents (n=22)
Cr Fe Ni Cu Zn Pb Mean (ppm) 1.95 10.3 0.475 10.1 123 1.15 Std. Dev (ppm) 1.00 4.60 0.438 7.65 68.0 2.15
Table 4.9 Mean and standard deviation for six important metals found
in the hair samples of Sudbury residents (n=232).
Cr Fe Ni Cu Zn Pb Mean (ppm) 2.46 21.3 5.04 31.9 164 2.73 Std. Dev (ppm) 2.84 46.4 10.0 43.3 104 11.1
Table 4.10 Mean and standard deviation for six important metals
found in the hair samples of Toronto-area residents (n=7)
Cr Fe Ni Cu Zn Pb Mean (ppm) 1.42 9.37 0.573 13.6 111 0.333 Std. Dev (ppm) 0.762 4.29 0.728 10.0 71.6 0.569
As can be seen in Figure 4.16, samples taken from Sudbury typically had
concentrations in hair that were greater than the population mean, for the six metals that
have been discussed in the previous section. In contrast, samples for Toronto and
surrounding areas had concentrations that were significantly lower than the population
mean. Of particular interest was the content of both Ni and Cu, both found in dust
emissions of smelters (Figure 5 in DISCUSSION). Toronto had on average 12-fold
lower concentrations of Ni than Sudbury did. Moreover, samples from Toronto had 5-
fold lower concentrations of Cu, on average, than Sudbury did. This may suggest a

85
significant contribution by smelter emissions. However, the urban effect should not be
ignored since the content of Cr in Toronto, although lower than Sudbury, was highest
amount the six metals for that region. Another interesting value was the high
concentration of Cu in Chelmsford.
To determine how strong the influence of smelter emissions may be a second plot
was produced using the Sudbury mean values as the baseline (Figure 4.17). Immediately
it can be seen that these communities had significantly lower concentrations of Fe, Ni,
Cr, and Pb than Sudbury samples. However, the content of Zn and Cu was significantly
higher in Chelmsford samples than in Sudbury’s samples. Overall the data does suggest
a significant contribution for environmental exposure such as soils, smelter emissions,
and other pollutants on the metal content in hair. However, this study did not set out to
pinpoint the source for the increased metal content in Sudbury-area residents relative to
other cities. The environment was only examined as a whole.

86
Trace metal content in hair from residents of selected communities
-100%
-80%
-60%
-40%
-20%
0%
20%
40%
Cr Fe Ni Cu Zn Pb
Trace Metal
% D
iffe
ren
ce f
rom
Po
pu
lati
on
Mea
n
Azilda
Chelmsford
Elliot Lake
Sudbury
Toronto-area
Figure 4.16 The variation in metal content in hair samples of
residents from Sudbury and surrounding communities (as
percentage difference from population mean).
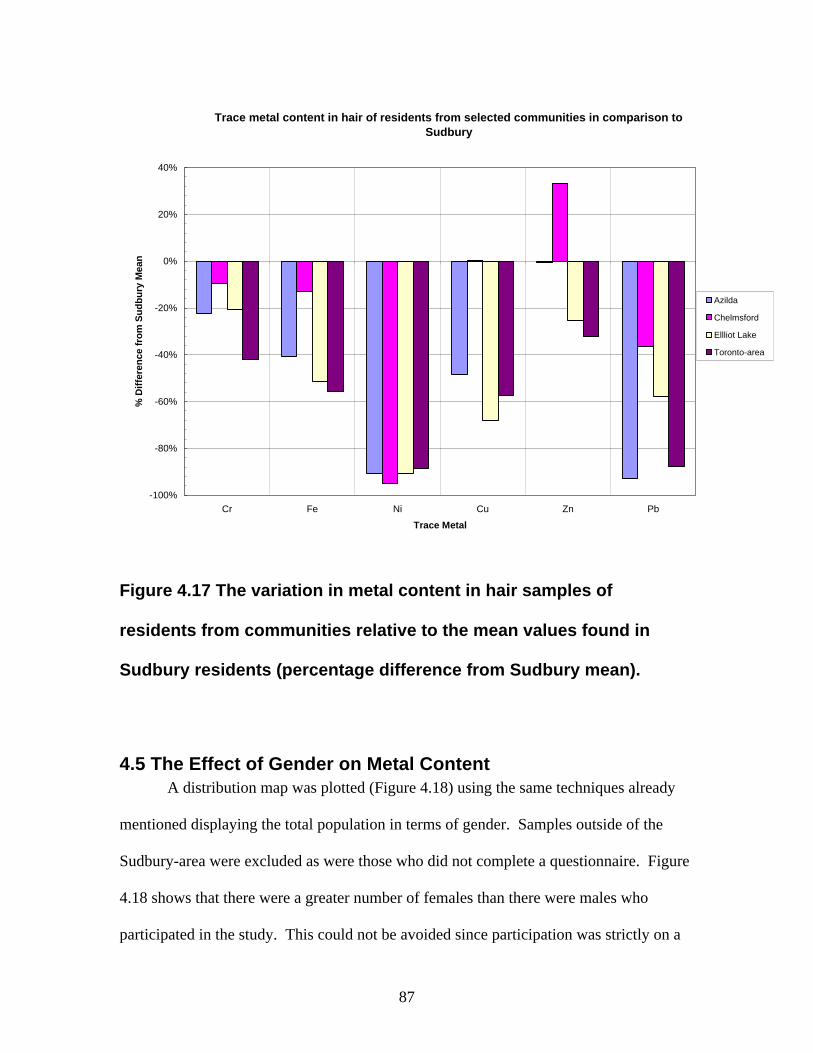
87
Trace metal content in hair of residents from selected communities in comparison to Sudbury
-100%
-80%
-60%
-40%
-20%
0%
20%
40%
Cr Fe Ni Cu Zn Pb
Trace Metal
% D
iffe
ren
ce f
rom
Su
db
ury
Mea
n
Azilda
Chelmsford
Ellliot Lake
Toronto-area
Figure 4.17 The variation in metal content in hair samples of
residents from communities relative to the mean values found in
Sudbury residents (percentage difference from Sudbury mean).
4.5 The Effect of Gender on Metal Content A distribution map was plotted (Figure 4.18) using the same techniques already
mentioned displaying the total population in terms of gender. Samples outside of the
Sudbury-area were excluded as were those who did not complete a questionnaire. Figure
4.18 shows that there were a greater number of females than there were males who
participated in the study. This could not be avoided since participation was strictly on a
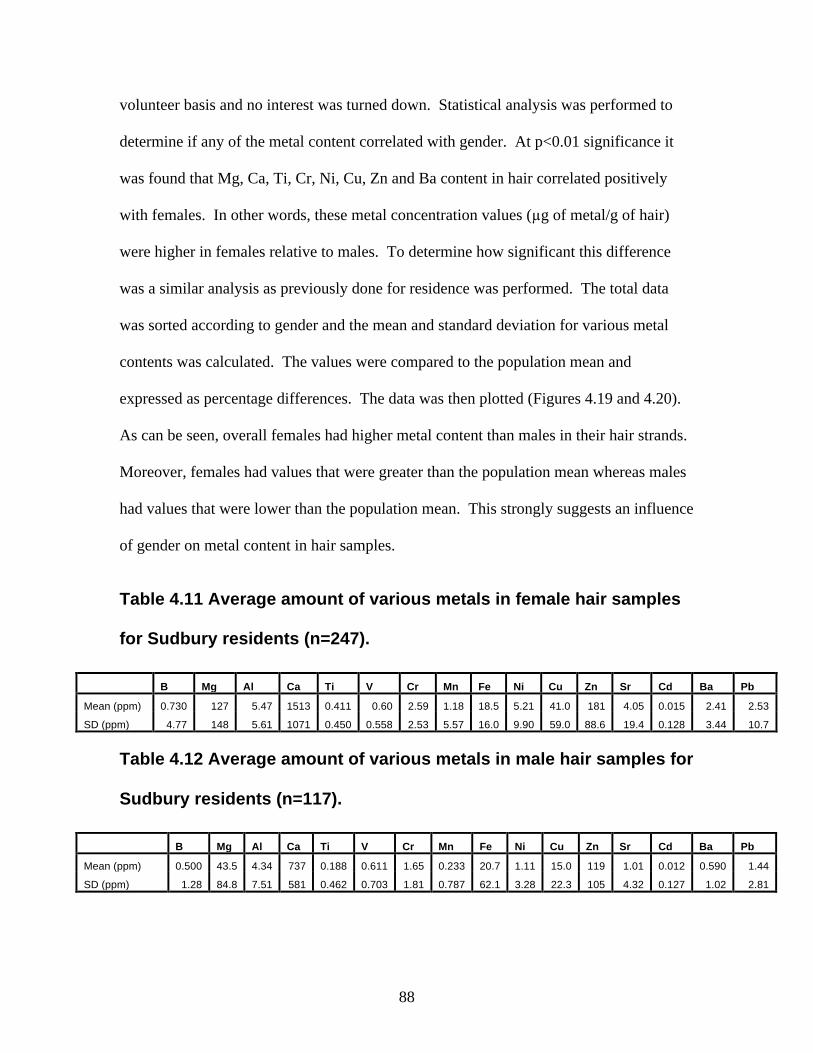
88
volunteer basis and no interest was turned down. Statistical analysis was performed to
determine if any of the metal content correlated with gender. At p<0.01 significance it
was found that Mg, Ca, Ti, Cr, Ni, Cu, Zn and Ba content in hair correlated positively
with females. In other words, these metal concentration values (µg of metal/g of hair)
were higher in females relative to males. To determine how significant this difference
was a similar analysis as previously done for residence was performed. The total data
was sorted according to gender and the mean and standard deviation for various metal
contents was calculated. The values were compared to the population mean and
expressed as percentage differences. The data was then plotted (Figures 4.19 and 4.20).
As can be seen, overall females had higher metal content than males in their hair strands.
Moreover, females had values that were greater than the population mean whereas males
had values that were lower than the population mean. This strongly suggests an influence
of gender on metal content in hair samples.
Table 4.11 Average amount of various metals in female hair samples
for Sudbury residents (n=247).
B Mg Al Ca Ti V Cr Mn Fe Ni Cu Zn Sr Cd Ba Pb
Mean (ppm) 0.730 127 5.47 1513 0.411 0.60 2.59 1.18 18.5 5.21 41.0 181 4.05 0.015 2.41 2.53
SD (ppm) 4.77 148 5.61 1071 0.450 0.558 2.53 5.57 16.0 9.90 59.0 88.6 19.4 0.128 3.44 10.7
Table 4.12 Average amount of various metals in male hair samples for
Sudbury residents (n=117).
B Mg Al Ca Ti V Cr Mn Fe Ni Cu Zn Sr Cd Ba Pb
Mean (ppm) 0.500 43.5 4.34 737 0.188 0.611 1.65 0.233 20.7 1.11 15.0 119 1.01 0.012 0.590 1.44
SD (ppm) 1.28 84.8 7.51 581 0.462 0.703 1.81 0.787 62.1 3.28 22.3 105 4.32 0.127 1.02 2.81
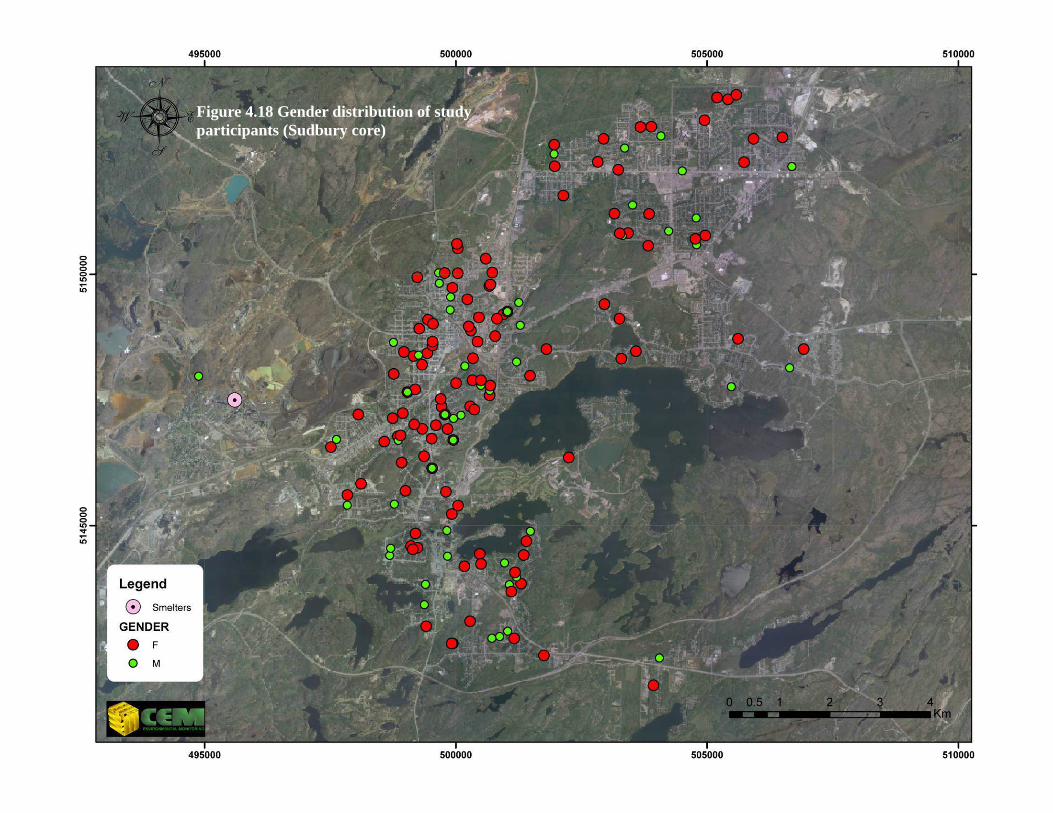
Figure 4.18 Gender distribution of study participants (Sudbury core)

90
Effect of Gender on Metal Content
0%
20%
40%
60%
80%
100%
120%
140%
160%
B Mg Al Ca Ti V Cr Mn Fe Ni Cu Zn Sr Cd Ba Pb
Trace Metal
Val
ue
of
Po
pu
lati
on
Mea
n
Female % Diff (n=247)
Male % Diff (n=117)
Figure 4.19 Trace metal content in females relative to males (Sudbury
residents) expressed as a percentage value of the population of
participants mean.
The higher content of Mg, Ca and Ba may be explained by periodic trends of
elements in Group II, whereas the higher content of Ti, Cr, Ni, Cu and Zn can also
explained by periodic trends of the transition metals. The tree cluster analysis (Figure
4.15) shows that elements found in the same group show similar concentration trends.
For example, if a hair sample was found to have high concentration of Ca by periodic
trends the sample may also contain high concentrations of Ba and Mg. These trends were

91
already observed to be significant due to linkages calculated using cluster analysis. The
differences may also be attributed to biochemical alterations in males versus females.
Effect of Gender on Metal Content
-80%
-60%
-40%
-20%
0%
20%
40%
B Mg Al Ca Ti V Cr Mn Fe Ni Cu Zn Sr Cd Ba Pb
Trace Metal
% D
iffe
ren
ce f
rom
Po
pu
lati
on
Mea
n
Female % Diff (n=247)
Male % Diff (n=117)
Figure 4.20 Trace metal content in females relative to males (Sudbury
residents) expressed as a percentage difference from the population
of participants mean values.

92
4.6 The Effect of Natural Hair Color on Metal Content Previous studies had shown a relationship between the natural color of hair and
the concentration of metals. In fact, some studies found that darker hair colors (black and
red) contained more Ni and Cu than lighter hair colors, such as brown and blond (Sturaro
et al. 1994). To determine if there was a significant difference relative to the total
population mean a similar analysis to that used for both gender and residence, was
performed. The data was sorted according to color of hair and samples out side of
Sudbury were excluded and were those who did not complete a questionnaire.
Percentage differences were calculated relative to the population mean and the subsets
were plotted. These plots are shown in Figures 4.21 and 4.22. No single color stood out,
however there were a few interesting events seen. Persons with black hair contained
significantly higher amounts of B, Fe, Cd, Pb and Al relative to the population mean.
Those with gray hair had significantly higher amounts of Cd and Sr. With the exception
of Pb, participants with either blonde or red hair contained significantly lower amounts of
the various metals analyzed. Blonde hair participants did have higher amounts of Pb
relative to the population mean. Since a significant portion of the population contained
brown hair, these values strongly contributed to the population mean and hence did not
differ significantly.
Table 4.13 Average amount of various metals in Sudbury residents
with natural black hair (n=26).
B Mg Al Ca Ti V Cr Mn Fe Ni Cu Zn Sr Cd Ba Pb Mean (ppm) 3.06 36.8 5.66 841 0.078 0.547 1.67 0.501 37.6 0.586 13.3 114 0.874 0.0443 0.592 2.47 Std. Dev (ppm) 14.3 26.9 13.9 640 0.228 0.568 1.15 1.25 127 1.13 21.4 87.9 1.33 0.230 1.00 6.61

93
Table 4.14 Average amount of various metals in Sudbury residents
with natural brown hair (n=259).
B Mg Al Ca Ti V Cr Mn Fe Ni Cu Zn Sr Cd Ba Pb Mean (ppm) 0.412 107 4.92 1313 0.375 0.630 2.30 0.913 17.7 4.31 35.9 168 3.40 0.0128 1.99 1.66 Std. Dev. (ppm) 0.770 140 4.89 998 0.467 0.616 2.53 5.34 16.1 9.17 57.9 99.8 18.9 0.128 3.31 3.20
Table 4.15 Average amount of various metals in Sudbury residents
with natural blonde hair (n=58)
B Mg Al Ca Ti V Cr Mn Fe Ni Cu Zn Sr Cd Ba Pb Mean (ppm) 0.483 95.0 5.77 1260 0.317 0.570 2.31 0.806 18.8 4.10 30.8 152 2.36 0.0095 1.73 4.85 Std. Dev. (ppm) 0.917 104 6.96 1062 0.512 0.622 1.70 1.53 17.6 8.63 34.6 98.3 3.98 0.073 2.37 20.75
Table 4.16 Average amount of various metals in Sudbury residents
with natural gray hair (n=8).
B Mg Al Ca Ti V Cr Mn Fe Ni Cu Zn Sr Cd# Ba Pb Mean (ppm) 2.13 70.4 5.91 980 0.366 0.491 4.15 0.629 19.0 1.99 17.5 195 5.63 0 1.42 0.498 Std. Dev. (ppm) 3.08 55.1 5.73 525 0.455 0.593 3.72 0.886 13.7 2.75 10.0 71.1 14.6 0 1.97 0.843
Table 4.17 Average amount of various metals in Sudbury residents
with natural red hair (n=7).
B Mg Al Ca Ti V Cr Mn Fe Ni Cu Zn Sr Cd# Ba Pb Mean (ppm) 0.177 45.8 3.99 895 0.352 0.451 1.56 2.38 12.9 1.17 20.1 119 1.13 0 1.34 0.754 Std. Dev. (ppm) 0.316 54.5 3.75 626 0.464 0.441 1.02 6.24 8.10 1.63 17.2 90.1 1.60 0 1.89 1.24
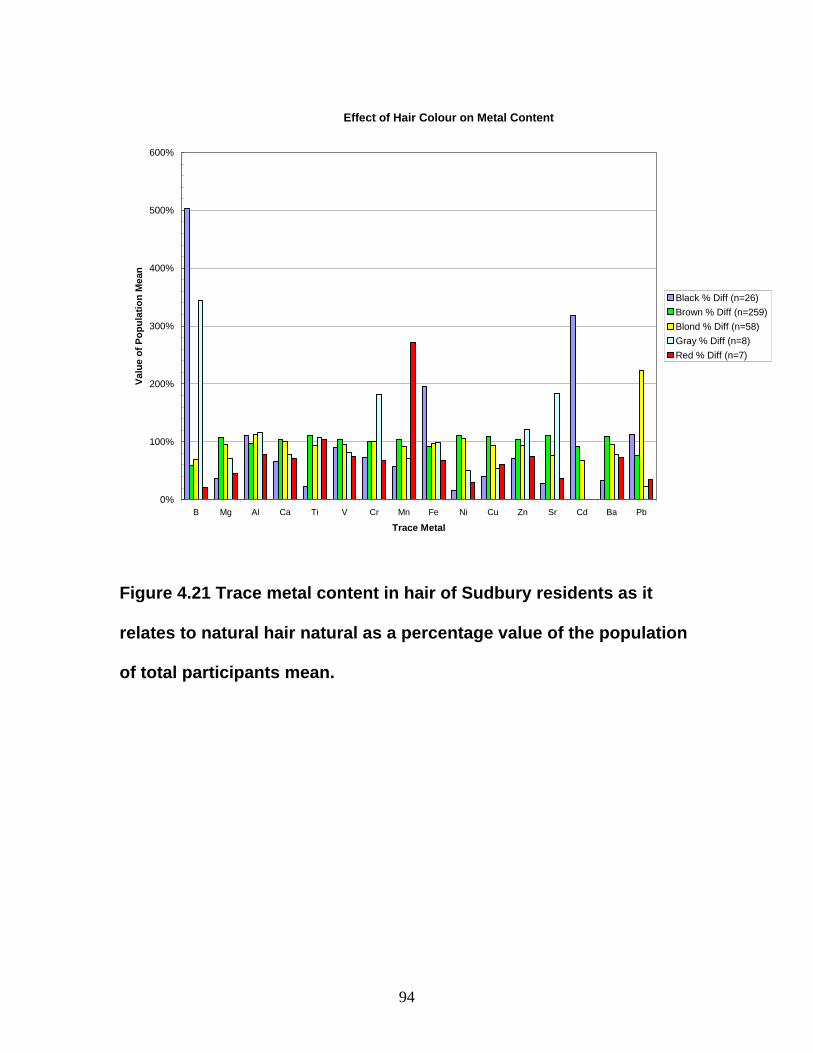
94
Effect of Hair Colour on Metal Content
0%
100%
200%
300%
400%
500%
600%
B Mg Al Ca Ti V Cr Mn Fe Ni Cu Zn Sr Cd Ba Pb
Trace Metal
Val
ue
of
Po
pu
lati
on
Mea
n
Black % Diff (n=26)
Brown % Diff (n=259)
Blond % Diff (n=58)
Gray % Diff (n=8)
Red % Diff (n=7)
Figure 4.21 Trace metal content in hair of Sudbury residents as it
relates to natural hair natural as a percentage value of the population
of total participants mean.
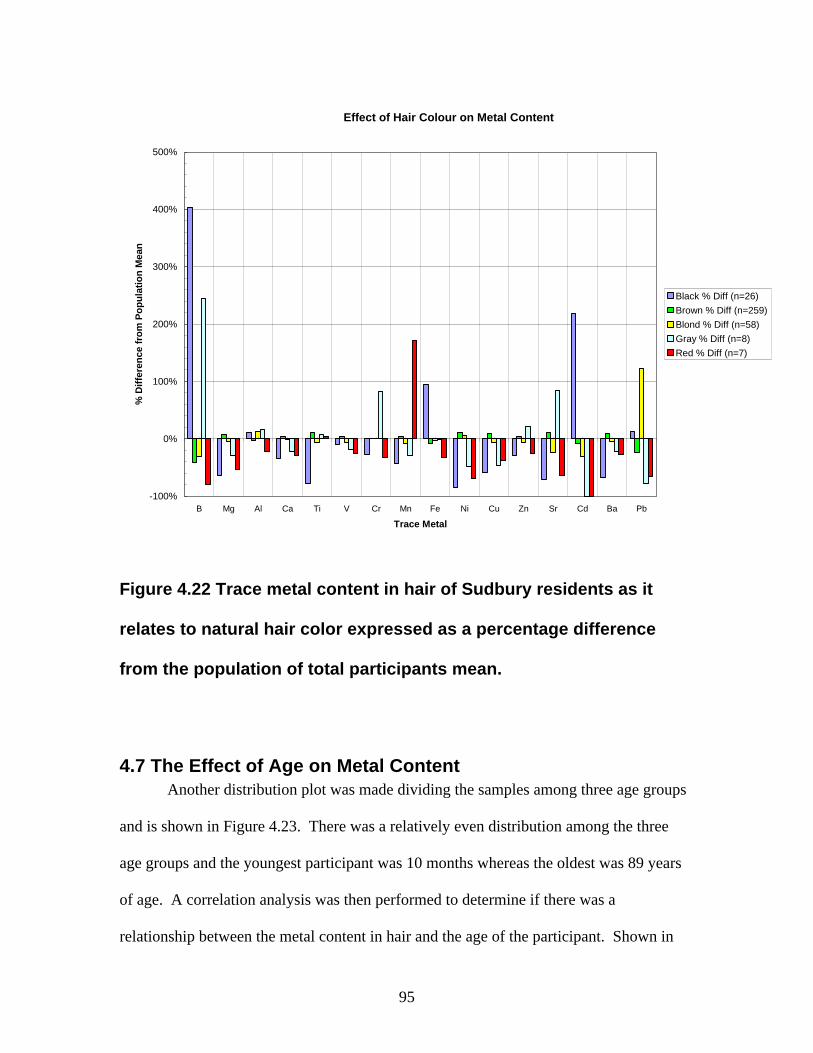
95
Effect of Hair Colour on Metal Content
-100%
0%
100%
200%
300%
400%
500%
B Mg Al Ca Ti V Cr Mn Fe Ni Cu Zn Sr Cd Ba Pb
Trace Metal
% D
iffe
ren
ce f
rom
Po
pu
lati
on
Mea
n
Black % Diff (n=26)
Brown % Diff (n=259)
Blond % Diff (n=58)
Gray % Diff (n=8)
Red % Diff (n=7)
Figure 4.22 Trace metal content in hair of Sudbury residents as it
relates to natural hair color expressed as a percentage difference
from the population of total participants mean.
4.7 The Effect of Age on Metal Content Another distribution plot was made dividing the samples among three age groups
and is shown in Figure 4.23. There was a relatively even distribution among the three
age groups and the youngest participant was 10 months whereas the oldest was 89 years
of age. A correlation analysis was then performed to determine if there was a
relationship between the metal content in hair and the age of the participant. Shown in

96
Table 4.18, it can be seen there was a correlation between the amount of Mg and the
participant’s age (significant at p<0.01). This suggests as a person ages the content of
Mg will increase in hair strands. At p<0.05 significance correlations with Cr and Cu
were also seen. However, it was a negative correlation with Cu suggesting as the person
ages the content of Cu would decrease. This is a similar result found in other studies and
was also demonstrated in the hair color plot. Interestingly participants with gray hair,
assuming they are older individuals, contained higher amounts of Cr and lower amounts
of Cu relative to the population mean. However, the concentration of Mg was actually
lower in gray hair relative to the population mean
Table 4.18 Correlation analysis for the relationship between metal
content in hair and age of person at p<0.01 (N=366). Highlighted value
was found to be significant at p<0.01 (STATISTICA®).

Figure 4.23 Age distribution of study participants (Sudbury core)

98
4.8 Health Status and Metal Content in Hair Interest has built tremendously over the years for the use of hair analysis for
preliminary diagnosis of a variety of diseases, including those that afflict the heart and as
well as cancer. On the questionnaire, each participant was asked to detail their health
status. This was part of a question which asked if a physician had ever diagnosed any of
a variety of diseases listed. These responses were then correlated with the metal
concentrations found in their hair strands. Once again using statistical software several
interesting patterns were found:
• Correlation between the amount of Cr in hair and cancer (significant at p < 0.01).
• Correlation between the amount of Cr in hair and heart disease + hypertension
(significant at p < 0.01).
• Correlation between the amount of Sr and Ba in hair and hypertension (significant
at p < 0.01).
• Correlation between the amount of Pb in hair and whether or not subject is a
smoker (significant at p < 0.05).
• Correlation between the amount of Al in hair and length of smoking period
(significant at p < 0.05).
• For those who selected gray as their natural hair color, there was a correlation
with bone metabolism disorders (significant at p<0.01). Moreover, there was also
a correlation with Ni (significant at p<0.01), which has been found to be involved
in certain heart ailments.
• For those who selected blonde as their natural hair color there was also a
correlation with bone metabolism disorders (significant at p<0.01).

99
• Males had a correlation between the concentration of V and the prevalence of
cancer (significant at p<0.01).
• Males had a correlation between the concentration of B and the prevalence of
diabetes (significant at p<0.01).
• Males had a correlation between the concentration of B, Ti, V, Cr and Zn and the
prevalence of epilepsy (significant at p<0.01).
• Male smokers displayed a correlation with the concentration of Mn in their hair
(significant at p<0.01). Suggesting male smokers had higher Mn content than
female smokers.
Unfortunately because of relatively few sample numbers in the various age classes the
above relationships must be taken as preliminary.

100
5. DISCUSSION The hair sample analysis found that the average concentrations for Ni, Cu, Fe and
Zn were significantly lower than those found in 1975 study (Goldsack et al. 1975). The
difference may be a result of the 95% reduction in smelter emissions in the Sudbury
region (Figure 5). Since 1975, INCO and Falconbridge have implemented a great deal of
standards and techniques to significantly reduce the amount of gaseous dust emissions
produced by the smelter stacks. In fact, in 1975 there was approximately 1500 tonnes of
dust emission produced by INCO alone but this dropped to nearly 500 tonnes by 1999. A
reduction of this magnitude could explain the smaller concentration values found in this
study. This study then shows that the clean-up effort by industry may have done a great
deal to reduce the amount of metal contamination in human hair samples of Sudbury-area
residents. However, other factors may also play a role. For example, metals in soil dust
may have also decreased since 1975. So it must be determined if the principal
environmental contributor is the emissions from the smelter, dust from the soil, or
ingestion of foodstuffs or drinking water.
Moreover, the urban effect must also be examined. Although this study did find a
relationship between distance from the smelter emissions and metal content in hair, the
higher concentration samples in the city core could also be explained by greater number
of pollutants in this area relative to the more rural areas. In fact, areas East of Sudbury
had more samples in the low concentration range. A logical next step would be to
compare the levels of pollutants in the air from various regions of Sudbury and
surrounding areas and compare to rural areas. Additionally, samples could be taken from
more populated cities like Toronto and Ottawa for comparison.

101
The medium to high concentration points for Cr found in the city core are
interesting since this metal is not found in any of the dust emissions. Furthermore,
samples from Toronto also had medium to high concentrations of Cr suggesting further
evidence for the urban effect. In fact, this study found high concentration points of Cr in
regions of Sudbury that had denser populations. However, the concentration of metals in
Toronto-area residents was generally lower than those of Sudbury-area residents.
The Falconbridge and Coniston smelters did not appear to contribute
significantly. This may be due to the relatively smaller number of samples from regions
adjacent to these operations. A larger sample size should be obtained from these areas to
further prove there is little contribution from these smelters.
Overall, this study found that persons residing down-wind from the Copper Cliff
smelter did have significantly higher amounts of Ni, Cu, and Fe relative to those found
further away.
Of the areas consisting of Sudbury and the smaller surrounding communities, the
former had concentrations of Ni, Cu, Cr, Pb, Fe and Zn which were significantly higher
than the overall population mean, of those analyzed. An interesting phenomenon was
seen for Cu. The concentration of Cu in hair of Chelmsford residents, upon outlier
exclusion, was almost equal to that found in Sudbury residents. Yet the content of Ni
was significantly lower relative to Sudbury residents.

102
Figure 5 Amount of dust emissions containing Cu and Ni from the
Copper Cliff smelter over the past 30 years (courtesy Dr. G. A.
Spiers).
In the study by Goldsack et al. (1975) Chelmsford residents had Ni content 50 %
lower than that found in Sudbury, similar to the results of this study, and the Cu content
was equal to the mean value of Sudbury residents. The original discrepancy, where the
Chelmsford Cu mean was nearly 3-fold high than the Sudbury mean, was due to a single
sample which contained a Cu concentration of almost 600 ppm. When this sample is

103
omitted, using outlier exclusion, from the mean calculation the mean reduces to 32 ppm
equal to that of value for Sudbury residents. The high Cu content for this particular
sample may be explained by the corresponding high concentration of Ni. This sample
had the highest Ni content for Chelmsford samples at a value of approximately 33 ppm.
Since Ni and Cu strongly correlate to one another this may explain the high content of
Cu. Another interesting observation was that the majority of the participants with high
concentrations of Cu in Chelmsford were females. This relates directly to the pattern that
was found between gender and metal content, as discussed later.
Chelmsford residents had the highest concentration of Zn in their hair of the
communities compared. This may be related to the metal content in the soils. It has been
shown that areas where Ni and Cu are higher in the soil, there is less Zn. In other words,
there is an inverse relationship between the content of N and Cu versus that Zn content in
soil. For example it has been shown that soils found directly around the Copper Cliff
smelter (high Ni + Cu) have lower concentrations of Zn, while this may explain why
these residents showed such high levels, correlation analysis suggests that Ni and Zn are
positively related to one another in hair samples. Hence, there must be some other factor
influencing this observation.
A weak correlation between the content of Ni and Fe would explain why the hair
samples within the city core did not contain as many medium to high concentration
points, in contrast to the content of both Ni and Cu.
Overall, the results do strongly suggest that area of residence may be a significant
contributor to the metal content in hair samples. This does show that hair can be used as
an environmental biomarker even for possible urbanized effects.
104
Relationships between the metals analyzed existed were indicated by both a
correlation matrix and cluster analysis. The links appeared to be related, in part, to
periodic trends. In fact, Group II elements were found to form strong relationships with
one another suggesting samples showing high concentrations of Mg, for example, would
also show high concentrations of Ba. This may also explain why hair samples with high
concentrations of Ni also had high concentrations of Cu and Cr as they are all transition
metals. The correlation matrix does explain the high concentration of Zn from samples
which contained high concentrations of the other metals (i.e., Ni and Cu).
This study found a significant difference (p<0.01) between gender and the amount
of metals in hair samples. Females had higher amounts of the majority of metals
analyzed than males did, in agreement with other studies that have shown that females
have high concentrations of Cu, Zn, Ni and Mn in their hair relative to males (Sturaro et
al. 1994). Our results also showed that females had higher amounts of those four metals
as well as other elements. The difference can be explained from a biochemical
perspective. Cu has been found to be related to progesterone hormone, which is only
found in females. In fact, a reduction in both Cu and Zn has been linked to reduced
levels of progesterone. This hormone plays a role in proper development of the ovary
and pregnancy. Fe is another metal related to pregnancy and maturation of females.
Women are advised to take Fe supplements, especially during pregnancy and the ages
between 14 and 18 years, to ensure proper development. The increased need for Fe
suggests a greater importance for Fe in the female body than in the male body.
105
Sperm contains high concentrations of Zn, suggesting Zn is excreted more in
males than in females. This fact could account for the significant difference between the
hair samples of males and females, found in this study.
Females were found to have a lower amount of Fe, than males in their hair
samples, possibly related to the menstruation cycle. The cycle involves significant loss
of blood, containing Fe, on a monthly basis. This loss of iron may lead to the lower
concentration of Fe seen in the hair samples and would provide support for the use of hair
to predict levels of metals in the blood. Also the hematocrit value is also smaller in
females than in males (Martini 2004). Hence, the observation leads to the question of
whether or not hair samples can be used to adequately predict the levels of metals found
in the blood.
Another study found that female patients with premenstrual syndrome (PMS) had
lower concentrations of Ca, Cr, Cu and Mn in their hair samples relative to the control
group (Shamberger 2003). This suggests that females undergo significant changes in hair
metal content due to biological changes such as premenstrual syndrome. To account for
these fluctuations the female body must retain a greater reserve of metabolically
important metals and this could further account for the difference seen between genders.
However, another factor may be a difference in nutrition. Some studies have
shown that females with premenstrual syndrome tend to consume a less nutritious diet
than the healthy control group (Abraham and Lubran 1981, Sherwood et al. 1986).
Moreover, pregnant women are advised to consume a diet that differs significantly from
non-pregnant women and even more from males. For example, they are advised to
106
consume foods rich in Fe, Mg and Ca. Assuming nutritional effects can be documented
well with hair analysis, this could also account for the difference between genders.
The current study found a significant correlation between age and the
concentration of Mg, Cr and Cu. Sturaro et al. (1994) showed Cu content tends to
decrease with age, a finding in this study as well, and Zn content in hair tends to increase
with age. The latter finding was not documented in this study. Although a positive
correlation did exist between age and Zn concentration in hair, it was not significant at
either p<0.01 or p<0.05.
Cross-link formation is mediated by a Cu-dependant enzyme called lysyl oxidase.
This process is important for bone metabolism and Cu is required throughout life for the
completion of the bone remodeling cycle (Gur et al. 2002). One explanation for the
decrease in Cu with age may be related to the aforementioned cycle. With age the bone
mineral content tends to decrease and bone breakdown becomes accelerated. This would
then lead to a greater excretion of Cu (i.e., through urination) and could account for the
lower concentration found in the hair samples. The results of this study do show that
metal content in hair is correlated with the person’s age. This may then be related to
health status.
This study found several significant correlations between metal content in hair
and the health of the participant, which provides support for the validity of hair as a
preliminary diagnosis method. One result of interest was the correlation between Cr in
hair and the prevalence of cancer. Cr(VI) has been documented in several studies as a
carcinogen and causes significant damage to the cell when ingested at high quantities. If
a tumor cell were to contain high quantities of Cr(VI) then it would release this into the
107
serum. This could then travel along the circulatory pathway and become deposited in the
scalp. Over time the metal content would accumulate in the hair strands. In males, V in
hair also correlated with prevalence of cancer. However, the toxicological effects of this
metal are suggested to be relatively minor in contrast to Cr(VI).
Another aspect of health status is the low concentration of Fe but high
concentration of Ni found in females posing an interesting question with respect to breast
cancer. Fe, as a co-factor for prolyl hydroxylase, can protect against hypoxia, which
leads to tumor production. However, Ni can mimic Fe and deactivate this enzyme
leading to hypoxia even when adequate amounts of oxygen are present. This Ni-induced
hypoxia promotes glycolysis causing accumulation of lactic acid, an event seen during
tumor production. The question is whether or not the lower concentration of Fe and
higher concentration of Ni may be a factor involved in the prevalence of breast cancer in
Sudbury and surrounding areas. This observation may warrant further investigation, as
this study cannot address that question since this study did not examine any of the
underlying biochemical mechanisms involved in hypoxia and breast cancer development.
The results of our study do provide strong support for the use of hair as a
preliminary diagnosis tool for cancer, hypertension, heart disease, bone metabolism
disorders, disorders that may progress as a result of smoking, and epilepsy. Yet,
significant work still needs to be done. The next logical step would be to obtain samples
from different types of cancer patients and determine how their metal content in hair
correlates. Furthermore, hair samples should be obtained from other patients with other
ailments as well. The health status results can then be related to the nutritional and diet
information. However, food-basket surveys must first be performed before nutrition is
108
examined. These surveys would involve the analysis of different foods for metal content
using ICP-MS. The metal content in foods can then be compared to the number of
servings, and eventually the hair analysis results. The hope is that hair can serve as an
ideal biomarker for deficiencies as well.
6. CONCLUSIONS This study has demonstrated that it is possible to perform a large-scale
epidemiological study comparing a variety of environmental and health factors using hair
samples. Hair can be obtained from persons with little discomfort and has no economical
disadvantage. In fact, this study cost only a fraction of other health risk assessment
studies that are currently being undergone. In addition, the study has produced a large
database of results that can be linked with several potential future projects, and analyzed
and compared for years to come. Using a standardized procedure and the latest analytical
equipment the results obtained provide more than adequate determinations. The patterns
and trends found hold at a variety of statistical methods. Patterns were found linking
metal content in hair to area of residence, age, gender, health status and type of hair.
Moreover, this study found that relative to 30 years ago the concentration of Cu, Fe, Zn
and Ni has decreased considerably. The next step is to expand upon this project to
include a larger sample size, involve patients with a variety of ailments, perform
nutritional analysis, determine the urban effect, correlate the results with soils analysis to
determine the relative contribution of dust, and finally compare short-term versus long-
term exposure using possible blood or urine analysis. This study has laid the foundation

109
to what is an imperative endeavor; to help decipher the benefits and risks of metals on the
human biological system.
7. REFERENCES
Abbas AK, Lichtman AH. 2003. Cellular and Molecular Immunology. Fifth Edition.
Saunders. Philidelphia, PA.
Abbracchio MP, Simmons-Hansen J, Costa M. 1982. Cytoplasmic dissolution of
phagocytized crystalline nickel sulfide particles: a prerequisite for nuclear uptake of
nickel. J Toxicol Environ Health. 9:663-76.
Abraham GE and Lubran MD. 1981. Serum and red cell magnesium level in patients with
premenstrual tension. Am. J. Clin. Sci. 34:2364-2366.
Alberts B et al. 2002. Molecular Biology of the Cell. Fourth Edition. Garland Science
Althausen TL, Gunther L. 1929. Acute arsenic poisoning: a report of seven cases and a
study of arsenic excretion with especial reference to hair. JAMA. 82:2002-06.
Baltaci AK, Mogulkoc R, Kul A, Bediz CS, Ugur A. 2004. Opposite effects of zinc and
melatonin on thyroid hormones in rats. Toxicology. 195(1):69-75.

110
Bass DA, Hickok D, Quig D, Urek K. 2001. Trace element analysis in hair: factors
determining accuracy, precision, and reliability. Alt Med Rev. 6(5):472-81
Bencko V. 1995. Use of human hair as a biomarker in the assessment of exposure to
pollutants in occupational and environmental settings. Toxicology. 101:29-39.
Beyersmann D. 2002. Effects of carcinogenic metals on gene expression. Toxicol Letters.
127:63-8.
Billoni N, Buan B, Gautier B, Gaillard O, Mahe YF, Bernard BA. 2000. Thyroid
hormone receptor beta-1 is expressed in the human hair follicle. Br J Dermatol.
142(3):645-52.
Boden et al. 1996. Effects of vanadyl sulfate on carbohydrate and lipid metabolism in
patients with non-insulin dependant diabetes mellitus. Metabolism. 45:1130-1135.
Browning et al. 1998. Reduced food intake in zinc deficient rats is normalized by
magestrol acetate but not by insulin like growth factor-1. J. Nutr. 128:136-142.
Cangul H. et al. 2002. Enhanced over expression of an HIF-1/Hypoxia-Related protein in
cancer cells. Environ. Health. Pers. 110(5):783-88.
111
Cartana J, Arola L. 1992. Nickel-induced hyperglycemia: the role of insulin and
glucagon. Toxicology. 71(1-2):181-92.
Cavdar AO, Bahceci M, Akar N, Dincer FN, Erten J. 1991. Maternal hair zinc
concentration in neural tube defects in Turkey. Biol Trace Elem Res. 30(1):81-5.
Cavigelli M, Li WW, Lin A, Su B, Yoshoka K, Karin M. 1996. The tumor promoter
arsenite stimulates AP-1 activity by inhibiting JNK phosphatase. EMBO J. 15:6269-79.
Chai F, Truong-Tran AQ, Ho LH, Zalewski PD. 1999. Regulation of caspase activation
and apoptosis by cellular zinc fluxes and zinc deprivation: A review. Immunol Cell Biol.
77(3):272-8.
Chakrabarti SK, Bai C, Subramanian KS. 1999. DNA-Protein crosslinks induced by
nickel compounds in isolated rat renal cortical cells and its antagonism by specific amino
acids and magnesium ion. Toxicol Appl Pharmacol. 154:245-255.
Chakrabarti SK, Bai C, Subramanian KS. 2001. DNA-protein crosslinks induced by
nickel compounds in isolated rat lymphocytes: role of reactive oxygen species and
specific amino acids. Toxicol Appl Pharmacol. 170(3):153-65
Chang H-W, Yen C-Y, Liu S-Y, Singer G, Shih I-M. 2002. Genotype analysis using
human hair shaft. Cancer Epidemiology, Biomarkers and Prevention. 11:925-9.
112
Chatterjee J, Mukherjee BB, De K, Das AK, Basu SK. 1994. Trace metal levels in x-ray
technicians' blood and hair. Biol Trace Elem Res. 46:211-27.
Chen CC, Lamping KG, Nuno DW, Barresi R, Prouty SJ, Lavoie JL, Cribbs LL, England
SK, Sigmund CD, Weiss RM, Williamson RA, Hill JA, Campbell KP. 2003. Abnormal
coronary function in mice deficient in alpha1H T-type Ca2+ channels. Science.
302(5649):1416-18.
Christodoulopoulos G, Roubies N, Karatzias H, Papasteriadis A. 2003. Selenium
concentration in blood and hair of holstein dairy cows. Biol Trace Elem Res. 91:145-150.
Coen N, Mothersill C, Kadhim M, Wright EG. 2001. Heavy metals of relevance to
human health induce genomic instability. J Pathol. 195(3):293-9.
Costa M. 1991. Molecular mechanisms of nickel carcinogenesis. Annu Rev Pharmacol
Toxicol. 31:321-27.
Costa M, Mollenhauser HH. 1980. Carcinogenic activity of particulate nickel compounds
are proportional to their cellular uptake. Science. 209:515-17.
Costa M, Salnikow K, Cosentino S, Klein CV, Huang X and Zhuang Z. 1994. Molecular
mechanisms of nickel carcinogenesis. Environ Health Perspect 103(3):127-30.

113
Credille KM, Slater MR, Moriello KA, Nachreiner RF, Tucker KA, Dunstan RW. 2001.
The effects of thyroid hormones on the skin of beagle dogs. J Vet Intern Med. 15(6):
539- 46.
Ding et al. 1999. Vanadate-induced activation of activator protein-1 role of reactive
oxygen species. Carcinogenesis. 20:663-668.
Doorn PF, Mirra JM, Campbell PA, Amstutz HC. 1996. Tissue reaction to metal on metal
hip prostheses. Clin. Orthop. 329:S187–S205.
Doretto MC et al. 2002. Zinc, magnesium and copper profiles in three experimental
models of epilepsy. Brain Res. 956:166-172.
Engelhard A, Christiano AM. 2004. The hairless promoter is differentially regulated by
thyroid hormone in keratinocytes and neuroblastoma cells. Exp Dermatol. 13(4):257-64.
Foo SC, Khoo NY, Heng A, Chua LH, Chia SE, Ong CN, Ngim CH, Jeyaratnam J. 1993.
Metals in hair as biological indices for exposure. Int Arch Occup Environ Health.
65(1):S83-6.
Fraker PJ, King LE. 2004. Reprogramming of the immune system during zinc deficiency.
Annu. Rev. Nutr. 24:277-298

114
Goldsack DE and Nieboer E. 1975. Nickel content of human hair as an index of
environmental exposure to nickel in the Sudbury region. Laurentian U. Research Project
(unpublished).
Goodpaster JV, Drumheller BC, Benner BA Jr. 2003. Evaluation of extraction techniques
for the forensic analysis of human scalp hair using gas chromatography/mass
spectrometry (GC/MS). J Forensic Sci. 48(2):299-306.
Guidotti TL, Audette RJ, Martin CJ. 1997. Interpretation of the trace metal analysis
profile for patients occupationally exposed to metals. Occup. Med. (Lond.) 47:497-503.
Gunaratnam M, Grant MH. 2004. Damage to F-actin and cell death induced by chromium
VI and nickel in primary monolayer cultures of rat hepatocytes. Toxicol. Virol. 18:245-
253.
Gupta S, Ahmad N, Husain MM, Srivastava RC. 2000. Involvement of nitric oxide in
nickel-induced hyperglycemia in rats. Nitric Oxide. 4(2):129-38.
Gur et al. 2002. The role of trace minerals in the pathogenesis of postmenopausal
osteoporosis and a new effect of calcitonin. J. Bone Miner. Metab. 20:39-43.
Hac E, Krechniak J, Szyaszko M. 2002. Selenium levels in human plasma and hair in
Northern Poland. Biol Trace Elem Res. 85:277-285.

115
Ho E. 2004. Zinc deficiency, DNA damage and cancer risk. J. Nutr. Biochem. 15:572-
578.
Huang BX, Lin SQ, Chen SY, Zhou G, Yin F, Lou ZP, Bi MM. 1991. Hair chromium
levels in patients with vascular diseases. Biol Trace Elem Res. 29(2):133-7.
Ilhan et al. 1999. Serum and hair metal levels in patients with epilepsy and healthy
subjects: does the antiepileptic treatment affect the element concentrations in hair? Eur. J
Neu. 6:705-709
Jaspers et al. 1999. Arsenite exposure of cultured airway epithelial cells activates kappa
B-independent interleukin-8 gene expression in the absence of nuclear factor kappa-B
nuclear translocation. J. Biol. Chem. 274:31025-31033.
Jean D, Harbison M, McConkey DJ, Ronai Z, Bar-Eli M. 1998. CREB and its associated
proteins act as survival factors for human melanoma cells. J Biol Chem. 273(38):24884-
90.
Killic E et al. 2004. Chromium and manganese levels in scalp hair of normals and
patients with breast cancer. Biol. Trace Elem. Res. 102(1-3):19-26.

116
Kowara R, Salnikow K, Diwan BA, Bare RM, Waalkes MP, Kasprzak KS. 2004.
Reduced Fhit protein expression in nickel-transformed mouse cells and in nickel-induced
murine sarcomas. Mol Cell Biochem. 255(1-2):195-202.
Kwong WT, Friello P, Semba RD. 2004. Interactions between iron deficiencies and lead
poisoning: epidemiology and pathogenesis. Sci. Tot. Envir. 330:21-37
Li J et al. 2004. Nickel compounds act through phosphatidylinositol-3-kinase/Akt-
Dependant, p70s6k-Independent pathway to induce hypoxia inducible factor
transactivation and Cap43 expression in mouse epidermal c131 cells. Canc. Res. 64:94-
101.
Man AC, Zheng YH, Mak PK. 1996. Trace elements in scalp hair of professional drivers
and university teachers in Hong Kong. Biol Trace Elem Res. 53:241-47.
Martini FH. 2004. Fundamentals of Anatomy and Physiology. Sixth Edition.
Pearson/Benjamin Cummings.
Mukherjee et al. 2004. Vanadium an element of atypical biological significance. Toxicol.
Lett. 150:135-145.
Oller AR. 2002. Respiratory carcinogenicity assessment of soluble nickel compounds.
Environ Health Perspect 110(5):841-44.

117
Puchyr RF, Bass DA, Gajewski R, Calvin M, Marquardt W, Urek K, Druyan ME,
Quig D. 1998. Preparation of hair for measurement of elements by inductively coupled
plasma-mass spectrometry (ICP-MS). Biol Trace Elem Res. 62(3):167-82.
Riley MR, Boesewetter DE, Kim AM, Sirvent FP. 2003. Effects of metals Cu, Fe, Ni, V,
and Zn on rat lung epithelial cells. Toxicology. 190(3):171-84.
Rush E, Li L, Chandu V, Whiting R. 2003. Hair zinc concentrations not subject to
seasonal variations in adults in New Zealand. Biol Trace Elem Res. 95:193-201.
Salacinski HJ, O'Brien P. 2000. Evidence that the reactions of nickel in the presence of
vitamin C does not produce toxic oxygen intermediates such as hydroxyl but ascorbate
and carbon radicals. Arch Toxicol. 74(1):5-12.
Salgueiro et al. 2000. Zinc as an essential micronutrient: a review. Nutr. Res. 20(5):737-
755.
Salnikow K. et al. 2003. The involvement of hypoxia-inducible transcription factor-1-
dependent pathway in nickel carcinogenesis. Canc. Res. 63:3524-30.
Salnikow K, Li X, Lippmann M. 2004. Effect of nickel and iron co-exposure on human
lung cells. Toxicol. Appl. Pharamacol. 196:258-265.
118
Schilling JG, Kingsley R. 2004. Welcome to the ICP-MS Laboratory. Site:
http://www.gso.uri.edu/icpms/index.htm
Seidel S, Kreutzer R, Smith D, McNeel S, Gilliss D. 2001. Assessment of commercial
laboratories performing hair mineral analysis. JAMA. 285(1):67-72.
Sen P, Costa M. 1986. Pathway of nickel uptake influences its interaction with
heterochromatic DNA. Toxicol Appl. Pharmacol. 84:278-85.
Shamberger RJ. 2002. Validity of hair mineral testing. Biol. Trace. Elem. Res. 87:1-28.
Shamberger RJ. 2003. Calcium, magnesium and other elements in the red blood cells and
hair of normals and patients with premenstrual syndrome. Biol. Trace Elem. Res. 94:123-
129.
Sherwood RA et al. 1986. Magnesium and the premenstrual syndromes. Ann. Clin.
Biochem. 23:667-670.
Shi X, Mao Y, Ahmed N, Jiang H. 1995. HPLC investigation on Ni(II)-mediated DNA
damage in the presence of t-butyl hydroperoxide and glutathione. J Inorg Biochem.
57(2):91-102.
119
Steindel SJ, Howanitz PJ. 2001. Uncertainty of hair analysis for trace metals. JAMA.
285(1):83-85.
Sturaro A et al. 1994. The influence of color, age, and sex on the content of zinc, copper,
nickel, manganese and lead in human hair. Biol. Trace. Elem. Res. 40:1-8.
Tang Y-R, Zhang S-Q, Xiong Y, Zhag Y, Fu H, Zhang H-P, Xiong K-M. 2003. Studies
of five microelement contents in human serum, hair, and fingernails correlated with aged
hypertension and coronary heart disease. Biol Trace Elem Res. 92:97-103.
Tassiopoulos K, Bernstein J, Heeren T, Levenson S, Hingson R, Bernstein E. 2004. Hair
testing and self-report of cocaine use by heroin users. Addiction. 99(5):590-7.
TJA Solutions. 2000. AAS, FAAS, ICP or ICP-MS: Which technique should I use? An
elementary overview of elemental analysis. Thermo Electron.
Tully DB, Collins BJ, Overstreet JD, Smith CS, Dinse GE, Mumtaz MM, Chapin RE.
2000. Effects of arsenic, cadmium, chromium, and lead on gene expression regulated by
a battery of 13 different promoters in recombinant HepG2 cells. Toxicol Appl Pharmacol.
168(2):79-90.