fire in the united states 2005-2014 - 18th edition · the fire death rate used throughout “fire...
TRANSCRIPT

Fire in the United States 2005-2014
18th EditionJanuary 2017

Mission StatementWe provide national leadership to foster a solid foundation for our fi re and emergency services stakeholders in prevention, preparedness, and response.
U.S. Fire Administration

Table of Contents i
Table of ContentsExecutive Summary............................................................................................................. 1
Purpose and Scope ............................................................................................................ 1
National Problem ............................................................................................................... 2
Regional and State Profiles ............................................................................................... 2
Residences and Other Properties ................................................................................... 3
Causes of Fires and Fire Losses ....................................................................................... 3
Residential .................................................................................................................... 3
Nonresidential ............................................................................................................. 4
Vehicle ........................................................................................................................... 4
Outside ......................................................................................................................... 4
Other ............................................................................................................................. 4
Race, Age and Gender Characteristics of Victims ......................................................... 4
Conclusions ......................................................................................................................... 5
Prevention and Other Resources .................................................................................... 6
Fire in the United States 2005-2014 18th Edition ............................................................ 7
Introduction ........................................................................................................................ 7
Data Sources ...................................................................................................................... 8
National Fire Incident Reporting System ................................................................. 9
National Fire Incident Reporting System Enhancements ...................................... 16
National Fire Incident Reporting System Training and Resources ....................... 17
Uses of the National Fire Incident Reporting System ............................................ 17
U.S. Fire Departments ................................................................................................ 18
Methodology ...................................................................................................................... 19
Analytic Issues and Considerations .......................................................................... 19
Representativeness of the Sample .................................................................... 19National Estimates ............................................................................................... 20Data Quality .......................................................................................................... 21Unknown Entries .................................................................................................. 22Incomplete Loss Reporting ................................................................................. 23Unreported Fires .................................................................................................. 23Structures Versus Buildings ................................................................................ 24Computing Trends ................................................................................................ 25Rounding ............................................................................................................... 26Comparing Statistics ............................................................................................ 26Data Collection and Reporting Changes ........................................................... 26Confined Fires ....................................................................................................... 27Structure Fire Cause Methodology .................................................................... 27Differences Between the National Fire Incident Reporting System Data
and National Fire Protection Association Survey Data ............................ 31

ii Fire in the United States 2005-2014
Organization of Report ..................................................................................................... 36
The National Fire Problem ................................................................................................. 37
Fires and Losses (10-Year Trends, 2005-2014) ............................................................... 37
Fires Loss Rates (2005-2014) ............................................................................................ 40
Types of Properties Where Fires Occur .......................................................................... 42
Fires and Fire Losses by General Property Type (2014) ......................................... 42
Fire Casualties and Dollar Loss per Fire by General Property Type (2014) ......... 44
Buildings and Other Properties ....................................................................................... 45
Buildings ....................................................................................................................... 45
Residential Building Fires and Losses ............................................................... 46All Residential Buildings ...................................................................................... 46One- and Two-Family Residential Buildings ..................................................... 49Multifamily Residential Buildings ....................................................................... 51Other Residential Buildings ................................................................................ 54Nonresidential Buildings ..................................................................................... 56
Vehicles and Other Mobile Properties ..................................................................... 58
Outside and Other Properties .................................................................................. 63
Causes of Fires and Losses ........................................................................................ 66
Causes of Residential Building Fires .................................................................. 66Causes of Nonresidential Building Fires ........................................................... 71Causes of Vehicle Fires ........................................................................................ 72Causes of Outside Fires ....................................................................................... 74Causes of Other Fires .......................................................................................... 75
Fire Casualties .................................................................................................................... 77
Fire Deaths ................................................................................................................... 77
State Profiles ......................................................................................................... 77Age ......................................................................................................................... 81Gender ................................................................................................................... 83Race ........................................................................................................................ 86
Fire Injuries .................................................................................................................. 86
Age ......................................................................................................................... 86Gender ................................................................................................................... 89
Acronyms .............................................................................................................................. 93

Executive Summary 1
Executive SummaryFire departments in the United States responded to nearly 1.3 million fire calls in 2014.1
The U.S. fire problem no longer ranks as the most severe of the industrialized nations, yet thousands of Americans die each year, tens of thousands of people are injured, and property losses reach billions of dollars. There are huge indirect costs of fire as well, including temporary lodging, lost business revenues, medical expenses, psychological damage, and others. To put this in context, the annual losses from floods, hurricanes, tornadoes, earthquakes, and other natural disasters combined in the U.S. average just a fraction of those from fires.2 The public, the media and local governments are generally unaware of the magnitude and seriousness of the fire problem and how it affects individuals and their families, communities, and the nation.
Purpose and Scope
The National Fire Data Center (NFDC) of the U.S. Fire Administration (USFA) periodically publishes “Fire in the United States,” a statistical overview of the fires in the U.S. with the focus on the latest year in which data were available. This report provides the fire service and others with information that motivates corrective action, sets priorities, targets specific fire programs, serves as a model for state and local analyses of fire data, and provides a baseline for evaluating programs.
This 18th edition covers the 10-year period from 2005 to 2014, with a primary focus on 2014.3 The report addresses the overall national fire problem. Detailed analyses of the residential and nonresidential fire problem, firefighter casualties, and other subsets of the national fire problem are not included. These topic-specific analyses are addressed as separate, stand-alone publications.
The primary source of data is from the National Fire Incident Reporting System (NFIRS). The National Fire Protection Association (NFPA) annual survey results, mortality data from the National Center for Health Statistics (NCHS), data from state fire marshals’ offices or their equivalents, population data from the U.S. Census Bureau, and inflation adjustments from the Bureau of Labor Statistics’ Consumer Price Index (CPI) are also used. Because of the time it takes for states to submit data to USFA from the thousands of fire departments that participate in NFIRS, then obtain corrections and edit the data, and analyze and display the results, the publication lags behind the date of data collection. Fortunately, the fire problem does not change very rapidly, so the data is usually quite representative of the situation in the year of publication as well.
1NFPA, “Fire Loss in the United States During 2014,” September 2015.2National Weather Service (NWS), National Hazard Statistics, 2014: http://www.nws.noaa.gov/om/hazstats/sum14.pdf.3Only native NFIRS Version 5.0 data was used for NFIRS-based analyses. By Jan. 1, 2009, NFIRS 4.1 data was no longer accepted by the system.

2 Fire in the United States 2005-2014
National Problem
Annual deaths from fire in the U.S. were estimated at 12,000 in 1974, the year in which the USFA was established.4 At that time, a goal was set for reducing this number by half within a generation. This goal was met. By 2012, NFPA estimates of civilian deaths were at their lowest level (2,855). While fire deaths are still trending downward, in 2014, NFPA estimates of fire deaths were 15 percent higher than they were in 2012.5
Table 1 presents 10-year fire and fire loss rate trends. Fires per million population reached a new low in 2013, continuing the downward trend. Dollar loss per capita decreased 27 percent over the 10 years. Injuries and deaths per million population continued to decline. The death rate (deaths per million population) declined 18 percent from 2005 to 2014, and it is less than a third of what it was in the late 1970s.6 Nevertheless, the U.S. has a fire death rate 1.5 to 2.5 times higher than that of several European nations. Of the 28 industrial nations examined by the World Fire Statistics Centre, the U.S. ranked as having the 12th highest fire death rate.
Table 1. Fire and Fire Loss Rate Trends (2005-2014)
Loss Measure 10-Year Trend (percent)Fires/Million population -28.5Deaths/Million population -18.4Injuries/Million population -14.6Dollar loss/Capita* -26.6
Sources: NFPA, CPI and U.S. Census Bureau.*The 2005 to 2013 dollar-loss values were adjusted to 2014 dollars.
Regional and State Profiles
The fire problem varies from region to region and state to state because of variations in climate, socioeconomic status, education, demographics and other factors. In 2014, five states (Alabama, Mississippi, Oklahoma, Tennessee and West Virginia) and the District of Columbia had fire death rates that exceeded 20 deaths per million population. Nineteen states, mostly situated in the Southeast and Midwest, had death rates between 11 and 20 per million population. Additionally, 19 states had fire death rates at or below the national fire death rate — 10.7 deaths per million population. While some state death rates were still high, overall, states have made great progress in lowering the absolute number of fire deaths and their deaths per million population.7
4“America Burning.” The Report of the National Commission on Fire Prevention and Control, 1973. NFPA changed their estimation methodology in the mid-1970s. As a result, by 1977, the estimate of fire deaths had already dropped to approximately 7,400 and rose the next year to 7,700. Nevertheless, it is fair to say that the 50 percent reduction in fire deaths was achieved.5The NFPA estimated fire deaths to be 3,275 in 2014. For the same year, the NCHS mortality data reflected 3,428 fire deaths. The NCHS mortality data suggest that fire deaths may be 5 percent higher than the NFPA estimate of fire deaths.6The fire death rate used throughout “Fire in the United States,” however, reflects the number of fire deaths (3,428) from the 2014 NCHS mortality data. This death rate is 10.7 fire deaths per million population. In 1979, the fire death rate was 34.8 deaths per million population, as cited in USFA’s “America Burning Revisited,” 1987, p. 15.7This analysis includes only states where fire death rates were computed. Fire death rates were not computed for Hawaii, Idaho, New Hampshire, North Dakota, South Dakota, Vermont and Wyoming due to very small numbers of fire deaths (fewer than 10 deaths).

Executive Summary 3
Ten states, mostly largely-populated states, accounted for 48 percent of the national total U.S. fire deaths. Unless their fire problems are significantly reduced, the national total will be difficult to lower.
Residences and Other Properties
Over the years, there has been little change in the proportion of fires, deaths, injuries and dollar loss by the type of property involved. In terms of numbers of reported fires, the largest category continued to be outside fires (41 percent) — in fields, vacant lots, trash, etc. Residential and nonresidential structure fires together constituted 39 percent of fires, with residential structure fires outnumbering nonresidential structure fires by over 3 to 1. What may be surprising was the large percentage of vehicle fires. In fact, approximately 1 out of every 7 fires to which fire departments responded involved a vehicle.
By far, the largest percentage of deaths — 75 percent in 2014 — occurred on residential properties, with the majority of these on one- and two-family properties. Vehicles accounted for the second largest percentage of fire deaths at 16 percent. Great attention is given to large, multiple-death fires in public places, such as hotels, nightclubs and office buildings; however, fires that kill 10 or more people are few in number and constitute only a small portion of overall fire deaths. Furthermore, public properties are generally required by local codes to have built-in fire suppression systems. The area with the largest problem is most commonly overlooked — in people’s homes. Prevention efforts continue to focus on home fire safety.
Only 4 percent of the 2014 fire deaths occurred in nonresidential commercial and public properties. Outside and other miscellaneous fires, including wildfires, were also a small factor (5 percent combined) in fire deaths.
The picture was generally similar for fire injuries, with 78 percent of all reported injuries occurring on residential properties. The remaining fire injuries were distributed across the other property types — nonresidential properties, 7 percent; vehicles, 6 percent; and outside and other fires, 9 percent.
The picture changes somewhat for dollar loss. While residential properties were the leading property type for dollar loss, nonresidential properties played a considerable role. These two general property types accounted for 82 percent of all dollar loss. The proportion of dollar loss from outside fires may be understated because the destruction of trees, grass, etc., is often given zero value in fire reports if it is not commercial cropland or timber.
Causes of Fires and Fire Losses
Residential
At 50 percent, cooking was the leading cause of residential building fires. Heating caused another 13 percent. These percentages (and those that follow) are adjusted, which proportionally spreads the unknown causes over the other 15 cause categories.
The two leading causes of residential fatal fires were other unintentional or careless actions at 15 percent and smoking at 13 percent. The leading cause of residential fires that resulted in injuries was cooking (37 percent). Cooking was, by far, the leading cause of fires resulting in dollar loss at 28 percent, followed by electrical malfunction at 12 percent.

4 Fire in the United States 2005-2014
Nonresidential
For nonresidential building fires, cooking was the leading cause of fires (29 percent), followed by other unintentional or careless actions (10 percent). Electrical malfunction, other unintentional or careless actions, and cooking were the leading causes of fires resulting in dollar loss in nonresidential buildings, each at 12 percent.
Vehicle
Unintentional actions were the leading cause of fires and fires resulting in dollar loss in vehicles (each at 37 percent). The cause of vehicle fires was undetermined after the investigation in 23 percent of vehicle fires. Failure of equipment or heat source, at 22 percent, was the second leading cause of fires resulting in dollar loss.
Outside
Unintentional actions were the leading cause of fires and fires resulting in dollar loss in outside fires (43 and 41 percent, respectively). Causes were undetermined after the investigation in 26 percent of outside fires and 23 percent of outside fires resulting in dollar loss.
Other
Just as with vehicle and outside fires, unintentional actions were the leading cause of other fires and fires resulting in dollar loss (46 and 48 percent, respectively). Failure of equipment or heat source was the second leading cause of other fires (20 percent) and other fires resulting in dollar loss (26 percent).
Race, Age and Gender Characteristics of Victims
Fire losses affect all groups and races, rich and poor, Northern and Southern, urban and rural. But the problem is greater for some groups than for others. African-Americans and American Indians/ Alaska Natives had much higher fire death rates than the national average. African-Americans constituted a large and disproportionate share of total fire deaths, accounting for 20 percent of fire deaths in 2014 but only 13 percent of the U.S. population.
Males were 1.5 times more likely to die in fires than females. Female fire deaths in the 70 and older age group accounted for approximately one-third (34 percent) of female fire deaths. Male fire deaths, by contrast, were highest for those adults ages 50 to 69, accounting for 39 percent of male fire deaths.
The majority of fire-related injuries occurred in adults ages 20 to 59. This age group accounted for 64 percent of the fire injuries in 2014. Males ages 20 to 64 had a higher proportion of injuries than females, while older adult females had more injuries than older adult males.8
People with limited physical and cognitive abilities, especially older adults, are at a higher risk of death from fire than other groups. Older adults accounted for 38 percent of all fire deaths and 14 percent of estimated fire injuries in 2014.
8USFA defines older adults as ages 65 and older.

Executive Summary 5
As baby boomers enter retirement age, the demographic profile of the U.S. is expected to change dramatically. Over the coming decades, the older population will increase, and a corresponding increase in fire deaths and injuries among older adults is likely.
In the past, children ages 4 and younger were also considered to be at a high risk of death from fire; however, data indicate that the trend is changing. In 2014, the relative risk of children ages 4 and younger dying in a fire was 30 percent less than that of the general population.
Conclusions
This report shows that, overall, the fire problem in the U.S. continues to improve. Ten-year fire loss rates are down. It is likely that several factors continue to contribute to these trends:
ĵ Smoke alarms, which have become nearly universal — USFA continues to partner with other government agencies and fire service entities to improve and develop new smoke alarm technologies.
ĵ Sprinklers, which quickly combat incipient fires, especially in nonresidential and multifamily buildings — there are major movements in the U.S. fire service to require or facilitate use of sprinklers in all new homes, which could improve the use of residential sprinklers in the future.
ĵ Fire codes, which have been strengthened.
ĵ Construction techniques and materials, which have been developed specifically for fire prevention.
ĵ Public education at the community, county, state and federal levels.
ĵ Improved firefighter equipment and training.
Even considering these positive trends, the U.S. still has a major fire problem compared with some other industrialized nations. The study and implementation of these nations’ fire prevention programs that have proved effective in reducing the number of fires and deaths should be considered.
Other areas that continue to be of concern:
ĵ The elderly remain at high risk of death from fire.
ĵ The focus for fire injury prevention should be on adults ages 20 to 64 and those 85 or older.
ĵ African-Americans and American Indians/Alaska Natives remain at a higher risk of death from fire than the general population.
ĵ Outside/Wildland fires.
ĵ Data challenges still exist: Many records submitted to NFIRS by participating fire departments provide either incomplete or no information in some of the fields. Additionally, in preparing this report, it is assumed that participating fire departments have reported 100 percent of their fire incidents; however, this is not always the case. The completeness of all the information in the NFIRS modules will contribute to the refinement and confidence level of future analyses.

6 Fire in the United States 2005-2014
With continued enhancements to NFIRS, data collection continues to improve. If we better understand the relative importance of the factors that lessen the fire problem, resources can be better targeted to have the most impact.
Prevention and Other Resources
USFA develops and delivers fire prevention and safety education programs in partnership with other federal agencies, the fire and emergency response community, the media, and safety interest groups. USFA also works with public and private groups to promote and improve fire prevention and life safety through research, testing and evaluation.
ĵ USFA’s outreach materials and educational programs are available at https://www.usfa.fema.gov/prevention/.
ĵ Smoke alarm information on technologies, performance, disposal and storage, training bulletins, and public education and outreach materials is available at https://www.usfa.fema.gov/prevention/technology/smoke_fire_alarms.html.
ĵ Residential sprinkler information on costs and benefits, performance, training bulletins, and public education and outreach materials is available at https://www. usfa.fema.gov/prevention/technology/home_fire_sprinklers.html. USFA’s position statement on residential sprinklers is also available at https://www.usfa.fema.gov/about/sprinklers_position.html.
ĵ USFA sponsors research and conducts studies to support emergency responder health and safety and help fire departments prepare for and respond to fire, natural disasters, nonfire emergencies, and other threats and vulnerabilities. Information on fire department operations, management and safety is available at https://www.usfa.fema.gov/operations/.
To comment on this specif ic report, visit : ht tp://apps.usfa.fema.gov/contact /dataReportEval?reportTitle=Fire%20in%20the%20United%20States%20(2005-2014).

Introduction 7
Fire in the United States 2005-2014 18th EditionIntroduction
In 1973, the president’s Commission on Fire Prevention and Control published “America Burning.” This document was the first in-depth discussion of this country’s fire problem, the most severe of the industrialized nations. The report prompted a national awareness about the depth of the fire problem and the need for prevention efforts. By 1987, when a second commission was assembled, much progress had been made toward addressing the nation’s fire problem. Among other objectives, “America Burning Revisited” redefined the strategies needed to further reduce loss of life and property to fire. As a direct result of these efforts and others like them, the U.S.’s fire problem no longer ranks as the most severe of the industrialized nations. Nonetheless, the U.S. continues to experience fire death rates 1.5 to 2.5 times higher than those of most of its sister nations.9 Many Americans are not aware of this nor the nature of the fire problem.
This report is a statistical portrait of fire in the U.S. It is intended for use by a wide audience, including the fire service, the media, researchers, industry, government agencies and interested citizens. The report focuses on the national fire problem. Emphasized topics include the magnitude and trends of the fire problem, the causes of fires, where they occur, and who gets hurt.
This document is the 18th major edition of “Fire in the United States” published by USFA. It covers the 10-year period from 2005 to 2014 with a primary focus on 2014. The previous editions have included:
ĵ First edition, published in 1978, included 1975 and 1976 fire data.
ĵ Second edition, published in 1982, included 1977 and 1978 fire data.
ĵ Third through fifth editions produced as working papers but not published.
ĵ Sixth edition, published in 1987, included 1983 fire data.
ĵ Seventh edition, published in 1990, included 1983 to 1987 fire data.
ĵ Eighth edition, published in 1993, included 1983 to 1990 fire data.
ĵ Ninth edition, published in 1997, included 1985 to 1994 fire data, and it focused on the residential/nonresidential fire problem, as well as firefighter casualties.
ĵ Tenth edition, published in 1998, included 1986 to 1995 fire data, and it provided a state-by-state profile of fires and an examination of firefighter casualties.
ĵ Eleventh edition, published in 1999, included 1987 to 1996 fire data, and it focused on the residential/nonresidential fire problem, as well as firefighter casualties.
9The Geneva Association, “World Fire Statistics,” Bulletin, Number 29, April 2014, https://www.genevaassociation.org/media/874729/ga2014-wfs29.pdf. As reported, the U.S. had a fire death rate of 1.11 fire deaths per 100,000 population for 2008 to 2010; the Netherlands had the lowest comparable European fire death rate at 0.46 per 100,000 population. Switzerland’s fire death rate was lower still at 0.34, but it excluded firefighter deaths.

8 Fire in the United States 2005-2014
ĵ Twelfth edition, published in 2001, included 1989 to 1998 fire data and was the last edition to use the NFIRS 4.1 data system. It included analyses of all of the previous topics under one cover: residential and nonresidential fire problems, state-by-state profiles, and firefighter casualties.
ĵ Thirteenth edition, published in 2004, included 1992 to 2001 fire data and was the first edition to include the new NFIRS 5.0 data in the analyses. It included the residential and nonresidential fire problem, as well as firefighter casualties.
ĵ Fourteenth edition, published in 2007, included 1995 to 2004 fire data, with a primary focus on 2004; for the first time, only native NFIRS 5.0 data were used for NFIRS-based analyses. It addressed the overall national fire problem and provided detailed analyses of the residential and nonresidential fire problem. Firefighter casualties and other subsets of the national fire problem were not included.
ĵ Fifteenth edition, published in 2009, covered the five-year period of 2003 to 2007, with a primary focus on 2007. As in the 14th edition, only native NFIRS 5.0 data were used for NFIRS-based analyses.10 This report addressed only the overall national fire problem. Detailed analyses of the residential and nonresidential fire problem firefighter casualties, and other subsets of the national fire problem were addressed as separate, stand-alone publications.
ĵ Sixteenth edition, published in 2013, was entirely web-based and covered the five-year period of 2007 to 2011, with a primary focus on 2011. The document was renamed “Data Sources and Methodology Documentation,” with all of the data presented in an Excel file.
ĵ Seventeenth edition, published in 2016, covered the 10-year period of 2004 to 2013, with a primary focus on 2013. This report addressed the overall national fire problem and was published as a PDF document.
Data Sources
The USFA’s data analyses are based primarily on the NFIRS data, but use other sources as well. Summary estimates for fires, deaths, injuries and dollar loss are from the NFPA’s annual survey of fire departments.11 Other data sources used by USFA include 2014 NCHS mortality data12 as compiled from data provided by the 57 vital statistics jurisdictions through the Vital Statistics Cooperative Program, resident population estimates from the U.S. Census Bureau, inflation adjustments from the Bureau of Labor Statistics’ CPI, and state statistics from state fire marshals’ offices or their equivalents. Because the NCHS
10Previous editions of “Fire in the United States” presented 10-year trends. As many of the trends are based on national estimates that use the proportion of native NFIRS 5.0 data to allocate estimated fires and fire losses, trends in this edition are limited to 2003 and the years after when the proportion of native NFIRS 5.0 data exceeded 80 percent of the submitted data.11The NFPA summary estimates are used for the overall U.S. fire losses; for fire losses from vehicle, outside and other fires; and as the basis for estimates of residential and nonresidential building fires. The alternative approach for these summary estimates is to use the relative percentage of fires (or other loss measures) from NFIRS and scale up (multiply by) to the NFPA estimate of total fires. The results would be somewhat different from those based on the NFPA subtotals. These differences are discussed in the section “Differences Between National Fire Incident Reporting System Data and National Fire Protection Association Survey Data.” Better estimates of fire loss measures will not be available from NFIRS until a more robust method of estimation is developed.12The NCHS data provides additional details not available from the NFPA survey: state of fire death occurrence, age, gender and race.

Data Sources 9
mortality data is based on a census or enumeration of deaths based on death certificates rather than an estimate, it is used as the primary source for the computation of fire death rates and relative risk. The most current year available for the NCHS mortality data is 2014. Please note that for consistency, national trend data is based on the NFPA survey estimates, not the NCHS mortality data.
The USFA gratefully acknowledges the use of the data and information provided by these groups. Data sources are cited for each graph and table.
National Fire Incident Reporting System
NFIRS was established in 1975 as one of the first programs of the National Fire Prevention and Control Administration, which later became the USFA. The basic concept of NFIRS has not changed since the system’s inception. All states and all fire departments within them have been invited to participate on a voluntary basis. Participating fire departments collect a common core of information on an incident and any casualties that ensue by using a common set of definitions. In very few departments, the data may be written by hand on paper forms; however, the majority of the data are collected electronically through third-party software, the NFIRS Data Entry Tool (DET) or the Data Entry Browser Interface (DEBI), or the reporting department’s own system. Local agencies forward the completed NFIRS modules to the state agency responsible for NFIRS data. The state agency combines the information with data from other fire departments into a statewide database and then transmits the data to the NFDC at the USFA. Data on individual incidents and casualties are preserved incident by incident at local, state and national levels. Once limited to fire incidents only, NFIRS encompasses all incidents to which the fire department responds: fire, Emergency Medical Services (EMS), hazardous materials or hazmat, and the like.
From an initial six states in 1976, NFIRS has grown in both participation and use. Over the life of the system, all 50 states, the District of Columbia, and more than 40 major metropolitan areas have reported to NFIRS. More than 30,000 fire departments have been assigned participating NFIRS fire department identification (FDID) numbers by their states. Nearly 1 million fire incident records and over 22 million nonfire incident records are added to the database each year. NFIRS is the world’s largest collection of incidents to which fire departments respond.
Figure 1 shows the growth in the number of fire departments participating in NFIRS over the last 35 years from 1980 to 2014.13 Between 1985 and 1999, the level of participation remained relatively constant: A few states came in or left the system each year, and at least 39 states reported to NFIRS. Most years also included participation from the District of Columbia. The number of fire departments participating within the states remained relatively constant as well, with a slight dip in participation during the system migration from Version 4.1 to 5.0 in 1999. In 2000, the number of states increased to 43, and fire department participation began to bounce back from the Version 5.0 transition. State and fire department participation began steadily increasing. In 2003, NFIRS reached a milestone with participation by all 50 states. The following year, NFIRS achieved another significant goal: NFIRS not only achieved the national goal of 100 percent state participation, including the District of Columbia, but also for the first time, the Native American tribal authorities submitted data.
13Figure 1 reflects fire departments that reported fire incidents (includes mutual aid and automatic aid given); all other types of incidents were excluded from this figure.

10 Fire in the United States 2005-2014
NFIRS continued to grow and mature. By 2007, a new level of participation had been achieved: all 50 states, the District of Columbia, Native American tribal authorities, Northern Mariana Islands, and Puerto Rico all participated in NFIRS for a total of 54 state, district, tribal authority, and commonwealth entities (Table 2). However, the Northern Mariana Islands and Puerto Rico are no longer reporting incident data to NFIRS.
From 2009 to 2014, the level of participation remained relatively constant and data was submitted by the District of Columbia, the Native American tribal authorities, and all 50 states.14 In 2014, the most recent year of data available, 20,527 fire departments reported fire incidents to NFIRS. Across participating entities, 68 percent of the estimated fire departments in the U.S. reported fire incidents to NFIRS in 2014.15 With two-thirds of all fire departments nationwide reporting fire incidents to NFIRS 5.0, the reporting departments represent a very large dataset that enables USFA to make reasonable estimates of various facets of the fire problem. Although some states do require their departments to participate in the state system, participation in NFIRS is voluntary. However, if a fire department is a recipient of an Assistance to Firefighters Grant (AFG), participation is required.16
Figure 1. National Fire Incident Reporting System Fire Department Participation (1980-2014, fire incidents only)
Num
ber
of P
artic
ipat
ing
Fire
Dep
artm
ents
0
5,000
10,000
15,000
20,000
25,000
2014
2013
2012
2011
2010
2009
2008
2007
2006
2005
2004
2003
2002
2001
2000
1999
1998
1997
1996
1995
1994
1993
1992
1991
1990
1989
1988
1987
1986
1985
1984
1983
1982
1981
1980
Source: NFIRS.Notes: 1. 1999-2008 includes participation from NFIRS 4.1 and NFIRS 5.0.; 2009 and later only includes participation from NFIRS 5.0. 2. Includesmutualandautomaticaidgivenfireincidents.
14For 2013, Wyoming data was not included on the NFIRS Public Data Release (PDR) file, as the data was submitted by the state past the cutoff date set by USFA’s NFDC; however, the data resides in the NFIRS production database and Enterprise Data Warehouse.15For 2014, NFPA estimated that there were 29,980 fire departments in the U.S. Source: NFPA, U.S. Fire Department Profile 2014, January 2016, http://www.nfpa.org/research/reports-and-statistics/the-fire-service/administration/us-fire-department-profile.16From the fiscal year 2014 AFG Program Funding Opportunity Announcement, while NFIRS reporting is strongly encouraged, NFIRS reporting is not a requirement to apply for, or be awarded, a grant within the AFG Program. However, any fire-based organization(s) that receives an AFG must commence reporting to NFIRS prior to the beginning of the period of performance. In order to be compliant and close out the grant, the grantee may be asked by the Federal Emergency Management Agency to provide proof of compliance in reporting to NFIRS. Any grantee that stops reporting to NFIRS during the grant’s period of performance is subject to having the award(s) modified or withdrawn. See https://www.fema.gov/media-library-data/1414694732070-8097e2d2cbcbda66354f439085c5ff55/AFG_FY14_FOA.pdf.

Data Sources 11
Table 2. States Reporting Fire Incidents to the National Fire Incident Reporting System (2005-2014)
State 2005 2006 2007 2008 2009 2010 2011 2012 2013 2014Alabama X X X X X X X X X XAlaska X X X X X X X X X XArizona X X X X X X X X X XArkansas X X X X X X X X X XCalifornia X X X X X X X X X XColorado X X X X X X X X X XConnecticut X X X X X X X X X XDelaware X X X X X X X X X XDistrict of Columbia X X X X X X X X
Florida X X X X X X X X X XGeorgia X X X X X X X X X XHawaii X X X X X X X X X XIdaho X X X X X X X X X XIllinois X X X X X X X X X XIndiana X X X X X X X X X XIowa X X X X X X X X X XKansas X X X X X X X X X XKentucky X X X X X X X X X XLouisiana X X X X X X X X X XMaine X X X X X X X X X XMaryland X X X X X X X X X XMassachusetts X X X X X X X X X XMichigan X X X X X X X X X XMinnesota X X X X X X X X X XMississippi X X X X X X X X X XMissouri X X X X X X X X X XMontana X X X X X X X X X XNebraska X X X X X X X X X XNevada X X X X X X X X X XNew Hampshire X X X X X X X X X X
New Jersey X X X X X X X X X XNew Mexico X X X X X X X X X XNew York X X X X X X X X X XNorth Carolina X X X X X X X X X XNorth Dakota X X X X X X X X X XOhio X X X X X X X X X XOklahoma X X X X X X X X X X

12 Fire in the United States 2005-2014
Table 2. States Reporting Fire Incidents to the National Fire Incident Reporting System (2005-2014) — Continued
State 2005 2006 2007 2008 2009 2010 2011 2012 2013 2014Oregon X X X X X X X X X XPennsylvania X X X X X X X X X XRhode Island X X X X X X X X XSouth Carolina X X X X X X X X X XSouth Dakota X X X X X X X X X XTennessee X X X X X X X X X XTexas X X X X X X X X X XUtah X X X X X X X X X XVermont X X X X X X X X X XVirginia X X X X X X X X X XWashington X X X X X X X X X XWest Virginia X X X X X X X X X XWisconsin X X X X X X X X X XWyoming X X X X X X X X X XNative American X X X X X X X X X X
Northern Mariana Islands
X X
Puerto Rico X X X * *Total 52 53 54 51 52 52 52 52 52 52
Source: NFIRS.Notes: For2005-2008,includesfireincidentssubmittedinbothNFIRSVersions4.1and5.0.Beginningin2009,includesonlyfire
incidents submitted in NFIRS Version 5.0.*PuertoRicosubmittedfireincidentdatatoNFIRSin2008-2009,butthedatawasexcludedfromallfiredataanalysesduetodata quality issues.

Data Sources 13
Table 3. Fire Departments Reporting Fire Incidents to the National Fire Incident Reporting System in 2014
StateNo. of Fire
Departments in State
No. of Reporting Fire Departments
(NFIRS 5.0)
Percentage of Reporting Fire Departments
(NFIRS 5.0)Alabama 1,230 321 26Alaska 235 133 57Arizona 314 91 29Arkansas 976 725 74California 1,105 464 42Colorado 385 211 55Connecticut 260 217 83Delaware 61 60 98District of Columbia 1 1 100Florida 573 417 73Georgia 626 322 51Hawaii 6 4 67Idaho 246 151 61Illinois 1,203 1,042 87Indiana 829 367 44Iowa 848 562 66Kansas 577 456 79Kentucky 852 570 67Louisiana 556 385 69Maine 405 183 45Maryland 419 256 61Massachusetts 366 331 90Michigan 1,306 746 57Minnesota 784 710 91Mississippi 752 597 79Missouri 891 436 49Montana 392 159 41Nebraska 476 169 36Nevada 165 40 24New Hampshire 232 195 84New Jersey 740 623 84New Mexico 362 329 91New York 1,786 1,101 62North Carolina 1,257 1,081 86North Dakota 372 143 38

14 Fire in the United States 2005-2014
Table 3. Fire Departments Reporting Fire Incidents to the National Fire Incident Reporting System in 2014 — Continued
StateNo. of Fire
Departments in State
No. of Reporting Fire Departments
(NFIRS 5.0)
Percentage of Reporting Fire Departments
(NFIRS 5.0)Ohio 1,208 1,162 96Oklahoma 926 358 39Oregon 316 231 73Pennsylvania 2,287 823 36Rhode Island 76 38 50South Carolina 435 382 88South Dakota 337 175 52Tennessee 728 585 80Texas 2,025 918 45Utah 273 134 49Vermont 236 171 72Virginia 652 483 74Washington 487 257 53West Virginia 442 427 97Wisconsin 850 718 84Wyoming 145 64 44Native American 100 3 3Total 33,111* 20,527 62
Sources: NFIRS(2014)andstatefiremarshal’sofficesorequivalentorganizations(September2013).Notes: Additionally,thereare672DepartmentofDefensefiredepartmentsintheU.S.Thesedepartmentsarenotincludedin
thetotalshereanddonotreporttheirfireincidentdatatoNFIRS.*Thistotaldiffersfromthe2014NFPAestimateof29,980firedepartments.TheNFPAestimateistheofficialestimateusedbyUSFA as its benchmark for the National Fire Department Registry.
Corresponding to increased participation, the numbers of fires, deaths and injuries, as well as estimates of dollar loss, reported to NFIRS have also grown; an estimated 68 percent of all U.S. fires to which fire departments responded in 2014 were captured in NFIRS.17
There are, of course, many problems in assembling a real-world database, and NFIRS is no exception. Although NFIRS does not represent 100 percent of incidents reported to fire departments each year, the enormous dataset and strong efforts by the fire service result in a huge amount of useful information. Because of advances in computer technology and data collection techniques over the past 40 years and improvements suggested by participants, NFIRS has been revised periodically. The latest revision, NFIRS 5.0, became operational in January 1999.
NFIRS 5.0 captures information on all incidents, not just fires, to which a fire department responds. NFIRS 5.0 provides 11 modules that recognize the increasingly diverse activities of fire departments today. These modules, together, contain 567 data elements or fields.
17This percentage excludes mutual-aid fire incidents to avoid double counting of fires.

Data Sources 15
The Basic Module is the main module, which is completed for every incident. The other modules are filled out, when appropriate, to provide additional information on an incident. All 11 modules are listed below:
Module DescriptionBasic Module General information for each incidentFire Module Fire incident information Structure Fire Module Information on structure firesCivilian Fire Casualty Module Fire-related injuries or deaths to civiliansFire Service Casualty Module Injuries or deaths to firefightersEMS Module Medical incidentsHazardous Materials Module Hazardous materials incidentsWildland Fire Module Wildland or vegetation firesApparatus/Resources Module Apparatus-specific informationPersonnel Module Personnel associated with apparatus Arson Module Intentionally-set fire information
Data from the modules are grouped together each calendar year to create the Public Data Release (PDR) files in delimited text (.txt) format, which are then released annually into the public domain. For NFIRS data submitted prior to 2012, the PDR files were released in dBASE (.dbf) format. The Apparatus/ Resources and Personnel Modules are excluded from the PDR because they are intended for local fire department use, and the PDR dataset’s main utility is intended for national analyses. The PDR files consist of a subset of the data fields contained within the NFIRS national production database. For example, data elements with sensitive or identifying information are removed, as are data elements that are wholly used for maintenance or production purposes. The data structure of the PDR files has been considerably simplified from the production database’s schema for ease of use. The PDR files from 2004 to 2013 only include fire and hazmat incidents and their related data tables (available on CD). Prior to 2004, all incidents were included in the PDR files. Beginning with the 2014 NFIRS data, both the fire and hazmat incident PDR file (CD) and the full, all-incident PDR file (DVD) are available upon request from USFA’s NFDC.
In its basic form, the NFIRS PDR files have a relational data structure where data from each incident module is represented by a row in a data table. The primary tables (basic incident and incident address) contain most of the Basic Module data. There is exactly one record in the basic incident table for every incident reported to NFIRS. All other modules, represented by data tables with similar names (fire incident, civilian casualties, etc.), have records that are linked to the basic incident table through unique incident identification key fields (e.g., STATE, FDID, INC_DATE, INC_NO and EXP_NO). Some module data are split across several tables (e.g., basic incident, incident address, and basic aid tables); one table (fire incident) combines data from two modules (i.e., Fire Module and Structure Fire Module). Some tables, such as fire incident, will only have one record for each relevant incident in the basic incident table, while tables such as civilian casualty may have several records linked to a single incident in the case where multiple injuries and/or deaths occur in the same incident.
State participation is voluntary, and each state specifies NFIRS reporting requirements for its fire departments. States have the flexibility to adapt their state reporting systems to their specific needs. As a result, the design of a state’s data collection system varies from

16 Fire in the United States 2005-2014
state to state. NFIRS 5.0 was designed so that data from state systems can be converted to a single format that is used at the national level to aggregate and store NFIRS data.
All data in the system, regardless of the entry mechanism, are in NFIRS 5.0 format; non-NFIRS 5.0 data are converted to the 5.0 format. The proportion of native 5.0 data has steadily increased since the introduction of NFIRS 5.0 in 1999 (Table 4). This proportion rose to 99 percent in the 2008 data. Since Jan. 1, 2009, NFIRS 4.1 data have no longer been accepted by the system. Prior to 2009, NFIRS 4.1 data in its converted form had been accepted by the system; however, USFA only used native 5.0 data in its NFIRS-based analyses.
Table 4. National Fire Incident Reporting System Fire Incident Data Reporting by Version (percent)
Year NFIRS 4.1 (converted to 5.0 format)
Native NFIRS 5.0
1999 92% 8%2000 77% 23%2001 48% 52%2002 31% 69%2003 19% 81%2004 11% 89%2005 5% 95%2006 5% 95%2007 2% 98%2008 1% 99%2009 0% 100%
Source: NFIRS.
National Fire Incident Reporting System Enhancements
Under the USFA Reauthorization Act of 2008, the U.S. Congress authorized and funded USFA to develop enhancements to NFIRS. The upgrades to the system began in October 2008 and included a simplified NFIRS web-based reporting interface and a data warehouse for generating output reports for use in analyses. These improvements make reporting and accessing the NFIRS data much easier for fire departments.
In July 2010, USFA completed and deployed the new web-based DET. The DEBI is a one-purpose tool for use by the fire service to document incident information within the NFIRS. While the functionality is the same as the NFIRS client DET that has been available for use for many years, the DEBI allows entry of incidents using a standard web browser, eliminating the need to download, install and configure client software.
The development of a flexible NFIRS data warehouse with comprehensive data-mining capabilities was completed in July 2011, but technical problems with the data and environment have led to extensive delays in deployment. The data warehouse will allow NFIRS users to access and report on nationally collected data with significantly increased functionality over the current report generation tool. The data have been transformed into a custom schema that greatly increases the speed of report generation and data

Data Sources 17
access. NFIRS users will be able to generate reports using data from other departments and states, which was not previously possible. Deployment of the new reporting solution to NFIRS state program managers began, in a phased approach, on July 1, 2016.
National Fire Incident Reporting System Training and Resources
USFA offers several free classroom and online NFIRS training courses for fire departments, including the “Introduction to NFIRS 5.0” (W0497) course, “National Fire Incident Reporting System 5.0 Self-Study” (Q0494), the “National Fire Incident Reporting System: Program Management” (NFIRS: PM) (R0491) course, and the “NFIRS Program Management--Data Analysis and Problem-Solving Techniques” (NFIRS PM--DAPST) (R0495) course. The Intro to NFIRS 5.0 course teaches students how to use standardized forms to achieve uniformity in their incident and activity reporting. This training program is designed specifically to support local fire service organizations, and it will assist them in providing data to their management and to decision-makers, as well as to their state uniform fire reporting system. The NFIRS 5.0 Self-Study (online) course provides an overview of the data collection system, its modules, and data conversion issues. The NFIRS: PM course enables participants to successfully promote, support and manage NFIRS data collection. The NFIRS PM--DAPST course is designed for experienced NFIRS users who need enhanced fire incident analysis and reporting skills. For more information on NFIRS training courses, visit https://www.usfa.fema.gov/data/nfirs/support/training.html.
Periodically, USFA issues NFIRSGrams, which are short bulletins that provide coding help to fire department personnel who use NFIRS. NFIRSGrams address frequently asked questions (FAQs) and common mistakes made when completing incident forms. Examples include “Documenting casualties on an NFIRS report,” “Coding an electronic cigarette fire,” and “Calculating fire loss.” In addition to NFIRSGrams, the “NFIRS 5.0 Coding Questions Manual” includes instructions on how to code NFIRS 5.0 incident reports in a question-and-answer format. NFIRSGrams and the “NFIRS 5.0 Coding Questions Manual” are available at https://www.usfa.fema.gov/data/nfirs/support/training.html.
Furthermore, USFA’s NFIRS Support Center offers a consolidated national help desk to provide technical support to fire departments and NFIRS state program managers regarding all aspects of NFIRS. Support Center staff may be reached by email at [email protected] or by calling toll free at 888-382-3827. Questions about or requests for NFIRS technical assistance can also be submitted online: https://apps.usfa.fema.gov/contact/ntsc/.
Uses of the National Fire Incident Reporting System
NFIRS data is used extensively at all levels of government for major fire protection decisions. At the local level, incident and casualty information is used for setting priorities and targeting resources. The data collected are particularly useful for designing fire prevention and educational programs and EMS-related activities specifically suited to the real emergency problems that local communities face.
At the state level, NFIRS is used in many capacities. One valuable contribution is that some state legislatures use this data to justify budgets and to pass important bills on fire-related issues, such as sprinklers, fireworks and arson. Many federal agencies, in addition to USFA, make use of NFIRS data. NFIRS data is used, for example, by the Consumer Product Safety Commission (CPSC) to identify problem products and to monitor corrective actions. The Department of Transportation uses NFIRS data to identify fire problems in automobiles, which has resulted in mandated recalls. The Department of Housing and

18 Fire in the United States 2005-2014
Urban Development uses NFIRS to evaluate the safety of manufactured housing (mobile homes). USFA uses the data to design prevention programs, to prioritize firefighter safety initiatives, to assist in the development of training courses at the National Fire Academy, and to serve a host of other purposes.
In addition to government agencies, NFIRS data are also used for research and prevention programs by a variety of other entities including nonprofit fire-related organizations, colleges and universities, courts and law firms, and the media. For example, since October 2014, the American Red Cross (ARC) is linking NFIRS residential fire data to information gathered from their disaster response teams to identify neighborhoods that have a high fire risk, and then installing smoke alarms in homes within these communities as part of the nationwide Home Fire Campaign. By August 2016, ARC and its partners had saved at least 102 lives as part of this campaign to reduce the number of home fire deaths and injuries.18
Thousands of fire departments, scores of states, and hundreds of industries have used the data. The potential for even greater use remains. The USFA report, “Uses of NFIRS: the many uses of the National Fire Incident Reporting System,” further describes the uses of the data and is available online at http://usfa.kohalibrary.com/app/work/159371.
U.S. Fire Departments
The number of fire departments in each state (Table 3) was provided by each state’s NFIRS program manager. USFA also maintains a database of fire departments. USFA established the National Fire Department Census and its subsequent database in the fall of 2001 when USFA launched a nationwide campaign for voluntary registration of fire departments.
From 2001 to 2016, the number of registered fire departments grew from about 16,000 to over 27,000. Because the census is cumulative over time, it does not reflect a typical census in the way that the data are collected. As a result, in the fall of 2016, USFA renamed the census to the National Fire Department Registry. As of January 2017, there were 27,192 registered fire departments, about 91 percent of the estimated number of U.S. fire departments. The NFPA estimated that there were 29,980 fire departments in the U.S. in 2014.
The database provides a current directory of registered fire departments and includes basic information, such as addresses, department types, website addresses (if applicable), number of fire department personnel, and number of stations. Population-protected and area-protected data are also collected. However, in previous analyses of the population-protected field, it was determined that the registered fire departments reported protecting a population two times that of the U.S. population estimated by the U.S. Census Bureau. Similar results were seen for the area protected. The National Fire Department Registry also collects information on specialized services that is released only in summary format.
The database is intended for use by the fire protection and prevention communities, allied professions, the general public, and USFA. USFA uses the database to conduct special studies, guide program decision-making, and improve direct communication with individual fire departments. For more information about the National Fire Department Registry or to download the list of registered fire departments, visit https://apps.usfa.fema.gov/registry/.
18The ARC, “Red Cross and Partners Save 102 Lives Across the U.S. Through Home Fire Campaign,” August 3, 2016, is available at http://www.redcross.org/news/article/American-Red-Cross-and-Partners-Save-102-Lives-Across-the-Country-Through-Home-Fire-Campaign.

Methodology 19
Methodology
An attempt has been made to keep the data presentation and analysis as straightforward as possible. It is also the desire of USFA to make the data analyses widely accessible to many different users, so it avoids unnecessarily complex methodology. The term fire casualties refers to deaths and injuries; the term fire losses collectively includes fire casualties and dollar loss.
Analytic Issues and Considerations
There are several long-standing issues regarding how to analyze NFIRS data when it is neither as complete nor as accurate as desired. Other analytic issues are the result of changes in definitions and data collection procedures from NFIRS 4.1 to NFIRS 5.0. The sections that follow discuss how the analyses address these and other issues.
Moreover, USFA developed the “National Fire Incident Reporting System Version 5.0 Fire Data Analysis Guidelines and Issues” document to address some of these issues and discuss analytic considerations and methods of analyzing NFIRS fire incident data.19 Topics include the NFIRS 5.0 data structure, general quality assurance issues, and definitions and parameters of common fire analyses (e.g., residential building fires or casualties), including the methodology for determining structure fire causes. The methods, techniques and considerations discussed are those used by USFA analysts, and they do not necessarily reflect methods, techniques and considerations used by fire data analysts from other agencies and organizations. NFIRS data partners may (and do) employ their own methods for analyzing the data and may make differing assumptions when encountering data issues.
Representativeness of the Sample
The percentage of fire departments participating in NFIRS varies from state to state, with some states not participating at all in some years. To the best that USFA can determine, the distribution of participants is reasonably representative of the entire nation, even though the sample is not random. The dataset is so large — on average about 69 percent of all fires — and reasonably distributed geographically and by size of community that it is used as input to developing national estimates.
In a joint study effort, USFA and NFPA examined the biases in NFIRS participation, specifically whether the fire experience of NFIRS-reporting departments differed systematically from the fire experience of other nonreporting departments within the same population. Results based on data from 1997 and 2002 indicated that there were differences in total fire loss estimates derived from NFIRS reporting departments and non-NFIRS reporting departments; however, the degree of difference was not great enough to merit adjusting current scaling methodologies. Thus, USFA and fire data analysts from other organizations continue to use the long-standing methodology of scaling NFIRS estimates with NFPA total fire estimates.
In the fall of 2008, as required by the U.S. Office of Management and Budget (OMB), USFA undertook a study of the NFIRS dataset to examine the potential bias in NFIRS due to fire department nonresponse. As a result, the USFA completed an analysis to identify fire departments that do not participate in NFIRS, characteristics of these departments, and
19The “National Fire Incident Reporting System Version 5.0 Fire Data Analysis Guidelines and Issues,” July 2011, is available at https://www.usfa.fema.gov/downloads/pdf/nfirs/nfirs_data_analysis_guidelines_issues.pdf.

20 Fire in the United States 2005-2014
whether their nonresponse impacted the representativeness of NFIRS. Undertaken on a regional and county basis, the analysis provided insight into what, if any, adjustments could be made to minimize the impact of possible reporting bias on the fire loss estimates. States of particular concern for nonreporting were located in the Northeastern and Western regions of the country, where the average rates of reporting were approximately 72 percent for each of these regions. By contrast, the Midwestern region had an estimated 87 percent reporting rate.
In 2011, USFA also completed a second NFIRS representativeness study as required by OMB. For this study, USFA compared the NFIRS database to NFPA proprietary data to determine the percentage of departments responding to the NFPA survey that also reported fires to NFIRS. It was determined that 87 percent of the 2009 NFPA survey respondents also reported fire incidents to NFIRS from 2007 to 2009. In 2009 alone, more than 18,000 additional departments (i.e., in addition to those responding to the NFPA survey) reported fires to NFIRS.
It is important to note that USFA, along with other federal agencies, does not use NFIRS data to derive state-level fire estimates. NFIRS data is used to show the fire problem at the national level. Because the findings in USFA’s NFIRS representativeness studies show high reporting rates, fire departments across the country appear to be well-represented in NFIRS.
Moreover, most of the NFIRS data exhibit stability from one year to the next, without radical changes. Results based on the full dataset are generally similar to those based on part of the data, another indication of data reliability. Although improvements could be made — the individual incident reports could and should be filled out more completely and more accurately than they are today (as can be said about most real-world data collections as large as NFIRS), and all participating departments should have the same reporting requirements — the overall portrayal is a reasonably accurate description of the fire situation in the U.S.
National Estimates
National estimates are estimates of the number of fire losses (i.e., fires, deaths, injuries and dollar loss) associated with a subset of the fire data. High-level summarized national estimates of the numbers for fires, deaths, injuries and dollar loss are based on NFPA’s annual Survey of Fire Departments for U.S. Fire Experience.20 With the exception of the NFPA estimates for total fires, structure (i.e., residential and nonresidential) fires, vehicle, outside and other fires, all other estimates are scaled-up national estimates or percentages, not just the raw totals from NFIRS. Because the NFIRS 5.0 data is not based on a statistically selected sample and does not represent a “complete” census of fire incidents, the raw counts of NFIRS data must be scaled up to national estimates. These estimates are based on a method of apportioning the NFPA estimates for total fires, structure fires, vehicle, outside and other fires.21 Generally speaking, the national estimates are derived by computing a percentage of fires, deaths, injuries or dollar loss in a particular NFIRS category and multiplying it by the corresponding total estimate from
20For information on NFPA’s survey methodology, please see NFPA’s report on fire loss in the U.S.: http://www.nfpa.org/news-and-research/fire-statistics-and-reports/fire-statistics/fires-in-the-us/overall-fire-problem/fire-loss-in-the-united-states.21National estimates are based on “The National Estimates Approach to U.S. Fire Statistics” by Hall and Harwood: http://www.nfpa.org/news-and-research/fire-statistics-and-reports/fire-statistics/how-nfpa-estimates-fires-and-fire-losses.

Methodology 21
the NFPA annual survey.22 For example, the national estimate for the number of injuries by age group used in the calculation for the fire injury rate per million population was computed by taking the percentage of NFIRS fire injuries (with known age) and multiplying it by the estimated total number of fire injuries from the NFPA survey. This methodology is the accepted practice of national fire data analysts.
Ideally, one would like to have all of the data come from one consistent data source. Because the “residential population protected” is not reported to NFIRS by many fire departments, and the reliability of that data element is suspect in many other cases, especially where a county or other jurisdiction is served by several fire departments that each report their population protected independently, this data element was not used. Instead, extrapolations of the NFIRS sample to national estimates were made using the NFPA survey for the gross totals of fires, deaths, injuries and dollar loss.
One problem with this approach is that the proportions of fires and fire losses differ between the large NFIRS sample and the NFPA survey sample. Nonetheless, to be consistent with approaches being used by other fire data analysts, the NFPA estimates of fires, deaths, injuries and dollar loss are used as a starting point. The details of the fire problem below this level are based on proportions from NFIRS. Because the proportions of fires and fire losses differ between NFIRS and the NFPA estimates, from time to time, this approach leads to minor inconsistencies. These inconsistencies will remain until all estimates can be derived from NFIRS data alone.
Data Quality
Data quality is an area of great importance. Three criteria are used in the monitoring of the data in NFIRS during the year: (1) the data are complete, (2) the data are accurate, and (3) the data are current. These criteria are monitored by creating reports from the database that show the number of reporting fire departments, the number of incidents by state, the number of invalid incidents, and the number of unreleased incidents. The USFA provides the reports to the state NFIRS program managers and works with them to resolve any data issues. Technical assistance (e.g., telephone support or site visits) is provided to states to help address any data quality and data reporting needs.
Audits of the data are performed during the year to identify any inconsistencies. The audits focus on three criteria: gaps in reporting, critical errors in the data, and outliers in the data. In particular, USFA works closely with states to monitor the quality of data coming from third party vendor software. Each state is responsible for enforcing that the NFIRS third party software sold by vendors in their state is compliant with NFIRS standards. USFA assists states in monitoring vendor data quality issues or contacts vendors directly to discuss an issue at a state’s request. Other data quality issues are questionable high dollar-loss incidents and questionable high numbers of fire deaths. Annually, USFA staff queries the database for questionable values (i.e., outliers) and verifies the values with state-level NFIRS program managers and local-level NFIRS program managers. The data quality steps are important to ensure that the data meet USFA’s three criteria before the data are released in the NFIRS PDR format.
22The NFPA summary estimates are used for the overall U.S. fire losses; for fire losses from structure, vehicle, outside and other fires; and as the basis for USFA’s estimates of residential and nonresidential building fires. The alternative approach for these summary numbers is to use the relative percentage of fires (or other loss measures) from NFIRS and scale up (multiply by) to the NFPA estimate of total fires.

22 Fire in the United States 2005-2014
In 2014, per OMB’s request, USFA completed a “Review and Assessment of Data Quality in the NFIRS.” This document covered a review of the system, the many robust data quality checks and mechanisms which are an integral part of NFIRS, and an assessment of the data quality both at the state level and at the data element level. The data element assessment focused on the most common data elements used in NFIRS data analyses. NFIRS data from the three most recent years available at the time of the report ’s development (2009 to 2011) were reviewed. Additionally, a section drawn from published NFPA documents covering the NFPA survey methodology was also included. The “Review and Assessment of Data Quality in the NFIRS” documentation was pending release at the time of this publication.
Unknown entries, incomplete loss reporting and unreported fires are also important considerations when assessing NFIRS data quality. These topics are discussed in more detail in the sections that follow.
Unknown Entries
Unknown entries are of the highest concern for data quality. On a fraction of the incident reports or casualty reports sent to NFIRS, the desired information for many data items either is not reported or is reported as “unknown.” The total number of blank or unknown entries is often larger than some of the important subcategories. For example, 47 percent of fatal fires in residential buildings reported from 2012 to 2014 do not have sufficient data recorded in NFIRS to determine fire cause.23 The lack of data, especially for these residential fatal fires, masks the true picture of the fire problem.
Many prevention and public education programs use NFIRS data to target at-risk groups or to address critical problems. Fire officials use the data in decision-making that affects the allocation of firefighting resources, and consumer groups and litigators use the data to assess product fire incidence. When the numbers of unknown entries are large, the credibility of the data suffers. In some cases, even after the best attempts by fire investigators, the information is truly unknown. In other cases, the information reported as unknown in the initial NFIRS report is not updated after the fire investigation is completed. Fire departments need to be more aware of the effect of incomplete data reporting, and they need to update the initial NFIRS report if additional information is available after the investigation. Through various USFA and NFDC training initiatives and efforts by various fire organizations, fire departments are encouraged to reduce the number of unknown entries by fully documenting the fire incident.
In making national estimates, the unknowns should not be ignored. The approach taken by USFA in presenting the data is to provide not only the “raw” percentages of each category but also the “adjusted” percentages computed using only those incidents for which data were provided. This calculation, in effect, distributes the fires for which the data are unknown in the same proportion as the fires for which the data are known, which may or may not be approximately right. Both the reported data and the adjusted data (if unknowns are present) are plotted on bar charts.
To illustrate, using the cause of residential building fires, cooking was determined as the fire cause for 41.3 percent of reported residential building fires from 2012 to 2014. Another 16.4 percent of reported fires had cause unknown. Thus, the percentage of fires that had their
23USFA, Topical Fire Report Series, “Civilian Fire Fatalities in Residential Buildings (2012-2014),” Volume 17, Issue 4, July 2016, https://www.usfa.fema.gov/downloads/pdf/statistics/v17i4.pdf.

Methodology 23
cause reported was 100 minus 16.4, which equals 83.6 percent. With the unknown causes proportioned like the known causes, the adjusted percentage of cooking fires in residential buildings can then be computed as 41.3 divided by 83.6, which equals 49.4 percent.24
Incomplete Loss Reporting
As troublesome as insufficient data for the various NFIRS data items can be, equally challenging is the apparent nonreporting of injuries and property loss associated with many fire incidents. For example, there are many reported fires where the flame spread indicates damage but property loss is not reported. It is notoriously difficult to estimate dollar loss, but an approximation is more useful than leaving the data item blank. The degree to which there is incomplete reporting of civilian fire deaths is more difficult to identify, as the numbers of deaths are relatively small. Incomplete reporting of civilian injuries is also difficult to ascertain, but the injury-per-fire profiles for most departments are within reason.
Unreported Fires
NFIRS only includes fires to which the fire service responded. In some states, fires attended by state fire agencies (such as forestry) are included; in other states, they are not.
Nonreporting to the National Fire Incident Reporting System
NFIRS includes fires from all states but does not include incidents from all fire departments within participating states; the percentage of fire departments reporting varies greatly from state to state. However, if the fires from the reporting departments are reasonably representative, this omission does not cause a problem in making useful national estimates for any but the smallest subcategories of data and some geographic analyses.
Some fire departments submit information on most, but not all, of their fires. Sometimes the confusion is systematic, such as when no-loss cooking fires or chimney fires are not reported. Sometimes it is inadvertent, such as when incident reports are lost or accidentally not submitted. The information that is received is assumed to be the total for the department and is extrapolated as such.
Nonreporting to the Fire Service
A very large number of fires are not reported to the fire service at all. Most are believed to be small fires in the home or in industry that go out by themselves or are extinguished by the occupant. Special surveys of homes and businesses are needed to estimate the unreported fires. No attempt is made here to estimate them. Studies undertaken in the mid-1970s, mid-1980s, and again in the mid-2000s on unreported residential fires indicated that a substantial number of fires are not reported to local fire departments. The 2004 to 2005 CPSC study on unreported residential fires noted that, of the estimated number of fires in residences, only 3 percent were reported to fire departments and 97 percent were not.25 Although the vast majority of fire incidents are unreported because they are small, confined and immediately extinguished, they are still fires. Even the largest fire starts small. Hence, all fires, regardless of size, merit prevention attention and analytic investigation.
24USFA, Topical Fire Report Series, “Residential Building Fires (2012-2014),” Volume 17, Issue 1, June 2016, http://www.usfa.fema.gov/downloads/pdf/statistics/v17i1.pdf.25Greene, Michael A. and Craig Andres, Division of Hazard Analysis, Directorate for Epidemiology, U.S. CPSC, “2004-2005 National Sample Survey of Unreported Residential Fires,” July 2009.

24 Fire in the United States 2005-2014
Structures Versus Buildings
NFIRS 5.0 allows for the differentiation between buildings and nonbuildings. In NFIRS, a structure is a built object that can include platforms, tents, connective structures (e.g., bridges, fences), telephone poles, and various other structures in addition to buildings. From 2005 to 2014, analyses of NFIRS structure fires show that, in general, the majority (94 percent) of structure fires occurred in buildings.
Structure fires are defined by the NFIRS incident type — Incident Type 110 series (structure fires) and Incident Type 120 series (fires in mobile property used as a fixed structure).26 These incident types are:
ĵ 111 Building fire. ĵ 112 Fires in structure other than in a building.27
ĵ 113 Cooking fire, confined to container. ĵ 114 Chimney or flue fire, confined to chimney or flue. ĵ 115 Incinerator overload or malfunction, fire confined. ĵ 116 Fuel burner/boiler malfunction, fire confined. ĵ 117 Commercial compactor fire, confined to rubbish. ĵ 118 Trash or rubbish fire, contained. ĵ 120 Fire in mobile property used as a fixed structure, other. ĵ 121 Fire in mobile home used as fixed residence. ĵ 122 Fire in motor home, camper, recreational vehicle. ĵ 123 Fire in portable building, fixed location.
As building fires are a subset of structure fires, they are defined as structure fires where the structure type is an enclosed building, a fixed portable, or a mobile structure. By definition, this excludes nonbuilding structures. Previous USFA analyses demonstrated that confined structure fire incidents with full incident reporting primarily occurred in buildings. To accommodate the confined fire incident types with abbreviated incident reporting, the incident is also assumed to be a building if the structure type is not specified. In terms of NFIRS data, building fires are therefore defined using the following criteria:
ĵ NFIRS Version 5.0 data.
ĵ Aid Types: Ý 1 Mutual aid received. Ý 2 Automatic aid received. Ý 5 Other aid given.
Note: Mutual aid given and automatic aid given (Aid Types 3 and 4) were excluded to avoid double counting of incidents.
ĵ Incident Types 111 to 123 (excluding Incident Type 112): Ý 111 Building fire. Ý 113 Cooking fire, confined to container. Ý 114 Chimney or flue fire, confined to chimney or flue. Ý 115 Incinerator overload or malfunction, fire confined.
26Note that Incident Type 110 is not included. Incident Type 110 is a conversion code for NFIRS 4.1. Incident Type 110 is not a valid code for data collected in NFIRS 5.0. Incidents in the NFIRS 5.0 database with Incident Type 110 are incidents collected under the NFIRS 4.1 system that are converted to NFIRS 5.0 compatible data.27Preliminary findings noted that the fires coded as Incident Type 112 appear to be in buildings. A more detailed look at these incident types is required to determine whether they were coded correctly.

Methodology 25
Ý 116 Fuel burner/boiler malfunction, fire confined. Ý 117 Commercial compactor fire, confined to rubbish. Ý 118 Trash or rubbish fire, contained. Ý 120 Fire in mobile property used as a fixed structure, other. Ý 121 Fire in mobile home used as fixed residence. Ý 122 Fire in motor home, camper, recreational vehicle. Ý 123 Fire in portable building, fixed location.
Notes: 1. Incident Types 113 to 118 do not specify if the structure is a building.2. Incident Type 112 was included in data analyses prior to 2008, as previous
analyses showed that Incident Types 111 and 112 were used interchangeably. As of 2008, Incident Type 112 was excluded.
ĵ Structure Type: Ý For Incident Types 113 to 118:
f 1—Enclosed building, or f 2—Fixed portable or mobile structure, or f Structure Type not specified (null entry).
Ý For Incident Types 111 and 120 to 123: f 1—Enclosed building, or f 2—Fixed portable or mobile structure.
The distinction between buildings and nonbuildings is particularly important when determining the effectiveness of engineered fire safety features, such as smoke alarms and residential sprinklers. These important components of early fire detection and automatic suppression apply to buildings and not necessarily to other types of structures. To facilitate analysis of these components and to acknowledge that prevention efforts generally are focused on buildings, the USFA separates the subset of buildings from the rest of the structures. For these reasons, the USFA focuses on producing building fire and loss estimates.
The USFA’s Fire Estimate Summary Series, as well as 2003 to 2014 national estimates of residential and nonresidential building fires and losses, are published at https://www.usfa.fema.gov/data/statistics/order_download_data.html. For information on the USFA’s methodology for computing national estimates of residential and nonresidential building fires and losses, please review USFA’s National Estimates Methodology for Building Fires and Losses (August 2012) at https://www.usfa.fema.gov/downloads/pdf/statistics/national_estimate_methodology.pdf.
Computing Trends
One FAQ is how much a particular aspect of the fire problem has changed over time. The usual response is in terms of a percent change from one year to another. In dealing with real-world data that fluctuate from year to year, a percent change from one specific year to another can be misleading. This is especially true when the beginning and ending data points are extremes, either high or low. For example, Table 5 shows that the percent change from 8,950 fire injuries in one- and two-family residential buildings in 2005 to 7,550 fire injuries in 2014 would be a substantial decrease of 15.6 percent; however, if 2006 is chosen as the beginning data point (8,225 fire injuries), this change would show an 8.2 percent decrease. As trends in the U.S. fire problem are of interest, USFA presents the computed best-fit linear trend line (which smoothes fluctuations in the year-to-year data) and presents the change over time based on this trend line. In this example, the overall 10-year trend is a decrease in injuries of 10.2 percent. As noted above, trends that incorporate NFIRS data from the 5.0 system may have subtle changes as a result of the system design and not a true trend change.
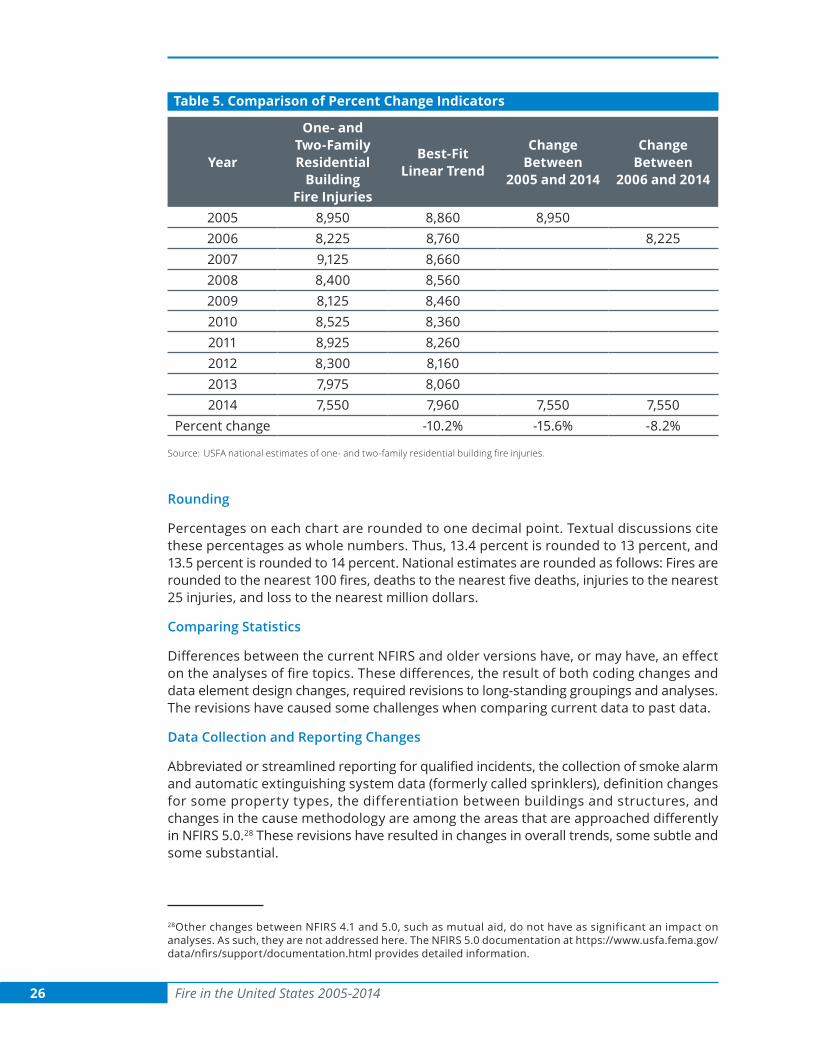
26 Fire in the United States 2005-2014
Table 5. Comparison of Percent Change Indicators
Year
One- and Two-Family Residential
Building Fire Injuries
Best-Fit Linear Trend
Change Between
2005 and 2014
Change Between
2006 and 2014
2005 8,950 8,860 8,9502006 8,225 8,760 8,2252007 9,125 8,6602008 8,400 8,5602009 8,125 8,4602010 8,525 8,3602011 8,925 8,2602012 8,300 8,1602013 7,975 8,0602014 7,550 7,960 7,550 7,550
Percent change -10.2% -15.6% -8.2%
Source:USFAnationalestimatesofone-andtwo-familyresidentialbuildingfireinjuries.
Rounding
Percentages on each chart are rounded to one decimal point. Textual discussions cite these percentages as whole numbers. Thus, 13.4 percent is rounded to 13 percent, and 13.5 percent is rounded to 14 percent. National estimates are rounded as follows: Fires are rounded to the nearest 100 fires, deaths to the nearest five deaths, injuries to the nearest 25 injuries, and loss to the nearest million dollars.
Comparing Statistics
Differences between the current NFIRS and older versions have, or may have, an effect on the analyses of fire topics. These differences, the result of both coding changes and data element design changes, required revisions to long-standing groupings and analyses. The revisions have caused some challenges when comparing current data to past data.
Data Collection and Reporting Changes
Abbreviated or streamlined reporting for qualified incidents, the collection of smoke alarm and automatic extinguishing system data (formerly called sprinklers), definition changes for some property types, the differentiation between buildings and structures, and changes in the cause methodology are among the areas that are approached differently in NFIRS 5.0.28 These revisions have resulted in changes in overall trends, some subtle and some substantial.
28Other changes between NFIRS 4.1 and 5.0, such as mutual aid, do not have as significant an impact on analyses. As such, they are not addressed here. The NFIRS 5.0 documentation at https://www.usfa.fema.gov/data/nfirs/support/documentation.html provides detailed information.

Methodology 27
Confined Fires
“Confined fires” are fires contained to certain types of equipment or objects within a structure. In NFIRS, a confined structure fire is defined by Incident Type codes 113 to 118.29 Confined structure fires are typically small fire incidents that are limited in extent, staying within pots, fireplaces or certain other noncombustible containers. Confined structure fires rarely result in serious injury or large content loss and are expected to have no significant accompanying property loss due to flame damage.30
NFIRS allows abbreviated reporting for confined structure fires. For these incident types, the Basic Module is required to be completed. NFIRS users may also optionally complete the Fire Module and the Structure Fire Module for confined fires, although it is not required. If any civilian or firefighter injuries occurred as a result of the confined fire, the Civilian Fire Casualty Module and/or the Fire Service Casualty Module are required to be completed for each injury reported on the Basic Module.
The limited reporting of confined, low-loss structure fires allows the fire service to capture incidents that either may have gone unreported prior to the introduction of NFIRS 5.0 or were reported, but as a nonfire incident, as little to no loss was involved.31 Data from this reporting option for structure fires was investigated in a 2006 USFA report, “Confined Structure Fires.” The addition of these fires results in increased proportions of cooking and heating fires in analyses of structure fire cause. In other analyses, the inclusion of confined fires may result in larger unknowns, as detailed reporting of fire specifics is not required. In many USFA analyses, the confined fires are analyzed separately from the nonconfined fires to account for the fact that detailed reporting is not required for the confined fires. In 2014, confined structure fires accounted for 19 percent of all reported fires and 48 percent of all reported structure fires. Of the confined structure fires, 82 percent were no- or low-loss cooking fires (68 percent) and heating fires (14 percent).
Structure Fire Cause Methodology
Since the introduction of NFIRS 5.0, the implementation of the cause hierarchy has resulted in a steady increase in the percentages of unknown fire causes. This increase may be due, in part, to the fact that the original cause hierarchy (described in “Fire in the United States 1995-2004,” 14th edition) does not apply as well to NFIRS 5.0. Causal information collected as part of NFIRS 5.0 was not incorporated in the old hierarchy. As a result, many incidents were assigned to the unknown cause category. As the hierarchy was originally designed for structures, incidents that did not fit well into the structure cause categories were also assigned to the unknown category.
29The confined structure fire incident type code descriptions are as follows: 113-Cooking fire, confined to container; 114-Chimney or flue fire, confined to chimney or flue; 115-Incinerator overload or malfunction, fire confined; 116-Fuel burner/boiler malfunction, fire confined; 117-Commercial compactor fire, confined to rubbish; and 118-Trash or rubbish fire, contained.30Content loss includes losses to the contents of a structure due to damage by fire, smoke, water and overhaul. Property loss includes losses to the structure itself or to the property itself. For confined fires, the expectation is that the fire did not spread beyond the container (or rubbish for Incident Type code 118), and therefore, there was no property damage (damage to the structure itself) from the flames. However, there could be property damage as a result of smoke, water and overhaul.31Some states routinely reported such nonloss fires as smoke scares. The result, from a reporting viewpoint, is that the incident is reported but not coded as a fire incident.

28 Fire in the United States 2005-2014
Structure Fires
To capture the wealth of data available in NFIRS 5.0, USFA developed a modified version of the previous cause hierarchy for structure fires as shown in Table 6. The revised schema provides three levels of cause descriptions: a set of more detailed causes (priority cause description), a set of midlevel causes (cause description), and a set of high-level causes (general cause description). The priority cause description and the cause description existed previously as part of the original cause hierarchy but have been expanded to capture the 5.0 data.
Table 6. Three-Level Structure Fire Cause Hierarchy
Priority Cause Description(in hierarchical order) Cause Description General Cause
DescriptionExposure Exposure ExposureIntentional Intentional FiresettingCause under investigation Cause under investigation UnknownChildren playing
Playing with heat source FiresettingOther playingNatural Natural NaturalFireworks
Other heatFlame, heatExplosives
Smoking SmokingHeating Heating
EquipmentCooking CookingAir conditioning AppliancesElectrical distribution Electrical malfunction ElectricalAppliances Appliances
EquipmentSpecial equipmentOther equipment
Processing equipmentTorches Open flame Flame, heatService equipment
Other equipment EquipmentVehicle, engineUnclassified fuel-powered equipmentUnclassified equipment with other or unknown fuel source Unknown Unknown
Unclassified electrical malfunction Electrical malfunction Electrical
Matches, candlesOpen flame
Flame, heat
Open fireOther open flame, spark
Other heatFriction, hot materialEmber, rekindle Open flameOther hot object Other heat

Methodology 29
Table 6. Three-Level Structure Fire Cause Hierarchy — Continued
Priority Cause Description(in hierarchical order) Cause Description General Cause
DescriptionNatural condition, other Natural NaturalHeat source or product misuse Other unintentional, careless Unknown
Equipment operation deficiency Equipment misoperation,
failure EquipmentEquipment failure, malfunctionTrash, rubbish Unknown
UnknownOther unintentional Other unintentional, carelessExposure (fire spread, other) Exposure ExposureUnknown Unknown Unknown
Source: USFA.Note: Firesareassignedtoacausecategoryinthehierarchicalordershown.Forexample,ifthefireisjudgedtobeintentionallyset
andamatchwasusedtoigniteit,itisclassifiedasintentionalandnotopenflamebecauseintentionalishigheronthelist.
The causes of fires are often a complex chain of events. To make it easier to grasp the “big picture,” the 16 midlevel categories of fire causes, such as heating, cooking, and playing with heat source, are used by USFA. The alternative is to present scores of detailed cause categories or scenarios, each of which would have a relatively small percentage of fires. For example, heating includes subcategories such as misuse of portable space heaters, wood stove chimney fires, and fires involving gas central heating systems. Experience has shown that the larger categories are useful for an initial presentation of the fire problem. A more detailed analysis can follow.
Fires are assigned to one of the 16 midlevel cause groupings using a hierarchy of definitions, approximately as shown in Table 7.32 A fire is included in the highest category into which it fits on the list. If it does not fit the top category, then the second one is considered, and if not that one, the third and so on. (See the note section in Table 6 for an example.)
Vehicle, Outside and Other Fires
While these cause categories have usefulness for the other property types — vehicle, outside and other fires — there are limitations. For these property types, the causes of fires are based on the distributions of the NFIRS cause of ignition data element. This data element captures a very broad sense of the cause of the fire.
Deaths, Injuries and Dollar Loss
In previous analyses, the cause sections have included the distributions of deaths, injuries and dollar loss by fire cause. In principle, it is the cause of the fire that results in deaths, injuries and dollar loss which should be analyzed, not numbers of deaths and injuries associated with fire causes. Therefore, analyses of fire cause address fires that result in deaths (fatal fires), fires that result in injuries, and fires that result in dollar loss.
32The structure fire cause hierarchy and definitions can be found in the document “National Fire Incident Reporting System Version 5.0 Fire Data Analysis Guidelines and Issues,” July 2011, available at https://www.usfa.fema.gov/downloads/pdf/nfirs/nfirs_data_analysis_guidelines_issues.pdf. The hierarchy involves a large number of subcategories that are later grouped into the 16 midlevel cause categories, then the seven high-level cause groupings.

30 Fire in the United States 2005-2014
Other Considerations
An additional problem to keep in mind when considering the rank order of causes is that sufficient data to categorize the causes was not reported to NFIRS for all fatal fires in the database. The rank order of causes might be different than shown here if the cause profile for the fires where causes were not reported to NFIRS was substantially different from the profile for the fires where causes were reported. However, there is no information available to indicate that there is a major difference between the known causes and the unknown causes, so USFA’s present best estimate of fire causes is based on the distribution of the fires with known causes.
Table 7. Midlevel Cause Groupings
Cause Category DefinitionExposure Caused by heat spreading from another hostile fire.Intentional33 Cause of ignition is intentional, or fire is deliberately set.Cause under investigation
Cause is under investigation, and a valid NFIRS Arson Module is present. (This category was formerly called “Investigation with Arson Module.”)
Playing with heat source
Includes all fires caused by individuals playing with any materials contained in the categories below, as well as fires where the factors contributing to ignition include playing with heat source. Children playing with fire is included in this category.
Natural Caused by the sun’s heat, spontaneous ignition, chemicals, lightning, static discharge, high winds, storms, high water including floods, earthquakes, volcanic action, and animals.
Other heat Includes fireworks, explosives, flame/torch used for lighting, heat or spark from friction, molten material, hot material, heat from hot or smoldering objects.
Smoking Cigarettes, cigars, pipes, and heat from undetermined smoking materials.
Heating Includes confined chimney or flue fire, fire confined to fuel burner/boiler malfunction, central heating, fixed and portable local heating units, fireplaces and chimneys, furnaces, boilers, water heaters as source of heat.
Cooking Includes confined cooking fires, stoves, ovens, fixed and portable warming units, deep fat fryers, open grills as source of heat.
Appliances Includes televisions, radios, video equipment, phonographs, dryers, washing machines, dishwashers, garbage disposals, vacuum cleaners, hand tools, electric blankets, irons, hair dryers, electric razors, can openers, dehumidifiers, heat pumps, water cooling devices, air conditioners, freezers and refrigeration equipment as source of heat.
Electrical malfunction
Includes electrical distribution, wiring, transformers, meter boxes, power switching gear, outlets, cords, plugs, surge protectors, electric fences, lighting fixtures, electrical arcing as source of heat.
33Fires caused by intentional actions include, but are not limited to, fires that are deemed to be arson. Intentional fires are those fires that are deliberately set, and they include fires that result from the deliberate misuse of a heat source and fires of an incendiary nature (arson) that require fire service intervention. For information and statistics on arson fires only, refer to the Uniform Crime Reporting Program arson statistics from the U.S. Department of Justice, FBI, Criminal Justice Information Services Division, https://www.fbi.gov/about-us/cjis/ucr/ucr.

Methodology 31
Table 7. Midlevel Cause Groupings — Continued
Cause Category DefinitionOther equipment
Includes special equipment (radar, X-ray, computer, telephone, transmitters, vending machine, office machine, pumps, printing press, gardening tools, agricultural equipment), processing equipment (furnace, kiln, other industrial machines), service, maintenance equipment (incinerator, elevator), separate motor or generator, vehicle in a structure, unspecified equipment.
Open flame, spark (heat from)
Includes torches, candles, matches, lighters, open fire, ember, ash, rekindled fire, backfire from internal combustion engine as source of heat.
Other unintentional, careless
Includes misuse of material or product, abandoned or discarded materials or products, heat source too close to combustibles, other unintentional (mechanical failure/malfunction, backfire).
Equipment misoperation, failure
Includes equipment operation deficiency, equipment malfunction.
Unknown Cause of fire undetermined or not reported.Source: USFA.
NFIRS fire causal data can be analyzed in many ways, such as by the heat source, equipment involved in ignition, factors contributing to ignition, or many other groupings. The hierarchy of causes has proven to be useful in understanding the fire problem and targeting prevention, but other approaches are useful too. Because the NFIRS database stores records fire-by-fire, and not just in summary statistics, a wide variety of analyses is possible.
The cause categories displayed in the graphs of USFA’s NFIRS data-related reports are listed in the same order to make comparisons easier from one to another. The y-scale varies from figure to figure depending on the largest percentage that is shown; the y-scale on a figure with multiple charts, however, is always the same.
Differences Between the National Fire Incident Reporting System Data and National Fire Protection Association Survey Data
As there are differences between any two analysts using NFIRS data because of the many assumptions and decisions about how to analyze incomplete and imperfect data, there can be inconsistencies between different data sources. In particular, there are discrepancies between the NFIRS 5.0 data and the NFPA annual survey data. In general, NFIRS 5.0 deaths and injuries per 1,000 fires are lower than those of NFPA. In addition, with the exception of 2007 and 2012 to 2014, NFIRS 5.0 dollar loss per fire was lower than that of NFPA.34
From 2010 to 2014, NFIRS collected fire incident data from an average of 20,460 fire departments each year.35 The NFPA annual survey of fire departments36 collects data from nearly 3,000 fire departments. NFIRS is not a statistically selected sample; however, it is a very large set of fire incidents estimated to be, on average, two-thirds of reported fires. The NFPA survey is based on a statistical sample. These two datasets often yield dramatically different fire rates. The NFPA survey collects tallied totals, whereas NFIRS
34As NFIRS 5.0 captures a large number of small, low-loss fires (confined fires) thought to be unreported previously, these differences in loss rates per fire may not be surprising.35This figure excludes mutual-aid incidents.36“Fire Loss in the United States,” NFPA Journal, generally the September/October issue each year.

32 Fire in the United States 2005-2014
collects individual incident reports. The proportion of native NFIRS 5.0 fire data rose from 89 percent of all NFIRS fire incidents collected in 2004 to 100 percent of all NFIRS fire incidents starting in 2009 (Table 4). It is not surprising, therefore, that there are differences between the NFPA annual survey results and the NFIRS results. In the years examined (2005 to 2014), the common thread was the increase in the ratios of NFIRS data to the NFPA estimates. In general, the deaths reported to NFIRS represented a smaller fraction of the NFPA national estimate of deaths than the NFIRS number of fires represented of the NFPA estimate of fires. Estimates of dollar loss are notoriously inexact; it is not surprising that the NFIRS dollar loss changed from year to year with respect to NFPA totals (Figure 2).
Figure 2. Ratio of Raw National Fire Incident Reporting System Sample to National Fire Protection Association National Estimates
Ratio
0.0000
0.1000
0.2000
0.3000
0.4000
0.5000
0.6000
0.7000
0.8000
Fires
Deaths
Injuries
Dollar Loss
2014201320122011201020092008200720062005
Fires Deaths Injuries Dollar Loss2005 0.56 0.47 0.50 0.472006 0.58 0.57 0.55 0.542007 0.63 0.55 0.53 0.642008 0.64 0.59 0.57 0.622009 0.67 0.61 0.56 0.572010 0.73 0.63 0.59 0.622011 0.71 0.67 0.60 0.702012 0.65 0.65 0.56 0.652013 0.67 0.57 0.56 0.702014 0.68 0.61 0.58 0.75
Sources: NFPA and NFIRS.Note: The 2007 dollar loss excludes the one-time large loss of an estimated $1.8 billion associated with the 2007 California
Fire Storm. The 2008 dollar loss excludes the one-time large loss of an estimated $1.4 billion associated with the 2008 CaliforniaWildfires.Theselossesdonothaveassociatedpropertyuses.The2010dollarlossexcludestheFourmileCanyonWildfireinColoradowithanestimatedpropertylossof$217million.The2012dollarlossexcludestheWaldoCanyon Fire in Colorado with an estimated property loss of $453.7 million, the High Park Fire also in Colorado with an estimated property loss of $113.7 million, and the $400 million property damage to the USS Miami (submarine). The 2013 dollar loss excludes the Black Forest Fire in Colorado with an estimated property loss of $420.5 million.

Methodology 33
Looking at the problem from a different perspective, Figure 3 shows the number of deaths per 1,000 fires, injuries per 1,000 fires, and dollar loss per fire from NFIRS and NFPA from 2005 to 2014. In general, deaths and injuries per 1,000 fires were lower for NFIRS than for NFPA. With the exception of 2007 and 2012 to 2014, NFIRS dollar loss per fire was lower than that of NFPA. This difference may be the result of more low-loss fires being reported to NFIRS as a result of the abbreviated reporting option for these fires.
Between 2005 and 2014, NFIRS had, on average, a difference of 9 percent fewer fire deaths per 1,000 fires than the NFPA survey data. Annually, the NFIRS percent differences of fire deaths per 1,000 fires ranged from 0.6 percent more to 16 percent fewer than that of NFPA. In 2014, NFIRS showed 11 percent fewer fire deaths per 1,000 fires than NFPA.
Injuries per 1,000 fires revealed a greater disparity between the two datasets. On average, between 2005 and 2014, NFIRS had a difference of 14 percent fewer fire injuries per 1,000 fires than the NFPA survey.
On average over the 10-year period, the NFIRS dollar loss per fire was 4 percent lower than that of the NFPA survey. In 2008 and 2011, NFIRS dollar loss was only 3 percent and 2 percent lower, respectively, than the dollar loss estimates from the NFPA survey, but a much greater disparity was revealed in 2005 (15 percent lower), 2009 (15 percent lower), 2010 (15 percent lower), and 2014 (9 percent higher). In 2007, 2 percent more dollar loss was reported to NFIRS per fire than was reflected by the NFPA survey estimates; for each of the years 2012 and 2013, 1 percent and 5 percent more dollar loss was reported to NFIRS per fire.
Figure 3. National Fire Incident Reporting System Versus National Fire Protection Association Survey: Losses per Fire
1.6
1.8
2.0
2.2
2.4
2.6
2.8
NFIRS
NFPA
2014201320122011201020092008200720062005
Deaths (per 1,000 fires) Deaths (per 1,000 fires)Year NFIRS NFPA2005 1.92 2.292006 1.93 1.982007 1.92 2.202008 2.13 2.292009 2.04 2.232010 2.02 2.342011 2.04 2.162012 2.09 2.082013 2.21 2.612014 2.25 2.52

34 Fire in the United States 2005-2014
Figure 3. National Fire Incident Reporting System Versus National Fire Protection Association Survey: Losses per Fire — Continued
Injuries (per 1,000 fires)
9.0
9.4
9.8
10.2
10.6
11.0
11.4
11.8
12.2
12.6
13.0
13.4
NFIRS
NFPA
2014201320122011201020092008200720062005
Injuries (per 1,000 fires)Year NFIRS NFPA2005 9.98 11.192006 9.48 9.982007 9.52 11.352008 10.30 11.512009 10.65 12.642010 10.61 13.312011 10.59 12.592012 10.47 12.002013 10.64 12.842014 10.34 12.15
Dollar Loss (per fire) Adjusted to 2014 Dollars
$6,000
$6,500
$7,000
$7,500
$8,000
$8,500
$9,000
$9,500
$10,000
$10,500
$11,000
$11,500
NFIRS
NFPA
2014201320122011201020092008200720062005
Dollar Loss (per fire)*
Year NFIRS NFPA2005 6,840 8,0752006 7,560 8,0842007 9,569 9,4122008 10,308 10,6642009 8,729 10,2542010 7,872 9,2762011 8,676 8,8312012 8,672 8,5942013 9,534 9,1012014 9,780 8,941
Sources: NFPA, NFIRS and CPI.Notes: The 2007 dollar loss excludes the one-time large loss of an estimated $1.8 billion associated with the 2007 California
Fire Storm. The 2008 dollar loss excludes the one-time large loss of an estimated $1.4 billion associated with the 2008 CaliforniaWildfires.Theselossesdonothaveassociatedpropertyuses.The2010dollarlossexcludestheFourmileCanyonWildfireinColoradowithanestimatedpropertylossof$217million.The2012dollarlossexcludestheWaldoCanyon Fire in Colorado with an estimated property loss of $453.7 million, the High Park Fire also in Colorado with an estimated property loss of $113.7 million, and the $400 million property damage to the USS Miami (submarine). The 2013 dollar loss excludes the Black Forest Fire in Colorado with an estimated property loss of $420.5 million.
*Adjusted to 2014 dollars.

Methodology 35
Other minor differences appear when reviewing losses by general property type as shown in Figure 4. Specifically, the distributions of fires across property types between NFIRS and NFPA were quite similar, which is reassuring. Over the 10-year period, the proportions of structure fires (both residential and nonresidential) and outside and other fires were higher in the NFIRS reported data, while the proportion of vehicle fires represented by the NFPA estimate was higher than what was reported to NFIRS. Regardless of the specifics, the distributions were reasonably comparable.
Figure 4. Comparison of National Fire Incident Reporting System Data with National Fire Protection Association Estimates by General Property Type (10-year average, 2005-2014)
0.0 10.0 20.0 30.0 40.0 50.0 60.0
NFPANFIRS
Outside and other
Vehicle
Nonresidential
Residential28.727.6
8.1
7.5
14.1
16.2
49.248.8
Percent
Fires
0.0 20.0 40.0 60.0 80.0 100.0
NFPANFIRS
Outside and other
Vehicle
Nonresidential
Residential75.2
84.4
3.7
2.6
16.6
11.3
4.51.7
Percent
Deaths
0.0 20.0 40.0 60.0 80.0 100.0
NFPANFIRS
Outside and other
Vehicle
Nonresidential
Residential77.478.9
7.8
8.6
6.5
8.0
8.24.6
Percent
Injuries
0.0 10.0 20.0 30.0 40.0 50.0 60.0 70.0
NFPANFIRS
Outside and other
Vehicle
Nonresidential
Residential54.9
60.8
26.7
23.4
10.9
11.9
7.53.8
Percent
Dollar Loss Adjusted to 2014 Dollars
Sources: NFPA and NFIRS.

36 Fire in the United States 2005-2014
The deaths, injuries and dollar losses that resulted from these fires were consistently more heavily represented in residential structures in the NFPA estimates. For the other major property categories (except vehicular fire injuries and dollar loss and nonresidential structure fire injuries), the NFPA percentages of losses were consistently less than those resulting from NFIRS data.
One of the more important consequences of these distributions is in the creation of estimates of the various parts of the U.S. fire problem. For example, it is noted that the 2014 NFPA residential structure fire estimates reflect 85 percent of all fire deaths (2,795 of 3,275) and 77 percent of all fire injuries (12,175 of 15,775). If the 2014 NFIRS percentages for residential structure fire deaths (75.0 percent) and injuries (78.0 percent) were applied to the overall 2014 NFPA estimates of fire deaths and injuries, the estimates would yield nearly 2,455 deaths and 12,300 injuries resulting from residential structure fires. The scaled up estimate of residential structure fire deaths is 12 percent lower than the NFPA estimate of residential structure fire deaths, whereas the scaled up estimate of residential structure fire injuries is 1 percent higher than the NFPA estimate of residential structure fire injuries.
The reasons for these differences in distributions between NFPA and NFIRS are not known. It may be that some departments reporting summary data to NFPA inadvertently undercount their casualties and losses when reporting on the NFPA survey forms. Another possibility is that there are data entry errors in NFIRS, with larger numbers of deaths, injuries and dollar loss per incident record being entered into the database despite edit checks at state and federal levels. (It appears that at least some of the dollar loss difference is due to this.)
A third possibility for the differences is that, with the introduction of abbreviated reporting of small, low- or no-loss confined fires in NFIRS, the NFPA sample of these fires is not adequately represented. It is known that, prior to abbreviated NFIRS reporting, some departments did not fill out NFIRS forms for minor fires, such as food on stoves or chimney fires. It is not clear whether these fires were included in the department’s report to NFPA and whether this reporting has changed. Also unknown is the actual extent of this problem.
A fourth possibility is that some jurisdictions use NFIRS as a tracking system for fire casualty information without providing the related incident data or vice versa. This situation does indeed occur from time to time in NFIRS. Again, it is unclear how these incidents and their corresponding losses are reported to NFPA.
Lastly, it could be that techniques used to generate the NFPA estimates unintentionally favor residential buildings or that NFIRS, because it is a voluntary system and not a true statistical sample, may result in fewer residential losses.
Resolving the differences between the two major sources of fire statistics in the U.S. is important to prevent confusion among users of the data.
Organization of Report
This report presents an overview of the national fire problem in terms of estimates of the total numbers of fires, deaths, injuries, and dollar loss (the four principal measures used to describe the fire problem) as well as 10-year trends. It also provides an overview and 10-year trends of building (residential and nonresidential) fires and losses. Trends in vehicle and other mobile properties and outside and other properties are also analyzed. Additionally, the report covers causes of fires and fires resulting in losses, as well as fire casualties in terms of death and injury rates and relative risk.

The National Fire Problem 37
The National Fire ProblemFire departments in the U.S. responded to nearly 1.3 million fire calls in 2014.37 The U.S. fire problem no longer ranks as the most severe of the industrialized nations, yet each year thousands of Americans die, tens of thousands of people are injured, and property losses reach billions of dollars. Falling from among the top three nations in terms of the fire death rate two decades ago, the U.S. has the 12th highest fire death rate out of the 28 industrialized nations examined by the World Fire Statistics Centre.38 Nonetheless, the U.S. continues to experience fire death rates 1.5 to 2.5 times higher than those of most of its sister nations.39 Many Americans are not aware of this or of the nature of the fire problem.
There are huge indirect costs of fire as well — temporary lodging, lost business revenues, medical expenses, psychological damage, and others. To put this in context, the annual losses from floods, hurricanes, tornadoes, earthquakes, and other natural disasters combined in the U.S. average just a fraction of those from fires.40
Fires and Losses (10-Year Trends, 2005-2014)
Over the 10 years from 2005 to 2014, the U.S. had an annual average of 1,423,600 fires resulting in 3,220 civilian deaths, 16,925 civilian injuries, and $13 billion in direct property loss each year.41 In terms of estimates of fires, fire deaths and fire injuries, the estimates are lower than they were 10 years ago. When USFA was established in 1974, annual fire deaths were estimated at 12,000.42 The goal was to reduce deaths by 50 percent within 25 years; that goal was met. By 2012, estimates of civilian fire deaths were at their lowest level (2,855). While fire deaths are still trending downward, in 2014, estimates of fire deaths were 15 percent higher than they were in 2012.
Figure 5 shows the 10-year trends for all fires and losses from 2005 to 2014. Fires declined by 23 percent over the 10 years. Trends in fire-related deaths, injuries and dollar loss also declined by 12 percent, 8 percent and 21 percent, respectively.
37NFPA, “Fire Loss in the United States During 2014,” September 2015.38The Geneva Association, “ World Fire Statistics,” Bulletin, Number 29, April 2014, ht tps://www.genevaassociation.org/media/874729/ga2014-wfs29.pdf. Note: Belgium was excluded from this review, as only its 2004 fire death rates were available.39The Geneva Association, “ World Fire Statistics,” Bulletin, Number 29, April 2014, ht tps://www.genevaassociation.org/media/874729/ga2014-wfs29.pdf. As reported, the U.S. had a fire death rate of 1.11 fire deaths per 100,000 population for 2008 to 2010; the Netherlands had the lowest comparable European fire death rate at 0.46 per 100,000 population. Switzerland’s fire death rate was lower still at 0.34, but it excluded firefighter deaths.40NWS, National Hazard Statistics, 2014, http://www.nws.noaa.gov/om/hazstats/sum14.pdf.41Annual average estimates are based on NFPA estimates of fires, deaths, injuries and dollar loss. Fires are rounded to the nearest 100; deaths to the nearest five; injuries to the nearest 25; and dollar loss to the nearest billion dollars. The 2005 to 2013 dollar-loss values were adjusted to 2014 dollars.42“America Burning.” The Report of the National Commission on Fire Prevention and Control, 1973. NFPA changed their estimation methodology in the mid-1970s. As a result, by 1977, the estimate of fire deaths had already dropped to approximately 7,400 and rose the next year to 7,700. Nevertheless, it is fair to say that the 50 percent reduction in fire deaths was achieved.

38 Fire in the United States 2005-2014
Figure 5. Fires and Fire Losses (2005-2014 )
1,200
1,250
1,300
1,350
1,400
1,450
1,500
1,550
1,600
1,650
1,700
Trend
Fires
2014201320122011201020092008200720062005
Fires (in thousands) Fires (thousands)Year Value2005 1,602.02006 1,642.52007 1,557.52008 1,451.52009 1,348.52010 1,331.52011 1,389.52012 1,375.02013 1,240.02014 1,298.0
10-year trend (%) -22.7%
1,500
2,000
2,500
3,000
3,500
4,000
4,500
Trend
Fire Deaths
2014201320122011201020092008200720062005
Fire Deaths DeathsYear Value2005 3,6752006 3,2452007 3,4302008 3,3202009 3,0102010 3,1202011 3,0052012 2,8552013 3,2402014 3,275
10-year trend (%) -11.7%

The National Fire Problem 39
Figure 5. Fires and Fire Losses (2005-2014 ) — Continued
15,500
16,000
16,500
17,000
17,500
18,000
18,500
Trend
Fire Injuries
2014201320122011201020092008200720062005
Fire Injuries InjuriesYear Value2005 17,9252006 16,4002007 17,6752008 16,7052009 17,0502010 17,7202011 17,5002012 16,5002013 15,9252014 15,775
10-year trend (%) -7.9%
$8.0
$10.0
$12.0
$14.0
$16.0
$18.0
Trend(Adjusted)
Fire Dollar Loss(Adjusted)
Trend(Actual)
Fire Dollar Loss(Actual)
2014201320122011201020092008200720062005
Fire Dollar Loss (in $B)
Actual
Adjusted
Dollar Loss ($B)
Year ActualAdjusted to 2014 Dollars
2005 $10.7 $12.92006 $11.3 $13.32007 $14.6 $16.72008 $15.5 $17.02009 $12.5 $13.82010 $11.6 $12.62011 $11.7 $12.32012 $12.4 $12.82013 $11.5 $11.72014 $11.6 $11.6
10-year trend
(%)-5.8% -21.0%
Sources: NFPA and CPI .

40 Fire in the United States 2005-2014
Fires Loss Rates (2005-2014)
Figure 6 shows the 10-year trends in the rates per million population for all fires and associated losses from 2005 to 2014. Fires per million population reached a low in 2013, but rose slightly in 2014. Still, in 2014, the fire death rate was less than a third of what it was in the late 1970s.43 Fires, deaths and injuries per million population continued to decline by 29 percent, 18 percent and 15 percent, respectively. Dollar loss per capita decreased 27 percent over the 10 years when adjusted for inflation.
Figure 6. Fire Loss Rates (2005-2014)
3,500.0
3,750.0
4,000.0
4,250.0
4,500.0
4,750.0
5,000.0
5,250.0
5,500.0
5,750.0
6,000.0
Trend
Fires
2014201320122011201020092008200720062005
Fires per Million Population Fires per Million Population
Year Value2005 5,421.02006 5,504.72007 5,170.42008 4,773.22009 4,395.82010 4,304.22011 4,457.52012 4,377.62013 3,918.82014 4,070.1
10-year trend (%) -28.5%
6.0
7.0
8.0
9.0
10.0
11.0
12.0
13.0
14.0
Trend
Fire Deaths
2014201320122011201020092008200720062005
Fire Deaths per Million Population Deaths per Million Population
Year Value2005 12.42006 10.92007 11.42008 10.92009 9.82010 10.12011 9.62012 9.12013 10.22014 10.3
10-year trend (%) -18.4%
43In 1979, the fire death rate was 34.8 deaths per million population as cited in USFA’s “America Burning Revisited,” 1987, p. 15.

The National Fire Problem 41
Figure 6. Fire Loss Rates (2005-2014) — Continued
48.0
50.0
52.0
54.0
56.0
58.0
60.0
62.0
64.0
66.0
Trend
Fire Injuries
2014201320122011201020092008200720062005
Fire Injuries per Million Population Injuries per Million Population
Year Value2005 60.72006 55.02007 58.72008 54.92009 55.62010 57.32011 56.12012 52.52013 50.32014 49.5
10-year trend (%) -14.6%
$0.0
$10.0
$20.0
$30.0
$40.0
$50.0
$60.0
Trend (Adjusted)Fire Dollar Loss (Adjusted)
Trend (Actual)
Fire Dollar Loss (Actual)
2014201320122011201020092008200720062005
Fire Dollar Loss per Capita
Actual
Adjusted
Dollar Loss per Capita
Year Actual Value
Adjusted to 2014 Dollars
2005 $36.1 $43.82006 $37.9 $44.52007 $48.6 $55.52008 $50.9 $56.02009 $40.8 $45.12010 $37.5 $40.72011 $37.4 $39.42012 $39.6 $40.82013 $36.4 $37.02014 $36.4 $36.4
10-year trend
(%)-12.3% -26.6%
Sources: NFPA, CPI and U.S. Census Bureau.

42 Fire in the United States 2005-2014
Types of Properties Where Fires Occur
This section describes the proportions of the fire problem by general property type: residential structures, nonresidential structures, vehicles, outside properties, and other or unknown properties.
Fires and Fire Losses by General Property Type (2014)
Figure 7 describes the proportions of the fire problem in 2014 by general property type. Over the years, there has been little change in the proportion of fires, deaths, injuries and dollar loss by the type of property involved. In terms of numbers of reported fires, the largest category continued to be outside fires (41 percent) — in fields, vacant lots, trash, etc. Residential and nonresidential structure fires together constituted 39 percent of fires, with residential structure fires outnumbering nonresidential structure fires by over 3 to 1. What may be surprising is the large percentage of vehicle fires. In fact, approximately 1 out of every 7 fires to which fire departments responded involved a vehicle.
The largest percentage of reported deaths by far — 75 percent in 2014 — occurred on residential properties, with the majority of these on one- and two-family properties. Vehicles accounted for the second largest percentage of fire deaths at 16 percent. Only 4 percent of the 2014 fire deaths occurred in nonresidential commercial and public properties. Outside and other miscellaneous fires, including wildfires, were also a small factor (5 percent combined) in fire deaths.
Great attention is given to large, multiple-death fires in public places, such as hotels, nightclubs and office buildings; however, fires that kill 10 or more people are few in number and constitute only a small portion of overall fire deaths. Furthermore, public properties are generally required by local codes to have built-in fire suppression systems. The area with the largest problem is most commonly overlooked — in people’s homes. Prevention efforts continue to focus on home fire safety.
The picture was generally similar for fire injuries, with 78 percent of all reported injuries occurring on residential properties. The remaining fire injuries were distributed across the other property types — nonresidential properties, 7 percent; vehicles, 6 percent; and outside and other fires, 9 percent combined.
The picture changes somewhat for dollar loss. While residential properties were the leading property type for dollar loss, nonresidential properties played a considerable role. These two general property types accounted for 82 percent of all reported dollar loss. The proportion of dollar loss from outside fires may be understated because the destruction of trees, grass, etc., is often given zero value in fire incident reports if it is not commercial cropland or timber.

The National Fire Problem 43
Figure 7. Fires and Fire Losses by General Property Type (2014)
Fires by General Property Type (2014)
0.0 10.0 20.0 30.0 40.0 50.0 60.0
Other
Outside
Vehicle
Nonresidential
Residential 30.8
41.1
5.8
13.9
8.4
Percent
Fire Deaths by General Property Type (2014)
0.0 10.0 20.0 30.0 40.0 50.0 60.0 70.0 80.0 90.0
Other
Outside
Vehicle
Nonresidential
Residential 75.0
2.4
2.2
16.5
3.9
Percent
Fire Injuries by General Property Type (2014)
0.0 10.0 20.0 30.0 40.0 50.0 60.0 70.0 80.0 90.0
Other
Outside
Vehicle
Nonresidential
Residential 78.0
3.5
5.1
6.2
7.2
Percent

44 Fire in the United States 2005-2014
Figure 7. Fires and Fire Losses by General Property Type (2014) — Continued
Fire Dollar Loss by General Property Type (2014)
0.0 10.0 20.0 30.0 40.0 50.0 60.0
Other
Outside
Vehicle
Nonresidential
Residential 52.1
3.8
2.8
11.4
29.9
PercentSource: NFIRS.
Fire Casualties and Dollar Loss per Fire by General Property Type (2014)
Figure 8 shows reported fire deaths and injuries per 1,000 fires and dollar loss per fire in 2014 by general property type: residential structures, nonresidential structures, vehicles, outside properties, and other or unknown properties. These indicators represent the severity of fires, but they are somewhat ambiguous because they can increase if there are more casualties or damage per fire (the numerators) or if fewer minor fires are reported (the denominators).
Residential fires had the highest numbers of deaths and injuries per 1,000 fires — another important reason for prevention programs to focus on home fire safety. Nonresidential structure fires had the highest dollar loss per fire.
Figure 8. Fire Casualties and Dollar Loss per Fire by General Property Type (2014)
Fire Deaths per 1,000 Fires (2014)
0.0 1.0 2.0 3.0 4.0 5.0 6.0 7.0
Other
Outside
Vehicle
Nonresidential
Residential 5.5
0.1
0.8
2.7
1.0
Deaths per 1,000 Fires

The National Fire Problem 45
Figure 8. Fire Casualties and Dollar Loss per Fire by General Property Type (2014) — Continued
Fire Injuries per 1,000 Fires (2014)
0.0 5.0 10.0 15.0 20.0 25.0 30.0 35.0
Other
Outside
Vehicle
Nonresidential
Residential 26.2
0.9
9.2
4.6
8.8
Injuries per 1,000 Fires
Dollar Loss per Fire (2014)
0.0 5.0 10.0 15.0 20.0 25.0 30.0 35.0 40.0 45.0
Other
Outside
Vehicle
Nonresidential
Residential 16.5
0.9
4.7
8.0
34.7
Dollar Loss per Fire ($ thousands)Source: NFIRS.
Buildings and Other Properties
This section provides an overview of the fire problem in buildings, vehicles, and other mobile properties over the 10-year period from 2005 to 2014.
Buildings
The analysis of building fires is presented in two major sections: residential (including one- and two-family dwellings, multifamily dwellings, and other residential buildings) and nonresidential (including industrial and commercial properties, institutions, educational establishments, mobile properties, and storage properties).

46 Fire in the United States 2005-2014
Residential Building Fires and Losses
The term “residential buildings” includes what are commonly referred to as “homes,” whether they are one- and two-family dwellings or multifamily buildings. It also includes manufactured housing, hotels and motels, residential hotels, dormitories, assisted living facilities, and halfway houses — residences for formerly institutionalized individuals (mentally impaired patients, drug addicts, or convicts) that are designed to facilitate their readjustment to private life. The term “residential buildings” does not include institutions such as prisons, nursing homes, juvenile care facilities, or hospitals, though many people may reside in them for short or long periods of time.
The residential building portion of the fire problem continues to account for the vast majority of civilian casualties. National estimates show that on average from 2005 to 2014, 96 percent of residential structure fires, 96 percent of associated deaths, 97 percent of injuries, and 95 percent of dollar losses occurred in residential buildings. Because the majority of structure fires and losses occurred in buildings, the remainder of the residential analyses will focus on building fires and their associated losses.
All Residential Buildings
Overall, residential buildings include one- and two-family, multifamily, and other residential buildings.44 Annually, from 2005 to 2014, there were an estimated 375,400 residential building fires. Because these fires resulted in an annual average of 2,620 civilian deaths, 13,000 injuries, and $7.6 billion in property loss (adjusted to 2014 dollars) over the 10 years, the fire problem in U.S. residences is of significant concern.45
Figure 9 shows the 10-year trends for the overall residential building fires and losses. From 2005 to 2014, trends in residential building fires and losses showed a 3 percent decrease in fires, a 4 percent decrease in deaths, a 5 percent decrease in injuries, and a 16 percent decrease in dollar loss.
44USFA’s three topical reports that explore facets of the current residential building fire problem, “Residential Building Fires (2012-2014),” “One- and Two-Family Residential Building Fires (2012-2014),” and “Multifamily Building Fires (2012-2014),” are available at https://www.usfa.fema.gov/data/statistics/reports.html.45USFA’s Residential Building Fires Estimate Summary Series (2005-2014) is available at https://www.usfa.fema.gov/downloads/pdf/statistics/res_bldg_fire_estimates.pdf. To download an Excel file of residential building fire and fire loss estimates by property use and cause, please visit https://www.usfa.fema.gov/data/statistics/order_download_data.html (located under the section “Download select data sets”).
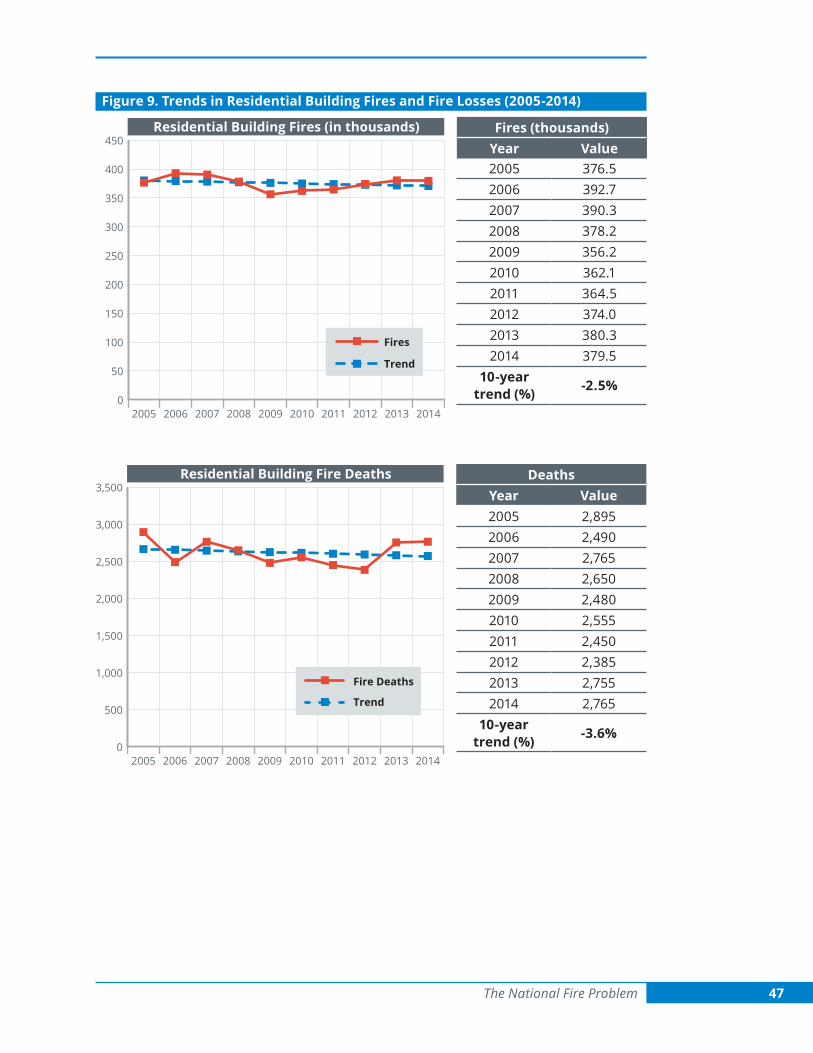
The National Fire Problem 47
Figure 9. Trends in Residential Building Fires and Fire Losses (2005-2014)
Fires (thousands)Year Value2005 376.52006 392.72007 390.32008 378.22009 356.22010 362.12011 364.52012 374.02013 380.32014 379.5
10-year trend (%) -2.5%
0
50
100
150
200
250
300
350
400
450
Trend
Fires
2014201320122011201020092008200720062005
Residential Building Fires (in thousands)
DeathsYear Value2005 2,8952006 2,4902007 2,7652008 2,6502009 2,4802010 2,5552011 2,4502012 2,3852013 2,7552014 2,765
10-year trend (%) -3.6%
0
500
1,000
1,500
2,000
2,500
3,000
3,500
Trend
Fire Deaths
2014201320122011201020092008200720062005
Residential Building Fire Deaths

48 Fire in the United States 2005-2014
Figure 9. Trends in Residential Building Fires and Fire Losses (2005-2014) — Continued
0
3,000
6,000
9,000
12,000
15,000
Trend
Fire Injuries
2014201320122011201020092008200720062005
Residential Building Fire Injuries InjuriesYear Value2005 13,3752006 12,5502007 13,5252008 13,1002009 12,6002010 13,2752011 13,9002012 13,0502013 12,4502014 12,075
10-year trend (%) -4.8%
$0.0
$2,000.0
$4,000.0
$6,000.0
$8,000.0
$10,000.0
Trend
Fire Dollar Loss
2014201320122011201020092008200720062005
Residential Building Fire Dollar Loss (in $M)* Dollar Loss ($M) *Adjusted to 2014 Dollars
Year Value2005 $7,8752006 $7,8042007 $8,1722008 $8,8202009 $8,0112010 $7,2162011 $7,0002012 $7,3242013 $6,9872014 $6,900
10-year trend (%) -16.4%
Sources: NFPA, NFIRS and CPI.

The National Fire Problem 49
One- and Two-Family Residential Buildings
One- and two-family dwellings are where 74 percent of the people in the U.S. reside.46 The residential building fire profile is, therefore, dominated by this category. One- and two-family residential buildings include detached dwellings, manufactured homes, mobile homes not in transit, and duplexes.
From 2005 to 2014, one- and two-family residential building fires accounted for 65 percent of all residential building fires and dominated the overall residential building fire profile. Trends in one- and two-family dwellings showed a 5 percent decrease in fires, a 2 percent decrease in deaths, a 10 percent decrease in injuries, and a 19 percent decrease in dollar loss from 2005 to 2014 (Figure 10).
Figure 10. Trends in One- and Two-Family Residential Building Fires and Fire Losses (2005-2014)
0
50
100
150
200
250
300
Trend
Fires
2014201320122011201020092008200720062005
One- and Two-Family Residential Building Fires (in thousands)
Fires (thousands)Year Value2005 245.92006 253.82007 260.72008 250.42009 234.12010 236.92011 237.72012 242.72013 244.72014 244.0
10-year trend (%) -4.5%
46The U.S. Census Bureau shows that, in 2013, 75.8 percent of occupied housing units were one-unit attached and detached structures or mobile homes (87.9 million) (http://www.census.gov/programs-surveys/ahs/data/2013/ahs-2013-summary-tables/national-summary-report-and-tables---ahs-2013.html, Table C-01-AH for occupied housing). Household size was estimated at 2.65 people per household (http://factfinder.census.gov/faces/tableservices/jsf/pages/productview.xhtml?pid=ACS_13_1YR_DP02&prodType=table, Selected Social Characteristics in the U.S., 2013 American Community Survey 1-Year Estimates). Thus, 87.9 million housing units x 2.65 people per household = 232.9 million people. With the 2013 U.S. population given as 316.4 million, (http://www.census.gov/popest/data/national/totals/2015/index.html, Annual Estimates of the Resident Population for the U.S., Regions, States, and Puerto Rico: April 1, 2010 to July 1, 2015 (NST-EST2015-01)), approximately 73.6 percent of the population lived in what NFIRS defines as one- and two-family housing.

50 Fire in the United States 2005-2014
Figure 10. Trends in One- and Two-Family Residential Building Fires and Fire Losses (2005-2014) — Continued
0
500
1,000
1,500
2,000
2,500
3,000
Trend
Fire Deaths
2014201320122011201020092008200720062005
One- and Two-Family Residential Building Fire Deaths
DeathsYear Value2005 2,2252006 1,9252007 2,2852008 2,1602009 1,9652010 2,0252011 1,9452012 1,8852013 2,2502014 2,195
10-year trend (%) -1.5%
0
2,000
4,000
6,000
8,000
10,000
Trend
Fire Injuries
2014201320122011201020092008200720062005
One- and Two-Family Residential Building Fire Injuries
InjuriesYear Value2005 8,9502006 8,2252007 9,1252008 8,4002009 8,1252010 8,5252011 8,9252012 8,3002013 7,9752014 7,550
10-year trend (%) -10.2%

The National Fire Problem 51
Figure 10. Trends in One- and Two-Family Residential Building Fires and Fire Losses (2005-2014) — Continued
$0.0
$1,000.0
$2,000.0
$3,000.0
$4,000.0
$5,000.0
$6,000.0
$7,000.0
$8,000.0
Trend
Fire Dollar Loss
2014201320122011201020092008200720062005
One- and Two-Family Residential Building Fire Dollar Loss (in $M)*
Dollar Loss ($M) *Adjusted to 2014 Dollars
Year Value2005 $6,0542006 $6,0812007 $6,5702008 $6,7712009 $6,2902010 $5,7382011 $5,4022012 $5,7052013 $5,2732014 $5,201
10-year trend (%) -18.7%
Sources: NFPA, NFIRS and CPI.
Multifamily Residential Buildings
Multifamily residential buildings include structures such as apartments, town houses, row houses, condominiums, and other tenement properties. Many multifamily dwellings are rental properties, which often fall under more stringent fire prevention statutes and tend to be regulated by stricter building codes. From 2005 to 2014, multifamily residential building fires accounted for 28 percent of all residential building fires responded to by fire departments across the nation.
From 2005 to 2014, trends in multifamily dwellings showed a 1 percent decrease in fires, a 12 percent decrease in deaths, an 11 percent increase in injuries, and a 7 percent decrease in dollar loss (Figure 11). The increase in multifamily dwelling fire injuries is surprising given that multifamily buildings tend to have stricter building codes, including the presence of smoke alarms and sprinkler systems.

52 Fire in the United States 2005-2014
Figure 11. Trends in Multifamily Residential Building Fires and Fire Losses (2005-2014)
0
20
40
60
80
100
120
Trend
Fires
2014201320122011201020092008200720062005
Multifamily Residential Building Fires(in thousands)
Fires (thousands)Year Value2005 107.02006 113.92007 104.62008 104.12009 100.22010 102.72011 102.82012 106.02013 109.32014 108.7
10-year trend (%) -0.6%
0
100
200
300
400
500
600
Trend
Fire Deaths
2014201320122011201020092008200720062005
Multifamily Residential Building Fire Deaths DeathsYear Value2005 5102006 4452007 4052008 3952009 3752010 4252011 3902012 4002013 3902014 440
10-year trend (%) -12.3%

The National Fire Problem 53
Figure 11. Trends in Multifamily Residential Building Fires and Fire Losses (2005-2014) — Continued
0
1,000
2,000
3,000
4,000
5,000
Trend
Fire Injuries
2014201320122011201020092008200720062005
Multifamily Residential Building Fire Injuries InjuriesYear Value2005 3,8002006 3,7252007 3,8752008 4,2002009 4,0502010 4,2502011 4,4502012 4,3252013 3,9752014 4,100
10-year trend (%) 10.8%
Multifamily Residential Building Fire Dollar Loss (in $M)*
$0.0
$200.0
$400.0
$600.0
$800.0
$1,000.0
$1,200.0
$1,400.0
$1,600.0
Trend
Fire Dollar Loss
2014201320122011201020092008200720062005
Dollar Loss ($M) *Adjusted to 2014 Dollars
Year Value2005 $1,4452006 $1,3722007 $1,2632008 $1,4802009 $1,3632010 $1,1882011 $1,2912012 $1,2782013 $1,3482014 $1,342
10-year trend (%) -7.0%
Sources: NFPA, NFIRS and CPI.

54 Fire in the United States 2005-2014
Other Residential Buildings
Other residential buildings include rooming houses, dormitories, residential hotels, halfway houses, hotels and motels, and miscellaneous and unclassified buildings reported as residences. This category does not include nursing homes, prisons or other institutions; these categories are addressed as part of nonresidential buildings. Trends in other residential buildings showed a 9 percent increase in fires, a 7 percent decrease in deaths, a 26 percent decrease in injuries, and a 13 percent decrease in dollar loss from 2005 to 2014 (Figure 12).
Figure 12. Trends in Other Residential Building Fires and Fire Losses (2005-2014)
0
5
10
15
20
25
30
Trend
Fires
2014201320122011201020092008200720062005
Other Residential Building Fires (in thousands) Fires (thousands)Year Value2005 23.72006 25.02007 25.02008 23.72009 21.82010 22.52011 24.02012 25.32013 26.22014 26.8
10-year trend (%) 9.2%
0
40
80
120
160
200
Trend
Fire Deaths
2014201320122011201020092008200720062005
Other Residential Building Fire Deaths DeathsYear Value2005 1602006 1252007 802008 902009 1402010 1052011 1152012 1002013 1202014 130
10-year trend (%) -7.4%

The National Fire Problem 55
Figure 12. Trends in Other Residential Building Fires and Fire Losses (2005-2014) — Continued
0
100
200
300
400
500
600
700
Trend
Fire Injuries
2014201320122011201020092008200720062005
Other Residential Building Fire Injuries InjuriesYear Value2005 6002006 6002007 5252008 5252009 4252010 5002011 5252012 4252013 5002014 425
10-year trend (%) -25.5%
$0.0
$100.0
$200.0
$300.0
$400.0
$500.0
$600.0
Trend
Fire Dollar Loss
2014201320122011201020092008200720062005
Other Residential Building Fire Dollar Loss (in $M)*
Dollar Loss ($M) *Adjusted to 2014 Dollars
Year Value2005 $376.12006 $350.12007 $338.32008 $569.12009 $358.22010 $290.52011 $306.82012 $341.22013 $366.52014 $357.0
10-year trend (%) -12.6%
Sources: NFPA, NFIRS and CPI.

56 Fire in the United States 2005-2014
Nonresidential Buildings
The nonresidential building category includes industrial and commercial properties, institutions (such as hospitals, nursing homes and prisons), educational establishments (from preschool through university), mobile properties, and storage properties. National estimates show that on average from 2005 to 2014, about 89 percent of nonresidential structure fires, 88 percent of deaths, 92 percent of injuries, and 92 percent of dollar losses occurred in nonresidential buildings.
National estimates of nonresidential building fires and losses, from 2005 to 2014, annually accounted for only 7 percent of all fires, 2 percent of deaths, and 8 percent of injuries. These properties, however, accounted for a disproportionately large annual dollar loss, 21 percent.47 Trends in nonresidential buildings showed an 8 percent decrease in fires, a 6 percent decrease in deaths, a 4 percent decrease in injuries, and a 17 percent decrease in dollar loss from 2005 to 2014 (Figure 13).
Figure 13. Trends in Nonresidential Building Fires and Fire Losses (2005-2014)
0
10
20
30
40
50
60
70
80
90
100
110
120
Trend
Fires
2014201320122011201020092008200720062005
Nonresidential Building Fires (in thousands) Fires (thousands)Year Value2005 101.42006 98.92007 103.02008 97.12009 89.22010 84.92011 85.42012 92.82013 93.72014 99.5
10-year trend (%) -8.0%
47USFA’s Nonresidential Building Fires Estimate Summary Series (2005-2014) is available at https://www.usfa.fema.gov/downloads/pdf/statistics/nonres_bldg_fire_estimates.pdf. To download an Excel file of nonresidential building fire and fire loss estimates by property use and cause, please visit https://www.usfa.fema.gov/data/statistics/order_download_data.html (located under the section “Download select data sets”).

The National Fire Problem 57
Figure 13. Trends in Nonresidential Building Fires and Fire Losses (2005-2014) — Continued
0
20
40
60
80
100
120
Trend
Fire Deaths
2014201320122011201020092008200720062005
Nonresidential Building Fire Deaths DeathsYear Value2005 402006 752007 902008 1002009 902010 802011 802012 652013 652014 60
10-year trend (%) -6.0%
0
200
400
600
800
1,000
1,200
1,400
1,600
Trend
Fire Injuries
2014201320122011201020092008200720062005
Nonresidential Building Fire Injuries InjuriesYear Value2005 1,4002006 1,3502007 1,2752008 1,2502009 1,5002010 1,3752011 1,1002012 1,4502013 1,4252014 1,200
10-year trend (%) -3.9%
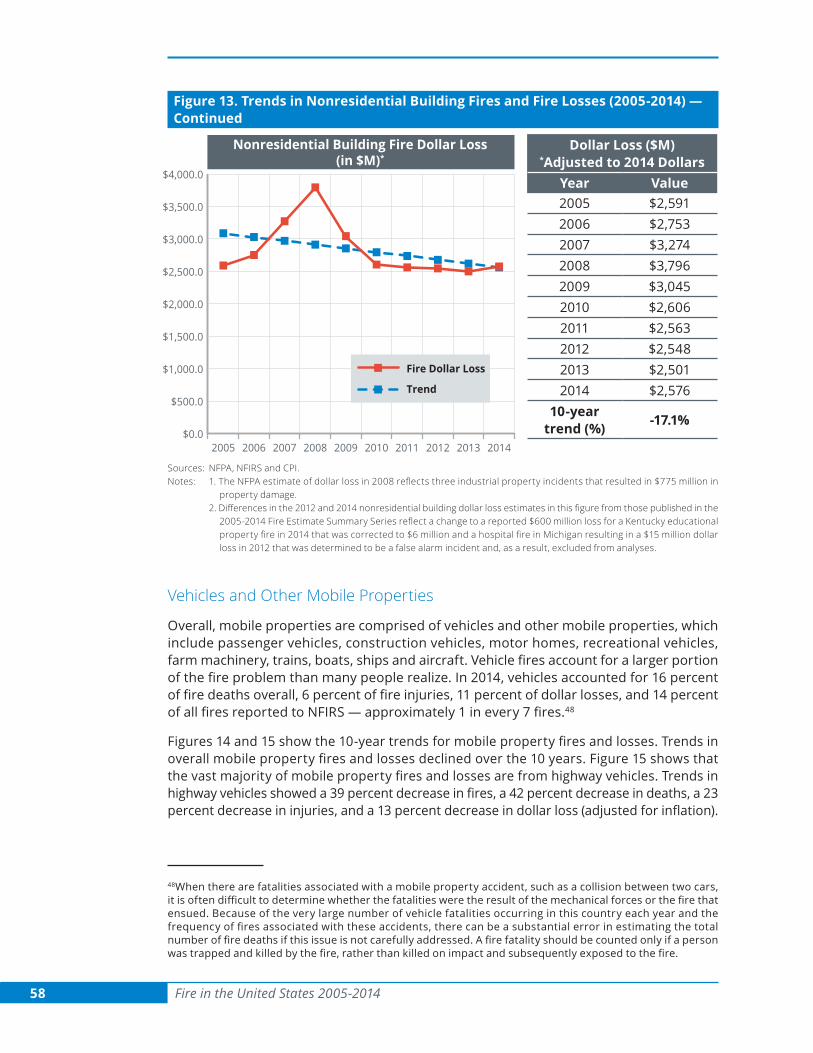
58 Fire in the United States 2005-2014
Figure 13. Trends in Nonresidential Building Fires and Fire Losses (2005-2014) — Continued
$0.0
$500.0
$1,000.0
$1,500.0
$2,000.0
$2,500.0
$3,000.0
$3,500.0
$4,000.0
Trend
Fire Dollar Loss
2014201320122011201020092008200720062005
Nonresidential Building Fire Dollar Loss (in $M)*
Dollar Loss ($M) *Adjusted to 2014 Dollars
Year Value2005 $2,5912006 $2,7532007 $3,2742008 $3,7962009 $3,0452010 $2,6062011 $2,5632012 $2,5482013 $2,5012014 $2,576
10-year trend (%) -17.1%
Sources: NFPA, NFIRS and CPI.Notes: 1.TheNFPAestimateofdollarlossin2008reflectsthreeindustrialpropertyincidentsthatresultedin$775millionin
property damage. 2.Differencesinthe2012and2014nonresidentialbuildingdollarlossestimatesinthisfigurefromthosepublishedinthe
2005-2014FireEstimateSummarySeriesreflectachangetoareported$600millionlossforaKentuckyeducationalpropertyfirein2014thatwascorrectedto$6millionandahospitalfireinMichiganresultingina$15milliondollarloss in 2012 that was determined to be a false alarm incident and, as a result, excluded from analyses.
Vehicles and Other Mobile Properties
Overall, mobile properties are comprised of vehicles and other mobile properties, which include passenger vehicles, construction vehicles, motor homes, recreational vehicles, farm machinery, trains, boats, ships and aircraft. Vehicle fires account for a larger portion of the fire problem than many people realize. In 2014, vehicles accounted for 16 percent of fire deaths overall, 6 percent of fire injuries, 11 percent of dollar losses, and 14 percent of all fires reported to NFIRS — approximately 1 in every 7 fires.48
Figures 14 and 15 show the 10-year trends for mobile property fires and losses. Trends in overall mobile property fires and losses declined over the 10 years. Figure 15 shows that the vast majority of mobile property fires and losses are from highway vehicles. Trends in highway vehicles showed a 39 percent decrease in fires, a 42 percent decrease in deaths, a 23 percent decrease in injuries, and a 13 percent decrease in dollar loss (adjusted for inflation).
48When there are fatalities associated with a mobile property accident, such as a collision between two cars, it is often difficult to determine whether the fatalities were the result of the mechanical forces or the fire that ensued. Because of the very large number of vehicle fatalities occurring in this country each year and the frequency of fires associated with these accidents, there can be a substantial error in estimating the total number of fire deaths if this issue is not carefully addressed. A fire fatality should be counted only if a person was trapped and killed by the fire, rather than killed on impact and subsequently exposed to the fire.

The National Fire Problem 59
Figure 14. Trends in Mobile Property Fires and Fire Losses (2005-2014)
0.0
50.0
100.0
150.0
200.0
250.0
300.0
350.0
Trend
Fires
2014201320122011201020092008200720062005
Mobile Property Fires (in thousands) Fires (thousands)Year Value2005 290.02006 278.02007 258.02008 236.02009 219.02010 215.52011 219.02012 202.52013 188.02014 193.5
10-year trend (%) -35.7%
0.0
100.0
200.0
300.0
400.0
500.0
600.0
Trend
Fire Deaths
2014201320122011201020092008200720062005
Mobile Property Fire Deaths DeathsYear Value2005 5202006 4902007 3852008 3652009 2802010 3102011 3002012 3252013 3202014 345
10-year trend (%) -39.0%

60 Fire in the United States 2005-2014
Figure 14. Trends in Mobile Property Fires and Fire Losses (2005-2014) — Continued
0.0
200.0
400.0
600.0
800.0
1,000.0
1,200.0
1,400.0
1,600.0
1,800.0
Trend
Fire Injuries
2014201320122011201020092008200720062005
Mobile Property Fire Injuries InjuriesYear Value2005 1,6502006 1,2002007 1,6752008 1,0652009 1,6102010 1,5902011 1,1902012 9752013 1,0502014 1,450
10-year trend (%) -21.7%
$1,200.0
$1,300.0
$1,400.0
$1,500.0
$1,600.0
$1,700.0
$1,800.0
$1,900.0
Trend
Fire Dollar Loss
2014201320122011201020092008200720062005
Mobile Property Fire Dollar Loss (in $M)* Dollar Loss ($M) *Adjusted to 2014 Dollars
Year Value2005 $1,597.62006 $1,548.92007 $1,611.02008 $1,642.72009 $1,501.82010 $1,493.92011 $1,420.82012 $1,895.22013 $1,414.62014 $1,522.0
10-year trend (%) -3.0%
Sources: NFPA and CPI.Note: The2012spikeindollarlossreflectsthe$400millionpropertydamagetotheUSSMiami(submarine).

The National Fire Problem 61
Figure 15. Trends in Highway Vehicle Versus Other Mobile Property Fires and Fire Losses (2005-2014)
Highway Vehicle Versus Other Mobile Property Fires (in thousands)
0.0
50.0
100.0
150.0
200.0
250.0
300.0
350.0
TrendOther Mobile Property FiresTrendHighway Vehicle Fires
2014201320122011201020092008200720062005
Other Mobile Property
Highway Vehicle
Fires (thousands)
YearHighway Vehicle Value
Other Mobile Value
2005 259.0 31.02006 250.0 28.02007 227.5 30.52008 207.0 29.02009 190.5 28.52010 184.5 31.02011 187.5 31.52012 172.5 30.02013 164.0 24.02014 167.5 26.0
10-year trend (%) -38.6% -11.6%
Highway Vehicle Versus Other Mobile Property Fire Deaths
0.0
50.0
100.0
150.0
200.0
250.0
300.0
350.0
400.0
450.0
500.0
550.0
Trend
Other Mobile Property Fire Deaths
Trend
Highway Vehicle Fire Deaths
2014201320122011201020092008200720062005
Other Mobile Property
Highway Vehicle
Deaths
YearHighway Vehicle Value
Other Mobile Value
2005 500 202006 445 452007 365 202008 350 152009 260 202010 285 252011 270 302012 300 252013 300 202014 310 35
10-year trend (%) -41.7% 7.8%

62 Fire in the United States 2005-2014
Figure 15. Trends in Highway Vehicle Versus Other Mobile Property Fires and Fire Losses (2005-2014) — Continued
Highway Vehicle Versus Other Mobile Property Fire Injuries
0.0
200.0
400.0
600.0
800.0
1,000.0
1,200.0
1,400.0
1,600.0
TrendOther Mobile Property Fire InjuriesTrendHighway Vehicle Fire Injuries
2014201320122011201020092008200720062005
Other Mobile Property
Highway Vehicle
Injuries
YearHighway Vehicle Value
Other Mobile Value
2005 1,450 2002006 1,075 1252007 1,500 1752008 850 2152009 1,455 1552010 1,440 1502011 1,020 1702012 800 1752013 925 1252014 1,275 175
10-year trend (%) -23.0% -11.3%
Highway Vehicle Versus Other Mobile Property Fire Dollar Loss (in $M)*
$0.0
$200.0
$400.0
$600.0
$800.0
$1,000.0
$1,200.0
$1,400.0
$1,600.0
Trend
Other Mobile Property FireDollar Loss
Trend
Highway Vehicle Fire Dollar Loss
2014201320122011201020092008200720062005
Other Mobile Property
Highway Vehicle
Dollar Loss ($M) *Adjusted to 2014 Dollars
YearHighway Vehicle Value
Other Mobile Value
2005 $1,271.6 $326.12006 $1,153.1 $395.72007 $1,235.4 $375.62008 $1,283.2 $359.62009 $1,163.1 $338.82010 $1,071.6 $422.32011 $1,069.3 $351.52012 $1,128.0 $767.12013 $1,077.2 $337.42014 $1,142.0 $380.0
10-year trend (%) -13.1% 32.8%
Sources: NFPA and CPI.Note: The2012spikeindollarlossforothermobilepropertyfiresreflectsthe$400millionpropertydamagetotheUSSMiami
(submarine).
The National Fire Problem 63
Outside and Other Properties
The “Outside and Other Properties” category includes all fires that did not occur in buildings, other structures, or vehicles. In NFIRS terminology, this includes fires that occurred outside of structures, either where the burning material had a value or where the fires were confined to trees, brush, grass or refuse. A subset of outside fires is wildland fires. Grouped in the “Other” category are fires that were not specifically classified or were considered to be outside gas or vapor combustion incidents.
Outside and other fires constituted roughly half of all fires. These numbers may not, however, reflect the true nature of the problem because of under-reporting and the difficulty in setting a price tag on outside fires. Also, many wildland fires are not reported to agencies reporting to NFIRS or to the NFPA annual survey.
Figure 16 shows the 10-year trends for outside and other property type fires and losses. The numbers of reported outside fires alone were enormous — averaging 592,100 over the 10-year period. The “Other” category of fires added, on average, an additional 102,700 fires to this already large number. Over 10 years, an average of 55 deaths resulted each year from outside fires plus the miscellaneous other properties not covered elsewhere; injuries averaged 775. Although deaths showed an upward trend of 51 percent, this is due primarily to the fluctuations in the small numbers of deaths. Injuries showed an upward trend of less than 1 percent. Dollar loss for only outside properties increased 49 percent, partly due to several large-loss incidents in 2007 and 2010 to 2013.49 Without these fires, dollar loss from outside fires decreased 36 percent over the 10 years.
Estimating dollar loss for these fires is difficult.50 In addition, part of the difference in property loss estimates is because NFPA estimates property loss only for outside fires “with value,” whereas NFIRS permits property loss data collection for any fire. Which method is correct? Both are reasonable approaches, but neither may be definitive. Moreover, when there are large-loss fires, these fires may not necessarily be reported to NFIRS.
49Karter, Jr., Michael J., “Fire Loss in the United States” (2007, 2010-2012, 2014), NFPA. There were three large-loss incidents that totaled $525 million in damage in 2007; the Fourmile Canyon Wildfire in Colorado, which totaled $217 million in damage in 2010; the Bastrop County, Texas, Complex Wildfire, which totaled $400 million in damage in 2011; the Waldo Canyon Fire and the High Park Fire in Colorado, accounting for a total of $567.4 million in damage in 2012; and the Black Forest Fire in Colorado, which totaled $420.5 million in damage in 2013 noted in the 2014 NFPA report.50Setting a value for outside fire damage is always a problem. It is difficult to assign a dollar value to grass, tree and rubbish fires, yet the damage from these fires often requires labor beyond that of the fire department to clean up and restore the area. They also cause aesthetic problems that are intangible. Some outside fires spread to structural properties and may be reported as structural fires rather than outside fires with exposure to structures. Outside fires can have other indirect costs, such as the financial impact on agricultural communities where a fire destroys crops. Forest fires and other wildfires to which local departments are not called will not be reported to NFIRS if the state or federal agency with principal authority for fighting the fire does not participate in NFIRS. To better analyze outside fires, NFIRS data needs to be complemented with data from these other agencies.

64 Fire in the United States 2005-2014
Figure 16. Trends in Outside and Other Property Type Fires and Fire Losses (2005-2014)
Outside and Other Property Type Fires (in thousands)
0.0
100.0
200.0
300.0
400.0
500.0
600.0
700.0
800.0
TrendOther Property Type FiresTrendOutside Fires
2014201320122011201020092008200720062005
Other Property Type
Outside
Fires (thousands)
Year Outside Value
Other Value
2005 672.5 128.52006 710.0 130.52007 646.5 122.52008 594.0 106.52009 546.0 103.02010 549.5 84.52011 597.5 88.52012 612.0 80.02013 479.5 85.02014 513.0 97.5
10-year trend (%) -25.7% -38.0%
0.0
10.0
20.0
30.0
40.0
50.0
60.0
70.0
80.0
Trend
Outside and Other Property Type Fire Deaths
2014201320122011201020092008200720062005
Outside and Other Property Type Fire Deaths Deaths
Year Outside and Other Value
2005 502006 502007 452008 552009 352010 552011 652012 602013 652014 70
10-year trend (%) 51.0%

The National Fire Problem 65
Figure 16. Trends in Outside and Other Property Type Fires and Fire Losses (2005-2014) — Continued
0.0
200.0
400.0
600.0
800.0
1,000.0
Trend
Outside and Other Property Type Fire Injuries
2014201320122011201020092008200720062005
Outside and Other Property Type Fire Injuries Injuries
Year Outside and Other Value
2005 9502006 8502007 6502008 6802009 7002010 7102011 6752012 8252013 8002014 900
10-year trend (%) 0.5%
Outside and Other Property Type Fire Dollar Loss (in $M)*
$0.0
$100.0
$200.0
$300.0
$400.0
$500.0
$600.0
$700.0
$800.0
$900.0
Trend
Other Property Type Fire Dollar Loss
TrendOutside Fire Dollar Loss
2014201320122011201020092008200720062005
Other Property Type
Outside
Dollar Loss ($M) *Adjusted to 2014 Dollars
Year OutsideValue
Other Value
2005 $112.7 $82.42006 $307.7 $105.72007 $807.2 $94.82008 $141.8 $103.42009 $280.3 $81.72010 $448.4 $95.52011 $569.4 $78.92012 $749.6 $88.72013 $528.4 $88.42014 $141.0 $96.0
10-yeartrend (%) 49.3% -5.1%
Sources: NFPA and CPI.Note: Thelargeincreaseinthetrendforoutsideandotherpropertytypefiredeathsisdueprimarilytothefluctuationsinthe
small numbers of deaths.

66 Fire in the United States 2005-2014
Causes of Fires and Losses
The following sections show, by property type, the fire cause profiles for 2014 of the major causes of fires and fires that resulted in losses: fatal fires, fires resulting in injuries, and fires resulting in dollar loss.51
Causes of Residential Building Fires
Figure 17 shows the cause profiles for residential building fires and fires resulting in losses. Cooking, at 50 percent, was the leading cause of residential building fires. Heating caused another 13 percent. These percentages (and those that follow) are adjusted, which proportionally spreads the unknown causes over the other 15 cause categories.
The two leading causes of residential fatal fires were other unintentional or careless actions at 15 percent and smoking at 13 percent. The leading cause of residential fires that resulted in injuries was cooking (37 percent). Cooking was also the leading cause of fires resulting in dollar loss at 28 percent, followed by electrical malfunction at 12 percent.52
51In principle, it is the cause of the fire that results in deaths and injuries which should be analyzed, not the numbers of deaths and injuries associated with fire causes.52Causes of residential building fires are presented in more detail as part of the USFA’s Residential Building Fires Estimate Summary Series (2005-2014) available at https://www.usfa.fema.gov/downloads/pdf/statistics/res_bldg_fire_estimates.pdf. To download an Excel file of residential building fire and fire loss estimates by property use and cause, please visit https://www.usfa.fema.gov/data/statistics/order_download_data.html (located under the section “Download select data sets”).

The National Fire Problem 67
Figure 17. Causes of Residential Building Fires and Fires Resulting in Losses (2014)
Percent
Residential Building Fire Causes (2014)
0.0 10.0 20.0 30.0 40.0 50.0 60.0
Reported
Unknowns Apportioned
Unknown
Cause under investigation
Other unintentional, careless
Equipment misoperation, failure
Exposure
Natural
Other equipment
Other heat
Open flame
Appliances
Electrical malfunction
Cooking
Heating
Smoking
Playing with heat source
IntentionalCause Reported Unknowns
ApportionedIntentional 3.5 4.2Playing with heat source 0.4 0.4
Smoking 1.7 2.0Heating 10.5 12.5Cooking 42.0 50.0Electrical malfunction 5.3 6.3
Appliances 3.6 4.2Open flame 3.7 4.4Other heat 2.7 3.2Other equipment 1.0 1.2
Natural 1.3 1.6Exposure 1.6 2.0Equipment misoperation, failure
0.8 0.9
Other unintentional, careless
4.9 5.8
Cause under investigation 1.0 1.2
Unknown 16.1 0.0Total 100.0 100.0

68 Fire in the United States 2005-2014
Figure 17. Causes of Residential Building Fires and Fires Resulting in Losses (2014) — Continued
Percent
Residential Building Fatal Fire Causes (2014)
0.0 10.0 20.0 30.0 40.0 50.0 60.0
Reported
Unknowns Apportioned
Unknown
Cause under investigation
Other unintentional, careless
Equipment misoperation, failure
Exposure
Natural
Other equipment
Other heat
Open flame
Appliances
Electrical malfunction
Cooking
Heating
Smoking
Playing with heat source
Intentional
Cause Reported Unknowns Apportioned
Intentional 4.6 8.9Playing with heat source 0.3 0.6
Smoking 6.6 12.8Heating 4.1 8.1Cooking 4.6 8.9Electrical malfunction 5.6 11.0
Appliances 1.7 3.4Open flame 3.2 6.1Other heat 4.3 8.4Other equipment 1.1 2.1
Natural 0.2 0.5Exposure 0.4 0.8Equipment misoperation, failure
0.6 1.1
Other unintentional, careless
7.8 15.2
Cause under investigation 6.1 12.0
Unknown 48.7 0.0Total 100.0 100.0

The National Fire Problem 69
Figure 17. Causes of Residential Building Fires and Fires Resulting in Losses (2014) — Continued
Percent
Causes of Residential Building Fires Resulting in Injuries (2014)
0.0 10.0 20.0 30.0 40.0
Reported
Unknowns Apportioned
Unknown
Cause under investigation
Other unintentional, careless
Equipmentmisoperation, failure
Exposure
Natural
Other equipment
Other heat
Open flame
Appliances
Electrical malfunction
Cooking
Heating
Smoking
Playing with heat source
Intentional
Cause Reported Unknowns Apportioned
Intentional 4.0 5.1Playing with heat source 1.1 1.4
Smoking 5.0 6.3Heating 5.6 7.0Cooking 29.5 37.2Electrical malfunction 5.5 7.0
Appliances 5.2 6.6Open flame 6.7 8.4Other heat 4.4 5.6Other equipment 1.1 1.4
Natural 0.9 1.1Exposure 0.3 0.4Equipment misoperation, failure
0.9 1.1
Other unintentional, careless
6.7 8.4
Cause under investigation 2.4 3.0
Unknown 20.7 0.0Total 100.0 100.0

70 Fire in the United States 2005-2014
Figure 17. Causes of Residential Building Fires and Fires Resulting in Losses (2014) — Continued
Percent
Causes of Residential Building Fires Resulting in Dollar Loss (2014)
0.0 10.0 20.0 30.0
Reported
Unknowns Apportioned
Unknown
Cause under investigation
Other unintentional, careless
Equipment misoperation, failure
Exposure
Natural
Other equipment
Other heat
Open flame
Appliances
Electrical malfunction
Cooking
Heating
Smoking
Playing with heat source
Intentional
Cause Reported Unknowns Apportioned
Intentional 5.1 6.5Playing with heat source 0.6 0.8
Smoking 2.9 3.7Heating 6.9 8.6Cooking 22.3 28.0Electrical malfunction 9.2 11.5
Appliances 6.1 7.7Open flame 5.5 6.9Other heat 4.3 5.4Other equipment 1.2 1.5
Natural 2.2 2.8Exposure 3.0 3.8Equipment misoperation, failure
1.1 1.4
Other unintentional, careless
7.4 9.3
Cause under investigation 1.7 2.2
Unknown 20.4 0.0Total 100.0 100.0
Source: NFIRS.Notes: 1.Adjustedpercentages(percentageswithunknownsapportioned)proportionallyspreadthefireincidentswithunknown
causes over the other 15 cause categories. 2.AlargepercentageofresidentialbuildingfatalfireincidentsreportedtoNFIRS(49percent)didnothavesufficient
informationtodeterminethecauseofthefire.

The National Fire Problem 71
Causes of Nonresidential Building Fires
Figure 18 shows the cause profiles for nonresidential building fires and fires resulting in dollar loss. Due to the small numbers of nonresidential building fatal fires and fires resulting in injuries reported to NFIRS, and the large percentage of those fires with insufficient information to determine fire cause, the distribution of causes for nonresidential building fatal fires and fires resulting in injuries is not shown.
For nonresidential building fires, cooking was the leading cause of fires (29 percent), followed by other unintentional or careless actions (10 percent). Electrical malfunctions, other unintentional or careless actions and cooking were the leading causes of fires resulting in dollar loss in nonresidential buildings, each at 12 percent.53
Figure 18. Causes of Nonresidential Building Fires and Fires Resulting in Dollar Loss (2014)
Percent
Nonresidential Building Fire Causes (2014)
0.0 10.0 20.0 30.0 40.0 50.0
Reported
Unknowns Apportioned
Unknown
Cause under investigation
Other unintentional, careless
Equipment misoperation, failure
Exposure
Natural
Other equipment
Other heat
Open flame
Appliances
Electrical malfunction
Cooking
Heating
Smoking
Playing with heat source
Intentional
Cause Reported Unknowns Apportioned
Intentional 5.8 8.9Playing with heat source 0.2 0.4
Smoking 1.4 2.1Heating 6.0 9.0Cooking 19.2 29.1Electrical malfunction 5.3 8.1
Appliances 3.2 4.9Open flame 4.0 6.1Other heat 3.4 5.1Other equipment 3.1 4.7
Natural 2.2 3.4Exposure 2.9 4.4Equipment misoperation, failure
1.6 2.5
Other unintentional, careless
6.6 10.0
Cause under investigation 1.0 1.6
Unknown 34.1 0.0Total 100.0 100.0
53Causes of nonresidential building fires are presented in more detail as part of USFA’s Nonresidential Building Fires Estimate Summary Series (2005-2014), available at https://www.usfa.fema.gov/downloads/pdf/statistics/nonres_bldg_fire_estimates.pdf. To download an Excel file of nonresidential building fire and fire loss estimates by property use and cause, please visit https://www.usfa.fema.gov/data/statistics/order_download_data.html (located under the section “Download select data sets”).

72 Fire in the United States 2005-2014
Figure 18. Causes of Nonresidential Building Fires and Fires Resulting in Dollar Loss (2014) — Continued
Percent
Causes of Nonresidential Building Fires Resulting in Dollar Loss (2014)
0.0 5.0 10.0 15.0 20.0 25.0 30.0
Reported
Unknowns Apportioned
Unknown
Cause under investigation
Other unintentional, careless
Equipment misoperation, failure
Exposure
Natural
Other equipment
Other heat
Open flame
Appliances
Electrical malfunction
Cooking
Heating
Smoking
Playing with heat source
Intentional
Cause Reported Unknowns Apportioned
Intentional 6.5 8.8Playing with heat source 0.3 0.5
Smoking 1.4 2.0Heating 6.0 8.2Cooking 8.7 11.8Electrical malfunction 9.1 12.3
Appliances 5.4 7.4Open flame 5.1 6.9Other heat 4.6 6.2Other equipment 4.2 5.7
Natural 3.4 4.6Exposure 5.6 7.6Equipment misoperation, failure
2.5 3.4
Other unintentional, careless
9.0 12.3
Cause under investigation 1.8 2.5
Unknown 26.4 0.0Total 100.0 100.0
Source: NFIRS.Note: Adjustedpercentages(percentageswithunknownsapportioned)proportionallyspreadthefireincidentswithunknown
causes over the other 15 cause categories.
Causes of Vehicle Fires
Figure 19 shows the cause profiles for vehicle fires and fires resulting in dollar loss. Due to the small numbers of vehicle fatal fires and fires resulting in injuries reported to NFIRS, the distribution of causes for vehicle fatal fires and fires resulting in injuries is not shown.
Unintentional actions were the leading cause of fires and fires resulting in dollar loss in vehicles (each at 37 percent). The cause of vehicle fires was undetermined after the investigation in 23 percent of vehicle fires. Failure of equipment or heat source was the second leading cause of fires resulting in dollar loss at 22 percent.

The National Fire Problem 73
Figure 19. Causes of Vehicle Fires and Fires Resulting in Dollar Loss (2014)
Percent
Vehicle Fire Causes (2014)
0.0 10.0 20.0 30.0 40.0
Reported
Unknowns Apportioned
Unknown
Exposure
Intentional
Unintentional
Failure of equipment or heat source
Act of nature
Cause under investigation
Cause undetermined after investigation
Cause Reported Unknowns Apportioned
Cause undetermined after investigation
23.1 23.2
Cause under investigation 9.9 10.0
Act of nature 0.3 0.3Failure of equipment or heat source
21.2 21.3
Unintentional 37.1 37.4Intentional 5.0 5.0Exposure 2.8 2.8Unknown 0.6 0.0Total 100.0 100.0
Percent
Causes of Vehicle Fires Resulting in Dollar Loss (2014)
0.0 10.0 20.0 30.0 40.0
Reported
Unknowns Apportioned
Unknown
Exposure
Intentional
Unintentional
Failure of equipment or heat source
Act of nature
Cause under investigation
Cause undetermined after investigation
Cause Reported Unknowns Apportioned
Cause undetermined after investigation
21.5 21.6
Cause under investigation 9.6 9.6
Act of nature 0.2 0.2Failure of equipment or heat source
22.3 22.3
Unintentional 36.8 36.9Intentional 5.7 5.8Exposure 3.6 3.6Unknown 0.3 0.0Total 100.0 100.0
Source: NFIRS.Note: Adjustedpercentages(percentageswithunknownsapportioned)proportionallyspreadthefireincidentswithunknown
causes over the other seven cause categories.

74 Fire in the United States 2005-2014
Causes of Outside Fires
Figure 20 shows the cause profiles for outside fires and fires resulting in dollar loss. Due to the small numbers of outside fatal fires and fires resulting in injuries reported to NFIRS, and the large percentage of those fires with insufficient information to determine fire cause, the distribution of causes for outside fatal fires and fires resulting in injuries is not shown.
Unintentional actions were the leading cause of fires and fires resulting in dollar loss in outside fires (43 and 41 percent, respectively). Causes were undetermined after the investigation in 26 percent of outside fires and 23 percent of outside fires resulting in dollar loss.
Figure 20. Causes of Outside Fires and Fires Resulting in Dollar Loss (2014)
Percent
Outside Fire Causes (2014)
0.0 10.0 20.0 30.0 40.0 50.0
Reported
Unknowns Apportioned
Unknown
Exposure
Intentional
Unintentional
Failure of equipment or heat source
Act of nature
Cause under investigation
Cause undetermined after investigation
Cause Reported Unknowns Apportioned
Cause undetermined after investigation
14.8 26.3
Cause under investigation 2.6 4.7
Act of nature 2.3 4.1Failure of equipment or heat source
1.9 3.5
Unintentional 24.3 43.2Intentional 10.0 17.8Exposure 0.3 0.5Unknown 43.8 0.0Total 100.0 100.0

The National Fire Problem 75
Figure 20. Causes of Outside Fires and Fires Resulting in Dollar Loss (2014) — Continued
Percent
Causes of Outside Fires Resulting in Dollar Loss (2014)
0.0 10.0 20.0 30.0 40.0 50.0
Reported
Unknowns Apportioned
Unknown
Exposure
Intentional
Unintentional
Failure of equipment or heat source
Act of nature
Cause under investigation
Cause undetermined after investigation
Cause Reported Unknowns Apportioned
Cause undetermined after investigation
14.9 23.4
Cause under investigation 4.2 6.6
Act of nature 2.0 3.2Failure of equipment or heat source
5.9 9.3
Unintentional 26.1 41.1Intentional 8.6 13.5Exposure 1.8 2.9Unknown 36.6 0.0Total 100.0 100.0
Source: NFIRS.Notes: 1.Adjustedpercentages(percentageswithunknownsapportioned)proportionallyspreadthefireincidentswithunknown
causes over the other seven cause categories. 2.AlargepercentageofoutsidefireincidentsreportedtoNFIRS(44percent)didnothavesufficientinformationto
determinethecauseofthefire.
Causes of Other Fires
Figure 21 shows the cause profiles for other fires and fires resulting in dollar loss. Due to the small numbers of other fatal fires and fires resulting in injuries reported to NFIRS, the distribution of causes for other fatal fires and fires resulting in injuries is not shown.
Just as with vehicle and outside fires, unintentional actions were the leading cause of other fires and fires resulting in dollar loss (46 and 48 percent, respectively). Failure of equipment or heat source was the second leading cause of other fires (20 percent) and other fires resulting in dollar loss (26 percent).

76 Fire in the United States 2005-2014
Figure 21. Causes of Other Fires and Fires Resulting in Dollar Loss (2014)
Percent
Causes of Other Fires (2014)
0.0 10.0 20.0 30.0 40.0 50.0
Reported
Unknowns Apportioned
Unknown
Exposure
Intentional
Unintentional
Failure of equipment or heat source
Act of nature
Cause under investigation
Cause undetermined after investigation
Cause Reported Unknowns Apportioned
Cause undetermined after investigation
15.8 16.1
Cause under investigation 6.9 7.0
Act of nature 2.3 2.4Failure of equipment or heat source
19.2 19.6
Unintentional 44.7 45.6Intentional 8.3 8.5Exposure 0.7 0.7Unknown 1.9 0.0Total 100.0 100.0
Percent
Causes of Other Fires Resulting in Dollar Loss (2014)
0.0 20.0 40.0 60.0
Reported
Unknowns Apportioned
Unknown
Exposure
Intentional
Unintentional
Failure of equipment or heat source
Act of nature
Cause under investigation
Cause undetermined after investigation
Cause Reported Unknowns Apportioned
Cause undetermined after investigation
11.3 11.4
Cause under investigation 6.3 6.3
Act of nature 1.1 1.1Failure of equipment or heat source
25.9 26.0
Unintentional 47.9 48.1Intentional 5.4 5.4Exposure 1.7 1.7Unknown 0.5 0.0Total 100.0 100.0
Source: NFIRS.Note: Adjustedpercentages(percentageswithunknownsapportioned)proportionallyspreadthefireincidentswithunknown
causes over the other seven cause categories.

The National Fire Problem 77
Fire Casualties
Fire casualties affect all groups and races, rich and poor, Northern and Southern, urban and rural. But the problem is greater for some groups than for others.
Fire casualties across population groups can be assessed in several ways. The simplest method is to look at the distribution of the numbers of deaths or injuries across the factor of interest. For example, in the case of race in 2014, the number of fire deaths was greatest for white Americans and least for Asians/Pacific Islanders. In the case of age, percentages of fire deaths were greatest for those ages 55 to 64, while 64 percent of fire injuries occurred among adults ages 20 to 59.
Although these findings are informative, they do not account for differences in the basic population groups under comparison. In the case of age, as an age group matures, its population of individuals decreases as a result of deaths. In the case of race, there are far fewer American Indians/Alaska Natives, for example, than white Americans living in the U.S. As a consequence, it is possible for an age group to have greater (or fewer) injuries or deaths because the sheer number of individuals for whom it is possible to be injured is larger (or smaller) than other groups.
To account for population differences such as these, per capita rates are used. Per capita rates use a common population size, which then permits comparisons between different groups.54 Perhaps the most useful way to assess fire casualties across groups is to determine the relative risk of dying or being injured. Relative risk compares the per capita rate for a particular group (e.g., females) to the overall per capita rate (i.e., the general population). For the general population in the U.S., the relative risk is set at 1.
Fire Deaths
In 2014, according to NCHS, 3,428 deaths were caused by fire.55,56 The risk of death from fire is not the same for everyone. When determining fire risk, geographic, demographic and socioeconomic factors all come into play.57
State Profiles
The fire problem varies from region to region and state to state in the U.S. This is often a result of climate, poverty, education, demographics, and other factors. Table 8 lists the 2014 civilian fire deaths, fire death rates per million population, and relative risk by state.
54Per capita rates are determined by the number of deaths or injuries occurring to a specific population group divided by the total population for that group. This ratio is then multiplied by a common population size. For the purposes of this report, per capita rates for fire deaths and injuries are measured per 1 million people.55NCHS, 2014 Mortality Data File, as compiled from data provided by the 57 vital statistics jurisdictions through the Vital Statistics Cooperative Program.56For each reported death certificate in the U.S., NCHS assigns codes for all reported conditions leading to death. Based on NCHS mortality data, there were 3,428 fire-related deaths in 2014. These included all deaths in which exposure to fire, fire products or explosion was the underlying cause of death or was a contributing factor in the chain of events leading to death. This latter condition is an expanded approach to capturing fire and fire-related deaths. With this current approach, deaths where such exposures were a contributing factor (i.e., the death may not have occurred without the exposure) can be captured. The codes included in the mortality statistics are F63.1, W39 to W40, X00 to X09, X75 to X76, X96 to X97, Y25 to Y26 and Y35.1.57For more information on U.S. fire deaths, fire death rates, and the risk of dying in a fire, visit https://www.usfa.fema.gov/data/statistics/fire_death_rates.html. Additionally, USFA’s topical report “Fire Risk in 2014” focuses on how fire risk, specifically the risk of death and injury, varies with age and how other demographic and socioeconomic factors weigh upon that risk. This report is available at https://www.usfa.fema.gov/downloads/pdf/statistics/v17i7.pdf.

78 Fire in the United States 2005-2014
Five states (Alabama, Mississippi, Oklahoma, Tennessee and West Virginia) and the District of Columbia had fire death rates that exceeded 20 deaths per million population. Nineteen states, mostly situated in the Southeast and Midwest, had death rates between 11 and 20 deaths per million population. Additionally, 19 states had fire death rates at or below the national fire death rate (i.e., 10.7 deaths per million population). While some state death rates were still high, overall, states have made great progress in lowering the absolute number of fire deaths and deaths per million population.58
Figure 22 ranks the order of states by relative risk of civilian fire death in 2014. In addition to the District of Columbia, the states with the highest relative risk of fire death in 2014 included Mississippi, Oklahoma and West Virginia. The populace of Mississippi was 2.2 times more likely to die in a fire than the general population; however, people living in California were 50 percent less likely to die in a fire than the population as a whole. Where relative risk was computed, 24 states and the District of Columbia had a relative risk higher than that of the general population. Three states —Nebraska, Rhode Island and Virginia — had a relative risk comparable to that of the general population. In 16 states, the relative risk was lower than that of the general population.
Table 8. Fire Deaths, Rates and Relative Risk by State (2014)
State of Occurrence
Fire Deaths
Fire Death Rate Per Million Population
(Crude Rate)
Relative Risk
Alabama 100 20.6 1.9Alaska** 13 17.6 1.6Arizona 46 6.8 0.6Arkansas 52 17.5 1.6California 192 4.9 0.5Colorado 31 5.8 0.5Connecticut 29 8.1 0.8Delaware** 11 11.8 1.1District of Columbia** 14 21.2 2.0Florida 140 7.0 0.7Georgia 158 15.6 1.5Hawaii * * *Idaho * * *Illinois 130 10.1 0.9Indiana 106 16.1 1.5Iowa 47 15.1 1.4Kansas 48 16.5 1.5Kentucky 71 16.1 1.5
58This analysis includes only states where fire death rates were computed. Fire death rates were not computed for Hawaii, Idaho, New Hampshire, North Dakota, South Dakota, Vermont and Wyoming due to very small numbers of fire deaths (fewer than 10 deaths). The fire death rates presented here reflect the crude death rates and are not age adjusted. The crude death rate is the total number of fire deaths per state divided by the total population per state and multiplied by one million.

The National Fire Problem 79
Table 8. Fire Deaths, Rates and Relative Risk by State (2014) — Continued
State of Occurrence
Fire Deaths
Fire Death Rate Per Million Population
(Crude Rate)
Relative Risk
Louisiana 84 18.1 1.7Maine 21 15.8 1.5Maryland 55 9.2 0.9Massachusetts 43 6.4 0.6Michigan 141 14.2 1.3Minnesota 48 8.8 0.8Mississippi 71 23.7 2.2Missouri 91 15.0 1.4Montana** 14 13.7 1.3Nebraska 20 10.6 1.0Nevada 20 7.0 0.7New Hampshire * * *New Jersey 68 7.6 0.7New Mexico 27 12.9 1.2New York 175 8.9 0.8North Carolina 141 14.2 1.3North Dakota * * *Ohio 134 11.6 1.1Oklahoma 87 22.4 2.1Oregon 48 12.1 1.1Pennsylvania 185 14.5 1.3Rhode Island** 11 10.4 1.0South Carolina 73 15.1 1.4South Dakota * * *Tennessee 134 20.5 1.9Texas 236 8.7 0.8Utah 23 7.8 0.7Vermont * * *Virginia 88 10.6 1.0Washington 60 8.5 0.8West Virginia 39 21.1 2.0Wisconsin 54 9.4 0.9Wyoming * * *United States 3,428 10.7 1.0
*Indicatesstateswherefiredeathratesandrelativeriskwerenotcomputedduetoverysmallnumbersoffiredeaths(fewerthan10 deaths).**Indicatesfiredeathratesshouldbeusedwithcautionduetosmallnumbersofdeaths.PertheNCHS,NationalVitalStatisticsReports, Volume 60, Number 4, “Deaths: Preliminary Data for 2010,” a rate or percentage is based on at least 20 deaths. Rates based on fewer than 20 deaths are considered highly variable.
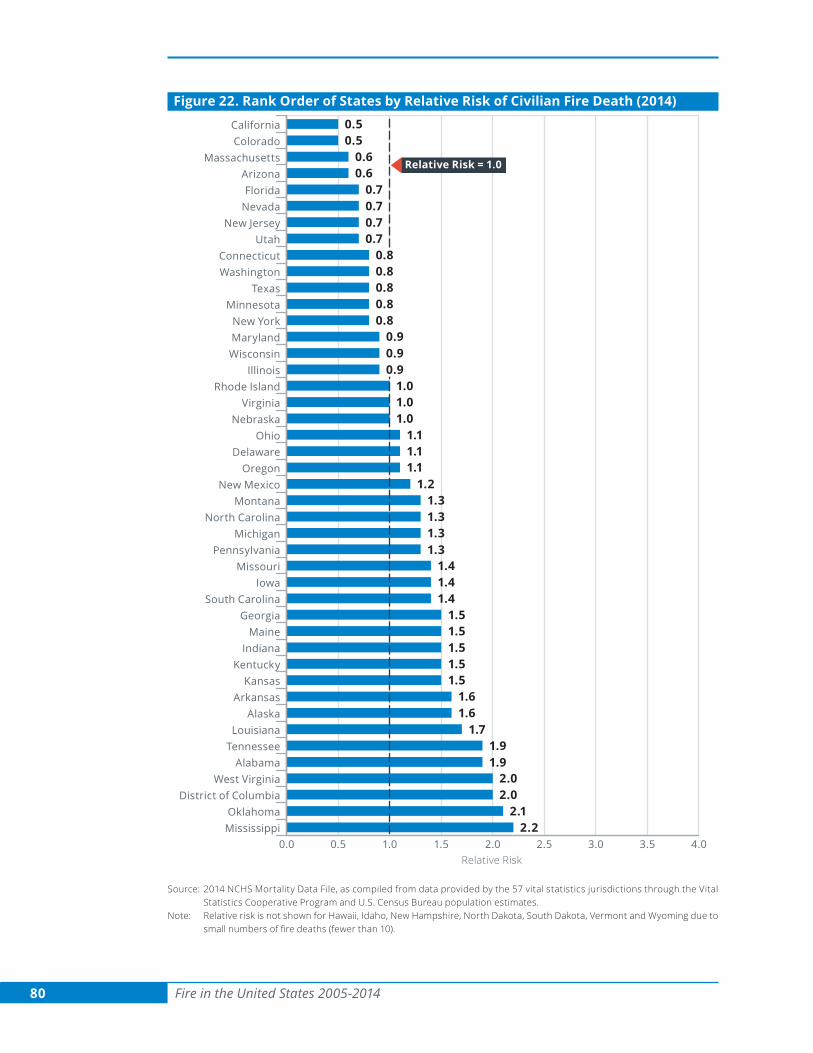
80 Fire in the United States 2005-2014
Figure 22. Rank Order of States by Relative Risk of Civilian Fire Death (2014)
0.0 0.5 1.0 1.5 2.0 2.5 3.0 3.5 4.0MississippiOklahoma
District of ColumbiaWest Virginia
AlabamaTennesseeLouisiana
AlaskaArkansas
KansasKentucky
IndianaMaine
GeorgiaSouth Carolina
IowaMissouri
PennsylvaniaMichigan
North CarolinaMontana
New MexicoOregon
DelawareOhio
NebraskaVirginia
Rhode IslandIllinois
WisconsinMarylandNew York
MinnesotaTexas
WashingtonConnecticut
UtahNew Jersey
NevadaFlorida
ArizonaMassachusetts
ColoradoCalifornia
2.22.1
2.02.0
1.91.9
1.71.61.6
1.51.51.51.51.5
1.41.41.4
1.31.31.31.3
1.21.11.11.1
1.01.01.0
0.90.90.9
0.80.80.80.80.8
0.70.70.70.7
0.60.6
0.50.5
Relative Risk
Relative Risk = 1.0
Source: 2014 NCHS Mortality Data File, as compiled from data provided by the 57 vital statistics jurisdictions through the Vital Statistics Cooperative Program and U.S. Census Bureau population estimates.
Note: Relative risk is not shown for Hawaii, Idaho, New Hampshire, North Dakota, South Dakota, Vermont and Wyoming due to smallnumbersoffiredeaths(fewerthan10).

The National Fire Problem 81
Age
Figure 23 shows the percentage of fire deaths by age. Unlike relative risk, the percentages do not take into account the number of individuals in an age group, and the distributions are somewhat different. Fire deaths from ages 55 to 64 accounted for 19 percent of the deaths. Children younger than 15 accounted for 8 percent of all fire deaths, while older adults (ages 65 and older) accounted for 38 percent of all fire deaths in 2014.
People ages 50 and older had a higher fire death rate than the average population (10.7 deaths per million population). For people ages 75 and older, the fire death rate was higher still — nearly three or more times the national average (Figure 24).
In 2014, adults ages 50 and older had a greater relative risk of dying in fires than the general population (Figure 25). Moreover, older adults ages 80 to 84 had a risk of fire death over three times that of the general population. Those ages 85 and older had the highest risk of fire death — more than four times that of the general population.
People with limited physical and cognitive abilities, especially older adults, are at a higher risk of death from fire than other groups. As baby boomers enter retirement age, the demographic profile of the U.S. is expected to change dramatically. The older adult population (ages 65 or older) is expected to increase from its current 14 percent of the total population to 24 percent by 2060,59 with an assumed corresponding increase in fire deaths and injuries among older adults. According to U.S. Census Bureau projections, by 2060, the number of individuals ages 65 or older is expected to be 98 million, more than double the amount in 2014. At the same time, the population ages 85 or older is expected to more than triple, increasing from 6 million in 2014 to 19.7 million in 2060.60 With advancing age, physical and mental capabilities of these older adults will likely decline, hindering their mobility and making it more difficult for them to clearly see, smell and hear. Lessened senses and decreased mobility increase the risk of death or injury from fire.
In the past, children ages 4 and younger were also considered to be at a high risk of death from fire; however, data indicates that the trend is changing. In 2009, the relative risk of death from fire for children ages 4 and younger was equivalent to that of the general population. For the five-year period from 2010 to 2014, however, the relative risk of death from fire for children in this same age group was less than that of the general population, ranging from 0.9 in 2010 to 0.7 in 2012 to 2014. Although the relative risk of children ages 4 and younger dying in a fire was 30 percent less than that of the general population in 2014, children ages 4 and younger faced an elevated risk of death in a fire when compared to older children (ages 5 to 14).
59U.S. Census Bureau, Population Division, Table 6. Percent Distribution of the Projected Population by Sex and Selected Age Groups for the United States: 2015 to 2060 (NP2014-T6). Release date: December 2014, https://www.census.gov/population/projections/data/national/2014/summarytables.html.60U.S. Census Bureau, Population Division, Table 3. Projections of the Population by Sex and Selected Age Groups for the United States: 2015 to 2060 (NP2014-T3). Release date: December 2014, https://www.census.gov/population/projections/data/national/2014/summarytables.html.

82 Fire in the United States 2005-2014
Figure 23. Fire Deaths by Age (2014)
0.0 1.0 2.0 3.0 4.0 5.0 6.0 7.0 8.0 9.0 10.0 11.0
85 or older
80-84
75-79
70-74
65-69
60-64
55-59
50-54
45-49
40-44
35-39
30-34
25-29
20-24
15-19
10-14
5-9
4 or younger
8.0
8.0
8.8
9.59.6
8.7
5.6
4.4
4.1
3.3
3.9
2.9
1.7
1.7
2.3
4.3
6.6
6.7
Percent
Deaths (3,428 cases)
Source: NCHS.Note: Datahavebeenadjustedtoaccountforunknownorunspecifiedages.
Figure 24. Fire Death Rates by Age (2014)
0.0 10.0 20.0 30.0 40.0 50.0 60.0 70.0 80.0
85 or older
80-84
75-79
70-74
65-69
60-64
55-59
50-54
45-49
40-44
35-39
30-34
25-29
20-24
15-19
10-14
5-9
4 or younger
44.5
24.819.7
17.5
5.26.1
4.32.82.9
3.8
39.229.2
Deaths per Million Population
National Fire Death Rate = 10.7
15.213.2
Deaths (3,428 cases)
9.17.37.0
7.5
Sources: NCHS and U.S. Census Bureau.Note: Datahavebeenadjustedtoaccountforunknownorunspecifiedages.

The National Fire Problem 83
Figure 25. Relative Risk of Fire Deaths by Age (2014)
0.0 1.0 2.0 3.0 4.0 5.0
85 or older
80-84
75-79
70-74
65-69
60-64
55-59
50-54
45-49
40-44
35-39
30-34
25-29
20-24
15-19
10-14
5-9
4 or younger
4.1
2.31.8
1.6
0.70.6
0.50.6
0.40.30.3
0.40.7
3.62.7
Relative Risk
Relative Risk = 1.0
1.41.2
Deaths (3,428 cases)
0.9
Sources: NCHS and U.S. Census Bureau.Notes: 1. Relative risk compares the per capita rate for a particular group (e.g., age group) to the overall per capita rate (i.e., the
generalpopulation).Forthegeneralpopulation,therelativeriskissetat1,asindicatedbythedashedlineinthefigureabove.
2.Datahavebeenadjustedtoaccountforunknownorunspecifiedages.
Gender
As shown in Table 9, more men (61 percent) died in fires than women (39 percent) in 2014. The high proportion of male to female fire deaths has remained steady from year to year.
Table 9. Percent Distribution of Fire Deaths by Gender (2014)
Casualty Type Males (percent)
Females (percent)
Deaths 61.49 38.51
Source: NCHS.
Figures 26 and 27 present the percent of fire deaths by age and gender and fire death rates by age and gender, respectively. The distribution of fire deaths by age is somewhat different for males versus females. Female fire deaths in the 70 and older age group accounted for approximately one-third (34 percent) of female fire deaths. Male fire deaths, by contrast, were highest for those adults age 50 to 69, accounting for 39 percent of male fire deaths.
Males had a higher fire death rate per million population than females for all age groups. Males were 1.5 times more likely to die in fires than females.
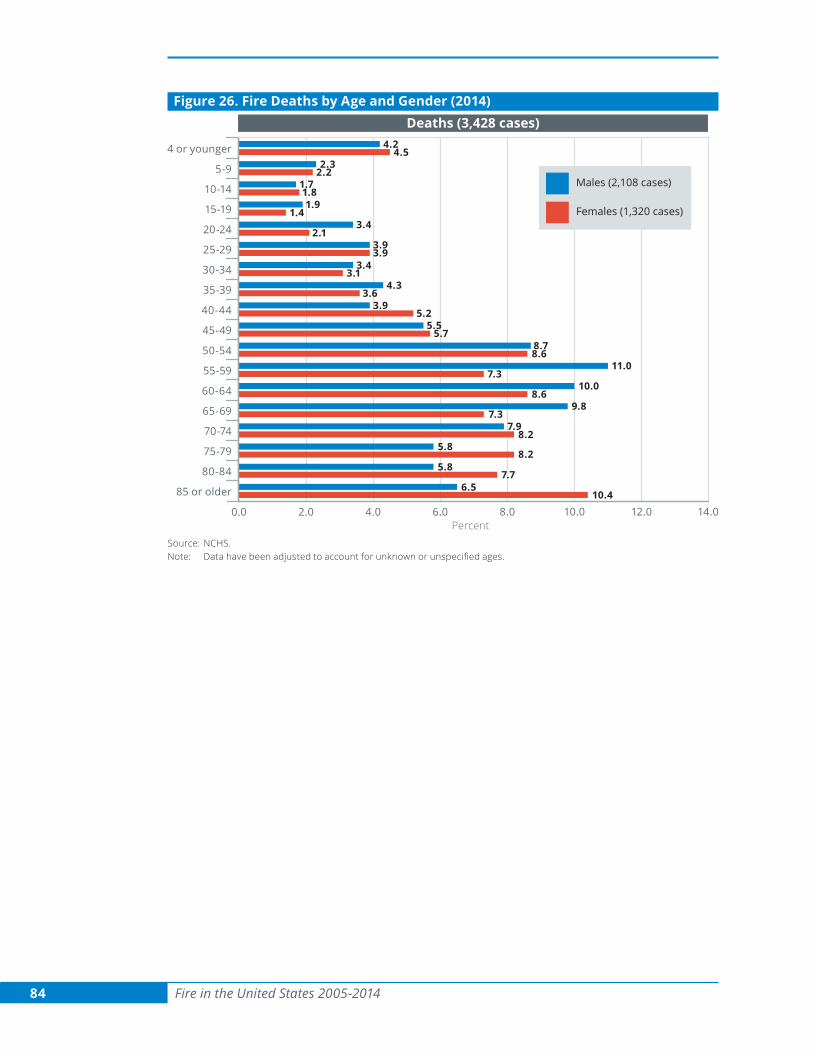
84 Fire in the United States 2005-2014
Figure 26. Fire Deaths by Age and Gender (2014)
0.0 2.0 4.0 6.0 8.0 10.0 12.0 14.0
Females (1,320 cases)
Males (2,108 cases)
85 or older
80-84
75-79
70-74
65-69
60-64
55-59
50-54
45-49
40-44
35-39
30-34
25-29
20-24
15-19
10-14
5-9
4 or younger
10.46.5
8.27.9
7.39.8
8.6
8.6
10.07.3
11.0
8.75.7
5.55.2
3.93.6
4.33.1
3.43.93.9
2.13.4
1.41.9
1.81.7
2.22.3
4.54.2
7.75.8
5.88.2
Percent
Deaths (3,428 cases)
Source: NCHS.Note: Datahavebeenadjustedtoaccountforunknownorunspecifiedages.

The National Fire Problem 85
Figure 27. Fire Death Rates by Age and Gender (2014)
0.0 10.0 20.0 30.0 40.0 50.0 60.0 70.0 80.0 90.0 100.0
Females (1,320 cases)
Males (2,108 cases)
85 or older
80-84
75-79
70-74
65-69
60-64
55-59
50-54
45-49
40-44
35-39
30-34
25-29
20-24
15-19
10-14
5-9
4 or younger
33.964.8
18.132.6
11.928.5
11.8
9.9
23.88.7
22.1
16.57.1
11.26.6
8.14.8
9.23.8
6.74.8
7.42.5
6.01.8
3.62.43.32.9
4.76.2
8.7
30.351.8
35.124.5
Deaths per Million Population
Deaths (3,428 cases)
Sources: NCHS and U.S. Census Bureau.Note: Datahavebeenadjustedtoaccountforunknownorunspecifiedages.

86 Fire in the United States 2005-2014
Race
Figure 28 shows the fire death rates by race and gender in 2014. White males, African-Americans, and American Indians/Alaska Natives had higher fire death rates than the national average. Asians/Pacific Islanders had the lowest death rates. African-American fire death victims constituted a large and disproportionate share of total fire deaths. Although African-Americans constituted 13 percent of the U.S. population, they accounted for 20 percent of fire deaths in 2014.
Figure 28. Fire Death Rates by Race and Gender (2014)
0.0 5.0 10.0 15.0 20.0 25.0 30.0
Females (1,320 cases)
Males (2,108 cases)
Overall
Asian/Pacific Islander
American Indian/Alaska Natives
African-American
White
National Fire Death Rate = 10.7
13.3
7.9
20.0
13.0
19.5
12.2
13.8
8.4
3.9
2.7
Deaths per Million Population
Number of Fire DeathsRace Males Females Total
White 1,631 984 2,615African-American 404 286 690
American Indian/Alaska Native
39 24 63
Asian/Pacific Islander
34 26 60
Overall 2,108 1,320 3,428
Sources: NCHS and U.S. Census Bureau.Notes: 1. The overall male and female population estimates include individuals with “2+ races” per the census. The “2+ races”
category accounts for 2.5 percent of the population. NCHS does not include this race category. 2.ThisfigureusesNCHSdatainthecomputationofthenationalfiredeathratefordataconsistencywithinthischart.
Basedonthe2014NFPAfiredeathestimate,thisrateis10.3.
Fire Injuries
According to the NFPA, in 2014, there were an estimated 15,775 civilian fire injuries. In general, the age profile for fire injuries was very different from that for deaths. This difference is thought to be the result of both cognitive and mobility issues that affect many older adults. As a result, these adults were generally less likely to escape the effects of fire and thus suffered fatal injuries.
Age
Figures 29 and 30 show the percentage of fire injuries by age and fire injury rates by age in 2014, respectively. In 2014, children younger than 15 accounted for 11 percent of fire injuries; older adults (ages 65 and older) accounted for 14 percent. The majority of fire-related injuries occurred in adults ages 20 to 59. This age group accounted for 64 percent of the fire injuries in 2014 (Figure 29).

The National Fire Problem 87
Adults ages 85 and older experienced the highest fire injury rate at 68.5 injuries per one million people. Adults ages 20 to 64 also experienced higher fire injury rates than the national fire injury rate (i.e., 49.5 injuries per million population) yet have some of the lowest fire death rates. Fire injury rates were below average for children and teenagers ages 19 or younger and for people ages 65 to 84 (Figure 30).
In 2014, those 85 and older were at the greatest risk of fire injury, followed by adults ages 20 to 64 (Figure 31). The risk for injury was lowest for the younger age groups and those ages 65 to 69 and 75 to 79. The risk for injury from fire for older adults ages 70 to 74 and those ages 80 to 84 was comparable to that of the general population. Although most of the older adult age groups had a lower or average level of fire injury risk, there were fewer of them in the total population. If their risk continues to be the same, we could expect more and more elderly fire injuries and deaths as the older adult proportion of the population increases. In the meantime, the focus for fire injury prevention should be on adults ages 20 to 64 and those 85 or older.
Figure 29. Fire Injuries by Age (2014)
0.0 1.0 2.0 3.0 4.0 5.0 6.0 7.0 8.0 9.0 10.0 11.0 12.0
85 or older
80-84
75-79
70-74
65-69
60-64
55-59
50-54
45-49
40-44
35-39
30-34
25-29
20-24
15-19
10-14
5-9
4 or younger
2.7
3.44.1
6.5
7.97.9
7.28.28.28.2
4.92.5
2.45.7
1.82.3
Percent
7.68.7
Injuries
Source: NFIRS.Note: Datahavebeenadjustedtoaccountforunknownorunspecifiedages.

88 Fire in the United States 2005-2014
Figure 30. Fire Injury Rates by Age (2014)
0.0 10.0 20.0 30.0 40.0 50.0 60.0 70.0 80.0 90.0 100.0
85 or older
80-84
75-79
70-74
65-69
60-64
55-59
50-54
45-49
40-44
35-39
30-34
25-29
20-24
15-19
10-14
5-9
4 or younger
Injuries per Million Population
National Fire Injury Rate = 49.5
Injuries
68.5
48.341.9
54.9
59.760.5
56.760.2
59.056.7
36.618.9
18.2
48.344.9
55.860.5
45.5
Sources: NFIRS, NFPA and U.S. Census Bureau.Note: Datahavebeenadjustedtoaccountforunknownorunspecifiedages.

The National Fire Problem 89
Figure 31. Relative Risk of Fire Injuries by Age (2014)
0.00 0.25 0.50 0.75 1.00 1.25 1.50
85 or older
80-84
75-79
70-74
65-69
60-64
55-59
50-54
45-49
40-44
35-39
30-34
25-29
20-24
15-19
10-14
5-9
4 or younger
1.4
1.00.8
1.1
1.21.2
1.11.21.2
1.10.7
0.40.4
0.9
1.00.9
Relative Risk
Relative Risk = 1.00
1.11.2
Injuries
Sources: NFIRS, NFPA and U.S. Census Bureau.Notes: 1. Relative risk compares the per capita rate for a particular group (e.g., age group) to the overall per capita rate (i.e.,
the general population). For the general population, the relative risk is set at 1, as indicated by the dashed lines in the figureabove.
2.Datahavebeenadjustedtoaccountforunknownorunspecifiedages.
Gender
The male-to-female ratio for fire injuries was similar to that for fire deaths, except that the gender gap was smaller. In 2014, more men (58 percent) were injured in fires than women (42 percent), as shown in Table 10.
Table 10. Percent Distribution of Fire Injuries by Gender (2014)
Casualty Type Males (percent)
Females (percent)
Injuries 58.46 41.54
Source: NFIRS.
Figures 32 and 33 present the percentages of fire injuries by age and gender and fire injury rates by age and gender, respectively. The percentage distribution of fire injuries by age was somewhat different for males versus females. Males ages 20 to 64 had a higher proportion of injuries, while older adult females had more injuries than older adult males (Figure 32). Males had a much higher fire injury rate per million population than females for all age groups (Figure 33).
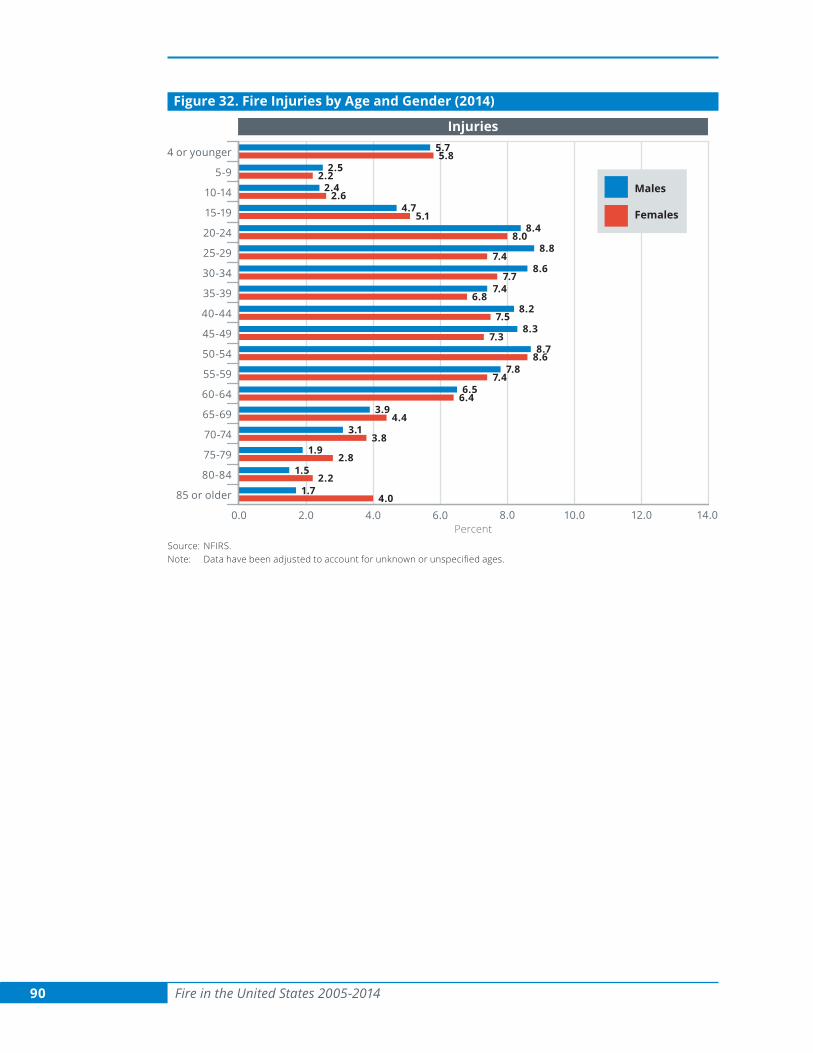
90 Fire in the United States 2005-2014
Figure 32. Fire Injuries by Age and Gender (2014)
0.0 2.0 4.0 6.0 8.0 10.0 12.0 14.0
Females
Males
85 or older
80-84
75-79
70-74
65-69
60-64
55-59
50-54
45-49
40-44
35-39
30-34
25-29
20-24
15-19
10-14
5-9
4 or younger
4.01.7
3.83.1
4.43.9
6.4
8.6
6.57.4
7.8
8.77.3
8.37.5
8.26.8
7.47.7
8.67.4
8.88.0
8.45.1
4.72.6
2.42.2
2.55.8
5.7
2.21.5
1.92.8
Percent
Injuries
Source: NFIRS.Note: Datahavebeenadjustedtoaccountforunknownorunspecifiedages.

The National Fire Problem 91
Figure 33. Fire Injury Rates by Age and Gender (2014)
0.0 25.0 50.0 75.0 100.0 125.0
Females
Males
85 or older
80-84
75-79
70-74
65-69
60-64
55-59
50-54
45-49
40-44
35-39
30-34
25-29
20-24
15-19
10-14
5-9
4 or younger
64.975.6
41.955.8
35.549.0
43.3
49.2
67.643.8
68.5
72.345.5
74.247.4
73.944.9
68.546.9
73.444.6
72.946.9
66.132.5
40.516.7
21.114.3
21.939.1
51.6
42.456.6
48.741.9
Injuries per Million Population
Injuries
Sources: NFIRS, NFPA and U.S. Census Bureau.Note: Datahavebeenadjustedtoaccountforunknownorunspecifiedages.
To comment on this specif ic report, visit : ht tp://apps.usfa.fema.gov/contact /dataReportEval?reportTitle=Fire%20in%20the%20United%20States%20(2005-2014).

92 Fire in the United States 2005-2014

Acronyms 93
AcronymsAFG Assistance to Firefighters Grant
ARC American Red Cross
CPI Consumer Price Index
CPSC Consumer Product Safety Commission
DEBI Data Entry Browser Interface
DET Data Entry Tool
EMS Emergency Medical Services
FAQs frequently asked questions
FDID fire department identification
NCHS National Center for Health Statistics
NFDC National Fire Data Center
NFIRS National Fire Incident Reporting System
NFIRS: PM “National Fire Incident Reporting System: Program Management”
NFIRS PM--DAPST “NFIRS Program Management--Data Analysis and Problem-Solving Techniques”
NFPA National Fire Protection Association
NWS National Weather Service
OMB Office of Management and Budget
PDR Public Data Release
USFA U.S. Fire Administration