fire and safety distribution industry...
TRANSCRIPT
2
Fire and Safety Distribution
Industry Advisor Winter 2014
© 2014 League Park Advisors
1100 Superior Avenue East Suite 1650 Cleveland, OH 44114 | 216.455.9985 PHONE | 216.455.9986 FAX | www.leaguepark.com

2
TABLE OF CONTENTS
I. Executive Summary ......................................................................................................................................................................................................... 3
II. Industry Overview ............................................................................................................................................................................................................ 5
III. Financial Analysis ............................................................................................................................................................................................................. 8
IV. Fire and Safety M&A Trends ..................................................................................................................................................................................... 10
V. 2014 Expectations ......................................................................................................................................................................................................... 12
TABLE OF FIGURES
Figure 1: Direct Dollar Loss by Property Type .................................................................................................................................................................. 3
Figure 2: Reported Fires and Direct Property Damage, 1987 – 2012 ....................................................................................................................... 3
Figure 3: U.S. Fire and Safety Market, 2007 – 2017P ...................................................................................................................................................... 3
Figure 4: U.S. Fire and Safety Sales by End Market ......................................................................................................................................................... 4
Figure 5: U.S. Fire and Safety Sales by Product ................................................................................................................................................................ 5
Figure 6: U.S. Construction Put in Place, 2005 – 2017P ................................................................................................................................................. 6
Figure 7: Average Damage per Fire With and Without Sprinklers ............................................................................................................................ 7
Figure 8: Relative Stock Price Performance ....................................................................................................................................................................... 8
Figure 9: Industry Financial Analysis ..................................................................................................................................................................................... 8
Figure 10: Industry Valuations ................................................................................................................................................................................................ 9
Figure 11: Industry Valuations Trends ................................................................................................................................................................................. 9
Figure 12: U.S. Fire and Safety Distribution Market Share ........................................................................................................................................ 10
3
Executive Summary
I. Executive Summary
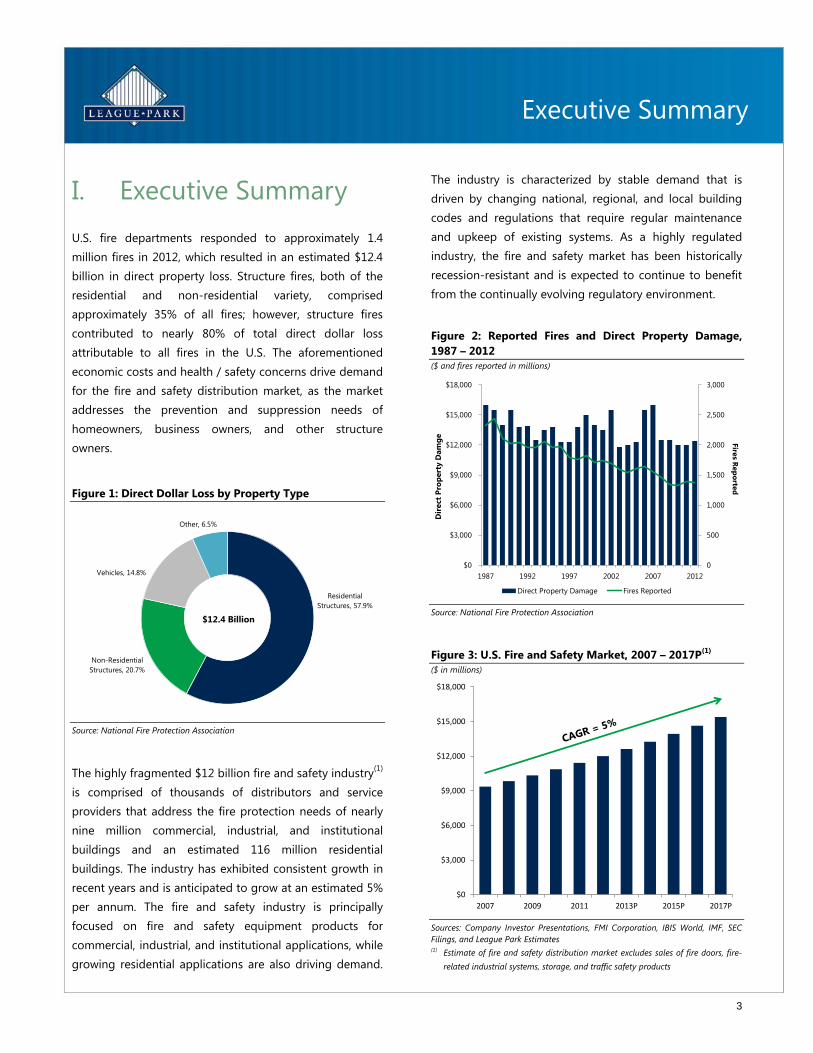
U.S. fire departments responded to approximately 1.4
million fires in 2012, which resulted in an estimated $12.4
billion in direct property loss. Structure fires, both of the
residential and non-residential variety, comprised
approximately 35% of all fires; however, structure fires
contributed to nearly 80% of total direct dollar loss
attributable to all fires in the U.S. The aforementioned
economic costs and health / safety concerns drive demand
for the fire and safety distribution market, as the market
addresses the prevention and suppression needs of
homeowners, business owners, and other structure
owners.
Figure 1: Direct Dollar Loss by Property Type
Residential
Structures, 57.9%
Non-Residential
Structures, 20.7%
Vehicles, 14.8%
Other, 6.5%
$12.4 Billion
Source: National Fire Protection Association
The highly fragmented $12 billion fire and safety industry(1)
is comprised of thousands of distributors and service
providers that address the fire protection needs of nearly
nine million commercial, industrial, and institutional
buildings and an estimated 116 million residential
buildings. The industry has exhibited consistent growth in
recent years and is anticipated to grow at an estimated 5%
per annum. The fire and safety industry is principally
focused on fire and safety equipment products for
commercial, industrial, and institutional applications, while
growing residential applications are also driving demand.
The industry is characterized by stable demand that is
driven by changing national, regional, and local building
codes and regulations that require regular maintenance
and upkeep of existing systems. As a highly regulated
industry, the fire and safety market has been historically
recession-resistant and is expected to continue to benefit
from the continually evolving regulatory environment.
Figure 2: Reported Fires and Direct Property Damage,
1987 – 2012
($ and fires reported in millions)
0
500
1,000
1,500
2,000
2,500
3,000
$0
$3,000
$6,000
$9,000
$12,000
$15,000
$18,000
1987 1992 1997 2002 2007 2012
Fire
s Rep
orte
d
Dir
ect
Pro
pert
y D
am
ge
Direct Property Damage Fires Reported
Source: National Fire Protection Association
Figure 3: U.S. Fire and Safety Market, 2007 – 2017P(1)
($ in millions)
$0
$3,000
$6,000
$9,000
$12,000
$15,000
$18,000
2007 2009 2011 2013P 2015P 2017P
Sources: Company Investor Presentations, FMI Corporation, IBIS World, IMF, SEC
Filings, and League Park Estimates
(1) Estimate of fire and safety distribution market excludes sales of fire doors, fire-
related industrial systems, storage, and traffic safety products
4
Executive Summary
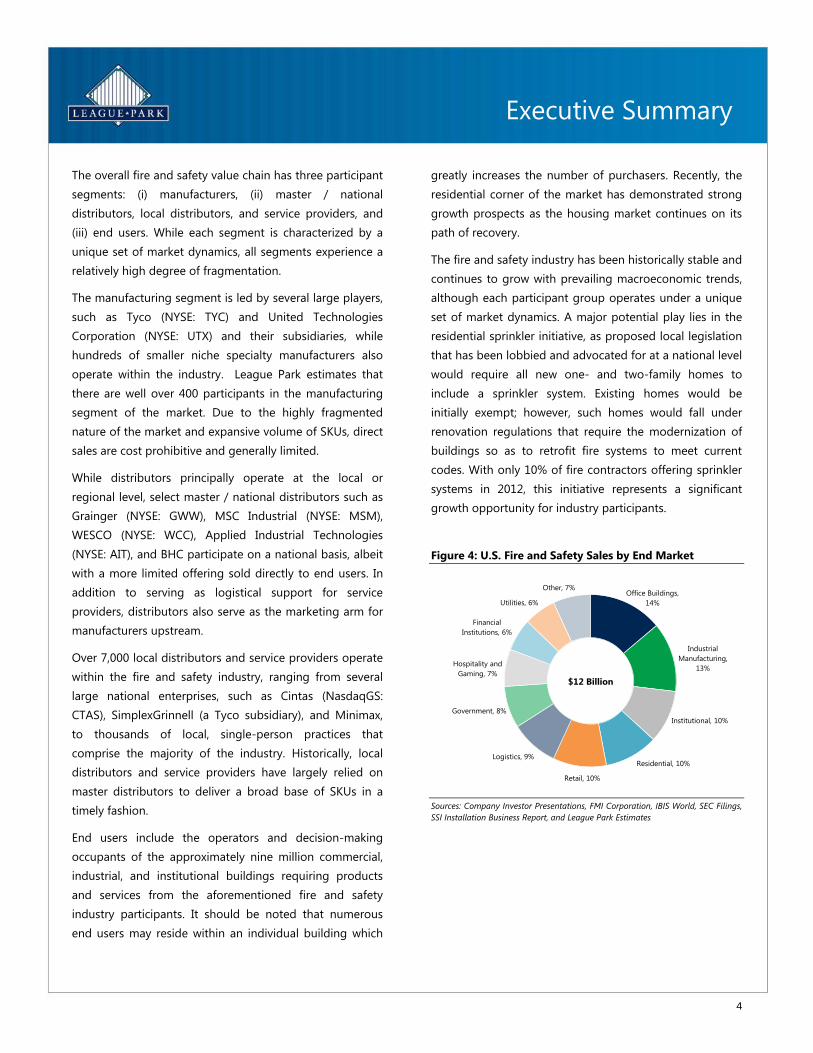
The overall fire and safety value chain has three participant
segments: (i) manufacturers, (ii) master / national
distributors, local distributors, and service providers, and
(iii) end users. While each segment is characterized by a
unique set of market dynamics, all segments experience a
relatively high degree of fragmentation.
The manufacturing segment is led by several large players,
such as Tyco (NYSE: TYC) and United Technologies
Corporation (NYSE: UTX) and their subsidiaries, while
hundreds of smaller niche specialty manufacturers also
operate within the industry. League Park estimates that
there are well over 400 participants in the manufacturing
segment of the market. Due to the highly fragmented
nature of the market and expansive volume of SKUs, direct
sales are cost prohibitive and generally limited.
While distributors principally operate at the local or
regional level, select master / national distributors such as
Grainger (NYSE: GWW), MSC Industrial (NYSE: MSM),
WESCO (NYSE: WCC), Applied Industrial Technologies
(NYSE: AIT), and BHC participate on a national basis, albeit
with a more limited offering sold directly to end users. In
addition to serving as logistical support for service
providers, distributors also serve as the marketing arm for
manufacturers upstream.
Over 7,000 local distributors and service providers operate
within the fire and safety industry, ranging from several
large national enterprises, such as Cintas (NasdaqGS:
CTAS), SimplexGrinnell (a Tyco subsidiary), and Minimax,
to thousands of local, single-person practices that
comprise the majority of the industry. Historically, local
distributors and service providers have largely relied on
master distributors to deliver a broad base of SKUs in a
timely fashion.
End users include the operators and decision-making
occupants of the approximately nine million commercial,
industrial, and institutional buildings requiring products
and services from the aforementioned fire and safety
industry participants. It should be noted that numerous
end users may reside within an individual building which
greatly increases the number of purchasers. Recently, the
residential corner of the market has demonstrated strong
growth prospects as the housing market continues on its
path of recovery.
The fire and safety industry has been historically stable and
continues to grow with prevailing macroeconomic trends,
although each participant group operates under a unique
set of market dynamics. A major potential play lies in the
residential sprinkler initiative, as proposed local legislation
that has been lobbied and advocated for at a national level
would require all new one- and two-family homes to
include a sprinkler system. Existing homes would be
initially exempt; however, such homes would fall under
renovation regulations that require the modernization of
buildings so as to retrofit fire systems to meet current
codes. With only 10% of fire contractors offering sprinkler
systems in 2012, this initiative represents a significant
growth opportunity for industry participants.
Figure 4: U.S. Fire and Safety Sales by End Market
Office Buildings,
14%
Industrial
Manufacturing,
13%
Institutional, 10%
Residential, 10%
Retail, 10%
Logistics, 9%
Government, 8%
Hospitality and
Gaming, 7%
Financial
Institutions, 6%
Utilities, 6%
Other, 7%
$12 Billion
Sources: Company Investor Presentations, FMI Corporation, IBIS World, SEC Filings,
SSI Installation Business Report, and League Park Estimates

5
Industry Overview
II. Industry Overview
The $12 billion fire and safety industry represents a robust
market with highly attractive characteristics. The industry
typically expands at the same pace as the overall economy
while maintaining a degree of recession-resistance, such
that during a recessionary period, the installed base of
equipment and nature of existing building codes drive
recurring revenue. The regulated nature of the industry
makes maintenance, repair, and operations (“MRO”)
spending generally non-discretionary and stable. The core
industry fundamentals include: (i) strict regulations, (ii)
recurring, need-based purchases, (iii) large market size, (iv)
fragmented market conditions, (v) insurance-influenced
purchases, and (vi) growth through new construction,
modernization, and code changes.
Heavily Regulated Industry
The domestic fire and safety industry is governed by state
and local fire marshals with guidance from the National Fire
Protection Association (“NFPA”) and the International Code
Council (“ICC”). The NFPA has published approximately 300
codes and standards that are designed to minimize the risks
and effects of fire by establishing enforceable criteria for
buildings as well as the design, service, and installation of
systems therein. States and local municipalities are free to
develop their own codes and regulations, but they typically
use the NFPA and ICC as a baseline from which to form their
own policies. State and local codes require buildings to
meet or exceed the specified minimum national
requirements.
Regulations and codes are instrumental to the fire and
safety industry. As is true with any heavily regulated
industry, spending on fire and safety products is generally
non-discretionary, as it is mandated by the aforementioned
codes. The codes and regulations are strictly enforced,
requiring close adherence that drives recurring purchases.
Generally, the highly regulated nature of the industry leads
to recurring revenue from necessary regular maintenance,
repair, and retrofits, which augments revenue generated
from spending on new construction.
Recurring, Needs-Based Purchases
The needs-based nature of purchases in the fire and safety
market is largely attributable to the strictly-enforced codes
governing the industry. End users are required to maintain
their equipment according to the guidelines set forth in the
codes and enforced by the local municipality. NFPA 1 is the
regulatory standard most commonly used to write fire
codes. NFPA 1 requires regular maintenance and inspection,
which typically occurs on an annual basis. The inspection
schedule mandated by NFPA 1 requires the frequent
purchase of replacement parts, which drives the fire and
safety aftermarket.
During periods of economic downturn, the fire and safety
industry will usually see an increase in the volume of
replacement part sales. Although overall industry revenue
dips during recessionary periods, the sale of higher margin
replacement parts leads to relatively stable profits and
earnings before interest, taxes, depreciation, and
amortization (“EBITDA”) for fire and safety providers.
Generally, the only value chain participants adversely
affected by the switch to a focus on replacement parts are
installers, who are better served mounting new systems in
lieu of replacing smaller parts due to the higher associated
labor costs.
Figure 5: U.S. Fire and Safety Sales by Product
Personal
Protection and
Safety
Equipment(1),
65%Fire Apparatus
and Equipment,
20%
Fire Alarm
Systems, 8%
Fire Extinguishers,
4%
Sprinklers /
Suppression
Systems, 2%
$12 Billion
Sources: CapitalIQ, Company Investor Presentations, IBIS World, SEC Filings, and
League Park Estimates
(1) Personal protection and safety equipment includes traditional personal
protection and safety, first aid, protective clothing, signs, fall protection, facility
safety

6
Industry Overview
Market Size and Competition
End users in the fire and safety industry include owners of
commercial buildings, governmental buildings, and other
institutional buildings, with an emerging residential segment
contributing a growing number of end users to the overall
market. Overall, there are approximately 125 million such
buildings in the U.S. – a number that grows steadily each
year as the construction markets continue to rebound from
the recession. Local distributors and service providers
selected by end users to fulfill their fire and safety needs
generally operate as the decision makers in the market and
facilitate code compliance.
Figure 6: U.S. Construction Put in Place, 2005 – 2017P
($ in millions)
$0
$100,000
$200,000
$300,000
$400,000
$500,000
$600,000
$700,000
2005 2007 2009 2011 2013P 2015P 2017P
Residential Non-Residential Infrastructure
Source: FMI Corporation
Another segment of the fire and safety industry is
comprised of non-structural end users, including those who
operate within the trucking and transportation, commercial
and recreational maritime, firefighting, and government
first-response agency markets. Generally, this segment of
end users is affected by similar regulatory characteristics as
the rest of the fire and safety industry; however, they are
serviced by a different set of installers and maintenance
personnel.
Due to the high degree of fragmentation, the fire and safety
industry is locally competitive. Competition is generally
based on price, product line breadth, support, and delivery.
The relative importance of these factors varies depending
on project and product line complexity, conditions in local
markets, as well as other factors. The competitive dynamics
in the fire and safety industry generally result in more direct
competition and lower margins for new construction
compared to MRO offerings.
Fragmented Market
Given the sheer scale of the overall fire and safety industry,
there is a significant amount of fragmentation among both
end users and local distributors and service providers. As
property owners, end users are inherently fragmented. Local
distributors and service providers are especially fragmented
as they may serve only the buildings in a single town with
little or no competition. Installers often attempt to both
install the equipment and service the product throughout its
lifetime.
End market fragmentation makes it difficult for
manufacturers and master / national distributors to identify
and sell products to end users. This fragmentation often
gives rise to close relationships with local distributors and
service providers, as they are the participants most
knowledgeable of local codes and regulations. In many
cases, there is little competition among service providers
and the purchase decision becomes little more than an
afterthought for building supervisors.
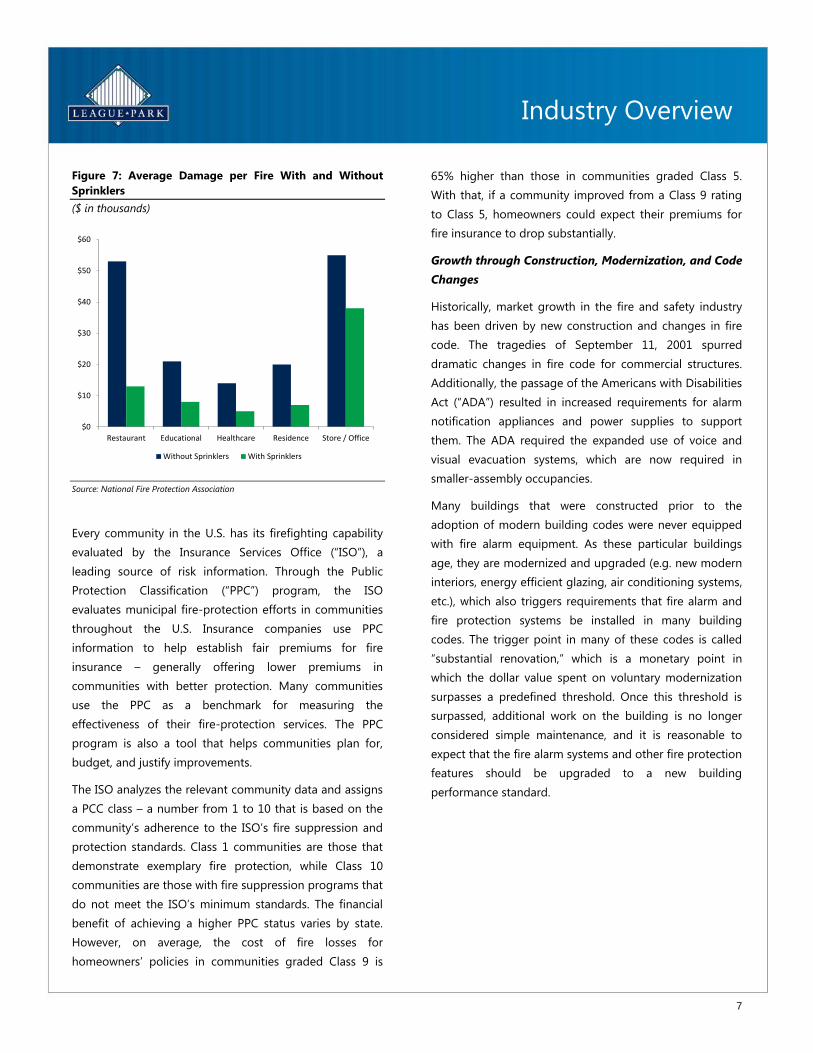
Insurance Drives Installation
Insurance savings, to a lesser degree, can drive some owners
to install fire equipment. Many property insurance policies
will reduce premiums up to 30% with the installation of fire
alarm and suppression systems. While insurance for
homeowners will vary depending on the type of coverage
amounts, the discounts for home sprinkler systems range up
to 10%, with an average discount of approximately 7%. In
2012, buildings with modern sprinkler systems sustained
69% of the damage of those without sprinkler systems
during structure fires. Further, as the likelihood of a building
with a sprinkler system surviving a fire is approximately 97%,
there are tangible reasons that validate the proliferation of
sprinkler systems.
7
Industry Overview
Figure 7: Average Damage per Fire With and Without
Sprinklers
($ in thousands)
$0
$10
$20
$30
$40
$50
$60
Restaurant Educational Healthcare Residence Store / Office
Without Sprinklers With Sprinklers
Source: National Fire Protection Association
Every community in the U.S. has its firefighting capability
evaluated by the Insurance Services Office (“ISO”), a
leading source of risk information. Through the Public
Protection Classification (“PPC”) program, the ISO
evaluates municipal fire-protection efforts in communities
throughout the U.S. Insurance companies use PPC
information to help establish fair premiums for fire
insurance – generally offering lower premiums in
communities with better protection. Many communities
use the PPC as a benchmark for measuring the
effectiveness of their fire-protection services. The PPC
program is also a tool that helps communities plan for,
budget, and justify improvements.
The ISO analyzes the relevant community data and assigns
a PCC class – a number from 1 to 10 that is based on the
community’s adherence to the ISO’s fire suppression and
protection standards. Class 1 communities are those that
demonstrate exemplary fire protection, while Class 10
communities are those with fire suppression programs that
do not meet the ISO’s minimum standards. The financial
benefit of achieving a higher PPC status varies by state.
However, on average, the cost of fire losses for
homeowners’ policies in communities graded Class 9 is
65% higher than those in communities graded Class 5.
With that, if a community improved from a Class 9 rating
to Class 5, homeowners could expect their premiums for
fire insurance to drop substantially.
Growth through Construction, Modernization, and Code
Changes
Historically, market growth in the fire and safety industry
has been driven by new construction and changes in fire
code. The tragedies of September 11, 2001 spurred
dramatic changes in fire code for commercial structures.
Additionally, the passage of the Americans with Disabilities
Act (“ADA”) resulted in increased requirements for alarm
notification appliances and power supplies to support
them. The ADA required the expanded use of voice and
visual evacuation systems, which are now required in
smaller-assembly occupancies.
Many buildings that were constructed prior to the
adoption of modern building codes were never equipped
with fire alarm equipment. As these particular buildings
age, they are modernized and upgraded (e.g. new modern
interiors, energy efficient glazing, air conditioning systems,
etc.), which also triggers requirements that fire alarm and
fire protection systems be installed in many building
codes. The trigger point in many of these codes is called
“substantial renovation,” which is a monetary point in
which the dollar value spent on voluntary modernization
surpasses a predefined threshold. Once this threshold is
surpassed, additional work on the building is no longer
considered simple maintenance, and it is reasonable to
expect that the fire alarm systems and other fire protection
features should be upgraded to a new building
performance standard.

8
Financial Analysis
III. Financial Analysis
Fire and safety and industrial distribution companies
continue to perform well, with positive revenue growth
demonstrated by major industry participants. Strong
revenue growth that is generally generated from non-
discretionary spending was augmented by gains in
discretionary spending, which has benefited from the
relatively strong economy and low interest rates.
Nearly all of the publicly-traded fire and safety and
industrial distribution companies tracked grew their
revenue base over the last twelve months (“LTM”) ended
December 31, 2013, with median growth of 4.1% and 3.8%
for fire and safety and industrial distribution companies,
respectively. Market profitability is also improving, as the
median EBITDA margin increased to 15.2% for fire and
safety companies and 16.0% for industrial distribution
companies. As qualities that attract investment, the growth
and profitability currently demonstrated by industry
participants are expected to drive M&A activity.
Figure 8: Relative Stock Price Performance
December 31, 2012 – December 31, 2013
95%
100%
105%
110%
115%
120%
125%
130%
135%
140%
145%
Dec-12 Mar-13 Jun-13 Sep-13 Dec-13
Fire and Safety Industrial Distribution S&P 500 Index
Price as of 52 Week
Fire and Safety 12/31/13 High Low % of High
Tyco International $41.04 $41.44 $29.58 99.0%
Cintas 59.59 59.73 41.24 99.8%
Median $50.32 $50.59 $35.41 99.4%
Industrial Distribution
Grainger $255.42 $276.38 $201.49 92.4%
Fastenal 47.51 53.38 43.75 89.0%
Airgas 111.85 112.60 88.60 99.3%
MSC Industrial 80.87 87.92 71.44 92.0%
Anixter International 89.84 92.46 63.92 97.2%
Applied 49.09 53.57 40.39 91.6%
DXP 115.20 116.88 49.65 98.6%
Median $85.36 $90.19 $67.68 92.2%
Source: CapitalIQ
Figure 9: Industry Financial Analysis
As of December 31, 2013 ($ in millions)
YoY Change
Last Twelve Months (LTM) LTM Margins LTM LTM Margins
Fire and Safety Revenue Gross Profit EBIT EBITDA Gross EBIT EBITDA Revenue Gross EBIT EBITDA
Tyco International $10,647.0 $3,881.0 $955.0 $1,382.0 36.5% 9.0% 13.0% 1.2% 0.7% 11.0% 7.8%
Cintas 4,468.9 1,853.7 581.5 774.5 41.5% 13.0% 17.3% 7.0% (0.9%) 4.2% 9.0%
Median $7,557.9 $2,867.3 $768.3 $1,078.3 39.0% 11.0% 15.2% 4.1% (0.1%) 7.6% 8.4%
Industrial Distribution
Grainger $9,286.6 $4,099.6 $1,328.7 $1,484.6 44.1% 14.3% 16.0% 3.8% 0.9% 14.4% 13.8%
Fastenal 3,269.6 1,698.8 712.9 774.8 52.0% 21.8% 23.7% 4.3% 0.8% 5.9% 6.5%
Airgas 5,032.5 2,803.2 626.9 923.4 55.7% 12.5% 18.3% 2.0% 1.6% 3.7% 3.9%
MSC Industrial 2,558.7 1,168.3 395.8 451.3 45.7% 15.5% 17.6% 7.2% (0.1%) (6.0%) (1.5%)
Anixter International 6,172.4 1,394.2 329.2 360.1 22.6% 5.3% 5.8% (1.3%) 0.3% (3.5%) (3.6%)
Applied 2,457.0 688.2 171.6 198.0 28.0% 7.0% 8.1% 1.3% 1.7% (2.9%) (1.3%)
DXP 1,220.8 365.2 98.1 119.3 29.9% 8.0% 9.8% 11.3% 2.9% 8.4% 9.8%
Median $3,269.6 $1,394.2 $395.8 $451.3 44.1% 12.5% 16.0% 3.8% 0.9% 3.7% 3.9%
Source: CapitalIQ

9
Financial Analysis
Figure 10: Industry Valuations
As of December 31, 2013 ($ in millions)
Enterprise Total Debt / LTM Enterprise Value / LTM
Fire and Safety Market Cap Value EBITDA Capital Revenue EBIT EBITDA
Tyco International $19,063.5 $19,898.5 1.1x 7.1% 1.9x 20.8x 14.4x
Cintas 7,257.4 8,245.3 1.7x 15.2% 1.8x 14.2x 10.6x
Median $13,160.4 $14,071.9 1.4x 11.2% 1.9x 17.5x 12.5x
Industrial Distribution
Grainger $17,555.7 $17,647.9 0.4x 3.0% 1.9x 13.3x 11.9x
Fastenal 13,614.5 13,521.9 0.0x 0.0% 4.1x 19.0x 17.5x
Airgas 8,091.5 10,535.5 2.8x 24.0% 2.1x 16.8x 11.4x
MSC Industrial 5,058.9 5,258.7 0.7x 6.0% 2.1x 13.3x 11.7x
Anixter International 2,948.2 3,688.0 2.3x 21.8% 0.6x 11.2x 10.2x
Applied 2,031.5 1,954.6 0.0x 0.0% 0.8x 11.4x 9.9x
DXP 1,562.7 1,790.6 2.0x 13.1% 1.5x 18.2x 15.0x
Median $5,058.9 $5,258.7 0.7x 6.0% 1.9x 13.3x 11.7x
Source: CapitalIQ
Figure 11: Industry Valuation Trends
As of December 31, 2004 – 2013
Fire and Safety 12/31/2013 12/31/2012 12/31/2011 12/31/2010 12/31/2009 12/31/2008 12/31/2007 12/31/2006 12/31/2005 12/31/2004
Tyco International 14.4x 11.6x 7.3x 7.7x 7.3x 3.9x 8.2x 8.6x 8.8x 10.6x
Cintas 10.6x 8.6x 8.4x 8.5x 6.6x 6.0x 8.3x 9.9x 11.2x 12.9x
Median 12.5x 10.1x 7.9x 8.1x 6.9x 5.0x 8.3x 9.2x 10.0x 11.8x
Industrial Distribution
Grainger 11.9x 11.5x 11.5x 10.3x 8.9x 6.9x 9.2x 8.2x 10.0x 10.9x
Fastenal 17.5x 19.2x 21.8x 19.9x 16.4x 10.6x 15.1x 15.9x 20.7x 21.9x
Airgas 11.4x 10.6x 10.1x 9.9x 8.0x 6.7x 10.2x 9.2x 9.5x 9.9x
MSC Industrial 11.7x 10.2x 11.7x 15.0x 12.7x 7.2x 8.8x 11.6x 13.8x 16.9x
Anixter International 10.2x 7.5x 7.2x 9.4x 9.3x 4.4x 7.4x 8.7x 9.7x 11.8x
Applied 9.9x 8.7x 7.7x 8.8x 8.5x 5.1x 7.6x 8.2x 8.9x 10.2x
DXP 15.0x 9.7x 9.1x 12.2x 6.8x 6.4x 13.0x 10.6x 12.3x 6.5x
Median 11.7x 10.2x 10.1x 10.3x 8.9x 6.7x 9.2x 9.2x 10.0x 10.9x
Source: CapitalIQ
10
Fire and Safety M&A Trends
IV. Fire and Safety M&A
Trends Market Fragmentation
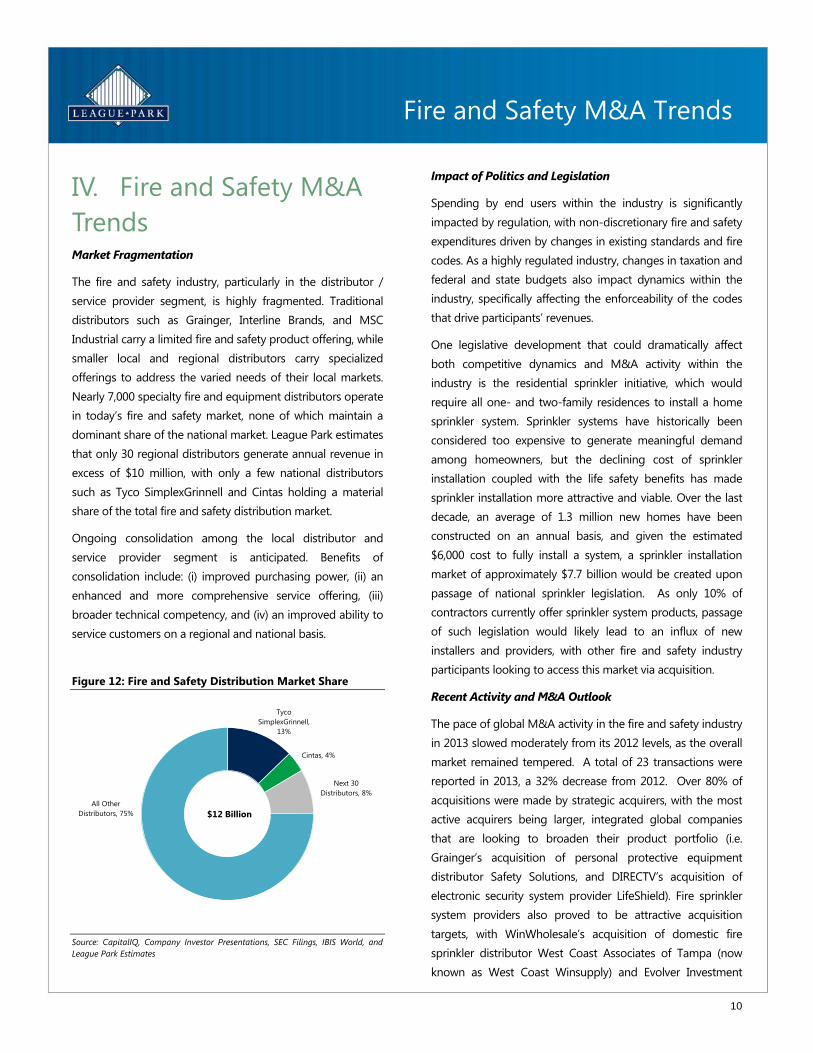
The fire and safety industry, particularly in the distributor /
service provider segment, is highly fragmented. Traditional
distributors such as Grainger, Interline Brands, and MSC
Industrial carry a limited fire and safety product offering, while
smaller local and regional distributors carry specialized
offerings to address the varied needs of their local markets.
Nearly 7,000 specialty fire and equipment distributors operate
in today’s fire and safety market, none of which maintain a
dominant share of the national market. League Park estimates
that only 30 regional distributors generate annual revenue in
excess of $10 million, with only a few national distributors
such as Tyco SimplexGrinnell and Cintas holding a material
share of the total fire and safety distribution market.
Ongoing consolidation among the local distributor and
service provider segment is anticipated. Benefits of
consolidation include: (i) improved purchasing power, (ii) an
enhanced and more comprehensive service offering, (iii)
broader technical competency, and (iv) an improved ability to
service customers on a regional and national basis.
Figure 12: Fire and Safety Distribution Market Share
Tyco
SimplexGrinnell,
13%
Cintas, 4%
Next 30
Distributors, 8%
All Other
Distributors, 75% $12 Billion
Source: CapitalIQ, Company Investor Presentations, SEC Filings, IBIS World, and
League Park Estimates
Impact of Politics and Legislation
Spending by end users within the industry is significantly
impacted by regulation, with non-discretionary fire and safety
expenditures driven by changes in existing standards and fire
codes. As a highly regulated industry, changes in taxation and
federal and state budgets also impact dynamics within the
industry, specifically affecting the enforceability of the codes
that drive participants’ revenues.
One legislative development that could dramatically affect
both competitive dynamics and M&A activity within the
industry is the residential sprinkler initiative, which would
require all one- and two-family residences to install a home
sprinkler system. Sprinkler systems have historically been
considered too expensive to generate meaningful demand
among homeowners, but the declining cost of sprinkler
installation coupled with the life safety benefits has made
sprinkler installation more attractive and viable. Over the last
decade, an average of 1.3 million new homes have been
constructed on an annual basis, and given the estimated
$6,000 cost to fully install a system, a sprinkler installation
market of approximately $7.7 billion would be created upon
passage of national sprinkler legislation. As only 10% of
contractors currently offer sprinkler system products, passage
of such legislation would likely lead to an influx of new
installers and providers, with other fire and safety industry
participants looking to access this market via acquisition.
Recent Activity and M&A Outlook
The pace of global M&A activity in the fire and safety industry
in 2013 slowed moderately from its 2012 levels, as the overall
market remained tempered. A total of 23 transactions were
reported in 2013, a 32% decrease from 2012. Over 80% of
acquisitions were made by strategic acquirers, with the most
active acquirers being larger, integrated global companies
that are looking to broaden their product portfolio (i.e.
Grainger’s acquisition of personal protective equipment
distributor Safety Solutions, and DIRECTV’s acquisition of
electronic security system provider LifeShield). Fire sprinkler
system providers also proved to be attractive acquisition
targets, with WinWholesale’s acquisition of domestic fire
sprinkler distributor West Coast Associates of Tampa (now
known as West Coast Winsupply) and Evolver Investment

11
Fire and Safety M&A Trends
Group’s acquisition of Swedish sprinkler manufacturer Mälar
Sprinkler as noteworthy developments. The majority of
companies acquired in 2013 had revenues in the $5 million to
$50 million range.
In addition to strategic acquirers, the fire and safety industry
continues to be an attractive sector for many private equity
firms, primarily due to a positive long-term outlook, degree of
fragmentation, and availability of exit opportunities. Many
private equity firms have taken a keen interest in fire and
safety companies, as well as industrial distribution companies,
due to the projected growth and earnings of industry
participants. Additional attractive characteristics of fire and
safety companies include the non-discretionary and recurring
nature of sales.
The degree of fragmentation in the fire and safety industry
also provides many opportunities for private equity firms to
acquire platform investments and then grow the business to a
larger scale through add-on acquisitions, in many cases at a
lower valuation than the initial platform (i.e. due to size and
market position). League Park believes that the local
distributor and service provider segment of the market offers
a unique investment opportunity to the private equity sphere,
with significant future consolidation anticipated.
Private equity groups typically make an investment with
several exit alternatives in mind, including a sale or public
offering. Due to the continued industry consolidation, a
financial investor in the fire and safety industry can usually
rely on a sale to a strategic buyer as a likely exit scenario. In
conjunction with a sound exit strategy, private equity firms
also have the opportunity to create value through multiple
expansion. If a private equity firm transitions its investment
from a small niche company into a dominant player, it can
realize more value, since larger companies are commonly
worth more due to greater (i) market share and pricing
power; (ii) purchasing leverage; (iii) customer, end market, and
geographic diversification; (iv) more effective national account
coverage; (v) technical competency; and (vi) perceived
management talent.
Key company specific elements that private equity investors
desire in their investments include: (i) defensible market
position with barriers to entry; (ii) limited cyclicality; (iii)
leveragable balance sheet or cash flows; (iv) limited
maintenance capital expenditure requirements; and (v) strong
and visible exit alternatives. Fire and safety companies with
the aforementioned traits will experience significant interest
from private equity investors, which will provide their owners
with a broad array of liquidity alternatives in a sale process.
12
2014 Expectations
V. 2014 Expectations
With an industry growth rate that is expected to outpace
growth in the overall economy, the fire and safety
distribution industry is expected to continue its strong
performance and perform favorably in 2014, with the
generally non-discretionary nature of end user spending
serving as a buffer for fire and safety industry participants
and investors alike. Further, given the high degree of
fragmentation in the industry, continuing consolidation is
expected, and League Park expects the industry to at least
maintain the same level of M&A activity observed in
recent years with the potential for an uptick.
Given its favorable growth profile, strong financial
performance, and fragmented nature, the fire and safety
industry has become an intriguing play for both strategic
acquirers looking to broaden their footprint or vertically
integrate and financial buyers alike. League Park believes
these dynamics will create an active market that offers
owners and operators of fire and safety companies a host
of alternatives to consider in 2014 and beyond.
13
League Park Overview
LEAGUE PARK OVERVIEW League Park Advisors, LLC (“League Park”) is a boutique investment banking firm committed to advising clients on strategies to
maximize shareholder value. League Park counsels its clients on monetizing business value through sales and recapitalizations,
enhancing corporate value through strategic acquisitions, and raising capital to fuel growth.
League Park’s senior bankers have decades of investment banking and M&A experience, completing over 300 transactions in the past
25 years. The League Park team pledges to provide sophisticated, specialized attention at every stage of the transaction process with
a unique blend of financial, strategic, and operational expertise.
Advisory Capabilities:
Sell-Side and Buy-Side Mergers and Acquisitions
Recapitalizations and Refinancings
Capital Raising
Valuations and Fairness Opinions
Strategic Alternatives
Other Financial, Strategic, and Operational Guidance
Industry Expertise:
Business Services
Consumer and Retail
Healthcare
Technology
Industrials
Automotive
Building Products and Construction
Distribution
Industrial and Specialty Gases
Industrial Services
Metals
Paper, Print, and Packaging
Specialty Chemicals
For more information, please contact:
Industrials:
Wayne A. Twardokus
(216) 455-9989
Matt Figas
(216) 455-1264
Sean Dorsey
(216) 455-9990
1100 Superior Avenue East
Suite 1650
Cleveland, Ohio 44114
(216) 455-9985
or visit us at: www.leaguepark.com

14
Sources
Buildings Energy Data Book
CapitalIQ
Commercial Building Inventory
Company Investor Presentations
Fire Apparatus Manufacturers Association
Fire Equipment Manufacturers Association
FMI Corporation
The Freedonia Group
IBIS World
International Code Council
International Monetary Fund
Modern Distribution Management
National Association of Fire Equipment Distributors
National Fire Protection Association
National Fire Sprinkler Association
Safety Equipment Distributors Association
SEC Filings
SSI Installation Reports
U.S. Census Bureau
U.S. Fire Administration
Disclosure
The preceding report has been prepared by League Park. This report is an overview
and analysis of the industry and consolidation trends and is not intended to provide
investment recommendations on any specific industry or company. It is not a research
report, as such term is defined by applicable law and regulations. It is not to be
construed as an offer to buy or sell or a solicitation of an offer to buy or sell any
financial instruments or to participate in any particular trading strategy. In addition,
this report is distributed with the understanding that the publisher and distributor are
not rendering legal, accounting, financial or other advice and assume no liability in
connection with its use. This report does not rate or recommend securities of
individual companies, nor does it contain sufficient information upon which to make
an investment decision. Any projections, estimates, or other forward looking
statements contained in this report involve numerous and significant subjective
assumptions and are subject to risks, contingencies, and uncertainties that are outside
of our control, which could and likely will cause actual results to differ materially.
These materials are based solely on information contained in publicly available
documents and certain other information provided to League Park, and League Park
has not independently attempted to investigate or to verify such publicly available
information, or other information provided to League Park and included herein or
otherwise used. League Park has relied, without independent investigation, upon the
accuracy, completeness and reasonableness of such publicly available information and
other information provided to League Park. These materials are intended for your
benefit and use and many not be reproduced, disseminated, quoted or referred to, in
whole or in part, or used for any other purpose, without the prior written consent of
League Park. Nothing herein shall constitute a recommendation or opinion to buy or
sell any security of any publicly traded entity mentioned in this document.