finlight research - market perspectives - nov 2015
TRANSCRIPT

Market Perspectives
November 2015
Nov. 6th, 2015
www.finlightresearch.com
A shooting star… Make a wish…

“People talk about a bubble in stocks or biotech
or a bubble in bonds-if there's a bubble right now
it's a bubble in the confidence of central bankers”
- Gary Flam (Bel Air Investment Advisors)
2FinLight Research | www.finlightresearch.com

Executive Summary: Global Asset Allocation
� Global markets posted sharp gains in October, recovering most of
September's losses, without any significant news on the macro front
� Nevertheless, macro risks are still rising… Deflation forces are real…
Concerns remain over Chinese growth, HY credit and falling commodity
prices. Markets seem unprepared for interest rate hikes.
� The rally on the S&P500 was impressive, but a massive top forming could not
be excluded. Breadth on the rally has been horribly weak.
� High Yield debt and Small Caps underperformance raises yellow flags
on the sustainability of the bullish trend in equities.
� Thus, we remain cautious on risky assets and expect lower asset returns and
higher volatility to make the essence of next year.
� We stick with our views on Dollar (Bullish), commodities / specially metals
(Bearish) and EM (Bearish) as we see no fundamental support for a reversal
� A slowdown in global economic growth seems underway. DMs are
clearly not insolated from EM turbulence. Channels of contagion from China
and other EMs to DMs are numerous, but still underestimated.
� Old-school as we are, we expect all this Central Banks money printing to
ultimately end in tears
� We reiterate our view: A perfect storm is building… It combines historically
overvalued stocks with stretched government bonds and corporate credits.
Unlike previous storms (2000, 2008), investors would be left with almost
no place to hide
� We summarize our views as follows �
3FinLight Research | www.finlightresearch.com

MACRO VIEW
� The Good
� The US jobs data was considerably stronger than expected. The unemployment rate slipped to 5.0% while the participation rate was unchanged at 62.4%
� ISM service sector business activity index is at the high end of its range.� Euro area October final manufacturing PMIs revised up on resilient demand. Flash composite
PMI for October surprised strongly to the upside, as well� The breadth of the earnings recovery is improving in Europe
� The Bad
� US corporate earnings may post another quarterly decline� China’s manufacturing PMIs for October remained in contraction� German factory orders and industrial output unexpectedly declined in September. This is the
first time since 2011 that German orders have decreased for three consecutive months
� The Ugly
� Main systemic risk resides in China: The Chinese debt burden is extremely high (Mckinseystated that between 2007 and 2014, debt to GDP ratios have soared from 158% to 282%) and the credit cycle is probably starting to turn. We are probably in the early stages of a bursting credit bubble.
� The fixed-income / credit edifice is highly vulnerable to China’s need to liquidate Treasury reserves in order to maintain its currency peg, as capital outflows increase and market widely expects further devaluation in the USD-CNY
4FinLight Research | www.finlightresearch.com
5FinLight Research | www.finlightresearch.com
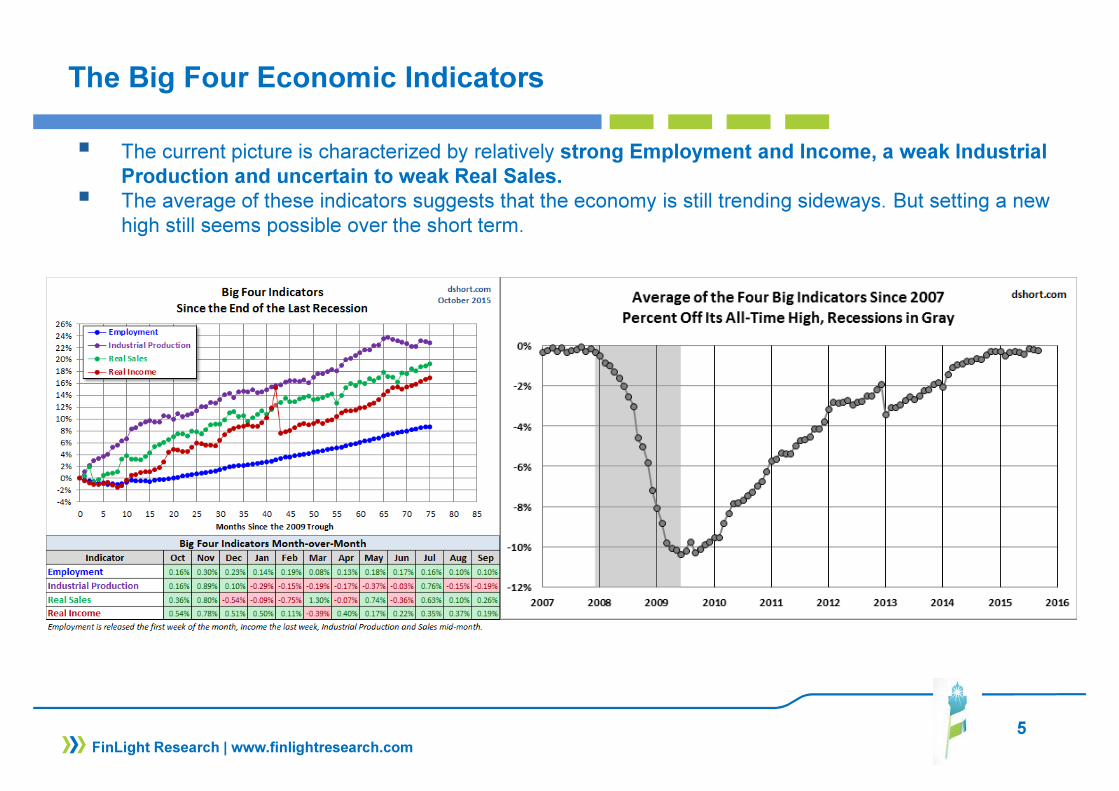
The Big Four Economic Indicators
� The current picture is characterized by relatively strong Employment and Income, a weak Industrial
Production and uncertain to weak Real Sales.
� The average of these indicators suggests that the economy is still trending sideways. But setting a new high still seems possible over the short term.

6FinLight Research | www.finlightresearch.com
ISM Manufacturing
� The manufacturing ISM hardly hangs above the 50 level
� But the Philly Fed survey is launching a warning signal on it… ISM Manufacturing is probably
heading to the mid-40s.
� The YoY change in new orders (lagged by 6 months) is also flashing yellow light.

7FinLight Research | www.finlightresearch.com
Real PCE & DPI
� Since June 2012, real DPI per capita is up less than 3% flat!
� This income stagnation the sluggish picture of nominal/real spending…

8FinLight Research | www.finlightresearch.com
Household Income
� According to a recent ECRI study, and since its peak 15 years ago, the real median household income has declined by 11%, and even by 12% for households headed by the most educated individuals (with Doctorate Degree)

9FinLight Research | www.finlightresearch.com
Household Income
� Food stamp participation in the U.S hardly gives a rosy picture of the current recovery…
� "Food stamp participation is still very high for what everyone is calling a ‘recovery.'" he said. "Contrary to some criticism, this is a reasonably well administered program, and the fact that
participation remains so high
this far into an economic
expansion is another way of
showing how uneven the
recovery has been.“(Nicholas Colas - Convergex chief market strategist)

10FinLight Research | www.finlightresearch.com
Consumer Sentiment
� Both the Conference Board's consumer confidence index and the Michigan Sentiment Surveyfell…
11FinLight Research | www.finlightresearch.com
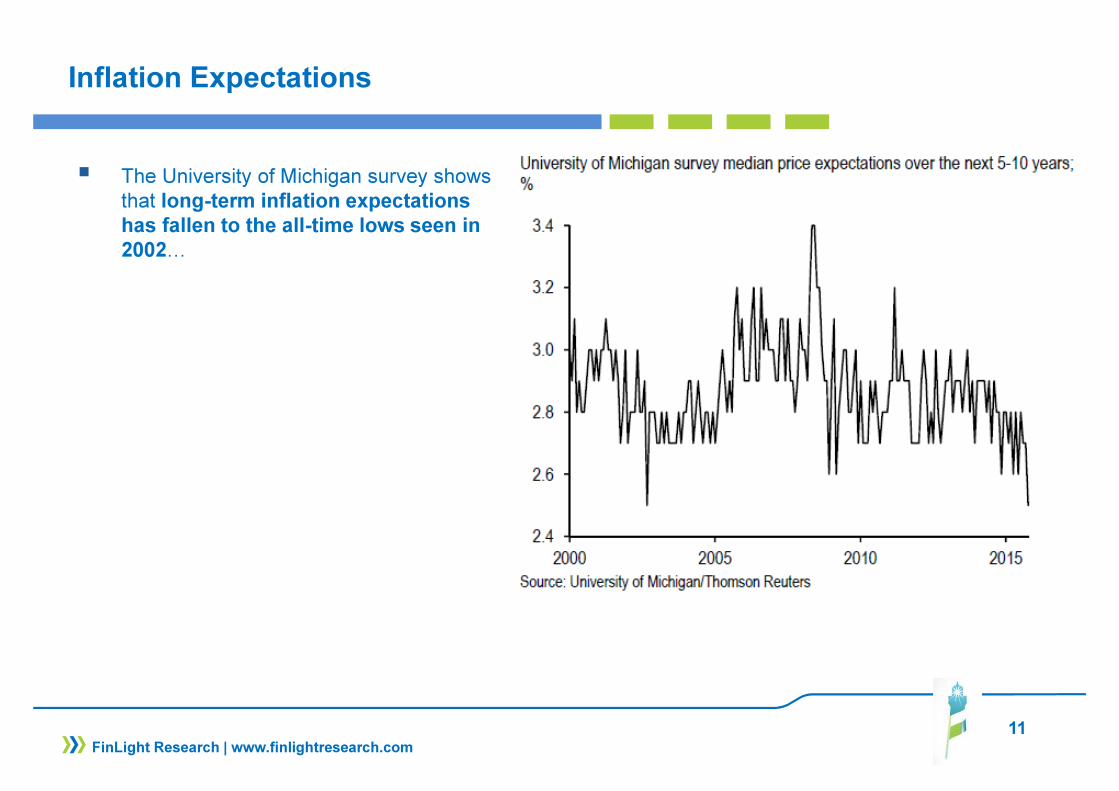
Inflation Expectations
� The University of Michigan survey shows that long-term inflation expectations
has fallen to the all-time lows seen in
2002…

12FinLight Research | www.finlightresearch.com
Eurozone Private Sector Lending
� The ECB’s balance sheet is growing again. But we still see
no evidence of any
improvement in private sector
lending
� ECB QE is only boosting asset prices, but doing very little for growth.
� The only “real economy” advantage of QE is probably its effect in engineering EUR weakness (to import inflation and improve competitiveness), but the Eurozone is not alone in the forex war arena
13FinLight Research | www.finlightresearch.com
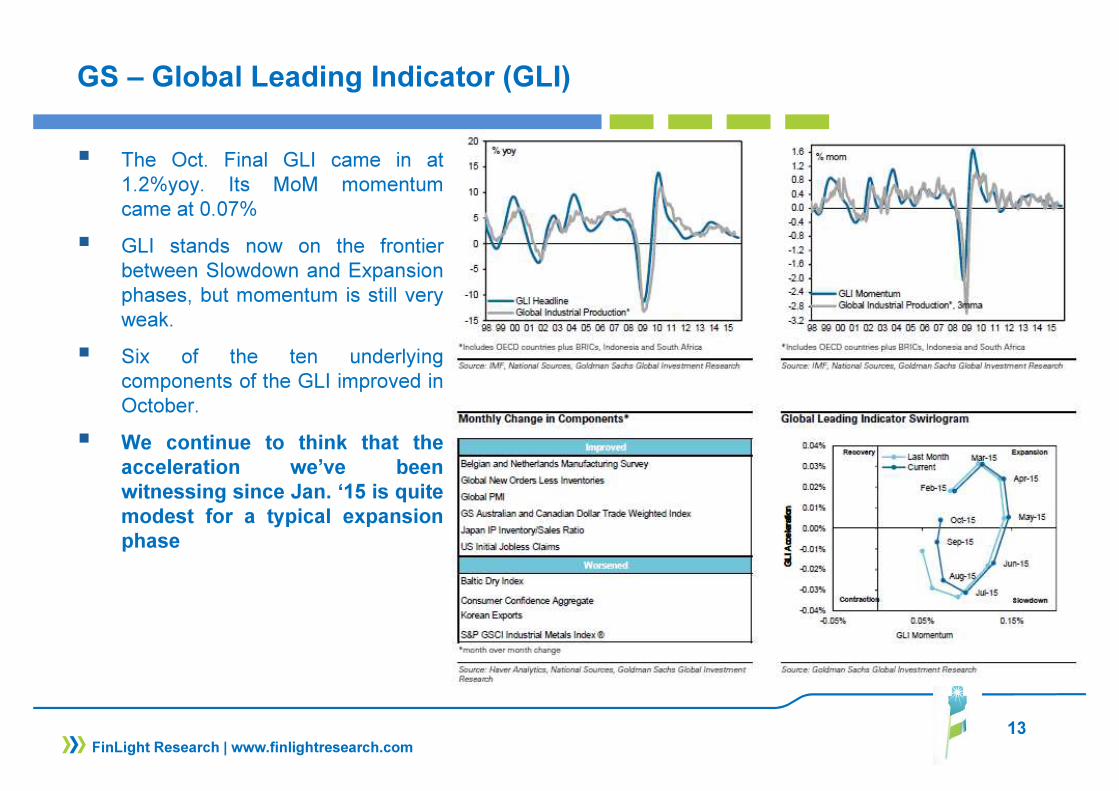
GS – Global Leading Indicator (GLI)
� The Oct. Final GLI came in at1.2%yoy. Its MoM momentumcame at 0.07%
� GLI stands now on the frontierbetween Slowdown and Expansionphases, but momentum is still veryweak.
� Six of the ten underlyingcomponents of the GLI improved inOctober.
� We continue to think that the
acceleration we’ve been
witnessing since Jan. ‘15 is quite
modest for a typical expansion
phase

14FinLight Research | www.finlightresearch.com
EQUITY
� We think that the equity bull market is aging, and has only modest further gains from here, probably with high volatility.
� We thought that this summer steep selloff was enough to definitely damage the bullish trend. We were
proved dead wrong… The S&P 500 Index has now recovered all of the ground it lost during the summer crash without any significant news on the macro front.
� The S&P500 rally was impressive and the uptrend across the lows since Oct. ‘11 was reintegrated. However, one cannot discount the possibility of a massive top forming around 2135 (80% chance), as:� Profit margins are likely plateauing in the US market. � Earnings expectations are vulnerable to fears about US/global economic growth. S&P500 earnings
for 2015 were estimated at 132.3 in August 2014. That estimate is now at 98.19…� Fed tightening, poor earnings and higher wages are not good news either.� Transports, Small Caps and High Yield (which trends often foreshadow stock market developments)
are seriously underperforming� Recent data shows more evidence of lower productivity, lower potential GDP growth and (later)
higher inflation risk. � This is a bad scenario for stocks
� Our alterative scenario from here (20% chance) : The S&P500 breaks the 2135-2140 resistance, opening the way to 2225. This scenario is supported by the fact that the index is above all its key moving averages and that seasonality is positive

15FinLight Research | www.finlightresearch.com
EQUITY
� Whatever the Fed’s decision is, stocks would suffer. Normalizing rates would reduce the incentive to escape from cash, and drive near-term volatility higher. Keeping rates at zero would confirm fears about real growth and deflation risk.
� Stocks seem more vulnerable than ever to any external choc. The Federal Reserve has waited so long to raise rates, pushing valuations and profit margins higher than usual at the beginning of rate increase cycles.
� Bottom line :
� We stay Neutral as long as the S&P500 remains in the 2020 – 2140 range. We may revise our positioning to OW (to UW) if a break to the upside (to the downside) occurs.
� We remain Neutral on Europe and Japan vs. US despite the policy divergence between the Fed and the ECB/BoJ. According to the 12 month forward P/E, Europe is trading at 15 year
highs, relative to the US. Weak demand from China is expected to continue to weigh on Japan's production
� We remain UW in US small caps vs large caps.
� We remain UW EMs vs DMs, as negative spillovers from China will likely have a stronger impact on other EMs

16FinLight Research | www.finlightresearch.com
US Earnings
� For Q4 2015, 39 companies have issued negative EPS guidance and 17 companies have issued positive EPS guidance
� The 12-month forward P/E ratio for the S&P 500 now stands at 16.5, well above historical averages: 5-year (14.0), 10-year (14.1)
� FactSet's data shows a current forecast of a 2.2%
decline (YoY) for Q3-2015 earnings and a 2.9%
decline in revenues.
� The actual earnings decline for the quarter would be smaller, but we expect it to remain negative. If it’s the case, it will mark the first time the index has seen 2 consecutive quarters of year-over-year declines since Q2/Q3-2009.
� On Sep 30, the estimated earnings decline for Q3 2015 was -5.5%.
� If the Energy sector is excluded, the earnings growth rate for the S&P 500 would jump to 5.0%
� No earnings/revenue growth is projected before
Q1-2016
17FinLight Research | www.finlightresearch.com
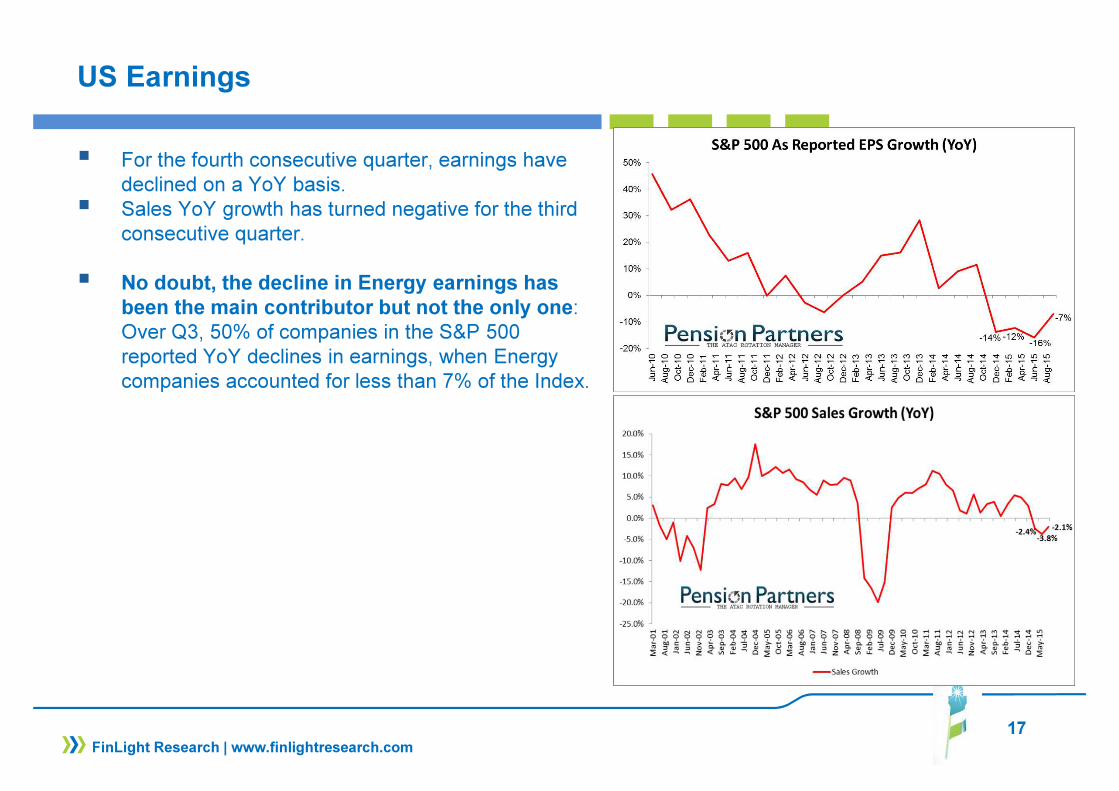
US Earnings
� For the fourth consecutive quarter, earnings have declined on a YoY basis.
� Sales YoY growth has turned negative for the third consecutive quarter.
� No doubt, the decline in Energy earnings has
been the main contributor but not the only one: Over Q3, 50% of companies in the S&P 500 reported YoY declines in earnings, when Energy companies accounted for less than 7% of the Index.

18FinLight Research | www.finlightresearch.com
European Earnings
� We see a loss of momentum in Q3 earnings, compared to Q1 and Q2-2015
� Of the 227 companies that have reported, 62% have beaten or are in line with expectations on sales, and 64% on EPS.
� Since Jan 2015, consensus forecasts for 2015 EPS growth for Europe have come down from 9% to 0%
� This downgrade has primarily been driven by Energy and Materials
� But Eurozone EPS growth is still projected at 11%
Source: Barclays

19FinLight Research | www.finlightresearch.com
Corporate Profit Margins
� Citigroup uses NFIB survey of small businesses as a leading indicator for profit margins.
� The “Firms Planning to Raise Prices – Firms Planning to Raise Worker Compensation” difference suggests that margins will start to come down next year

20FinLight Research | www.finlightresearch.com
S&P500 – A Long-Term Perspective
� Tobin’s Q Ratio is the ratio of the market value to the replacement cost of all its companies
� Like the other long-term
valuation indicators we track,
the Q Ratio eases a bit but
still points to an overvalued
market

21FinLight Research | www.finlightresearch.com
S&P500 – A Medium-Term Perspective
� The recent correction and market technicals
are similar to those seen around October
2011
� Like then, MACD and stochastic indicators are now in overbought territory.
� But the big difference between 2011 and 2015is the earnings YoY growth: above 10% in 2011 and negative by now.
Source: HORAN Capital Advisors
22FinLight Research | www.finlightresearch.com
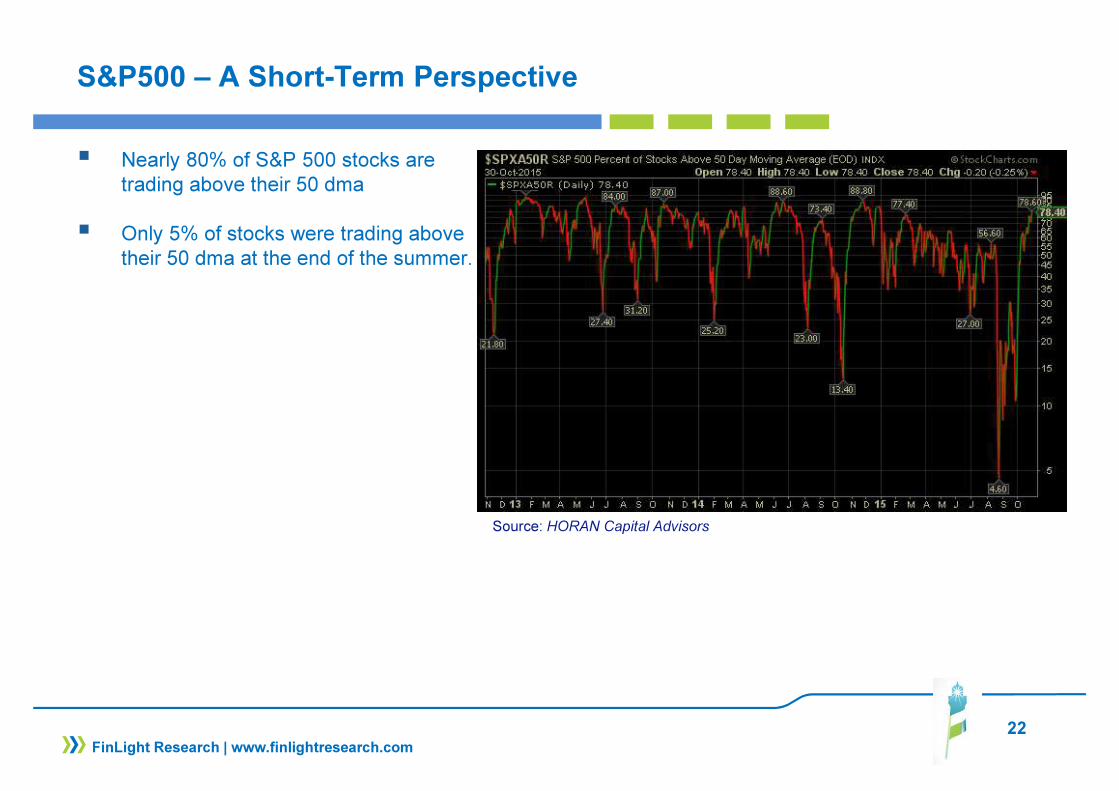
S&P500 – A Short-Term Perspective
� Nearly 80% of S&P 500 stocks are trading above their 50 dma
� Only 5% of stocks were trading above their 50 dma at the end of the summer.
Source: HORAN Capital Advisors

23FinLight Research | www.finlightresearch.com
S&P500 – A Short-Term Perspective
� The Equal-weighted S&P 500 Index – S&P500 ratio is another way to track the market breadth
� According to this ratio, the S&P 500 appears to
be led by the larger companies, when some of the smaller ones are lagging
� The point is confirmed by the limited rebound of the Russell 2000 Small Cap Index above its Sep. lows.

24FinLight Research | www.finlightresearch.com
S&P500 – A Tech. Perspective
� As specified in our Oct. Report, we
moved from UW to Neutral stocks as
the uptrend across the lows since Oct.
‘11 (around 2000) and our confort level
(~2050) were broken to the upside.
� We stay Neutral as long as the S&P500
remains in the 2020 – 2140 range.
� Breaking the range on the upside should open the way to 2225. We may reconsider our positioning to OW if such a break occurs.
� Failure to break 2140 and a decline below 2020 would warn that a more substantial correction could be underway (target ~1870). S&P 500's break under the 200-dma (~2060) would mark the beginning of such a pullback.
25FinLight Research | www.finlightresearch.com
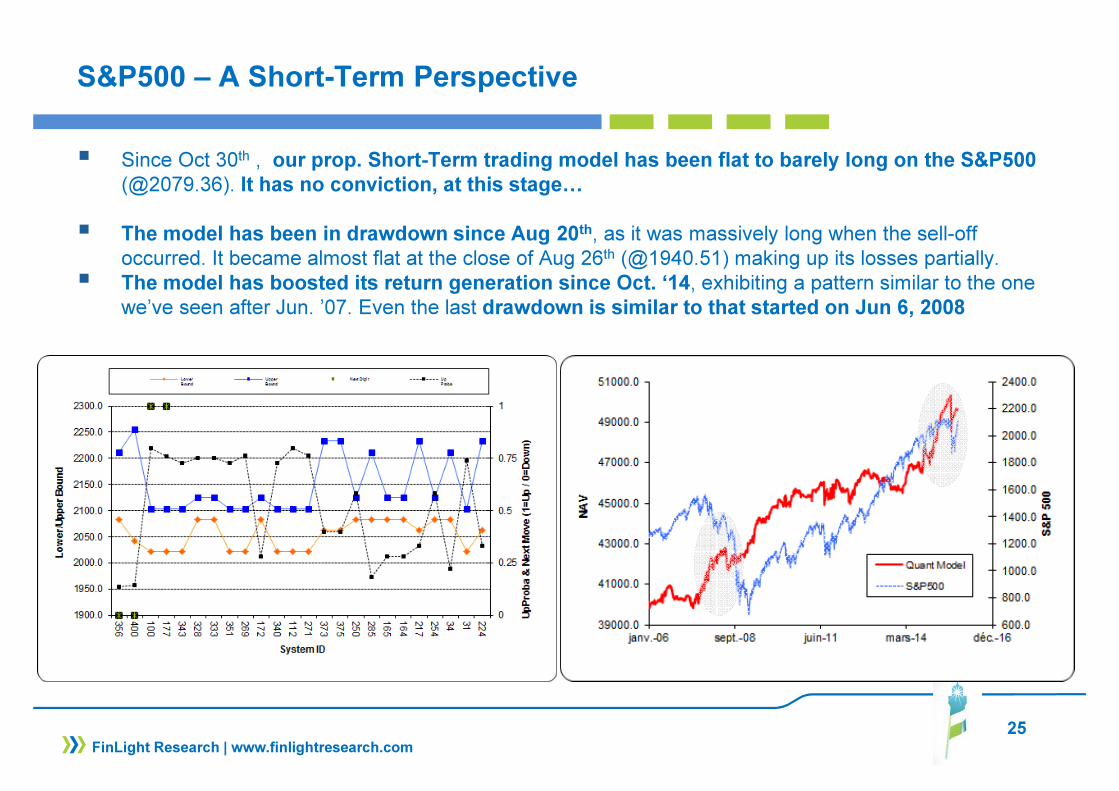
S&P500 – A Short-Term Perspective
� Since Oct 30th , our prop. Short-Term trading model has been flat to barely long on the S&P500
(@2079.36). It has no conviction, at this stage…
� The model has been in drawdown since Aug 20th, as it was massively long when the sell-off occurred. It became almost flat at the close of Aug 26th (@1940.51) making up its losses partially.
� The model has boosted its return generation since Oct. ‘14, exhibiting a pattern similar to the one we’ve seen after Jun. ’07. Even the last drawdown is similar to that started on Jun 6, 2008

26
FIXED INCOME & CREDIT
� Markets moved the pricing of the first Fed hike from June 2016 to April 2016 . We continue to believe that the Fed will hike rates in December.
� Inflationary signs should be watched closely as they will foreshadow a steepening decline in Govies.
� We expect negative total returns on USTs. We still look for the bear market on USTs to resume.� We remain Neutral on USTs as far as the 10-year yield stays below 2.35. We wait for a material
break either above 2.35 or below 2.00 to change our positioning� We think that the risk is still biased to the upside on yields. Our ultimate target on 10y yields stands
at 2.75 by H1-2016
� On German Bund, we remain Neutral. as long as the 10-year yield stays above the 0.45 – 0.50 area.� We will switch to UW again as the 10-year yield breaks above 0.80-0.90 or below 0.45
� We remain Neutral HICP Inflation and move from UW to Neutral on TIPS breakevens, as we expect breakevens to trade sideways over the near term
FinLight Research | www.finlightresearch.com
27
FIXED INCOME & CREDIT
� Like for equities, October was a wonderful month for credit. HY experienced one of the sharpest rallies of the past 4 years. Credit spreads drifted tighter as the Chinese hard landing fears and turmoil in EM eased.
� Higher US Treasury yields should be supportive of IG spreads, but large bond supply (due in part to large M&A activity) would be negative. Over the short term, we expect yields effect to dominate.
� At this stage, bond supply fears are weighing on the CDS-Bond basis, maintaining it in negativeterritories.
� We remain UW on corporate credit, due to valuation, to rising volatility, to position within the credit cycle and given the weak total return forecast
� We still prefer IG over HY on a risk-adjusted basis as we expect volatility on spreads to remain elevated and we believe IG corporates better positioned to absorb the impact of rising rates
� We feel concerned about the credit market liquidity as the rate of turnover in corporate bonds has steadily declined since 2009, despite the huge inflows
� We feel cautious about EUR HY despite the prospects of further easing by the ECB. Next QE should drive a rally in European credit over the near term, but long positioning is getting crowded and liquidity scarce
FinLight Research | www.finlightresearch.com

28
FIXED INCOME & CREDIT
� Within the credit pocket, we remain Neutral on USD vs. EUR HY spreads, but we prefer USD on a
total return basis, despite its higher beta to energy sector
� We still prefer US IG over Eurozone.IG, as we think that more attractive spread valuations and higher carry should fuel a stronger bid for US credit.
� Bottom line : UW Govies, Neutral US vs Eurozone Govies, remain long flatteners on the US yield curve and short duration in 2y USTs, UW credit, Neutral Eurozone vs US HY credit, UW Eurozone vs US IG credit, Neutral TIPS and Neutral HICP Inflation, UW High Yield vs High Grade, Neutral on EM sovereigns
FinLight Research | www.finlightresearch.com

29
US Govies – 10y UST
� Tactically, we’ve remained
Neutral on 10-year USTs, waitingfor a clean break either above 2.35or below 2.00 to change ourpositioning
� We think that the risk is still
biased to the upside on yields.
� In order to confirm our bearishview, a clean break above 2.35-2.40 is required. It will open theway towards 2.58 and then 2.75
FinLight Research | www.finlightresearch.com

30
Credit – HI vs IG
� Over October, the HY segmentoutperformed IG in both Europe and theUS
� However, we still prefer IG over HY on
a risk-adjusted basis as we expectvolatility on spreads to persist.
FinLight Research | www.finlightresearch.com

31
Credit – US vs Europe
� Over October, and thanks to Draghi’s dovish rhetoric , iTraxx Main has outperformed CDX.IG. We
still prefer US IG over Eurozone.IG, as we think that more attractive spread valuations and highercarry should fuel a stronger bid for US credit.
� Within the HY pocket, iTraxx Xover and CDX.HY continued to trade inline We remain Neutral on
USD vs. EUR HY spreads, but we prefer USD on a total return basis, despite its higher beta to
energy sector
FinLight Research | www.finlightresearch.com

32
Euro Credit Activity
� Rating actions in € credit are on a
positive trend. Deleveraging and betterearnings are probably the reasonbehind…
� For the first time since 2005, upgradeshave surpassed downgrades for both HYand IG issuers on a moving 12-monthbasis.
FinLight Research | www.finlightresearch.com

33
Credit – Liquidity Issues?
� We feel concerned about the credit
market liquidity as the rate of turnover in
corporate bonds has steadily declined
since 2009, despite the huge inflows($3tn)received by U.S. credit mutual funds fuelinggrowth in the IG and HY credit markets ($7tnis now outstanding)
FinLight Research | www.finlightresearch.com
� Massive retail outflows would have beenable to be the catalyzer of liquidity issues…
� Fortunately, ST rolling total returns in IG andHY are back to positive territory, reducingconcerns of retail outflows at this stage.

34
US Credit
� It’s worth noting that, with the last rally,investors accumulated multi-year highlong risk positions in CDX.IG
� They are probably looking to ride the
ascending wave and minimize, at the
same time, the liquidity risk.
FinLight Research | www.finlightresearch.com

35
US Credit – CDS Basis
� Despite the rally, IG bonds are still
trading wide to CDS : The CDS-Bondbasis has stayed around -50bps for thelast 2 months. This is a post crisis highthat could be justified by heavy bond
supply, liquidity search (by protection
sellers / risk taker) and narrowing
swap spreads
� CDX.IG is trading around 80bp, while the5 year duration-weighted average bondspread of the issuers in the CDX.IGportfolio trades 75 bps wider
� Higher UST yields could induce an IGspread tightening and help bonds tooutperform again…
� HY bonds are also trading wide to CDS.The basis has narrowed since thesummer (likely because of significantinflows into HY funds) but still standsaround -70bp.
FinLight Research | www.finlightresearch.com

36
EXCHANGE RATES
� The dollar rally is not over. We reiterate our bullish view on USD over the medium-term and expect a
rival of the appreciation cycle of the '90s
� Historically, USD cycles have been persistent, lasting 5-6 years in the appreciation phase. We thus see further medium term USD gains against the major crosses (especially EUR and JPY) and expect a cyclical low in EUR/USD somewhere in mid-2016 (probably before the ECB tapering)
� September Fed’s inaction was unable to damage the uptrend on the US dollar. The October FOMC statement was more hawkish than expected and helped the US dollar resuming its bullish trend.
� The DXY index has finally broken above its downtrend from Mar. ‘15 in an impulsive move. Our
next target ~100.
� Our positioning on USD is driven by (almost) the same trading rules:� Our previous target of 1.08 was reached and broken to the downside.� From here, we keep our UW stance as long as the 1.0820 resistance is preserved. We’ll
move Neutral above 1.0820, and OW as soon as the uptrend is reintegrated.� The final evidence that the long-term downtrend has been resumed will be provided by a clean
break below 1.0730
FinLight Research | www.finlightresearch.com
37
EXCHANGE RATES
� On USD-JPY, we remain Neutral for the moment, as the spot failed to hold a break above 124-125 resistance. � We think the pair has already reached the peak of this year and is likely to see a downward
trend in 2016 (target ~115 – 113). Main reason for that: increasing current account surplus and expected unwinds of foreign assets by Japanese investors.
� We remain neutral as far as USD-JPY in the consolidation range (115-125). Below, we move UW. Above, we switch to OW.
� We remain UW EM and Commodity FX, given the Fed’s hawkish statement last week
FinLight Research | www.finlightresearch.com

38
USD Speculative Positioning
� The latest IMM data (Oct 20 to 27, doesn’t cover the last FOMC meeting) show that speculatorsconsiderably increased :� their bearish EUR positions after Draghi’s dovish rhetoric (October ECB meeting)� Their bearish JPY bets as they expect additional easing from the BoJ
FinLight Research | www.finlightresearch.com

39
USD Speculative Positioning
� On an aggregate level, bullish USD
positioning increased again to
revisit the extreme long territory
(above 84 percentile)
FinLight Research | www.finlightresearch.com
40
US Dollar Index
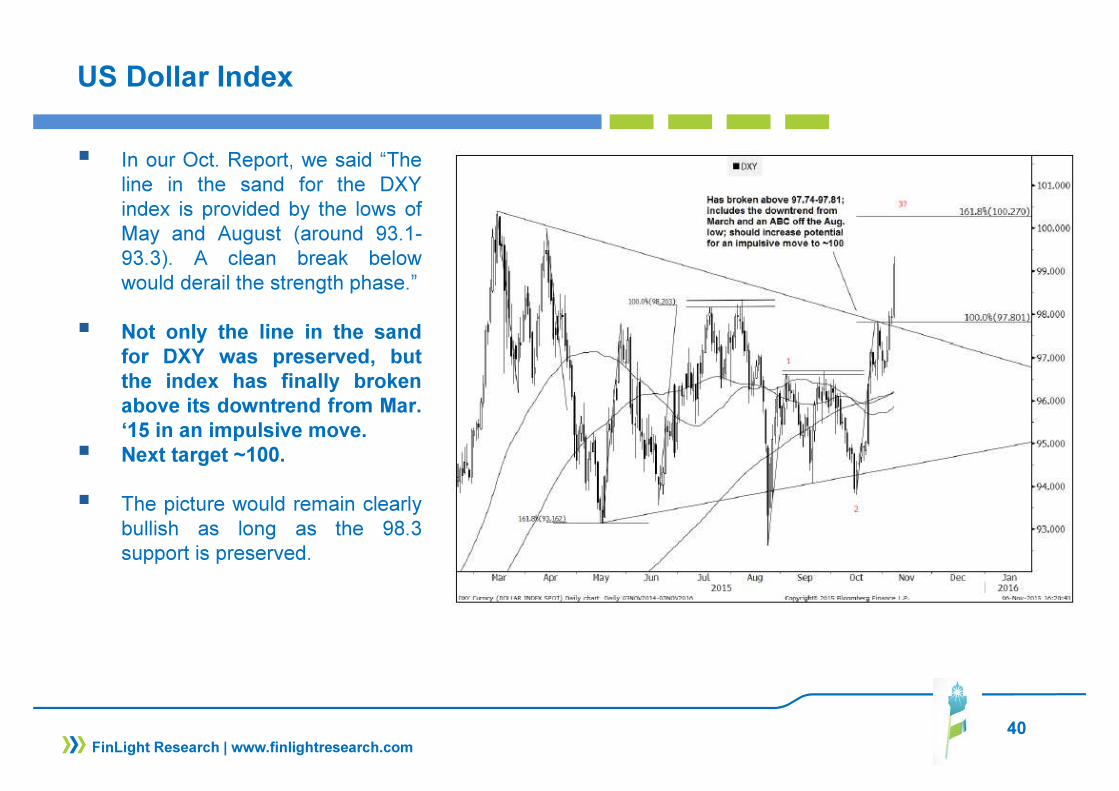
� In our Oct. Report, we said “Theline in the sand for the DXYindex is provided by the lows ofMay and August (around 93.1-93.3). A clean break belowwould derail the strength phase.”
� Not only the line in the sand
for DXY was preserved, but
the index has finally broken
above its downtrend from Mar.
‘15 in an impulsive move.
� Next target ~100.
� The picture would remain clearlybullish as long as the 98.3support is preserved.
FinLight Research | www.finlightresearch.com

41
EUR-USD
� As said in our previous report,we’ve moved to UW when theEUR-USD broke below 1.1130with 1.08 as a target.
� Our target was finally reached.
� EUR-USD broke its uptrend fromMarch in an impulsive move.Next target = 1.0480-1.520
� From here, we keep our UW
stance as long as the 1.0820
resistance is preserved.
� We’ll move Neutral above1.0820, and OW as soon as theuptrend is reintegrated.
� The final evidence that the
long-term downtrend has been
resumed will be provided by a
clean break below 1.0730
FinLight Research | www.finlightresearch.com
42
COMMODITY
� Commodities are not out of the woods yet. Fed’s hawkish bias has fueled the USD and draggeddown commodity prices further.
� Prospects for commodities are looking shaky. Commodity weaknesses (supply glut in oil, slowinggrowth in China, precious metals loosing their luster as a safe heaven, US dollar strengthening…) arelikely to continue. We don’t see any sustainable recovery without a pick-up in global growth.
� We still think that it is still too early to get in the “reflation trade” of a weaker dollar and highercommodity prices
� The expected Fed rate hike would put more pressure on the asset class as higher interest rates put ahigher cost on holding commodities
� The next leg up in the US$ will put more pressure on commodity prices
� We remain neutral-to-bearish across all complexes in the near term. To mid-2016, returnforecasts are negative for commodities as a whole.
� We remain UW commodities. We continue, however, to like owning the GSCI index, and think thatcommodities hold value as cross-asset portfolio diversifiers and as an inflation hedge.
FinLight Research | www.finlightresearch.com
43
COMMODITY
Bottom Line :
� Base Metals: Base metals don’t appear to be stabilizing yet. The main reasons (growth disappointmentsin China and broader EM) behind the bear trend we’ve seen since 2011 are still alive… We remain
Neutral on base metals given the current weaker demand environment.� On the MT, we do not like holding Copper (our target of 5000 has been reached), nor iron ore,
as it appears highly overvalued relative to the dollar, the global growth and the Chinese demand.We see more weakness with 10% expected downside in iron ore and 5% in copper (~4800)
� There remains ample excess capacity in the industrial metals world. Producers should cut existingproduction and future projects before we can expect a sustainable reversal in prices.
� We expect base metals to trade lower for longer in order to match supply with demand.
� Agriculture: GSCI Agri was flat in October. We remain Neutral because of excess supply. Perfectgrowing conditions in the US resulted in the biggest corn/soybean crop yields and harvests in manyyears� However, we see a limited downside to grain prices from here when upside seems very interesting� It’s worth noting that hedge funds cut their bullish bets on agricultural commodities as a whole,
despite a substantial short-covering in Chicago wheat. The move was accelerated by the selloff insoymeal market, and the World Health Organization report linking processed meat to cancer(weighing on hogs)
FinLight Research | www.finlightresearch.com
44
COMMODITY
� Energy: We remain of the view that the oil market is oversupplied, still think it is too early to expect
major upside for the price and that the risks remain substantially skewed to the downside.Fundamentals are also negative from both a macro and micro economic perspective. The price warbetween the lower-cost producers (Saudi Arabia), and the higher-cost producers (shale) should last for awhile.
� The market seems to have met an interim low point at around 42. But we think there is still potentialfor a last leg lower.
� Tactically, we’ve decided since September to move to OW and to trade the 42-52 range
� We will move to Neutral again if the WTI goes above 56.5 or below 42, and to OW if the it breaksabove 63
� We will move to UW if the August low (~38) is breached
FinLight Research | www.finlightresearch.com

45
COMMODITY
� Precious Metals: FOMC statement was more hawkish than expected, and gold prices retraced sharply. From here, we expect a rebound on the important support area around 1070, but we still think that Gold (like Silver) are still due for a final leg down (over a 6month horizon). Our ultimate target remains at 980-1000
� We change nothing to our view on precious metals. The stimulus provided by the ECB & BoJ isalready factored in gold prices. Precious metals are vulnerable to higher US real yields,
stronger dollar and weaker gold flows to Asia
� Gold is now mainly trading on Fed’s action and its subsequent impacts on US dollar, real yields andcommodity prices.
� According to our positioning rules, we decided to move Neutral on Gold as the 1120-1110 pivot
area was broken to the downside. We will wait for 1050 to progressively start accumulating Gold.
� We expect the final bottoming to occur mid-2016 with a top formation on US dollar and greatercertainty around the Fed’s rate policy.
FinLight Research | www.finlightresearch.com
46
Commos – Any QE Effect?
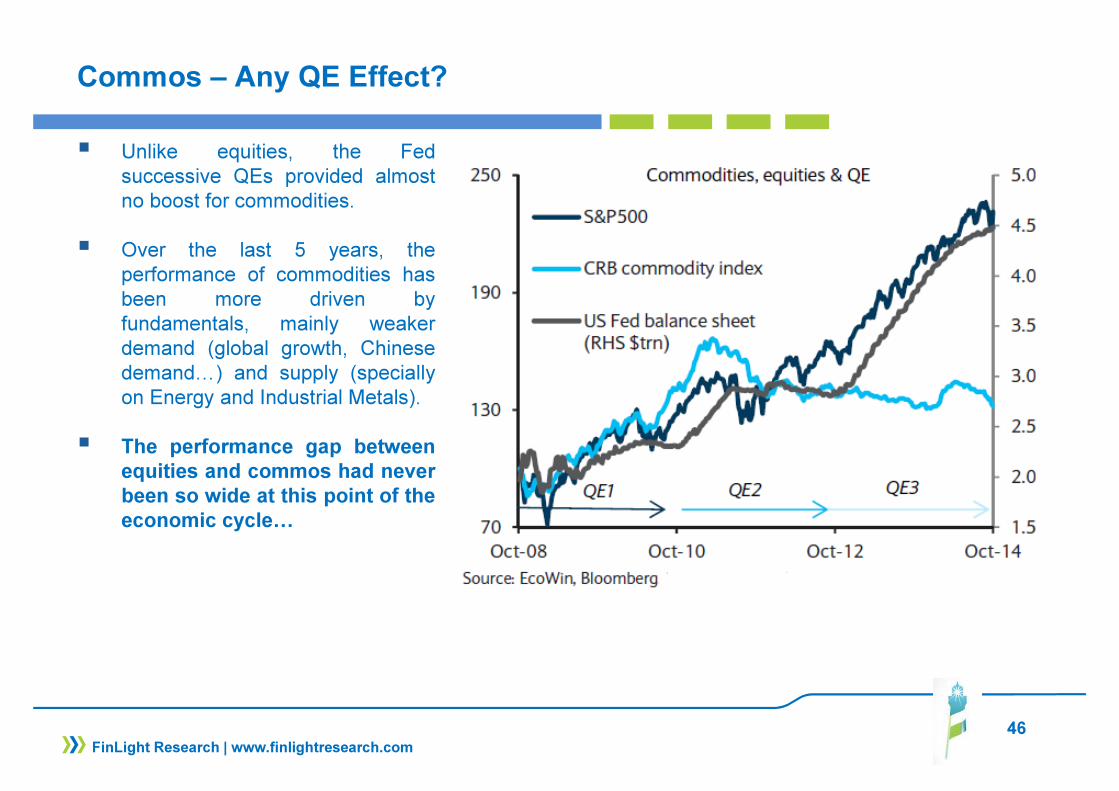
� Unlike equities, the Fedsuccessive QEs provided almostno boost for commodities.
� Over the last 5 years, theperformance of commodities hasbeen more driven byfundamentals, mainly weakerdemand (global growth, Chinesedemand…) and supply (speciallyon Energy and Industrial Metals).
� The performance gap between
equities and commos had never
been so wide at this point of the
economic cycle…
FinLight Research | www.finlightresearch.com

47
Precious Metals
� Net managed money longpositioning in gold has increasedsince mid-Sep. 2015 (and theFed’s “No Go” decision) to reachlevels last seen at the beginning ofthe year.
� The same behavior is seen onSilver.
� Precious metals remain clearly
influenced by the projected
timing for the first Fed
tightening.
FinLight Research | www.finlightresearch.com

48
Gold & Real Yields
� Gold continues to trade inline with 5-year TIPS real yields. Higher real yields are driving Gold lower.
FinLight Research | www.finlightresearch.com
49
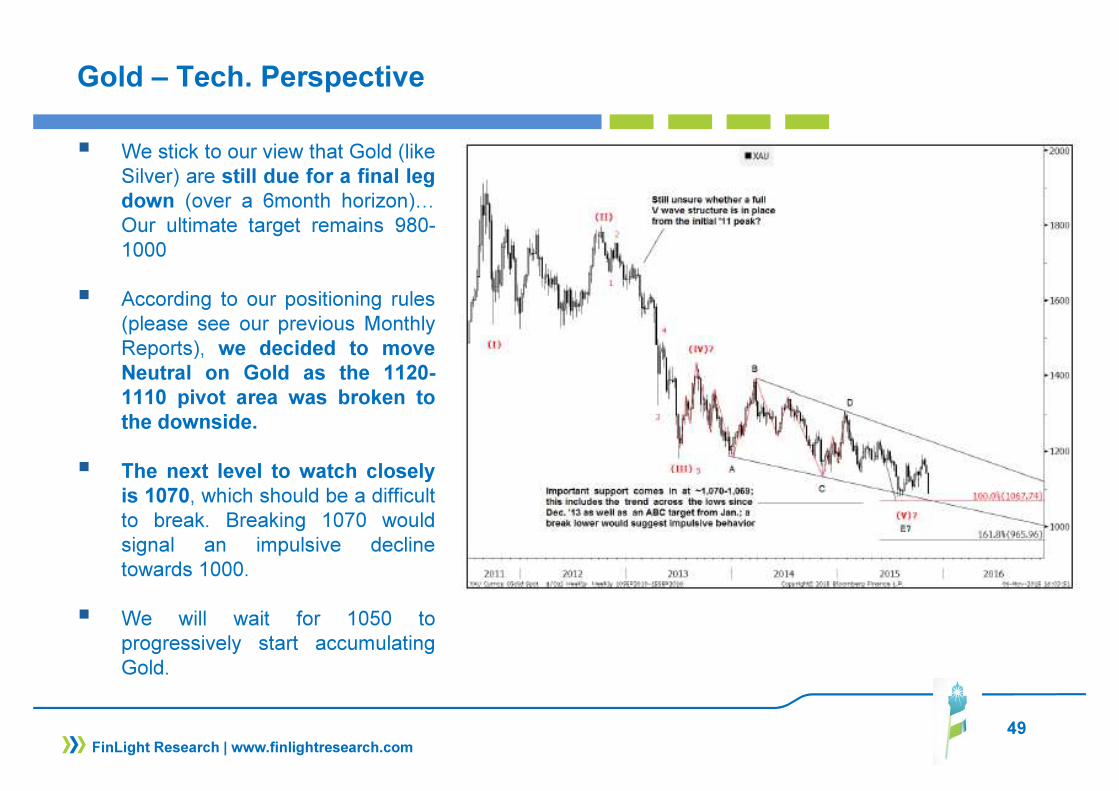
Gold – Tech. Perspective
� We stick to our view that Gold (likeSilver) are still due for a final leg
down (over a 6month horizon)…Our ultimate target remains 980-1000
� According to our positioning rules(please see our previous MonthlyReports), we decided to move
Neutral on Gold as the 1120-
1110 pivot area was broken to
the downside.
� The next level to watch closely
is 1070, which should be a difficultto break. Breaking 1070 wouldsignal an impulsive declinetowards 1000.
� We will wait for 1050 toprogressively start accumulatingGold.
FinLight Research | www.finlightresearch.com

50
Crude – Tech. Perspective
� Over the medium term we thinkthere is still potential for a last leglower
� The market seems to have met aninterim low point at around 42
� Tactically, we’ve decided since
September to move to OW andto trade the 42-52 range
� We will move to Neutral again ifthe WTI goes above 56.5 or below42, and to OW if the it breaksabove 63
� We will move to UW if the Augustlow (~38) is breached.
FinLight Research | www.finlightresearch.com

51
ALTERNATIVE STRATEGIES
� The HFRI Fund Weighted Composite Index gained 1.7% in October (YTD is flat), partially reversing declines from Q3. Gains were lead by Equity Hedge (+3.2%, thanks to energy/basic materials), Event-Driven (+1.7%, led by Activist and Special Situations) and Relative Value (+1.8% led by RV on corporate credit and volatility)
� Among our preferred strategies, Volatility Arbitrage added +2.4% MoM, leading all RV sub-strategies YTD with a gain of +8.1%. The Global Macro strategy added +0.9% and Market Neutral +1.0% for the month. Only CTAs (HFRI Macro: Systematic Diversified/CTA Index) posted mixed performance (-1.4%) as they failed to capture the market rebound.
� CTAs’ gains on short EUR, energy and base metals didn’t manage to offset losses generated on short equity and long FI
� Macro funds made money on their short exposure to Euro vs. USD, long positions on European and US indices and tactical short positioning on US and European rates.
� We stick to our preference for risk diversifiers (pure alpha generation strategies) over return enhancers. Our strategy has been clearly rewarding during the last months including September. CTAs, Global Macro and Market-Neutral Equity funds successfully navigated Q3 challenging period.
� We believe that diversifying portfolios with an increased allocation to alternatives is particularly attractive at this stage of the cycle, and given the current macroeconomic and interest rate uncertainties
FinLight Research | www.finlightresearch.com

52
ALTERNATIVE STRATEGIES
� We think that the widening gap between the Fed and ECB monetary policies (and its subsequent impacts on US dollar, commodities and Govies) is supportive for CTAs and Global Macros on which we remain overweight.
� We are not changing our recommendations on alternatives which we consider to be suited to current market conditions. We maintain our OW positioning on:� Equity Market Neutrals both for their “intelligent” beta and their alpha contribution. � CTA’s and Global Macro as a diversifier and tail hedge. These strategies should outperform as
FX and commodity current trends are likely to persist.� Vol. Arb strategy and prefer funds that trade volatility globally (all assets / all regions). This is our
way to take advantage from the higher volatility regime.
FinLight Research | www.finlightresearch.com

53
CTAs Exposure
� CTAs have recently started to increase their exposure to equities, both US and European.
� Within the Govies pocket, and given the current divergence between Fed and ECB policies, CTAS are now getting long European bonds and short US bonds
FinLight Research | www.finlightresearch.com

Bottom Line: Global Asset Allocation
� Global markets posted sharp gains in October, recovering most of
September's losses, without any significant news on the macro front
� Nevertheless, macro risks are still rising… Deflation forces are real…
Concerns remain over Chinese growth, HY credit and falling commodity
prices. Markets seem unprepared for interest rate hikes.
� The rally on the S&P500 was impressive, but a massive top forming could not
be excluded. Breadth on the rally has been horribly weak.
� High Yield debt and Small Caps underperformance raises yellow flags
on the sustainability of the bullish trend in equities.
� Thus, we remain cautious on risky assets and expect lower asset returns and
higher volatility to make the essence of next year.
� We stick with our views on Dollar (Bullish), commodities / specially metals
(Bearish) and EM (Bearish) as we see no fundamental support for a reversal
� A slowdown in global economic growth seems underway. DMs are
clearly not insolated from EM turbulence. Channels of contagion from China
and other EMs to DMs are numerous, but still underestimated.
� Old-school as we are, we expect all this Central Banks money printing to
ultimately end in tears
� We reiterate our view: A perfect storm is building… It combines historically
overvalued stocks with stretched government bonds and corporate credits.
Unlike previous storms (2000, 2008), investors would be left with almost
no place to hide
� We summarize our views as follows �
54FinLight Research | www.finlightresearch.com

55
Disclaimer
FinLight Research | www.finlightresearch.com
This writing is for informational purposes only and does not constitute an
offer to sell, a solicitation to buy, or a recommendation regarding any
securities transaction, or as an offer to provide advisory or other services
by FinLight Research in any jurisdiction in which such offer, solicitation,
purchase or sale would be unlawful under the securities laws of such
jurisdiction. The information contained in this writing should not be
construed as financial or investment advice on any subject matter.
FinLight Research expressly disclaims all liability in respect to actions
taken based on any or all of the information on this writing.

About Us…
� FinLight Research is a research-centric company focused on Asset Allocation from a top-down
perspective, on Portfolio Construction, and all related quantitative aspects and risk management issues.
� Our expertise expands along 3 axes:
� Asset Allocation with risk control and/or risk budgeting techniques
� Allocation to alternative investments : Hedge funds, rule-based strategies (momentum, value, carry, volatility), real assets (real estate, infrastructure, farmland, timberland and natural resources). Private equity and venture capital should be the next step…
� Allocation with a factorial approach built on the understanding (profiling) of the risk/return drivers of the different asset classes
� FinLight Research is an innovation-oriented company. We target to fill the gap between the academic research and the investment community, especially on real assets and alternatives. We survey on a continuous basis the academic literature for interesting published and working papers related to quantitative investing, non-linear profiling, asset allocation, real assets...
56FinLight Research | www.finlightresearch.com

Our Standard Offer
Provide tailor-made quantitative analysis of your
portfolios in terms of asset allocation, risk profiling and risk contribution
Provide tailor-made quantitative analysis of your
portfolios in terms of asset allocation, risk profiling and risk contribution
•Risk Profiling
Offer a turnkey 3-step factor-based process in GAA
with factor selection, risk budgeting and
dynamic portfolio protection
Offer a turnkey 3-step factor-based process in GAA
with factor selection, risk budgeting and
dynamic portfolio protection
•Factor-based GAA Process
Provide assistance with alternative
investments (including real
assets) in terms of profiling, and
integration in a GAA
Provide assistance with alternative
investments (including real
assets) in terms of profiling, and
integration in a GAA
•Alternative Investments
Provide assistance with asset
allocation and related risk control
and/or risk budgeting techniques
Provide assistance with asset
allocation and related risk control
and/or risk budgeting techniques
•Global Asset Allocation (GAA)
57FinLight Research | www.finlightresearch.com