finite element modelling of a tied arch bridge from ... element modelling of a tied arch bridge from...
TRANSCRIPT

1 INTRODUCTION
Finite element (F.E.) modelling of bridges is now common in the normal design process of new structures or in the assessment of existing structures. With advances in numerical modelling, it is generally expected that F.E. models based on technical design data, as-built drawings and en-gineering judgement can reliably simulate both the static and dynamic structural behaviour. However, these F.E. models often cannot predict natural frequencies and mode shapes with the required level of accuracy, as a consequence of modelling uncertainties. A possible practice to fill the lack between the real structural performance and F.E. models is to employ some form of modal analysis on bridges in service. Experimental modal analysis based on ambient vibration has been especially applied to flexible systems such as suspension and cable-stayed bridges while only a limited number of full-scale tests was performed on modern steel (Felber and Ven-tura 1995, Calcada et al. 2000) and reinforced concrete (R.C.) arch bridges (Cantieni et al. 1994, Benedettini et al. 2005, Zhou et al. 2005, Gentile 2006).
The paper presents the results of a recent experimental and theoretical research on the dy-namic behaviour of a R.C. arch bridge. The investigated bridge, about 94.0 m long, crosses with a lightly skew angle the Adda river about 40 km far from Milan. The investigation included the following steps: 1. documentary research in the archives and on site geometric survey of the bridge; 2. ambient vibration testing and output-only modal identification; 3. 3D F.E. modelling. Peculiarly, two different models were developed by the two research
groups of Milan and Venice involved in the investigation; the two models share common mod-elling assumptions (i.e. all the structural elements of the bridge were simulated by using the same type of elements) but significantly differ in terms of number of elements and degrees of freedom; in addition, different computer programs were used to develop the models;
4. manual tuning of the models to improve the correlation between measured and theoretical dynamic characteristics and to establish base models to be adopted as suitable "starting points" for more refined procedures of structural identification or model updating.
Finite element modelling of a tied arch bridge from operational modal analysis
B. Briseghella IUAV University of Venice, Department of Architecture Construction, Venice, Italy
N. Gallino and C. Gentile Polytechnic of Milan, Department of Structural Engineering, Milan, Italy
T. Zordan IUAV University of Venice, Department of Architecture Construction, Venice, Italy
ABSTRACT: The paper presents the analytical and experimental dynamic analysis of a rein-forced concrete tied arch bridge, located at Canonica d’Adda (Province of Bergamo, Italy). The bridge was erected in the 50’s and spans about 94.0 m over the Adda river. The experimental part of the study involved dynamic field testing of the bridge under ambient excitations and the Frequency Domain Decomposition technique was used for modal identifica-tion. Based on the available design drawings of the bridge and on the results of a topographic survey, two different F.E. models were developed independently by the two research groups of Milan and Venice involved in the investigation; the information obtained from the field tests were used to validate and improve the theoretical models.

56 ARCH’07 – 5th International Conference on Arch Bridges
Figure 1 : View of the investigated bridge.
24563338925389335624
100
125
63
110
115
30
803 113113
8413
13
624
5013
Downstream Upstream
Figure 2 : Cross-section of the deck (dimensions in cm).
Figure 3 : Original drawings of the bridge.
2 DESCRIPTION OF THE BRIDGE
The bridge at study (Fig. 1), built around 1950 over the Adda river between the towns of Vaprio and Canonica (about 40 km far from Milan), is about 94.0 m long. The bridge, replacing a for-mer iron bridge on the same span, was designed by one of the most eminent Italian bridge engi-neers of the former century: Giulio Krall.
The deck, lightly skewed and with a longitudinal slope of 2.5%, is a four-cell concrete box girder (Fig. 2); the total width of the girder is 12.69 m for two traffic lanes and two pedestrian walkways. The girder is 1.23 m deep so that a good transparency of the deck was attained from aesthetic stand point. The two lateral cells suspend the deck by means of inclined ties made by conventional reinforcement bars immersed in a cast in place grout.

B. Briseghella, N. Gallino, C. Gentile and T. Zordan 57
Figure 4 : Plan and elevation (dimensions in m) of the bridge and instrumented points in the test.
It should be noticed that, from static stand point, the deck may be viewed as consisting of a couple of longitudinal concrete girders connected to the ties and transversally stiffened by 9+9 floor beams bonded to an upper and to a lower slab.
The parabolic arch structure consists of 2 solid R.C. arch ribs, transversally connected together with cross struts; the arches are characterised by a rise/span ratio of 1/6 and suspend the deck on a length of 75.50 m so that the bridge represents one of the most interesting examples of Nielsen structure still in service in Italy (Figs. 1 and 3).
During the preliminary steps of the research it was possible to retrace few original drawings of the bridge (Fig. 3); these documents were, of course, very useful in the understanding of the functioning of the bridge but also reveal significant differences with the "as built" structure. Hence, an accurate geometric survey of the bridge was planned and carried out; Fig. 4 shows plan and elevation of the bridge, as resulting from the geometric survey.
3 DYNAMIC TESTS 3.1 Experimental procedures The experimental campaign was based on ambient vibration tests. The full-scale tests were con-ducted on the bridge using a 16-channel data acquisition system with 14 uniaxial piezoelectric accelerometers (WR model 731A), each with a battery power unit. Fig. 4 shows a schematic of the sensor layout. For each channel, the ambient acceleration-time histories were recorded for 3600 s at intervals of 0.005 s, so that the well-known condition (see e.g. Cantieni 2005) about the length of the time windows acquired (that should be 1000 to 2000 times the period of the structure’s fundamental mode) is largely satisfied.
3.2 Operational modal analysis The operational modal analysis (i.e. the identification of modal parameters from output-only time-histories) was carried out using the Frequency Domain Decomposition (FDD, Brincker et al. 2000) method, implemented in the ARTeMIS software. The FDD technique is based on the decomposition of the spectral density matrix into a set of SDOF systems using the Singular Value Decomposition at each frequency. The first (largest) singular value at each frequency represents the strength of the dominating vibration mode at that frequency while the correspond-ing singular vector contains the mode shape; the successive singular values contain either noise or modes close to a strong dominating one. Hence, this technique is effective and reliable in detect-ing closely spaced modes.

58 ARCH’07 – 5th International Conference on Arch Bridges
SV (d
B)
frequency (Hz) Figure 5 : Average of normalized singular values of the spectral matrix of all data sets and selected modes.
fFDD = 3.20 Hz (B1) fFDD = 3.44 Hz (B2) fFDD = 4.02 Hz (T1)
fFDD = 4.81 Hz (T2) fFDD = 5.27 Hz (B3) fFDD = 5.94 Hz (T3)
fFDD = 6.88 Hz (B4) fFDD = 7.81 Hz (T4)
Figure 6 : Identified vibration modes.
In the application of the FDD technique, the auto and cross spectra were estimated, after decimating the data 5 times, from 2048-points Hanning-windowed periodograms that are trans-formed and averaged with 66.7% overlapping. Since the re-sampled time interval is 0.025 s, the resulting frequency resolution is 1/(2048×0.025) ≈ 0.0195 Hz.
The results of the modal identification revealed 8 normal modes in the investigated frequency interval of 0−9 Hz. In the following, the identified modes are marked with B, indicating the bending modes of the deck, and with T, indicating torsion modes of the deck.
Fig. 5 shows the averages of the first 3 normalized singular values associated with the spec-tral matrices of all data sets. In this graphic, the resonant peaks are marked at 3.20 (B1), 3.44 (B2), 4.02 (T1), 4.81 (T2), 5.27 (B3), 5.94 (T3), 6.88 (B4) and 7.81 Hz (T4). The identified mode shapes are represented in Fig. 6.
4 F.E. MODELLING AND TUNING
Two different 3D finite element models based on original drawings, geometric survey and tests on construction materials were independently developed by the two research groups − Poly-technic of Milan and University of Venice − involved in the investigation. The following as-sumptions were made in both models: 1. four-noded shell elements were used to model the upper and lower concrete slabs of the deck
and the lower parts of the arches; 2. the two lateral box stringers and the transverse cross-beams of the deck were modelled by
two-nodes 3D beam elements. Rigid links were used between the concrete slabs and the grid of lateral stringers and transverse cross-beams;
3. arches, bracing members and ties were modelled as beam elements; 4. a weight per unit volume of 24.0 kN/m3 was assumed for the concrete. On upper concrete
slab of the deck, the weight per unit volume was increased to 27 kN/m3 to account for the ef-

B. Briseghella, N. Gallino, C. Gentile and T. Zordan 59
fects of the asphalt pavement; 5. the Poisson's ratio of the concrete was held constant and equal to 0.20; 6. the arch footings were considered as fixed; 7. the effect of the abutments, as restraints to the horizontal movements of the deck, was taken
into account introducing a series of uniaxial springs oriented in the longitudinal direction and attached to both ends of the deck along each node. The resultant stiffness of these longitudi-nal spring is herein after referred to as K.
As previously stated, two different F.E. computer programs were used. Specifically: a) the Milan researchers used MIDAS/Civil and the model, shown in Fig. 7(a), results in a total
of 2528 nodes, 1876 beam elements and 1352 shell elements; b) the Venice researchers used STRAUS 7 and the model, shown in Fig. 7(b), is much more de-
tailed and results in 24026 nodes, 6391 beam elements and 20244 shell elements. The main uncertainties were identified in the Young’s modulus of the concrete, Ec, and in the
stiffness K. Hence, some preliminary dynamic analyses were performed to check the similarity between experimental and theoretical modal parameters. In these analyses, different values of Ec (ranging from 30 to 40 GPa) and K (ranging from 15×105 to 90×105 kN/m) were used; in each case and for both models, the correlation between theoretical and experimental behaviour seems to provide a sufficient verification of the main assumptions adopted in the models, being a one-to-one correspondence between the mode shapes.
The experimental modal data were then used to adjust the parameters Ec and K; the optimal estimates of these parameters were defined to be the values which minimise the following:
Figure 7 : The two F.E. models created by (a) MIDAS/Civil and (b) STRAUS 7.
Figure 8 : Error function plot.
(a) (b)
60 ARCH’07 – 5th International Conference on Arch Bridges
∑=
−=
N
iFDD
i
FEMi
FDDi
fff
NJ
1
100 (1)
being N the number of identified modes, fiFDD the i-th measured natural frequency and fi
FEM the i-th computed natural frequency. Minimization of J was carried out by varying the uncertain pa-rameters between lower and upper limits. Specifically, Ec was varied from 30 to 40 GPa and K from 15×105 to 90×105 kN/m.
A plot of error function (1) in the neighbourhood of its minimum is shown in Fig. 8, referring to the model developed by the Polytechnic of Milan; a similar plot was obtained by the Venice Uni-versity. In both cases, the minimisation of J provided practically the same values of Ec and K:
Ec = 34.0 GPa K = 60×105 kN/m The modal characteristics of the refined models are compared with the experimental data in
Table 1, through the absolute frequency discrepancy DF = |(fFDD−fFEM)/fFDD| and the Modal As-surance Criterion (MAC, Allemang ad Brown 1983). It can be observed that: a) the relative error between natural frequencies is very good for higher modes (T2, B3, T3, B4 and T4); b) the meas-urement-based mode shapes and computed mode shapes exhibit a good match as well with MAC values being generally higher than about 0.90; c) both models showed good agreement in terms of natural frequencies and mode shapes, despite the differences in their architecture in terms of degrees of freedom.
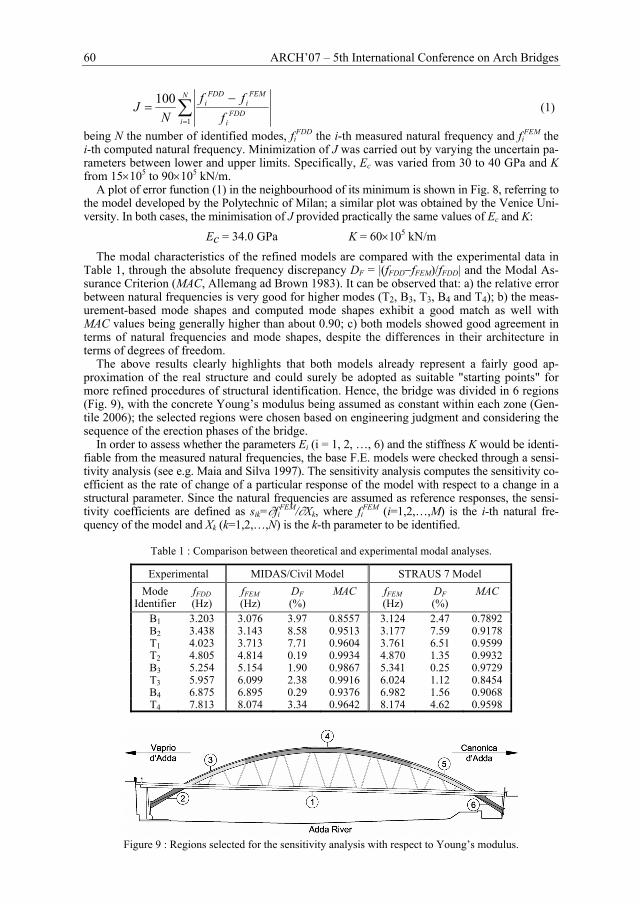
The above results clearly highlights that both models already represent a fairly good ap-proximation of the real structure and could surely be adopted as suitable "starting points" for more refined procedures of structural identification. Hence, the bridge was divided in 6 regions (Fig. 9), with the concrete Young’s modulus being assumed as constant within each zone (Gen-tile 2006); the selected regions were chosen based on engineering judgment and considering the sequence of the erection phases of the bridge.
In order to assess whether the parameters Ei (i = 1, 2, …, 6) and the stiffness K would be identi-fiable from the measured natural frequencies, the base F.E. models were checked through a sensi-tivity analysis (see e.g. Maia and Silva 1997). The sensitivity analysis computes the sensitivity co-efficient as the rate of change of a particular response of the model with respect to a change in a structural parameter. Since the natural frequencies are assumed as reference responses, the sensi-tivity coefficients are defined as sik=∂fi
FEM/∂Xk, where fiFEM (i=1,2,…,M) is the i-th natural fre-
quency of the model and Xk (k=1,2,…,N) is the k-th parameter to be identified.
Table 1 : Comparison between theoretical and experimental modal analyses.
Experimental MIDAS/Civil Model STRAUS 7 Model Mode fFDD fFEM DF MAC fFEM DF MAC
Identifier (Hz) (Hz) (%) (Hz) (%) B1 3.203 3.076 3.97 0.8557 3.124 2.47 0.7892 B2 3.438 3.143 8.58 0.9513 3.177 7.59 0.9178 T1 4.023 3.713 7.71 0.9604 3.761 6.51 0.9599 T2 4.805 4.814 0.19 0.9934 4.870 1.35 0.9932 B3 5.254 5.154 1.90 0.9867 5.341 0.25 0.9729 T3 5.957 6.099 2.38 0.9916 6.024 1.12 0.8454 B4 6.875 6.895 0.29 0.9376 6.982 1.56 0.9068 T4 7.813 8.074 3.34 0.9642 8.174 4.62 0.9598
Figure 9 : Regions selected for the sensitivity analysis with respect to Young’s modulus.

B. Briseghella, N. Gallino, C. Gentile and T. Zordan 61
Figure 10 : Sensitivity coefficients.
For example, Fig. 10 shows the sensitivity coefficients as 100(Xk/fi
FEM)(∂fiFEM/∂Xk), represent-
ing the percentage change in mode frequency per 100% change in the parameter. Fig. 10 refers to the MIDAS/Civil model and clearly reveals that: 1. all investigated frequencies are highly affected by E1 and E4 (i.e. the elastic modulus of the
deck and of the central portion of the arches, see Fig. 9); 2. all the investigated structural parameters affects with different extent the natural frequencies
of the models so that are good candidate to be selected as updating parameters in a further structural identification approach.
Analogous conclusions are provided by the sensitivity analysis of the STRAUS 7 model.
5 CONCLUSIONS
The first results of the dynamics-based F.E. modelling of a concrete arch bridge were presented in the paper. The F.E. models development and the correlation with the dynamic characteristics of the bridge allowed to extract the following main conclusions: (a) within the frequency range of 0−9 Hz, 4 bending modes and 4 torsion modes were clearly
identified using the FDD technique; (b) 3D F.E. models independently developed with two different programmes show very similar
correlation with the experimental results (natural frequencies and mode shapes), despite a substantially different architecture in terms of degrees of freedom;
(c) after a preliminary tuning, both models exhibit a satisfactory correlation with the dynamic characteristics of the bridge. Hence, both models can be treated as the baseline F.E. models and are suitable for long term monitoring and safety evaluation of the bridge in different severe load conditions;
(d) in alternative, both models are suitable "starting points" for more refined procedures of structural identification and a sensitivity analysis was carried out to evaluate how to further refine the models:
(e) the Young’s modulus adopted in the tuned models (34.0 GPa) suggested a fairly good state of preservation of the full-scale structure.
ACKNOWLEDGEMENTS
The research was supported by the M.I.U.R. (Italian Ministry of University and Research), un-der grant Cofin 06. Furthermore, the authors would like to thank the technical personnel (M. Antico and M. Cucchi) of the Laboratory of the Dept. of Structural Engineering, Polytechnic of Milan, for the valuable help in conducting the field tests.

62 ARCH’07 – 5th International Conference on Arch Bridges
REFERENCES
Allemang, R.J. and Brown, D.L. 1983. Correlation coefficient for modal vector analysis. Proc. I Int. Mo-dal Analysis Conf. (IMAC), p. 110-116.
Benedettini, F., Alaggio, R. and Manetta, P. 2005. Arch bridges in Provincia di Teramo: tests, identification and numerical models. Proc. 1st Int. Operational Modal Analysis Conf. (IOMAC), p. 225-236.
Brincker, R., Zhang, L.M. and Andersen, P. 2000. Modal identification from ambient responses using Frequency Domain Decomposition. Proc. XVIII Int. Modal Analysis Conf. (IMAC), p. 625-630.
Cantieni, R., Deger, Y. and Pietrzko, S. 1994. Modal analysis of a concrete arch bridge: Linking experi-ments and analysis. Proc. 4th Int. Conf. on Short and Medium Span Bridges, p. 557-567.
Cantieni, R. 2005. Experimental methods used in system identification of civil engineering structures, Proc. 1st Int. Operational Modal Analysis Conference (IOMAC), p. 249-260.
Calcada, R., Cunha, A. and Delgado, R. 2000. Dynamic analysis of metallic arch railway bridge. J. Bridge Engineering, ASCE, 7(4), p. 214-222.
Felber, A.J. and Ventura, C.E. 1995. Port Mann bridge modal testing and model correlation. 1: Experi-mental testing and modal analysis. Proc. XIII Int. Modal Analysis Conf. (IMAC).
Gentile, C. 2006. Modal and structural identification of a R.C. arch bridge. Structural Engineering and Mechanics, 22(1), p. 53-70.
Maia, N.M.M. and Silva, J.M.M. (Eds.) 1997. Theoretical and experimental modal analysis. Research Studies Press Ltd.
Zhou, J., Fan, Y. and Zhu, T. 2005. Field and model test of an old reinforced concrete arch bridge. Proc. 9th Conference on Inspection, Appraisal, Repairs and Maintenance of Structures.