fingerprint-based recognitionsdass/papers/technometrics-10-26-06.pdf · fingerprint-based...
TRANSCRIPT

Fingerprint-Based Recognition
Sarat C. Dass Anil K. Jain
Dept. of Statistics & Probability Dept. of Computer Science & Engineering
A430 Wells Hall 3105 Engineering Building
Michigan State University Michigan State University
East Lansing, MI 48824 East Lansing, MI 48824
[email protected] [email protected]
September 20, 2006
Abstract
Biometric recognition, or biometrics, refers to the authentication of an individual based on
her/his biometric traits. Among the various biometric traits (e.g., face, iris, fingerprint, voice),
fingerprint-based authentication has the longest history, and has been successfully adopted in
both forensic and civilian applications. Advances in fingerprint capture technology have re-
sulted in new large scale civilian applications (e.g., US-VISIT program). However, these sys-
tems still encounter difficulties due to various noise factors present in operating environments.
The purpose of this article is to give an overview of fingerprint-based recognition and discuss
research opportunities for making these systems perform more effectively.
Keywords: Fingerprint feature extraction, fingerprint individuality, fusion, classification
and indexing.
1 Introduction
Biometric recognition, or biometrics, refers to the automatic authentication of a person based on
his/her physiological or behavioral characteristics (Jain et al. 1999, Maltoni et al. 2003). Biomet-
ric recognition offers many advantages over traditional PIN number or password and token-based
(e.g., ID cards) approaches; for example, a biometric trait cannot be easily transferred, forgotten
or lost, the rightful owner of the biometric template can be easily identified, and it is difficult to
duplicate a biometric trait. Some well-known examples of traits used in biometric recognition are
1

(a) (b) (c) (d)
(e) (f) (g) (h)
Figure 1: Some examples of biometric traits: (a) fingerprint, (b) iris scan, (c) face scan, (d) signature,
(e) voice, (f) hand geometry, (g) retina, and (h) ear.
fingerprint, iris, face, signature, voice, hand geometry, retina, and ear (see Figure 1). A number
of commercial recognition systems based on these traits have been deployed and are currently in
use. Biometric technology has now become a viable and more reliable alternative to traditional au-
thentication systems in many government applications (e.g., US-VISIT program and the proposed
e-biometric passport which is capable of storing biometric information of the owner in a chip in-
side the passport). With increasing applications involving human-computer interactions, there is a
growing need for fast authentication techniques that are reliable and secure. Biometric recognition
is well positioned to meet the increasing demand for secure and robust systems.
There are several requirements that need to be met by a particular biometric trait when being
considered for use in an authentication system. These requirements are: (i) universality, which
means that each individual should possess the trait, (ii) distinctiveness, which means that the trait
for two different persons should be sufficiently different to distinguish between them, (iii) perma-
nence, which means that the trait characteristics should not change, or change minimally, over time,
and (iv) collectability, which means that the trait can be measured quantitatively. However, for prac-
tical biometric systems, there are other considerations that are important, namely, (i) whether the
performance and authentication rates of the system are at acceptable levels, measured in terms of
speed, recognition accuracy and robustness, in different operational environments, (ii) whether the
biometric trait will be widely accepted by the public for use in their daily lives, and (iii) whether
the system based on the trait can be easily attacked or spoofed. The main requirements of a practi-
cal biometric system are that it should have acceptable recognition performance rates, recognition
speed and cost. In addition, it should protect the user from privacy intrusions and be robust with
2

Figure 2: Fingerprint, voice and face biometric based recognition in high-end mobile phones.
respect to various spoofing attacks.
Among all the biometric traits used for authentication, fingerprint-based recognition has the
longest history (almost 100 years) and has been successfully adopted not only in forensic applica-
tions, but in an increasing number of civilian applications (e.g., the US-VISIT program). The reason
behind this success is because fingerprints generally meet the requirements of a biometric trait dis-
cussed in the previous paragraph. Table 1 gives a comparison of commonly used biometric traits in
terms of these requirements. Due to the wide appeal of fingerprints, fingerprint-based authentication
systems continue to dominate the biometrics market by accounting for almost 52% of current au-
thentication systems based on biometric traits (Maltoni et al. 2003). The rapid evolution of mobile
commerce and banking (m-commerce and m-banking) services in recent years has placed new em-
phasis on user ID technology and created widespread deployment of biometrics in this field. Several
mobile manufacturers have incorporated fingerprint, voice and face biometrics into high-end mobile
phones (see Figure 2). New and miniaturized fingerprint sensors capable of being embedded in a
mobile phone have been developed to meet the demands of m-commerce and m-banking applica-
tions. In contrast to traditional two dimensional array sensors, these new one-dimensional line scan
sensors require the finger to be swiped in order to acquire a fingerprint impression for recognition.
A biometric system is essentially a pattern recognition system that recognizes an individual by
comparing the input biometric trait with a set of traits stored in a database (i.e., templates). The
templates are obtained during the enrollment stage where these traits along with an ID are collected
from users and stored in a database. An important issue in designing a biometric system is to
ascertain how recognition will be performed. The two modes of recognition are verification and
identification. In a verification system, recognition is performed by comparing the input biometric
characteristics with the characteristics of a claimed identity (1 to 1 match) stored in the database.
Thus, a verification system either accepts or rejects the claimed identity depending on whether the
3

Table 1: Comparison of selected biometric technologies adapted from Maltoni et al. (2003). The
symbols H, M and L denote High, Medium and Low, respectively. UVSL = Universality, DSTC
= Distinctiveness, PRMN = Permanence, CLTB = Collectability, PRFM = Performance, ACPT =
Acceptability, and CRVN = Circumvention. So, fingerprint has medium universality, high distinc-
tiveness, high permanence, medium collectability, high performance, medium acceptability, and
medium circumvention.
Biometric Trait UVSL DSTC PRMN CLTB PRFM ACPT CRVN
DNA H H H L H L L
Face H L M H L H H
Fingerprint M H H M H M M
Hand Geometry M M M H M M M
Iris H H H M H L L
Signature L L L H L H H
Voice M L L M L H H
biometric characteristics of the input and that of the claimed identity are similar to each other or not.
In the identification mode, however, a claimed identity is not available. The system recognizes an
individual by performing an exhaustive search (1 to M matches) in the entire database of M stored
templates. Thus, in the identification mode, the system establishes an identity without the subject
having to provide one. Figure 3 shows the important processing tasks involved in the enrollment,
verification and identification stages of a fingerprint-based authentication system.
For a system operating in the verification mode, we are interested in accepting inputs (i.e.,
queries) which are “close” or “similar” to the template of the claimed identity, and rejecting those
that are “far” or “dissimilar”. Based on the inputQ and a claimed identityIc, we are interested in
testing the hypothesis
H0 : It = Ic vs. H1 : It 6= Ic, (1)
whereIt is the true identity of the user. In (1),H0 (respectively,H1) is the null (alternative) hypoth-
esis that the user is genuine (impostor). Based on the claimed identityIc, a templateT is retrieved
from the database. Subsequently, the testing in (1) is performed by a matcher which computes a
similarity measure,S(Q,T ), based onQ andT ; large (respectively, small) values ofS indicate
thatT andQ are close to (far from) each other. A threshold,λ, is specified so that all similarity
values lower (respectively, greater) thanλ lead to the rejection (acceptance) ofH0. Thus, decisions
4

VERIFICATION
INPUTFINGERPRINT
ANDCLAIMEDIDENTITY
CLAIMED IDENTITY
EXTRACTOR
FEATURE
(1 MATCH)
MATCHER
ACCEPT/REJECT
SYSTEM
DATABASE
ONE
TEMPLATE
USER’S IDENTITY OR USER NOT INDENTIFIED
DATABASE
SYSTEM
TEMPLATES
M
(M MATCHES)
MATCHER
EXTRACTOR
FEATURE
FINGERPRINT
INPUT
IDENTIFICATION
ENROLLMENT
SYSTEM
DATABASE
FEATURE
EXTRACTOR
INPUTFINGERPRINT
AND
USER NAME
QUALITY
CHECKER
Figure 3: Schematic diagram showing the processing tasks involved in the enrollment, verification
and identification modes of a fingerprint-based authentication system
0 50 100 150 200 250 300 350 400 450 5000
0.002
0.004
0.006
0.008
0.01
0.012
λ1
FRR(λ1)
λ2
FAR(λ1)
Match score
Rel
ativ
e F
requ
ency
10−4
10−3
10−2
10−1
100
0.6
0.65
0.7
0.75
0.8
0.85
0.9
0.95
1
FAR
GA
R
(FAR(λ2),GAR(λ
2))
λ1
(FAR(λ1),GAR(λ
1))
λ2
(a) (b)
Figure 4: Obtaining the ROC curve by varying the thresholdλ on the match scores. Panel (a) shows
the FRR and FAR corresponding to a thresholdλ1. λ2 is another threshold different fromλ1. Panel
(b) shows the ROC curve obtained whenλ varies. The values of(FAR,GAR) on the ROC curve
corresponding to the thresholdsλ1 andλ2 are shown.
5

of whether to accept or rejectH0 in the verification mode are prone to two types of errors: the
false reject rate (FRR), which is the probability of rejectingH0 when in fact the user is genuine,
and the false accept rate (FAR), which is the probability of acceptingH0 when in fact the user is
an impostor. The genuine accept rate (GAR), given by1 − FRR, is the probability that the user is
accepted given that he/she is genuine. Both the FRR (and hence GAR) and the FAR are functions
of the threshold valueλ (see Figure 4 (a)). The Receiver Operating Curve (ROC) is a graph that
expresses the relationship between the FAR versus GAR whenλ varies, that is,
ROC(λ) = (FAR(λ), GAR(λ)), (2)
and is commonly used to report the performance of a biometric authentication system (see Figures
4 (a) and (b)). Note that the ROC curve is a non-decreasing function of FAR with ROC = 0 when
FAR = 0, and ROC = 1 when FAR = 1. Two biometric systems can be compared in terms of their
ROC curves: System 1 is said to be better than system 2 in the FAR range[p0, p1] if their ROCs
satisfy
ROC1(p) ≥ ROC2(p) (3)
for all p ∈ [p0, p1] with strict inequality for at least one suchp. Another popular performance
measure is the equal error rate, or EER. The EER is defined as the common value of FAR(λ∗) and
FRR(λ∗) for the thresholdλ∗ which makes FAR(λ∗) equal to FRR(λ∗).
Although fingerprints can be argued to be one of the best biometric traits, the performance of
fingerprint based authentication systems in many cases does not meet the desired levels of accuracy.
For example, in the fingerprint verification competition, FVC 2002, the best performing algorithm
had an EER of 0.1% (Maio et al. 2002), whereas 2 years later in FVC 2004 (Maio et al. 2004), the
best performing algorithm had an EER of 2%. The drop in performance rates was caused by the fact
that the fingerprint database used in FVC 2004 was more challenging than that used in FVC 2002.
The drop in performance is also a reflection of real operating environments which are affected by
large intra-class and small inter-class variability, resulting in far from perfect performance of these
systems. Large intra-class variability refers to the situation when fingerprints from the same indi-
vidual look very different from one another. For example, the variability in placement of a finger on
the sensing surface gives rise to finger impressions that are rigid transformations (i.e., rotation and
translation) of one another in the 2-D plane and causes the intra-class variability to be large. Other
factors include uneven skin elasticity and pressure of the finger that give rise to non-linear distortions
in the sensed image (see Figure 5). Extraneous factors such as sensor noise, sensing environments,
6

(a) (b) (c) (d)
(e) (f) (g) (h)
Figure 5: Eight different impressions of the same finger showing the intra-class variability due to
finger placement and non-linear distortions caused by skin elasticity.
(a) (b)
Figure 6: Illustrating small inter-class variability: Two fingerprint impressions with similar charac-
teristics from two different fingers.
and the condition of the finger itself (e.g., cuts on a finger) constitute sources of variability that ef-
fect the quality of the acquired impressions. It is well known that the fingerprint features lose their
ability to discriminate when the underling quality of the image is poor. Consequently, these noise
sources, too, have the effect of increasing the intra-class variability among multiple acquisitions of
fingerprints for the same individual. Small inter-class variability refers to the case when fingerprints
from different individuals look very similar to one another; see Figure 6 for an example.
It is important to note that these noisy input images cause fingerprint-based authentication sys-
tems to make mistakes and these mistakes can have serious consequences for the general public. In
the case of Mr. Brandon Mayfield (FBI Press Release 2004, Thompson and Cole 2005), a wrong fin-
gerprint match based on a latent lifted from the Madrid train bombing scene resulted in his wrongful
imprisonment for 19 days. Incidents such as this emphasize the need for research for further im-
7

Ending
Minutiae
Minutiae
Core
Bifurcation
Delta
BiufurcationMinutiae
Delta
Core
MinutiaeEnding
Delta
Core
(a) (b)
Figure 7: Two examples of fingerprint images showing the salient features used for authentication.
proving the performance of these authentication systems.
As illustrated in Figure 3, a fingerprint-based authentication system goes through several inter-
mediate processing tasks prior to deciding the outcome of the matching algorithm. The outcome of
each intermediate task and the final decision are affected by one or more sources of noise mentioned
above. In this paper, we give an overview of four major tasks of fingerprint-based authentication
systems, namely, feature extraction, indexing, individuality and fusion, and discuss methods that
have been developed to perform these tasks effectively. Fingerprint feature extraction, indexing,
individuality and fusion are discussed, respectively, in Sections 2, 3, 4 and 5. We point out the
current challenges in these four areas and discuss work that has been done to further enhance the
performance of fingerprint based recognition systems.
2 Fingerprint Feature Extraction
Two fingerprints images from the NIST Special Database 4 (NIST) are shown in Figure 7. These
images are of size512 × 512 (pixels2) with gray intensities at each pixel ranging from 0 (darkest)
to 255 (lightest). Note that there are alternating dark and light flow lines that traverse the entire fin-
gerprint area termed, respectively, as ridges and valleys. Occasionally, the ridges and valleys either
form patterns of very high curvature or meet at a point from three different directions. These points
are termed as singularities. Figures 7 (a) and (b) show all of the important characteristics, or finger-
print features, that are typically present in a fingerprint image. These features can be categorized
into two main groups, namely, global and local. The global features in a fingerprint image consist of
the information on ridge flow, and the location and type of singularities. A singularity of type “core”
is localized at the innermost point with the highest curvature of a sequence of alternating ridges and
8

valleys, whereas the “delta” is localized at the confluence of three different ridge flow directions.
Local or fine fingerprint features arise due to anomalies in the ridge flow. The most common type
of anomaly, termed as minutiae, consists of breaks (endings) and bifurcations in the ridges. Thus,
information from a minutiae consists of its spatial location (where the break or bifurcation occurs),
type (either bifurcation or ending) and its direction (i.e., the direction of ridge flow at that minutiae
location). Most fingerprint based authentication systems use information extracted from minutiae
bifurcation and endings, as well as the ridge flow and singularities to assess the degree of similarity
between two fingerprints.
Information on the ridge flow is obtained via the directional field, that is, the set consisting of the
direction of flow of the ridges at each pixel (or a block of pixels) in the fingerprint image. Thus, the
ridge flow direction at every pixel consists of an angleθ indicating the direction of flow with respect
to the x-axis. Since opposite ridge flow directions are equivalent,θ is uniquely determined only
in [0, π]. Obtaining fast and reliable estimates of the directional field has been the focus of many
previous research efforts; they include methods based on neural networks (Wilson et al. 1994), filter-
based approaches (O’Gorman and Nickerson 1987), and gradient-based approaches (Rao 1990,
Hong et al. 1998, Jain et al. 1997, Ratha et al. 1995, Bazen and Gerez 2002). The extraction of the
directional field is prone to various noise factors. For example, cuts and bruises on the fingertip can
create disruptions in the ridge flow whereas low moisture content of the fingertip cause random ridge
breaks which distort the extraction process. The detection of singularities has also been addressed
in many previous studies. Finding regions of high curvature and subsequently classifying a feature
vector into either core, delta or a reject class, is the approach taken in Nakamura et al. (1982) and
Srinivasan and Murthy (1992). In Rao and Jain (1992), a geometric theory of differential equations
is used to derive signal-to-symbol representations in the flow field domain for cores and deltas. The
local energy of the directional field in a neighborhood of a block of pixels is used to measure how
closely it resembles a flow field around singularities in Perona (1998). In Jain et al. (2000), , a
ratio of sines of directional fields in two adjacent regions is used to detect singularities while Bazen
and Gerez (2002) uses a scheme for detecting singularities based on the Poincare index. A more
robust directional field and singularity extraction algorithm was obtained in Dass (2004) by eliciting
statistical models that account for the natural smoothness of spatial ridge flows. This approach is
described in greater detail below.
For the gray intensity imageI(x, y) over a rectangular domain, we wish to recover its directional
field. The fundamental image attributes for this purpose are the site-wise image intensity gradients
9

2 4 6 8 10 12 14 16 18 20
2
4
6
8
10
12
14
16
18
20
Figure 8: An example of a fingerprint image block with gradient directions and magnitudes indi-
cated by arrow heads and lengths, respectively.
denoted byµs = ( ∂I∂x , ∂I
∂y )T
for each sites = (x, y). Also, let νs denote the normalized version
of µs so that||νs|| = 1. It is common in the image processing literature to analyze blocks of sites,
instead of individual sites, in order to remove noise and achieve faster processing speed. For a
blockB with image intensity gradientsµs, s ∈ B, our objective is to recover the principal gradient
direction of blockB, denoted by the unit vectorlB, which represents the dominant direction of the
µs, s ∈ B. OncelB is obtained, the directional field for blockB, DFB, is taken to be the unit vector
orthogonal tolB, namely,
DFB = l⊥B. (4)
The main challenge here is that gradientsµs with opposite signs should reinforce, and not
cancel, each other; see, for example, Figure 8. This criteria is satisfied if the distribution ofνs given
lB (hence, the likelihood oflB) has the form
`B( lB | νs, s ∈ B) =∏
s∈B
C(τs) · exp{τsd(νs, ls)} , (5)
where
d(ν, l) = (νT l)2 (6)
measures the degree of similarity betweenν andl, τs denotes the precision, andC(τs) is the normal-
izing constant (independent oflB). For the collection of all blocks,B, the likelihood oflB, B ∈ Bis obtained via independence as
`( lB, B ∈ B) =∏
B∈B(`B( lB | νs, s ∈ B))wB =
∏
B∈B
∏
s∈B
(C(τs))wB · exp{wBτsd(νs, ls)} , (7)
wherewB is the weight given to blockB. Dass (2004) discusses the choices of (i)τs = ||µs||2
within each blockB and (ii) wB = coherence of blockB as a measure of influence of blockB in
10

B. The implication of (i) is that gradients with larger magnitudes are more influential in the recovery
of lB in block B, whereas (ii) gives more weight to blocks with larger coherence (that is, when all
the µs point in the same direction, up to the± sign, as opposed to being randomly distributed).
Based on (7), the maximum likelihood estimate oflB, l̂B, can be shown to be the unit eigenvector
corresponding to the maximum eigenvalue of
AB =∑
s∈B
τs νsνTs . (8)
Subsequently, the directional field estimate,̂DF s = l̂⊥B , is precisely the well-known Rao’s
estimate of the directional field reported in the literature (see, for example, Bazen and Gerez 2002,
and Rao 1990). Note that the weightswB do not influence this estimate of the directional field since
we are assuming that the blocks are independent of each other. The weightswB, however, will be
influential when we incorporate spatial dependence between neighboring blocks, and this will be
pursued subsequently.
One drawback of Rao’s estimator is that it is highly susceptible to noise factors, thus, requiring
several post-processing stages to satisfactorily smooth out the errors. To alleviate the problem with
Rao’s estimator, Dass (2004) incorporates spatial smoothness of the principal gradient directions in
neighboring blocks to achieve a more robust estimator of the directional field. More specifically, a
Markovian prior of the form
π(lB, B ∈ B) = C(α) · exp
{λ
∑
B∼B′wBB′ dα(lB, lB′)
}(9)
is assumed on the collection{ lB, B ∈ B}, wheredα(l, m) = | lT m |α for a positive constantα,
the notation∑
B∼B′ stands for the sum over all blocksB andB′ that are neighbors of each other
in a neighborhood structure specified in Dass (2004),wBB′ are non-negative weights measuring
the influence of the block pair(B,B′) in the overall summation, andλ measures the degree of
spatial smoothness with large (small) values ofλ indicating that neighboringlB values are similar
(dissimilar). Subsequently, the posterior distribution oflB, B ∈ B is given by the density
π(lB, B ∈ B |data) ∝ exp
{ ∑
B∈BwB(lTBABlB) + λ
∑
B∼B′wBB′ dα(lB, lB′)
}. (10)
The Maximum-a-Posteriori (MAP) estimate oflB, B ∈ B is obtained by maximizing the posterior
(10) with respect tolB, B ∈ B. Details of the iterative procedure developed to find the MAP esti-
mate are reported in Dass (2004) together with an investigation into the properties of the extracted
11

−8 −6 −4 −2 0 2 4 6 8−8
−6
−4
−2
0
2
4
6
8
(a)
−8 −6 −4 −2 0 2 4 6 8−8
−6
−4
−2
0
2
4
6
8
(b)
Figure 9: The directional field around singularities based on reference templates for (a) core and
(b) delta. The location of the singularity is indicated by a black dot in the center of each image.
field for different choices ofα, the block size and the smoothing parameterλ. Once the MAP
estimatelB,MAP is found, the estimate of the directional field is taken to be
DFB,MAP = l⊥B,MAP . (11)
The singularity detection algorithm of Dass (2004) uses reference parametric templates for the
core (C) and delta (D), and checks to see whether the extracted directional field around a point is
close to one of the templates. For a window of sizew×w centered at(0, 0), the parametric templates
are obtained using the equations
DF(x,y)(C) =
cos(θ1/2)
sin(θ1/2)
and DF(x,y)(D) =
cos(θ2/2)
sin(θ2/2)
, (12)
where(r1, θ1) and (r2, θ2) are the polar representations of(y,−x) and (−y,−x), respectively.
Figure 9 shows the reference parametric templates for the core and delta in panels (a) and (b),
respectively, for a window of size17 × 17. Now consider a singular point of typeS = {C, D}centered atu0 = (x0, y0) and rotatedξ degrees with respect to the horizontal axis. In this case, the
parametric directional field vector is given by
DFu(S, ξ) ≡
cos(ξ) −sin(ξ)
sin(ξ) cos(ξ)
·DFu∗(S) (13)
for eachu = (x, y), whereu∗ = (x∗, y∗) with x∗ = (x − x0)cos(ξ) + (y − y0)sin(ξ) andy∗ =
−(x−x0)sin(ξ)+(y−y0)cos(ξ), andDFu∗(S) is as given in (12). In order to assess the closeness
12

(a) (b) (c) (d)
Figure 10: Simultaneous directional field and singularity extraction: Panels (a) and (b) give the
original images whereas panels (c) and (d) give the extracted global features, respectively, for (a)
and (b). Note that the extracted directional field is not affected by the noisy region close to the delta
in panels (b) and (d) due to the imposed smoothness.
of the extracted directional field,DFu,MAP (see (11)), to that ofDFu(S, ξ) in a w × w window
Wu0 centered atu0, the function
f(S, ξ; u0) =1
w2
∑
u∈Wu0
d(DFu,MAP , DFu(S, ξ)) (14)
is evaluated withd defined as in (6). Large values off indicate that the extracted fieldDFu,MAP
aroundu0 matches that ofDFu(S, ξ), and suggests the presence of a singularity atu0. However,
the rotation angleξ is not known in practice and has to be estimated. The estimate ofξ is taken to
be ξ̂ which maximizesf(S, ξ; u0) for eachS-template model, that is,
ξ̂ = arg maxξ f(S, ξ; u0) (15)
with
f̂(S; u0) = f(S, ξ̂; u0). (16)
The details pertaining to the estimation ofξ are given in Dass (2004). The value off̂(S; u0) repre-
sents the best value of similarity of the extracted directional field with the directional field specified
by theS-template model rotated at angleξ̂ with respect to the horizontal axis. The functionf̂(S; u0)
is evaluated for all blocks of sitesu0 in a fingerprint image. The maximum of̂f(C; u0) andf̂(D; u0)
is then determined, and compared to a pre-specified thresholdT0 where0 < T0 < 1. A singularity
is said to be present atu0 if this maximum is greater thanT0, with singularity type and orientation
taken to be the ones corresponding to the maximum. If the maximum is less thanT0, no singularity
is detected atu0.
13

(a) (b) (c)
Figure 11: Fingerprint quality: (a) good quality, (b) medium quality, and (c) poor quality. White
boxes and the associated lines indicate locations and directions of detected minutiae. Poor quality
impressions yield higher rates of spurious detection as well as higher rates of missed true minutiae.
One advantage of the template based singularity extraction algorithm is that fewer number of
spurious singularities are detected compared to previous methods. In Dass (2004), the algorithm to
extract the smooth directional field (10) was combined with singularity detection (see equations (14-
16)) to obtain an algorithm that simultaneously extracts both the features. The additional advantage
of the dynamic updating of features is that the directional field can be molded based on current
singularity information to detect other singularities in the fingerprint impression. Two examples are
presented in Figure 10; note that noisy regions do not adversely effect the extracted field with the
addition of smoothness constraints on neighboring directional field values.
Robust detection of ridge ending and bifurcation type minutiae in a fingerprint is crucial since
most fingerprint matching algorithms utilize these two types of minutiae for authentication. Current
methods for minutiae detection utilize some kind of enhancement of the ridges followed by thinning
(i.e., reducing the ridge width to one pixel wide) and detection (Ratha et al. 1995). Non-linear
distortions of the finger caused by uneven fingertip pressure and non-uniform skin elasticity result
in spurious minutiae points being detected as well as true minutiae points being missed. Non-linear
distortions also have the effect of changing the type of a minutiae from a bifurcation to an ending or
vice versa. While current authentication systems do some degree of post-processing of the extracted
features, the problems with spurious minutiae, missed true minutiae as well as incorrect extraction of
minutiae type still exist. With poor quality images, these problems are further aggravated (see Figure
11). One approach to overcome the problems associated with incorrect feature extraction is to report
confidence measures associated with the extracted minutiae. Current algorithms do not report these
values, thus, making the contribution of a falsely detected feature in the authentication stage equal to
that of a true feature. Also, errors incurred in the feature extraction stage propagate to the subsequent
14

(a) (b) (c) (d) (e)
Figure 12: Five major classes of fingerprints in the Henry system of classification: (a) left-loop, (b)
right-loop, (c) arch, (d) tented arch, and (e) whorl. Images are from the NIST database.
matching stage, and thus, significantly affects the overall performance of an authentication system.
3 Fingerprint Classification and Indexing
As mentioned earlier, identification of an individual is a more challenging problem compared to
verification since no claimed identity is provided. Thus, the system has to perform an exhaustive
search on databases to come up with a list of candidate identities (called the top M matches). In large
scale government and forensic applications, these databases consists of millions of fingerprints (for
example, the FBI database consists of approximately 50 million subjects and 500 million fingerprint
images (10 fingers/subject)).
Indexing of a fingerprint database refers to the partitioning of the database by means of as-
signing a label to each fingerprint, and grouping fingerprints with identical labels to form a class.
Effective indexing procedures reduce search time (and the resulting matching accuracy) during the
identification process as only an appropriate subset of the entire database is searched. There are two
main types of indexing approaches: (i) discrete classification, where fingerprints are partitioned into
pre-defined classes according to their macro features, and (ii) continuous classification, where each
fingerprint is represented by a similarity metric that measures its proximity to some pre-selected
class prototype. The Henry system (Henry 1900) is a well-known example of discrete classification
and is used in many forensic applications. While the Henry classification system has many classes
(∼ 17), almost 99% of the fingerprints belong to 5 major types, namely, right-loop, left-loop, whorl,
arch and tented arch. Figure 12 presents typical fingerprint images in the five major classes of the
Henry system. The four-class Henry system is derived from the five classes by combining the arch
and tented arch fingerprints into a single class, since these two classes are rather difficult to discrim-
15

Table 2: A comparison of classification accuracies (in %) of several fingerprint classification meth-
ods in the literature. Reject rates are also given in percentages.
Method No. of 4-class 5-class Reject Rate
fingerprints problem problem
Cappelli et al. 1, 204 - 87.1a 0.0
Chang & Fan 2, 000 - 94.8 5.1
Chong et al. 89 - 96.6b 0.0
Hong & Jain 4, 000 92.3 87.5 0.0
Jain et al 4, 000 94.8 90.0 0.0
Karu & Jain 4, 000 91.4 85.4 0.0
Wilson et al 4, 000 - 94.0c 10.0
Dass & Jain 4, 000 94.4 - 0.0
a using the natural distribution (based on the following percentages for the 5 classes: 31.7%, 33.8%, 27.9%,
3.7% and 2.9% for the right-loop, left-loop, whorl, arch and tented arch classes, respectively) of fingerprints
b based on the 5 classes - double loop, whorl, left-loop, right-loop and arch
c using the natural distribution of fingerprints; equal distribution of each class yields accuracies of84− 88%.
inate. There have been a significant body of work on automatic classification of fingerprints into
the Henry system (see, for example, Cappelli et al. 1999, Chang and Fan 2002, Chong et al. 1997,
Hong and Jain 1999, and Karu and Jain 1996). These approaches can be grouped into five main
categories: (i) approaches based on singular points (Hong and Jain 1999, Karu and Jain 1996), (ii)
structure-based (Cappelli et al. 1999, Chang and Fan 2002, Chong et al. 1997), (iii) frequency-
based (Jain et al. 2000), (iv) syntactic or grammar-based (Moayer and Fu 1975, 1976a,b), and (v)
approaches based on mathematical models (Dass and Jain 2004). Hybrid methods combine at least
two approaches in (i-v) to arrive at a fingerprint classification algorithm (see, for example, Chang
and Fan (2002), Chong et al. (1997), Dass and Jain (2004)). Table 2 compares the classification
accuracies obtained by several fingerprint classification methods reported in the literature.
Classifying fingerprints into the Henry system is extremely difficult; the best reported accuracy
is only 94.8% (at 5.1% reject rate) for the 5-class problem (see Chang and Fan (2002)) in Table 2).
The difficulty in classifying fingerprints into the Henry system is inherent in the class definitions
themselves; sometimes, even human experts assign more than one class label to the same finger-
print because of the ambiguity among the classes (see Figure 13). Another drawback of the Henry
16

(a) (b)
Figure 13: Ambiguous assignment of class in the Henry system: (a) either right-loop or tented arch,
and (b) either left-loop or tented arch.
system is that fingerprints are unevenly distributed among the 5 classes: 31.7%, 33.8%, 27.9%,
3.7% and 2.9% for right-loop, left-loop, whorl, arch and tented arch, respectively, making them
very inefficient for indexing since most searches will be conducted in the first three classes.
In a continuous fingerprint classification scheme, there are no fixed classes as in the discrete
case. The main idea of a continuous classification scheme is to compute the similarity of an input
image to a set of prototypes. Then, a search is performed on those fingerprints that have similarity
values close (determined by a threshold) to the computed values. This procedure significantly re-
duces the number of fingerprints that have to be searched since only the subset of the fingerprints that
have similarity measures close to the computed values is considered. There are several advantages
of continuous classification over discrete schemes: first, the reduction in search time is significant
since only a subset of relevant fingerprints is searched (i.e., images having similarity values close
to the input fingerprint), and (ii) the continuous classification scheme overcomes the difficulties
associated with the ambiguity between classes in the Henry system. A number of continuous classi-
fication schemes have been developed. In Cappelli et al. (1999), a continuous classification scheme
was developed based on partitioning the directional field into several homogeneous regions with
respect to the image ridge flow. However, the class prototypes chosen in Cappelli et al. (1999)
strongly relate to the basic classes of the Henry system. Other indexing approaches not based on
ridge flows were reported in Bhanu and Tan (2003) and Germain et al. (1997). In these approaches,
minutiae triplets were generated for an input image and the features extracted based on the triplets
were used for indexing. The performance of an indexing scheme is measured in term of the retrieval
accuracy - the probability that the top M matches include the person who provided the input. In
Bhanu and Tan (2003), an overall retrieval accuracy of 86.5% was achieved for the top (M = 1)
17

match. An important point to remember is that retrieval accuracies degrade drastically as a function
of image quality since extraction of features as well as the computation of the similarity measures
are affected by noise.
4 The Individuality of Fingerprints
Expert testimony based on forensic evidence (such as handwriting, fingerprint, hair, bite marks,
etc.) is delivered in a courtroom by comparing salient features of a latent print lifted from a crime
scene with those taken from the defendant. A reasonably high degree of match between the salient
features lead the experts to testify irrefutably that the owner of the latent print and the defendant are
one and the same person. For decades, the testimonies provided by forensic individualization ex-
perts were almost never excluded from these cases, and on cross-examination, the foundations and
basis of this testimony were rarely questioned. Central to establishing an identity based on foren-
sic evidence is the assumption of discernible uniqueness; salient features of different individuals
are observably different, and therefore, when two prints share many common features, the experts
conclude that the owner of the two different prints is one and the same person. The assumption of
discernible uniqueness (Saks and Koehler 2005), although lacking sound theoretical and empirical
foundations, allow forensic experts to offer unquestionable proof towards the defendant’s guilt, and
to make matters worse, these experts are never questioned on the uncertainty associated with their
testimonials (that is, how frequently would an observable match between a pair of prints lead to
errors in the identification of individuals). Thus, discernible uniqueness precludes the opportunity
to establish error rates which would be known from collecting population samples, analyzing the
inherent feature variability, and reporting the corresponding probability of two different persons
sharing a set of common features.
A significant break from this trend occurred in the case of Daubert vs. Merrell Dow Pharma-
ceuticals (1993) where the U.S. Supreme Court ruled that in order for expert forensic testimony to
be allowed in a court case, it had to be subject to three main criteria of scientific validation, that
is, whether the particular tool or methodology in question (i) has been tested, (ii) has been subject
to peer-review, and (iii) possesses known error rates. Following Daubert, fingerprint identification
was first challenged in the case of U.S. v. Byron Mitchell (1999) under the fundamental premise
that the uniqueness of fingerprints had not been objectively tested and matching error rates were un-
known. Based on the outcome of U.S. v. Byron Mitchell (1999), fingerprint based identification has
18

θ
θ
s=(x,y)
s=(x,y)
(a) (b) (c)
Figure 14: Minutiae features consisting of the location,s, and direction,θ, for a typical fingerprint
image (b): (a)s and θ for a ridge bifurcation and ending. (c) two subregions of (b) in which
orientations that are spatially close tend to be very similar. The minutiae location is indicated by a
square and the direction by a line emanating from the square.
been challenged in more than 20 court cases in the United States (for example, U.S. v. Llera Plaza
(2002a,b) and U.S. v. Crisp (2003); Cole (2006) gives additional court cases). As recently as De-
cember 2005, the Massachusetts Supreme Judicial Court barred key fingerprint evidence obtained
from several latent prints in the case of Terry L. Patterson (Saltzman 2005a,b).
The above court rulings demonstrate both the awareness and the need to develop measures that
reflect the confidence in a match when fingerprint evidence is presented. Fingerprint individuality
deals with the problem of quantifying the extent of uniqueness of a fingerprint. How similar should
two fingerprints be before we can conclude with high confidence that they are from the same fin-
ger? What are the measures of fingerprint individuality that reflect the extent of uncertainty in the
observed match?
The main challenge in studying fingerprint individuality is to develop models that adequately
describe the variability of fingerprint features in a target population. These models can, in turn,
be used to derive the probability of a random match between two different fingerprints picked ar-
bitrarily from the target population. Eliciting candidate models for representing the variability of
fingerprint features is not an easy task due to the complex nature of this variability. Candidate
models should satisfy two important requirements, namely, (i) flexibility, that is, the models can
represent a wide range of distributional characteristics of fingerprint features in the population, and
(ii) associated confidence measures can be easily obtained from these models.
There have been some studies, although not many compared to other topics in fingerprints,
19
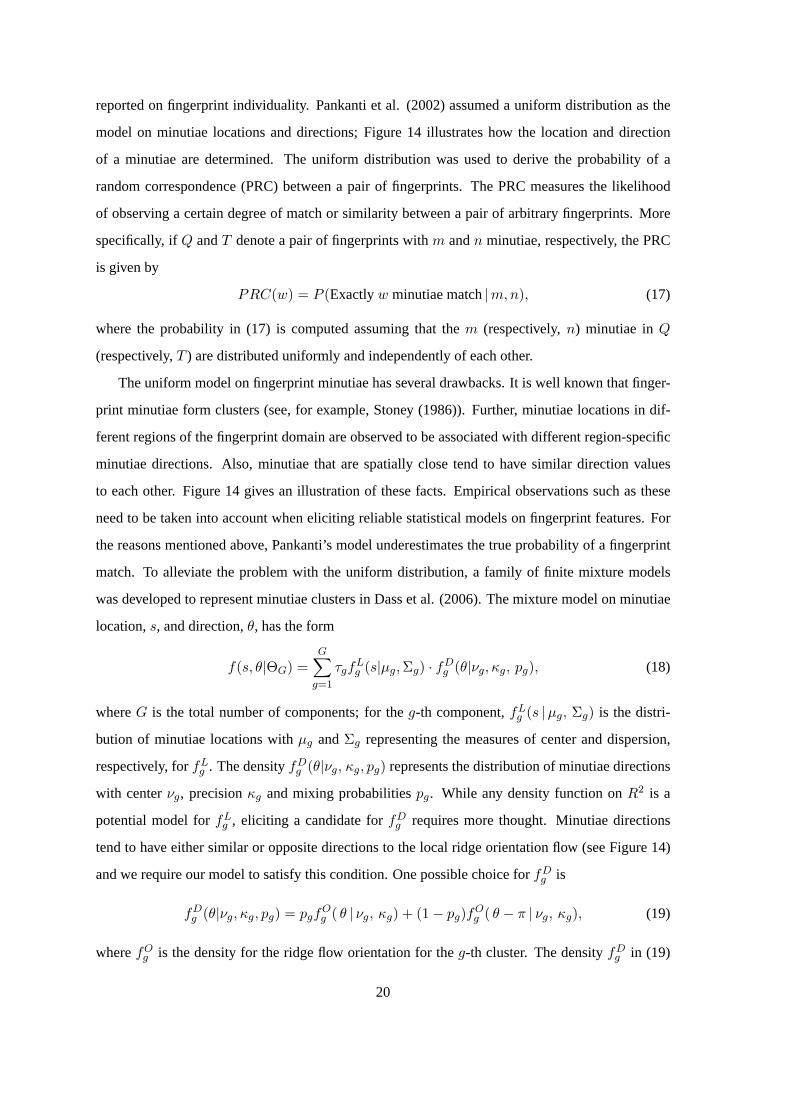
reported on fingerprint individuality. Pankanti et al. (2002) assumed a uniform distribution as the
model on minutiae locations and directions; Figure 14 illustrates how the location and direction
of a minutiae are determined. The uniform distribution was used to derive the probability of a
random correspondence (PRC) between a pair of fingerprints. The PRC measures the likelihood
of observing a certain degree of match or similarity between a pair of arbitrary fingerprints. More
specifically, ifQ andT denote a pair of fingerprints withm andn minutiae, respectively, the PRC
is given by
PRC(w) = P (Exactlyw minutiae match|m, n), (17)
where the probability in (17) is computed assuming that them (respectively,n) minutiae inQ
(respectively,T ) are distributed uniformly and independently of each other.
The uniform model on fingerprint minutiae has several drawbacks. It is well known that finger-
print minutiae form clusters (see, for example, Stoney (1986)). Further, minutiae locations in dif-
ferent regions of the fingerprint domain are observed to be associated with different region-specific
minutiae directions. Also, minutiae that are spatially close tend to have similar direction values
to each other. Figure 14 gives an illustration of these facts. Empirical observations such as these
need to be taken into account when eliciting reliable statistical models on fingerprint features. For
the reasons mentioned above, Pankanti’s model underestimates the true probability of a fingerprint
match. To alleviate the problem with the uniform distribution, a family of finite mixture models
was developed to represent minutiae clusters in Dass et al. (2006). The mixture model on minutiae
location,s, and direction,θ, has the form
f(s, θ|ΘG) =G∑
g=1
τgfLg (s|µg,Σg) · fD
g (θ|νg, κg, pg), (18)
whereG is the total number of components; for theg-th component,fLg (s |µg, Σg) is the distri-
bution of minutiae locations withµg andΣg representing the measures of center and dispersion,
respectively, forfLg . The densityfD
g (θ|νg, κg, pg) represents the distribution of minutiae directions
with centerνg, precisionκg and mixing probabilitiespg. While any density function onR2 is a
potential model forfLg , eliciting a candidate forfD
g requires more thought. Minutiae directions
tend to have either similar or opposite directions to the local ridge orientation flow (see Figure 14)
and we require our model to satisfy this condition. One possible choice forfDg is
fDg (θ|νg, κg, pg) = pgf
Og ( θ | νg, κg) + (1− pg)fO
g ( θ − π | νg, κg), (19)
wherefOg is the density for the ridge flow orientation for theg-th cluster. The densityfD
g in (19)
20

can be interpreted as follows: for the ridge flowω distributed asfOg , minutiae directions that are
eitherω or ω + π have probabilitiespg and1− pg, respectively. In Dass et al. (2006) , the density
fLg was taken to be a bivariate Gaussian density with meanµg and covariance matrixΣg, whereas
fOg was taken to be the Von-Mises density (see Mardia (1972))
fOg ( θ | νg, κg) =
2I0(κg)
exp{κg cos2(θ − νg)}, (20)
with I0(κg) defined as
I0(κg) =∫ 2π
0exp{κg cos(θ − νg)} dθ. (21)
In (20),νg andκg represent the mean angle and the precision (inverse of the variance) of the Von-
Mises distribution, respectively.
Parameter estimation is carried out using the EM algorithm for mixtures (Dempster et al. 1977);
for fixedG, the missing component for thej-th minutiae location and direction pair(Xj , Dj) is its
class label,cj ∈ {1, 2, . . . , G}, for j = 1, 2, . . . , N . The transformation
ωj =
Dj if Dj ∈ [0, π)
Dj − π if Dj ∈ [π, 2π)(22)
converts the minutiae directions into orientations which take values in[0, π). The corresponding
distribution for each(Xj , ωj) then becomes
G∑
g=1
τg fLg (Xj |µg, Σg) · fO
g (ωj | νg, κg ), (23)
wherefOg (ωj | νg, κg ) is as given in (20). Note that the expression in (23) is now in the standard
form for mixture models (see, for example, Section 2.7 of MacLachlan and Krishnan (1997)), and
can be solved using general formulas for the E- and M-steps. To find the optimal number of clus-
ters,G∗, we first estimate the model parameters for different values ofG using the EM algorithm
described above, and then selectG∗ using the BIC criteria. The approach outlined here extends the
methodology of Fraley and Raftery (2002) by including angular variables in the mixture modeling.
The BIC criteria is defined as
BIC(G) = 2 ∗N∑
j=1
logf(Xj , Dj |ΘG)− |ΘG| log(N), (24)
whereΘG = {(µg,Σg, νg, κg, pg, τg), g = 1, 2, . . . , G} denotes the set of all unknown parameters,
and |ΘG| is the cardinality ofΘG. The value ofG∗ is selected as the value ofG that maximizes
BIC(G).
21

(mQ,mT , w) Mixture model Pankanti’s model
(26, 26, 12) 6.8× 10⁻¹⁰ 2.4× 10⁻¹⁵
(36, 36, 12) 6.5× 10⁻⁷ 1.0× 10⁻¹⁰
(46, 46, 12) 2.0× 10⁻⁵ 3.9× 10⁻⁸
Table 3: A comparison between fingerprint individuality estimates.
In addition to the mixture models developed to represent (i) the minutiae variability in differ-
ent fingers, Dass et al. (2006) also develops stochastic models for two other sources of minutiae
variability, namely, (ii) the variability due to local perturbations arising from non-linear distortion
effects in multiple impressions of a finger, and (iii) the variability due to the size of partial prints
(or the area of finger region captured) in multiple acquisitions of a finger. For a fingerprint database
with F fingers, the compound stochastic model is fit to each fingerf , f = 1, 2, . . . , F . For each
finger f , the stochastic models are then used to generateH synthetic sets of query (respectively,
template) minutiae withm (respectively,n) minutiae. We denote the simulated query (respectively,
template) minutiae sets byFQ(f, h), h = 1, 2, . . . ,H (respectively,FT (f, h), h = 1, 2, . . . ,H).
The matcherM of Ross et al. (2005) is used to determine the number of minutiae matches for each
impostor pair of query and template minutiae sets (i.e., betweenFQ(f, h) andFT (f ′, h′) where
f 6= f ′ andh, h′ = 1, 2, . . . , H). The value of the PRC in (17) is estimated using
p(w) =
H∑
h=1
H∑
h′=1
F∑
f=1
F∑
f ′=1, f ′ 6=f
Iw{(f, h), (f ′, h′)}
F (F − 1)H2(25)
for integersw ≤ w0, whereIw{(f, h), (f ′, h′)} is 1 if M(FQ(f, h),FT (f ′, h′)) equalsw, and0,
otherwise. For values ofw > w0, an extrapolation scheme based onp(w) for w ≤ w0 is developed;
see Dass et al. (2006) for further details on this estimation and extrapolation procedure.
The PRC corresponding to the FBI’s “12-point match” criteria (i.e., declare the two prints come
from one and the same person if the number of minutiae matches is 12 or more) can be obtained by
summing (17) overw values greater than or equal to12. Table 3 gives the fingerprint individuality
estimates derived from the mixture as well as Pankanti’s models for the “12-point match criteria”
based on FVC 2002 DB1 database (see Dass et al. (2006) for more details). Note that the estimates
based on the mixture models are orders of magnitude higher compared to Pankanti et al. (2002) due
to common clustering tendencies of minutiae in different fingerprints.
Basic questions related to fingerprint individuality still remain unanswered. For example, we
22

have assumed that all the detected minutiae in a fingerprint are true. This, of course, is not a valid
assumption for medium to poor quality images. One topic of investigation would be to see how the
PRCs deteriorate as a function of the quality of the underlying input image. More specifically, given
an input with a certain image quality, what is the best estimate of PRC (corresponding to the lowest
uncertainty in the observed match) that can be reported? Research in these areas will enhance the
scientific basis of presenting fingerprint evidence in courts.
5 Multi-biometric Fusion
The best performing fingerprint authentication algorithm (among the 41 algorithms evaluated) in
the FVC 2004 (Maio et al. 2004) fingerprint verification competition had an equal error rate (EER)
of 2%. In general, biometric systems based on fingerprint evidence alone (unimodal systems) suf-
fer from limitations such as the lack of uniqueness, non-universality and noisy data (Jain and Ross
2004) resulting in sub-optimal performance. In contrast, multimodal biometric systems combine
information from its component modalities (e.g., multiple fingers or fingerprint and face) to arrive
at a decision (Ross and Jain 2003). Several studies (Bigun et al. 1997, Kittler et al. 1998, Lam and
Suen 1995, and Wang et al. 2003) have demonstrated that by consolidating information from mul-
tiple sources, better recognition performance can be achieved compared to the unimodal systems.
In a multimodal biometric system, integration can be done at (i) feature level, (ii) matching score
level, or (iii) decision level. However, to achieve the best results, it is necessary to devise methods
for optimally combining information from these multiple sources.
Compared to fusion at the feature and decision levels, consolidation of information at the match-
ing score level is the most useful and feasible for biometric systems. Biometric feature spaces are
often high dimensional and not compatible with each other for combination (for example, finger-
print minutiae and PCA for face (Moon and Phillips 2001)) while decision level fusion has very
limited information available for useful consolidation. There are several challenges involved in fus-
ing matching scores as well: Scores from different matchers may not be compatible; for example,
the two face matchers in the NIST-BSSR1 database generate scores in the intervals[−1, 1] and
[0, 100]. Further, the scores of different matchers can be either dissimilarity or similarity measures,
and they may follow different probability distributions. Another issue is that the accuracy of the
matchers may be quite different and the matching scores may be correlated.
A popular approach to fusion at the matching score level is based on score normalization (Ross
23

10−2
10−1
100
101
65
70
75
80
85
90
95
100
False Accept Rate (%)
Gen
uine
Acc
ept R
ate
(%)
Face2
Finger1
Finger2
Face1
CopulaFusion Rule
10−2
10−1
100
101
70
75
80
85
90
95
100
False Accept Rate (%)
Gen
uine
Acc
ept R
ate
(%)
Left Iris
FingerprintRight Iris
CopulaFusion Rule
(a) (b)
Figure 15: Improvement in authentication performance using the fusion rule based on Gaussian
copula functions: Figures show the ROC curves for the fusion and individual biometric systems
based on the (a) NIST-BSSR1 and (b) WVU databases.
and Jain 2003, Jain et al. 2005). In a score normalization scheme, matching scores from the different
sources are transformed to a common domain by changing the location and scale parameters of the
individual score distributions. In a good normalization scheme, it is required that the estimates of the
location and scale parameters be robust as well as efficient: Robustness refers to the property where
the estimator of interest is not affected by outliers, whereas efficiency relates to the closeness of the
estimator to the true value (see Huber (1981), for example). Once robust and efficient estimators are
determined, score normalization then fuses the (normalized) scores using a variety of combination
rules. While there are many score normalization techniques, the challenge is to find a procedure
that is both robust and efficient. Typical transformations involved in score normalization are of the
form:
s′ =s− µ
σ, (26)
whereµ andσ, respectively, are the location and scale parameters, ands ands′ are, respectively,
the original and transformed scores. Different normalization rules arise by making different choices
for µ andσ: The min-max rule is derived by takingµ to be the minimum score, andσ to be the
range, the z-score results from takingµ to be the mean andσ to be the standard deviation, whereas
a robust version of the z-score is derived by takingµ to be the median andσ to be the mean absolute
deviation. The tanh estimators based on Hampel et al. (1986) are robust and highly efficient. This
normalization rule is given by
s′ =12
{tanh
(0.01
(s− µGH
σGH
))+ 1
}, (27)
whereµGH andσGH are the mean and standard deviation estimators corresponding to the genuine
24

score distribution given by the Hampel estimators. The Hampel estimators are based on an influence
function which reduces the influence of points at the tails of the matching score distributions; see
Jain et al. (2005) for details. Other score normalization techniques use the double sigmoid function;
see Cappelli et al. (2000) for details.
Subsequently, fusion of the normalized scores is based on several different rules: simple and
weighted sum of scores, the maximum, minimum and product rules (Kittler et al. 1998 and Jain et
al. 2005). Snelick et al. (2003) conducted a study of the different score normalization techniques
and concluded that the max-min rule followed by the sum fusion rule performed the best based on
the experimental results on their database. In Jain et al. (2005), a more systematic study of the
different normalization techniques was conducted to ascertain their performance based on a multi-
modal database consisting of the fingerprint, face and hand-geometry modalities. It was found that
the weighted sum rule performed the best among all combination rules. An important component
of the analysis presented in Jain et al. (2005) is to use a non-parametric technique for estimating the
density of the matching score distributions. This has the added advantage that it is not necessary to
assume each matching score distribution has a Gaussian distribution.
The disadvantage of a score normalization scheme is that the selection of optimal weights for
the score combination is carried out on a case-by-case basis. This can be very challenging. Another
approach that was investigated is to fuse information automatically at the matching score level based
on likelihood functions Dass et al. (2005). One challenge with the likelihood function framework,
as in score normalization, is that it is not easy to specify complete parametric distributions for
matching scores. Matching score distributions tend to be highly non-Gaussian and moreover, consist
of discrete components. The method of fusion outlined in Dass et al. (2005) uses copula functions
(Nelsen 1999, Cherubini et al. 2004) and has several desirable properties. First, no parametric
form is assumed for distributions on matching scores. Thus, this approach is applicable in a variety
of contexts. Second, the correlation between different biometric matchers is accounted for by the
copula. Previous studies assumed that different matchers are independent of each other (see Griffin
(2004)), and consequently, could not be applied to highly correlated data (for example, matching
scores from two different fingerprint matchers applied on the same fingerprint database). Finally,
the copula approach automatically assigns optimal weights to different matchers during fusion, and
subsequently, bypasses the need to determine fusion weights on a case-by-case basis.
Fusion using the algorithm outlined in Dass et al. (2005) shows that the likelihood-based frame-
work consistently achieves high performance rates. Figure 15 presents results on two multimodal
25

Table 4: Summary of multibiometric databases;K denotes the number of matchers used for each
database
Database Biometric Traits K No. of users
NIST-Multimodal Fingerprint (Two fingers) 4 517
Face (Two different matchers)
WVU-Multimodal Fingerprint, Iris 2 320
databases, (a) NIST-BSSR1 and (b) West Virginia University (WVU). The NIST Biometric Scores
Set - Release I (NIST-BSSR1) is a multimodal database where matching scores were obtained using
two fingerprint (on two index fingers) and two face matchers for517 users. The West Virginia Uni-
versity multimodal database (WVU-Multimodal) consists of320 subjects with five samples each of
fingerprint and iris modalities. More details of the two databases are given in Dass et al. (2005);
also, Table 4 provides summary information for the two databases. Compared to the best single
modality, the likelihood-based fusion gives an improvement of 14.2% and 9.1% in the genuine ac-
ceptance rate (GAR), respectively, for the NIST and WVU databases at the false acceptance rate
(FAR) level of 0.1%.
6 Recent Advances in Commercial Systems
Several advances in fingerprint recognition technology have been made by commercial vendors.
Until recently, the three main methods for acquiring fingerprint impressions have been the “ink-
technique”, and acquisitions based on optical and solid state sensors (Maltoni et al. 2003). In the
ink-technique, the subject’s finger is coated with black ink and rolled over a paper card. The card
is then scanned to produce a fingerprint impression. The advent of optical “live-scan” sensors gave
rise to digital fingerprint impressions. These sensors are based on the Total Internal Reflection (TIR)
principle, measuring the reflectivity of light of the sensing surface when a fingertip is placed on it.
Solid state sensors use silicon based capacitive sensors to convert information in the fingertip surface
into electrical signals. To date, several new sensing technologies have emerged. The Multispectral
Fingerprint Imaging (MSI) technique has been introduced by Lumidigm, Inc. (Rowe et al. 2005).
This device scans various skin layers by using different wavelengths of light. Fingerprint images
acquired using the MSI technology are significantly better quality for wet and dry fingers. Another
new fingerprint sensing technology which is based on a multi-camera system has been introduced
26

by TBS, Inc. (Parziale and Diaz-Santana 2006). The “touchless” TBS sensor avoids contact of
the fingertip to any sensing surface, thereby reducing deformations due to skin elasticity during the
acquisition process. A touchless fingerprint sensing device is also available from Mitsubishi.
The resolution of a digital image, measured in terms of the number of dots or pixels per inch
(dpi or ppi), is an important characteristic of the image. Images in the resolution range of 250-500
dpi are effective in recovering fingerprint minutiae and ridge flow information, but ineffective for
detecting finer features. For this reason, higher resolution sensors are currently being developed.
Although solid state sensors still cannot achieve this high resolution due to the cost factor, several
optical sensors with resolution 1000 dpi are commercially available. Optical sensors with resolution
range of 4000-7000 dpi are currently being developed.
One advantage of such high level resolution sensors is that finer fingerprint features (consisting
of sweat pores, ridge contours, incipient ridges, scars; see Jain et al. (2006a,b)) can be observed
and extracted. These finer features are grouped as Level 3 features in a hierarchy where Levels 1
and 2 consists of the ridge flow information and the minutiae, respectively (Kryszczuk et al. 2004,
Roddy and Stosz 1997, and Jain et al. 2006a,b). Several studies incorporating Level 3 features have
reported performance improvement in recognition systems; see, for example, Jain et al. (2006a,b),
and Stosz and Alyea (1994).
Current commercial systems also incorporate preventive measures against spoof (liveliness) at-
tacks. This is a security threat where the fingerprint system can be tricked into accepting an artificial
input (called a gummy fingerprint). This kind of attack was famously described by Matsumoto who
used a gelatin material (similar to that contained in candies) to spoof a variety of sensors (Rowe et
al. 2005). With the advent of new sensor technology, research has been carried out on developing
methods for preventing spoof attacks based on the multispectral sensors (Nixon and Rowe 2005).
Another approach is based on discriminating the extent of distortion present in real fingerprint ac-
quisitions compared to false ones, and has been reported in Antonelli et al. (2006) and Chen et al.
(2005). Commercial vendors have also developed methods for enhancing template security based
on fingerprint vaults and watermark encryption strategies; see, for example, Uludag et al. (2004),
and Jain and Uludag (2003) and the references therein. Smart cards with in-built sensors, feature ex-
tractor, matcher, and template storage chips from makers such as Privaris, Inc. have been proposed
to curb credit card theft and identity fraud (Jain and Pankanti 2006).
Other commercial advances have been aimed at developing quantitative measures for the quality
of fingerprint images (Chen et al. 2005). One goal is to incorporate quality measures in a fusion
27

framework since authentication is severely affected by the quality of the underlying biometric. This
is an important point to be considered as it has practical consequences. In real environments, one
cannot expect that all input biometrics corresponding to an individual will be of the best quality.
In that case, a fusion framework where low quality images will automatically be assigned lower
weights will be of great interest and importance. Developing methodology for validating the per-
formance of fingerprint systems claimed by system vendors is also gaining interest. The challenge
here is to derive tests and confidence statements to either validate or reject claims on the system
performance (Dass et al. 2006). Other concerns of commercial systems include ergonomics (user-
friendliness of the system), throughput (number of users recognized per unit of time) and system
cost.
7 Summary and Conclusion
We have attempted to give a brief overview of fingerprint-based recognition and discuss current
challenges faced in making these systems perform more effectively. Four important aspects of
fingerprint-based recognition as well as recent advances in commercial systems have been dis-
cussed. There are many problems and challenges faced by fingerprint recognition systems today.
In spite of current challenges, new applications (deployment of fingerprint recognition systems in
Disney theme parks, inside mobile phones, flash drives and memory sticks) continue to appear,
strongly suggesting that this type of authentication is here to stay. Statistics can play a pivotal role
in this area by providing insight into the stochastic processes (signal as well as noise) involved in
the development of effective methodology and algorithms for recognition.
8 Acknowledgments
This article was written with the support of NSF ITR Grant No. 0312646.
References
Antonelli, A., Cappelli, R., Maio, D. and Maltoni, D. (2006) Fake finger detection by skin distortion
analysis.To appear in the IEEE Transactions on Information Forensics and Security.
Bazen, A. M. and Gerez, S. H. (2002) Systematic methods for the computation of the directional
28

fields and singular points of fingerprints.IEEE Transactions on Pattern Analysis and Machine
Intelligence, 24,no. 7, 905–919.
Bhanu, B. and Tan, X. (2003) Indexing based on novel features of minutiae triplets.IEEE Trans-
actions on Pattern Analysis and Machine Intelligence, 25,no. 5, 616–622.
Bigun, E. S., Bigun, J., Duc, B. and Fischer, S. (1997) Expert Conciliation for Multimodal Person
Authentication Systems using Bayesian Statistics. InProceedings of First International Confer-
ence on AVBPA, Crans-Montana, Switzerland, pp. 291–300.
Cappelli, R., Lumini, A., Maio, D. and Maltoni, D. (1999) Fingerprint classification by directional
image partitioning.IEEE Transactions on Pattern Analysis and Machine Intelligence, 21,no. 5,
402–421.
Cappelli, R., Maio, D. and Maltoni, D. (2000) Combining fingerprint classifiers.Proceedings of
the First International Workshop on Multiple Classifier System, 351–361.
Chang, J. and Fan, K. (2002) A new model for fingerprint classification by ridge distribution
sequences.Pattern Recognition, 35,1209–1223.
Chen, Y., Dass, S. and Jain, A. K. (2005) Fingerprint quality indices for predicting authentication
performance.Proc. of Audio- and Video-based Biometric Person Authentication (AVBPA), 160–
170.
Chen, Y., Jain, A. K. and Dass, S. C. (2005) Fingerprint deformation for spoof detection.Biometric
Symposium, a special session at the Biometric Consortium Conference, Crystal City, VA.
Cherubini, U., Luciano, E. and Vecchiato, W. (2004)Copula Methods in Finance. Wiley.
Chong, M. M. S., Ngee, T. H., Jun, L. and Gay, R. K. L. (1997) Geometric framework for fingerprint
image classification.Pattern Recognition, 30,no. 9, 1475–1488.
Cole, Simon (2006) “Is Fingerprint Identification Valid? Rhetorics of Reliability in Fingerprint
Proponents Discourse”.Law & Policy, 28,no. 1, 109–135.
Dass, S. C. and Jain, A. K. (2004) Fingerprint classification using orientation field flow curves.
Proc. of Indian Conference on Computer Vision, Graphics and Image Processing, (Kolkata),
650–655.
29

Dass, S. C., Zhu, Y. and Jain, A. K. (2006) Validating a biometric authentication system: Sample
size requirements.IEEE Transactions on Pattern Analysis and Machine Intelligence (to appear).
Dass, S. C (2004) Markov random field models for directional field and singularity extraction in
fingerprint images.IEEE Trans. on Image Processing, 13,no. 10, 1358–1367.
Dass, S. C., Nandakumar, K. and Jain, A. K. (2005) A principled approach to score level fusion in
multimodal biometric systems.Proc. of Audio- and Video-based Biometric Person Authentication
(AVBPA), Rye Brook, NY, 1049–1058.
Daubert v. Merrel Dow Pharmaceuticals, 113 S. Ct. 2786 (1993).
Dempster, A. P., Laird, N. M. and Rubin, D. B. (1977) Maximum-likelihood for incomplete data
via the em algorithm.Journal of the Royal Statistical Society. SeriesB, 39,no. 1, 1–38.
Federal Bureau of Investigation Press Release. Online: http://www.fbi.gov/pressrel/pressrel04/
mayfield052404.htm.
Fraley, C. and Raftery, A. E. (2002) Model based clustering, discriminant analysis and density
estimation.Journal of the American Statistical Association, 611–631.
Germain, R.S., Califano, A. and Colville, S. (1997) Fingerprint matching using transformation
parameters.IEEE Computational Science and Engineering, 4, no. 4, 42–49.
Griffin, Paul (2004) Optimal biometric fusion for identity verification.Identix Corporate Research
Center Preprint RDNJ-03-0064.
Hample, F. R., Rousseeuw, P. J., Ronchetti, E. M. and Stahel, W. A. (1986)Robust Statistics: The
Approach Based on Influence Functions. Wiley, New York.
Henry, E. R. (1900)Classification and Uses of Fingerprints. London: Routledge.
Hong, L. and Jain, A. K. (1999) Classification of fingerprint images.Proceedings of the 11th
Scandinavian Conference on Image Analysis, Kangerlussuaq, Greenland, June 7-11,.
Hong, L., Wan, Y. and Jain, A. K. (1998) Fingerprint image enhancement: Algorithm and perfor-
mance evaluation.IEEE Transactions on Pattern Analysis and Machine Intelligence, 20, no. 8,
777–789.
Huber, P. J. (1981)Robust Statistics. John Wiley & Sons.
30

Jain, A. K., Bolle, R. and Pankanti, S. (1999) (eds)BIOMETRICS: Personal Identification in
Networked Society. Kluwer Academic Publishers, Boston.
Jain, A. K, Chen, Y. and Demirkus, M. (2006a) Pores and ridges: High resolution fingerprint
matching using Level 3 features.To appear in the IEEE Transactions on Pattern Analysis and
Machine Intelligence.
Jain, A. K, Chen, Y. and Demirkus, M. (2006b) Pores and ridges: Fingerprint matching using Level
3 features.To appear in the Proceedings of the International Conference on Pattern Recognition,
Hong Kong.
Jain, A. K., Hong, L., Pankanti, S. and Bolle, R. (1997) An identity authetication system using
fingerprints.IEEE Transactions on Pattern Analysis and Machine Intelligence, 85,no. 9, 1365–
1388.
Jain, A. K., Nandakumar, K. and Ross, A. (2005) Score normalization in multimodal biometric
systems.Pattern Recognition, 38,no. 12, 2270–2285.
Jain, A. K. and Pankanti, S. (2006) A Touch of Money.IEEE Spectrum.
Jain, A. K., Prabhakar, S. and Hong, L. (1999) A multichannel approach to fingerprint classification.
21,no. 4, 348–359.
Jain, A. K., Prabhakar, S., Hong, L. and Pankanti, S. (2000) Filterbank-based fingerprint matching.
IEEE Trans. Image Processing, 9, no. 5, 846–859.
Jain, A. K. and Ross, A. (2004) Multibiometric systems.Communications of the ACM, Special
Issue on Multimodal Interfaces, 47,no. 1, 34–40.
Jain, A. K. and Uludag, U. (2003) Hiding biometric data.IEEE Transactions on Pattern Analysis
and Machine Intelligence, 25,no. 11, 1494–1498.
Karu, K. and Jain, A. K. (1996) Fingerprint classification.Pattern Recognition, 29,no. 3, 389–404.
Kittler, J., Hatef, M., Duin, R. P. and Matas, J. G. (1998) On combining classifiers.IEEE Transac-
tions on Pattern Analysis and Machine Intelligence, 20,no. 3, 226–239.
Kryszczuk, K., Drygajlo, A. and Morier, P. (2004) Extraction of Level 2 and Level 3 features for
fragmentary fingerprints.Proceedings of the Second COST Action 275 Workshop, Vigo, Spain,
83–88.
31

Lam, L. and Suen, C. Y. (1995) Optimal Combination of Pattern Classifiers.Pattern Recognition
Letters, 16,945–954.
Maio, D., Maltoni, D., Cappelli, R., Wayman, J. L. and Jain, A. K. (2002) FVC2002: Fingerprint
verification competition. InProceedings of the International Conference on Pattern Recognition,
pp. 744–747. Online: http://bias.csr.unibo.it/fvc2002/databases.asp.
Maio, D., Maltoni, D., Cappelli, R., Wayman, J. L. and Jain, A. K. (2004) FVC2004: Fingerprint
verification competition. InProceedings of the International Conference on Biometric Authenti-
cation, pp. 1–7. Online: http://bias.csr.unibo.it/fvc2004/.
Maltoni, D., Maio, D., Jain, A. K. and Prabhakar, S. (2003)Handbook of Fingerprint Recognition.
Springer-Verlag.
Mardia, K. V. (1972)Statistics of Directional Data. Academic Press.
McLachlan, G. J. and Krishnan, T. (1997)The EM Algorithm and Extensions. Wiley.
Mitsubishi touchless fingerprint sensor.Online at: http://global.mitsubishielectric.com/.
Moayer, B. and Fu, K. S. (1975) A syntactic approach to fingerprint pattern recognition.Pattern
Recognition, 7, no. 1, 1–23.
Moayer, B. and Fu, K. S. (1976a) An application of stochastic languages to fingerprint pattern
recognition.Pattern Recognition, 8, 173–179.
Moayer, B. and Fu, K. S. (1976b) A tree system appraoch for fingerprint pattern recognition.IEEE
Trans. Comput., 25,no. 3, 262–274.
Moon, H. and Phillips, P. J. (2001) Computational and Performance Aspects of PCA-based Face
Recognition Algorithms.Perception, 30,no. 5, 303–321.
Nakamura, O., Goto, K. and Minami, T. (1982) Fingerprint classification by directional distribution
patterns.Systems, Computers, Controls, 13,no. 5, 81–89.
National Institute of Standards and Technology NIST Biometric Scores Set - release 1.
Nelsen, Roger B. (1999)An Introduction to Copulas. Springer.
NIST: 8-bit gray scale images of fingerprint image groups (FIGS). Online:
http://www.nist.gov/srd/nistsd4.htm.
32

Nixon, K. A. and Rowe, R. K. (2005) Multispectral fingerprint imaging for spoof detection.Pro-
ceedings of SPIE Conference on Biometric Technology for Human Identification, Orlando, USA,
5779,214–215.
O’Gorman, L. and Nickerson, J. V. (1987) An approach to fingerprint filter design.Pattern Recog-
nition, 22,no. 1, 362–385.
Pankanti, S., Prabhakar, S. and Jain, A. K. (2002) On the individuality of fingerprints.IEEE
Transactions on Pattern Analysis and Machine Intelligence, 24,no. 8, 1010–1025.
Parziale, G. and Diaz-Santana, E. (2006) The Surround Imager: A multicamera touchless device to
acquire 3D rolled equivalent fingerprints.Proceedings of International Conference on Biometrics,
Hong Kong, 3832,244–250.
Perona, P. (1998) Orientation diffusions.IEEE Transactions on Image Processing, 7, no. 3, 457–
467.
Rao, A. R. (1990)A Taxonomy For Texture Description and Identification. Springer-Verlag, New
York.
Rao, A. R. and Jain, R. C. (1992) Computerized flow field analysis: Oriented texture fields.IEEE
Transactions on Pattern Analysis and Machine Intelligence, 14,no. 7, 693–709.
Ratha, N. K., Chen, S. and Jain, A. K. (1995) Adaptive flow orientation based feature extraction in
fingerprint images.Pattern Recognition, 28,1657–1672.
Roddy, A. R. and Stosz, J. D (1997) Fingerprint features - statistical analysis and system perfor-
mance estimates.Proceedings of the IEEE, 85,no. 9, 1390–1421.
Ross, A., Dass, S. C. and Jain, A. K. (2005) A deformable model for fingerprint matching.Pattern
Recognition, 38,no. 1, 95–103.
Ross, A. and Jain, A. K. (2003) Information Fusion in Biometrics.Pattern Recognition Letters,
Special Issue on Multimodal Biometrics, 24,no. 13, 2115–2125.
Rowe, R. K., Corcoran, S. P., Nixon, S. P. and Ostrom, R. E. (2005) Multispectral imaging for
biometrics.Proceedings of SPIE Conference on Biometric Technology for Human Identification,
Orlando, USA, 5694,90–99.
33
Saks, M. J. and Koehler, J. J. (2005) The coming paradigm shift in forensic identification science.
Science, 309,892.
Saltzman, Jonathan (2005a) SJC bars a type of prints at trial.The Boston Globe.
Saltzman, Jonathan (2005b) Massachusetts Supreme Judicial Court to hear arguments on banning
fingerprint evidence.The Boston Globe.
Snelick, R., Indovina, M., Yen, J. and Mink, A. (2003) Multimodal biometrics: Issues in design
and testing.Proceedings of the Fifth International Conference on Multimodal Interfaces, 68–72.
Srinivasan, V. S. and Murthy, N. N. (1992) Detection of singular points in fingerprint images.
Pattern Recognition, 25,no. 2, 139–153.
Stoney, D. A. and Thornton, J. I. (1986) A critical analysis of quantitative fingerprint individuality
models.Journal of Forensic Sciences, 31,no. 4, 1187–1216.
Stosz, J. D. and Alyea, L. A. (1994) Automated system for fingerprint authentication using pores
and ridge structure.Proceedings of SPIE Conference on Automatic Systems for the Identification
and Inspection of Humans, San Diego, USA, 2277,210–223.
Thompson, W. and Cole, S. (2005) Lessons from the Brandon Mayfield case.The Champion, 29,
no. 3, 42–44.
US-VISIT, U. S. Department of Homeland Security. Online: http:// www.dhs.gov/ dhspublic/ dis-
play?theme=91.
U. S. v. Byron Mitchell. Criminal Action No. 96-407, U. S. District Court for the Eastern District
of Pennsylvania.
U. S. v. Crisp, 324 F 3d 261 (4th Cir 2003).
U. S. v. Llera Plaza, 179 F Supp 2d 492 (ED Pa 2002).
U. S. v. Llera Plaza, 188 F Supp 2d 549 (ED Pa 2002).
Uludag, U., Pankanti, S., Prabhakar, S. and Jain, A. K. ( 2004) Biometric Cryptosystems: Issues
and Challenges.Proc. of the IEEE, Special Issue on Multimedia Security for Digital Rights
Management, 92,no. 6, 948–960.
34

Wang, Y., Tan, T. and Jain, A. K. (2003) Combining Face and Iris Biometrics for Identity Ver-
ification. In Proceedings of Fourth International Conference on AVBPA, Guildford, U.K., pp.
805–813.
Wilson, C. L., Candela, G. T. and Watson, C. I. (1994) Neural network fingerprint classifiaction.J.
Artificial Neural Networks, 2, 203–228.
Dass, S. C., Zhu, Y., and Jain, A. K. (2006) Statistical models for fingerprint individuality.Accepted
at the International Conference on Pattern Recognition (ICPR).
35