findings from the impact evaluation of jamaica’s path programme
DESCRIPTION
Findings from the Impact Evaluation of Jamaica’s PATH Programme. Presentation for The World Bank Washington DC, February 2007 Dan Levy Jim Ohls. PATH. Conditional cash transfer program : Families receive cash assistance conditional on regular attendance to school and health centers - PowerPoint PPT PresentationTRANSCRIPT

Findings from the Impact Evaluation of Jamaica’s
PATH Programme
Findings from the Impact Evaluation of Jamaica’s
PATH Programme
Presentation for The World Bank Washington DC, February 2007
Dan LevyJim Ohls
Presentation for The World Bank Washington DC, February 2007
Dan LevyJim Ohls

Conditional cash transfer program: Families receive cash assistance conditional on regular attendance to school and health centers
Two types of grants: child assistance and social assistance
Key objective: Link social assistance with human capital accumulation
Key feature: Use of scoring formula to improve targeting to the poor
PATHPATH

Timeline:– Pilot started in one parish in 2001– Island-wide implementation started in 2002
Number of beneficiaries:– Registered ~ 245,000 individuals– Paid ~ 180,000 individuals
Cash transfer amount:– About J$400 per month per eligible person– Average amount received per household: J$1,800
Timeline:– Pilot started in one parish in 2001– Island-wide implementation started in 2002
Number of beneficiaries:– Registered ~ 245,000 individuals– Paid ~ 180,000 individuals
Cash transfer amount:– About J$400 per month per eligible person– Average amount received per household: J$1,800
PATH ImplementationPATH Implementation

PATH RequirementsBeneficiary Prevalence PATH Requirement
Children, 7-17 years old
63% At least 85% school attendance per period
Children, 0-6 years old
18% Children 0-1: 5 visits to Health Center (HC) per year
Children 1-6: 2 visits to HC per year
Elderly 15% 2 visits to HC per year
Source: PATH Project Management Report (June 2006) Excludes PAD/Poor Relief

AgendaAgenda
I. Evaluation Design
II. Characteristics of Impact Evaluation Sample
III. Impacts of PATH on School Attendance
IV. Impacts of PATH on Health Care Usage
V. Sensitivity Analysis
VI. Impacts on Other Outcomes
VII. Conclusions
I. Evaluation Design
II. Characteristics of Impact Evaluation Sample
III. Impacts of PATH on School Attendance
IV. Impacts of PATH on Health Care Usage
V. Sensitivity Analysis
VI. Impacts on Other Outcomes
VII. Conclusions

I. Evaluation DesignI. Evaluation Design
HOPE
E
NTERPRISES LTD.
Research Consultants For the Caribbean.Hope Enterprises Limited

3 Key Questions on PATH3 Key Questions on PATH
What is the impact of the program on the key outcomes of interest?
How has the program been implemented?
Is the program successfully targeting the poor?
What is the impact of the program on the key outcomes of interest?
How has the program been implemented?
Is the program successfully targeting the poor?

MethodologyMethodology
Impact (Q1): Compared eligibles with near-eligibles on key outcomes (school attendance and visits to health centers)
Implementation (Q2): Two qualitative assessments, each consisting of visits to 5 sites
Targeting (Q3): Used data on representative sample of PATH participants to assess poverty status

Targeting of PATHTargeting of PATHQuintile
ProgramFirst
(Poorest) Second Third FourthFifth
(Most Affluent)
Food Stamp 37 26 20 12 6
School Fee Assistance
20 21 25 23 11
Public Assistance 60 17 14 5 4
Poor Relief 35 23 22 16 4
SESP Programme
35 39 7 17 2
JaDEP 9 19 42 13 17
PATH 58 22 14 5 1
Source: PATH Targeting Report, Mathematica Policy Research, 2003.

Data Sources
Data Source Period
Management Information System (MIS)
Throughout evaluation
SLC 2002 Summer 2002
Participant Survey First half 2003
Focus groups and executive interviews
Fourth Quarter 2003 and Summer 2005
Baseline Survey First Quarter 2004
Follow-up Survey Summer 2005

Impact Evaluation DesignImpact Evaluation Design
Exploits the use of scoring formula
– PATH Applicants fill in an application form with information on socio-economic and demographic characteristics
– Information is entered into a computer which calculates an eligibility score
If score<=threshold, applicant is eligible If score> threshold, applicant is not eligible

Impact Evaluation Design (Cont)Impact Evaluation Design (Cont)
Near-eligibles
Just-eligibles
Eligible applicants
Ineligible applicants
Threshold

Basic idea of design is to compare:
– Households just below the threshold (participant group) with
– households just above it (comparison group),
– and statistically account for the eligibility score
Interpretation of Impact Estimates: Marginal Participant
Basic idea of design is to compare:
– Households just below the threshold (participant group) with
– households just above it (comparison group),
– and statistically account for the eligibility score
Interpretation of Impact Estimates: Marginal Participant
Impact Evaluation Design (Cont)Impact Evaluation Design (Cont)

Distributions of Eligibility Scores for Participants Group and All Participants
Distributions of Eligibility Scores for Participants Group and All Participants
96
09
80
1,0
001
,020
1,0
40(F
)Sco
re
Participant group All Participantsexcludes outside values

Impact Estimation Method Impact Estimation Method
Regression Discontinuity (RD): Compare outcomes between participant and comparison groups, statistically accounting for the PATH eligibility score and other background characteristics
More specifically, estimate the following regression equation:
where β1 represents the impact of PATH
Regressions were run at the individual level. Huber-White standard errors were used to account for within-family correlations
0 1 2 3
4 5
( )FU B
ij j j ij
ij j ij
Outcome PART f Score Outcome
X APPDATE u

II. Evaluation SampleII. Evaluation Sample
Impact Evaluation Sample Impact Evaluation Sample
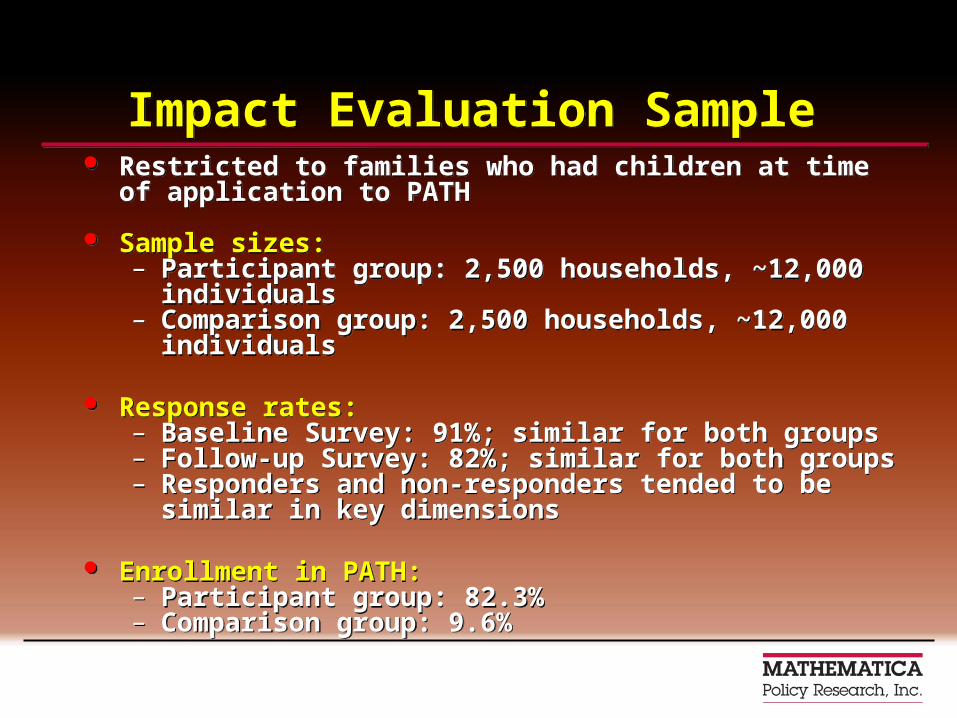
Restricted to families who had children at time of application to PATH
Sample sizes:– Participant group: 2,500 households, ~12,000 individuals– Comparison group: 2,500 households, ~12,000 individuals
Response rates:– Baseline Survey: 91%; similar for both groups– Follow-up Survey: 82%; similar for both groups– Responders and non-responders tended to be similar in
key dimensions
Enrollment in PATH:– Participant group: 82.3%– Comparison group: 9.6%

Demographic CharacteristicsDemographic CharacteristicsNumber of HH members (%)
123-56 and over
07
6528
Age (%)
< 3 years3-5 years6-17 years18-59 years> 59 years
91040346
Location (%)
KingstonOther townsRural
91675
Source: MIS Sample: Respondents to follow-up survey
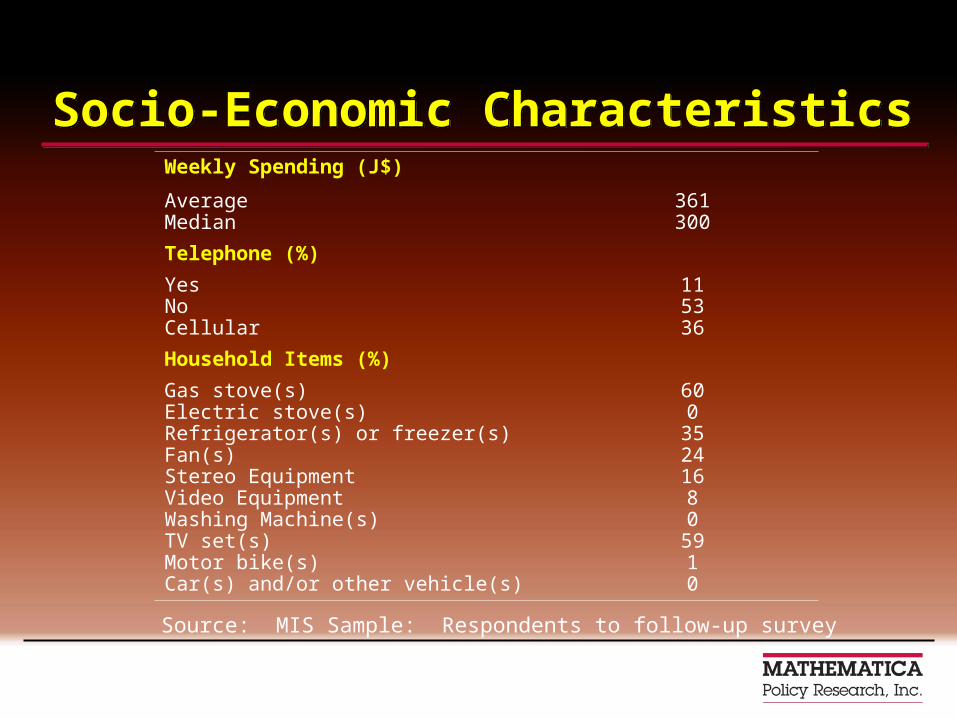
Socio-Economic CharacteristicsSocio-Economic CharacteristicsWeekly Spending (J$)
AverageMedian
361300
Telephone (%)
YesNoCellular
115336
Household Items (%)
Gas stove(s)Electric stove(s)Refrigerator(s) or freezer(s)Fan(s)Stereo EquipmentVideo EquipmentWashing Machine(s)TV set(s)Motor bike(s)Car(s) and/or other vehicle(s)
600
35241680
5910
Source: MIS Sample: Respondents to follow-up survey

Key OutcomesKey OutcomesNumber of
Observations AverageStandard Deviation
Attendance to school in specific 20-day reference period [number of days]
7,704 17.47 2.77
Attendance to school in 20-day typical period [number of days]
7,700 18.37 2.63
Attendance to health center for preventive reasons in past 6 months
Children 0-6 3,062 1.06 1.19
Elderly 1,379 1.17 1.64

Program-Related Characteristics of Participant and Comparison GroupsProgram-Related Characteristics of
Participant and Comparison GroupsCharacteristics Participant Group Comparison Group
Eligibility score
[threshold-25, threshold-15] [threshold-15,threshold-5] [threshold-5,threshold] [threshold, threshold+5]
1355320
000
100
PATH Application Date (%)
April 2002 – June 2002 July 2002 – September 2002 October 2002 – December 2002 After December 2002
6367
24
851013
Sample Size 2,500 2,500

Placebo Tests Placebo Tests
Use baseline data to assess regression specifications used in impact estimations
Basic Idea: Regress baseline version of the outcome on participant dummy and a function of eligibility score
–
– Should not expect coefficient on participation dummy ( ) to be statistically significant
Use baseline data to assess regression specifications used in impact estimations
Basic Idea: Regress baseline version of the outcome on participant dummy and a function of eligibility score
–
– Should not expect coefficient on participation dummy ( ) to be statistically significant
11
1
0 1 2 3 4( )
B
ij j j ij j ijOutcome PART f Score X APPDATE u

Placebo Tests (continued)Placebo Tests (continued)
Ran above regression for following outcomes:
– Attendance to school in reference period
– Attendance to school in typical period
– Attendance to health centers for children 0-6
– Attendance to health centers for elderly
Ran above regression for following outcomes:
– Attendance to school in reference period
– Attendance to school in typical period
– Attendance to health centers for children 0-6
– Attendance to health centers for elderly

Placebo Tests (continued)Placebo Tests (continued)
For every outcome, ran 4 versions of above regression
– Spec 1 - Score enters linearly
– Spec 2 - Score enters in quadratic form
– Spec 3 - Score enters in cubic form
– Spec 4 - Score enters linearly and include household characteristics
For every outcome, ran 4 versions of above regression
– Spec 1 - Score enters linearly
– Spec 2 - Score enters in quadratic form
– Spec 3 - Score enters in cubic form
– Spec 4 - Score enters linearly and include household characteristics
0 1 2 3Bij j j j ijOutcome PART Score APPDATE u
20 1 2 3 4j
Bij j j j ijOutcome PART Score Score APPDATE u
2 30 1 2 3 4 5j j
Bij j j j ijOutcome PART Score Score Score APPDATE u
2 30 1 2 3 4 5j j
Bij j j j ijOutcome PART Score Score Score APPDATE u

Placebo Tests for School Attendance in Reference Period
Placebo Tests for School Attendance in Reference Period
Specification
(1) (2) (3) (4)
Participant group -0.081 (0.208)
-0.113 (0.302)
-0.113 (0.302)
-0.171 (0.211)
Eligibility score -0.008 (0.016)
0.948 (6.402)
0.000 (0.000)
-0.015 (0.018)
Eligibility score squared 0.000 (0.003)
0.000 (0.003)
Eligibility score cubed 0.000 (0.003)
Controls for household characteristics
No No No Yes
No. of observations 7,145 7,145 7,145 7,112
Standard errors in parentheses.
Regressions were run at the individual level. Huber-White standard errors were used to account for within-family correlations.
*/**/***Coefficient statistically significant at the 10%/5%/1% significance level.

Conclusions from Placebo TestsConclusions from Placebo Tests
16 regression specifications
Coefficient in participant group variable was statistically significant:
– Zero times at the 1% level
– Zero times at the 5% level
– Two times at the 10% level
Results from placebo tests support choice of impact design and regression specification
16 regression specifications
Coefficient in participant group variable was statistically significant:
– Zero times at the 1% level
– Zero times at the 5% level
– Two times at the 10% level
Results from placebo tests support choice of impact design and regression specification

III. Impacts of PATH on School Attendance
III. Impacts of PATH on School Attendance

Impact Estimation Method Impact Estimation Method
Estimate the following regression equation:
where β1 represents the impact of PATH
Outcomes:
– Attendance to school in 20-day reference period [Number of days]
– Attendance to school in 20-day typical period [Number of days]
Estimate the following regression equation:
where β1 represents the impact of PATH
Outcomes:
– Attendance to school in 20-day reference period [Number of days]
– Attendance to school in 20-day typical period [Number of days]
0 1 2 3 4 5
FU B
ij j j ij ij j ijOutcome PART Score Outcome X APPDATE u

Impact Estimates for Attendance to School in Reference Period
Impact Estimates for Attendance to School in Reference Period
Variable Reg1 Reg2 Reg3 Reg4 Reg5 Reg6 Reg7
Participant Group Indicator
0.544(0.104)
0.459(0.180)
0.450(0.196)
0.487(0.200)
0.454(0.196)
0.443(0.185)
0.451(0.182)
Eligibility Score 0.009(0.013)
-0.013(0.014)
-0.010(0.014)
-0.012(0.014)
-0.012(0.013)
-0.015(0.014)
School Attendance at Baseline
0.212(0.019)
0.211(0.020)
0.211(0.019)
0.200(0.019)
Household Characteristics
N N N N N N Y
Merging Quality Index
NA NA N N Y N N
Only High Quality Merges
NA NA N Y N N N
Standard errors reported in parentheses. Bold denotes statistically significant at 5% levelY=Yes, N=No, NA=Not Applicable

Impact Estimates for Attendance to School in Typical Period
Impact Estimates for Attendance to School in Typical Period
Variable Reg1 Reg2 Reg3 Reg4 Reg5 Reg6 Reg7
Participant Group Indicator
0.643(0.111)
0.695(0.156)
0.633(0.165)
0.638(0.160)
0.636(0.165)
0.634(0.157)
0.549(0.170)
Eligibility Score 0.005(0.012)
0.001(0.013)
0.003(0.013)
0.001(0.013)
-0.000(0.012)
-0.002(0.014)
School Attendance at Baseline
0.160(0.026)
0.153(0.023)
0.160(0.026)
0.148(0.022)
Household Characteristics
N N N N N N Y
Merging Quality Index
NA NA N N Y N N
Only High Quality Merges
NA NA N Y N N N
Standard errors reported in parentheses. Bold denotes statistically significant at 5% levelY=Yes, N=No, NA=Not Applicable

Impacts on School Attendance: ResultsImpacts on School Attendance: Results
Participant Group
Comparison Group
Impact Estimate
Attendance to school in specific 20-day reference period (number of days)
17.75 17.30 0.45**
Attendance to school in specific 20-day typical period (number of days)
18.70 18.15 0.55**
Comparison group numbers are regression-adjusted.
*/**/***Coefficient statistically significant at the 10%/5%/1% significance level.

ResultsResults
Positive and statistically significant impact of PATH on school attendance
Magnitude of impact estimate:– Reference period: about 0.45 days – Typical period: about 0.55 days
These represent impacts of about 2.5 percentage points in school attendance rate (going from about 85% to about 87.5%)
Positive and statistically significant impact of PATH on school attendance
Magnitude of impact estimate:– Reference period: about 0.45 days – Typical period: about 0.55 days
These represent impacts of about 2.5 percentage points in school attendance rate (going from about 85% to about 87.5%)

Estimates for Various Sub-GroupsEstimates for Various Sub-GroupsImpact Estimate
SubgroupAttendance in
Reference PeriodAttendance in Typical Period
Boys Girls
0.460.40
0.690.42
KMAOtherRural
1.260.720.43
2.070.720.38
Age 6-9Age 10-12Age 13-17
0.470.260.51
0.560.180.81

IV. Impacts of PATH on Health Care Usage
IV. Impacts of PATH on Health Care Usage
HOPE
E
NTERPRISES LTD.
Research Consultants For the Caribbean.Hope Enterprises Limited

Impacts on Preventive Health Care Usage: Methods
Impacts on Preventive Health Care Usage: Methods
Same method as the one used with school attendance
Outcome:
Attendance to health centers for preventive reasons [Number of visits in past 6 months]:– For children 0 – 6 years old– For elderly
Same method as the one used with school attendance
Outcome:
Attendance to health centers for preventive reasons [Number of visits in past 6 months]:– For children 0 – 6 years old– For elderly

Impact Estimates for Attendance to Health Centers for Children 0-6 YearsImpact Estimates for Attendance to
Health Centers for Children 0-6 YearsVariable Reg1 Reg2 Reg3 Reg4 Reg5 Reg6 Reg7
Participant Group Indicator
0.181(0.054)
0.2920.084)
0.315(0.092)
0.309(0.097)
0.319(0.092)
0.305(0.092)
0.299(0.099)
Eligibility Score 0.011(0.007)
0.011(0.007)
0.010(0.008)
0.011(0.007)
0.012(0.008)
0.006(0.008)
Health Care Usage at Baseline
0.171(0.028)
0.173(0.030)
0.173(0.028)
0.174(0.028)
Household Characteristics
N N N N N N Y
Merging Quality Index
NA NA N N Y N N
Only High Quality Merges
NA NA N Y N N N
Standard errors reported in parentheses. Bold denotes statistically significant at 5% levelY=Yes, N=No, NA=Not Applicable

Impact Estimates for Attendance to Health Centers for Elderly
Impact Estimates for Attendance to Health Centers for Elderly
Variable Reg1 Reg2 Reg3 Reg4 Reg5 Reg6 Reg7
Participant Group Indicator
0.048(0.111)
0.0020.178)
-0.014(0.200)
0.045(0.242)
-0.021(0.201)
-0.081(0.189)
0.009(0.216)
Eligibility Score -0.005(0.014)
-0.011(0.017)
-0.002(0.020)
-0.012(0.017)
-0.015(0.016)
-0.011(0.020)
Health Care Usage at Baseline
0.271(0.059)
0.206(0.071)
0.272(0.059)
0.250(0.058)
Household Characteristics
N N N N N N Y
Merging Quality Index
NA NA N N Y N N
Only High Quality Merges
NA NA N Y N N N
Standard errors reported in parentheses. Bold denotes statistically significant at 5% levelY=Yes, N=No, NA=Not Applicable

Impacts on Preventive Health Care Usage: Results
Impacts on Preventive Health Care Usage: Results
Participant Group
Comparison Group
Impact Estimate
Children 1.12 0.82 0.30**
Elderly 1.20 1.19 0.01
Comparison group numbers are regression-adjusted
**: Statistically significant at the 5% level

Statistically significant and positive impact for children
No statistically significant impact for elderly
For children, magnitude of impact estimate of PATH is about 0.3 visits in past 6 months. Equivalent to:
– About 30% increase in the mean number of visits
– About 0.3 standard deviations increase in the mean number of visits
Impacts on Health Care Usage for Preventive Reasons
Impacts on Health Care Usage for Preventive Reasons

Estimates for Various Sub-GroupsEstimates for Various Sub-GroupsImpact Estimate
SubgroupChildren 0 – 6
years ElderlyBoys Girls
0.100.51
-0.18-0.05
KMAOtherRural
1.18-0.300.30
1.37-0.68-0.04
Age 0-1Age 2-6
0.840.31
NANA

V. Sensitivity AnalysisV. Sensitivity Analysis
A. Restricting Participant Group Scores
B. Restricting Application DatesC. Quality of Matches
A. Restricting Participant Group Scores
B. Restricting Application DatesC. Quality of Matches

A. Restricting Participant Group Scores
A. Restricting Participant Group Scores

Impact Estimates Restricting Participant Group to Households with Score Greater than 1,025
Impact Estimates Restricting Participant Group to Households with Score Greater than 1,025
School AttendanceAttendance to Health
Centres
Reference Period
Typical Period
Children 0 – 6 Years Elderly
Participant group 0.736*** 0.282
1.064*** (0.277)
0.309*** 0.111
-0.134 0.325
Eligibility score 0.046 0.036
0.090 (0.039)
0.006 0.015
-0.020 0.051
No. of observations 5,346 5,343 2,156 882
Standard errors in parenthesis.
Regressions were run at the individual level. Huber-White standard errors were used to account for within-family correlations.
*/**/***Coefficient statistically significant at the 10%/5%/1% significance level.

Impact Estimates Restricting Participant Group to Households with Score Greater than 1,030
Impact Estimates Restricting Participant Group to Households with Score Greater than 1,030
School AttendanceAttendance to Health
Centres
Reference Period
Typical Period
Children 0 – 6 Years Elderly
Participant group 1.036*** (0.348)
1.313*** (0.337)
0.249*** 0.145
-0.122 0.423
Eligibility score 0.148 (0.077)
0.175 (0.076)
-0.013 0.036
-0.027 0.094
No. of observations 4,382 4,373 1,707 724
Standard errors in parenthesis.
Regressions were run at the individual level. Huber-White standard errors were used to account for within-family correlations.
*/**/***Coefficient statistically significant at the 10%/5%/1% significance level.

B. Restricting Application DatesB. Restricting Application Dates

Impact Estimates Restricting to Applicants who Applied in 2002Impact Estimates Restricting to Applicants who Applied in 2002
School AttendanceAttendance to Health
Centres
Reference Period
Typical Period
Children 0 – 6 Years Elderly
Participant group 0.482** 0.241
0.717*** 0.232
0.353*** 0.093
-0.067 0.218
Eligibility score 0.002 0.020
0.026 0.020
0.014 0.008
-0.017 0.021
No. of observations 5,858 5,850 2,333 975
Standard errors in parenthesis.
Regressions were run at the individual level. Huber-White standard errors were used to account for within-family correlations.
*/**/***Coefficient statistically significant at the 10%/5%/1% significance level.

C. Quality of MatchesC. Quality of Matches

Quality of matchesQuality of matches
Impact estimation required matching individuals across surveys (baseline and follow-up)
It was easy to match households
It was sometimes difficult to match individuals
For each observation, we created a measure of the quality of the match
Impact estimation required matching individuals across surveys (baseline and follow-up)
It was easy to match households
It was sometimes difficult to match individuals
For each observation, we created a measure of the quality of the match

Quality of matchesQuality of matches
Sensitivity Analysis
– Assuming all matches were correct
– Controlling for the quality of the matches
– Restricting to matches of high quality
Sensitivity Analysis
– Assuming all matches were correct
– Controlling for the quality of the matches
– Restricting to matches of high quality

Other Evidence Consistent with Impacts
Other Evidence Consistent with Impacts

Other Evidence Consistent with ImpactsOther Evidence Consistent with Impacts PATH beneficiaries seem to have a reasonably clear
understanding about the program and the conditionality requirement [IA]
Parents reported sending children to school more often than in the previous year [IA, S]
Teachers reported some parents were sending children to school more often and were checking attendance was properly recorded [IA]
When asked about reason for school absence, participant group was less likely to cite “Money Problems” or “Household could not provide lunch” as an issue [S]
IA= Implementation Analysis; S= Survey
PATH beneficiaries seem to have a reasonably clear understanding about the program and the conditionality requirement [IA]
Parents reported sending children to school more often than in the previous year [IA, S]
Teachers reported some parents were sending children to school more often and were checking attendance was properly recorded [IA]
When asked about reason for school absence, participant group was less likely to cite “Money Problems” or “Household could not provide lunch” as an issue [S]
IA= Implementation Analysis; S= Survey

Other Evidence Consistent with Impacts(continued)
Other Evidence Consistent with Impacts(continued)
About a quarter of households reported their payment had been reduced at some point in the past year
– Of these, 37% attributed the reduction to failure to meet education requirement and 22% to failure to meet attendance requirement
Participant group slightly more likely than comparison group to report they were attending health centers for preventive reasons more often than last year [S]
Participant group slightly less likely to cite “Don’t think it’s necessary” as a reason for not making preventive care visits [S]
IA= Implementation Analysis; S= Survey

VI. Impacts on Other OutcomesVI. Impacts on Other Outcomes

Impact Estimates on Other Education OutcomesImpact Estimates on Other Education OutcomesOutcomes Impact Estimate
Proportion who reported advancing to the next grade 0.004(0.010)
Proportion who reported grades better or much better than previous year
-0.024(0.031)
Proportion who reported grades worse or much worse than previous year
-0.023(0.155)
Proportion of children performing work activities towards household maintenance
-0.001(0.007)
Standard errors in parentheses. Regressions were run at the individual level. Huber-White standard errors were used to account for within-family correlations. */**/***Coefficient statistically significant at the 10%/5%/1% significance level.

Impact Estimates on Other Health Outcomes: For children 0-6 years old
Impact Estimates on Other Health Outcomes: For children 0-6 years old
Outcomes Impact Estimate
Proportion who went to preventive visits more frequently than in the previous year
0.032(0.021)
Proportion reporting worse or much worse health status than that of previous year
0.023(0.032)
Proportion reporting better or much better health status than that of previous year
-0.002(0.014)
Standard errors in parentheses. Regressions were run at the individual level. Huber-White standard errors were used to account for within-family correlations. */**/***Coefficient statistically significant at the 10%/5%/1% significance level.

Possible ExplanationsPossible Explanations On average, PATH participants had only received
benefits for about a year
Not enough statistical power to detect long-term effects
– If they exist, these effects are probably small
– Outcome variables used for long-term analysis were particularly prone to measurement error
Increase in attendance to schools and health centers is simply not enough to substantially affect long-term outcomes
On average, PATH participants had only received benefits for about a year
Not enough statistical power to detect long-term effects
– If they exist, these effects are probably small
– Outcome variables used for long-term analysis were particularly prone to measurement error
Increase in attendance to schools and health centers is simply not enough to substantially affect long-term outcomes

VII. ConclusionsVII. Conclusions

PATH has had a positive impact on:– school attendance– preventive health care usage for children
PATH has had no statistically significant impact on preventive health care usage for elderly
PATH has had a positive impact on:– school attendance– preventive health care usage for children
PATH has had no statistically significant impact on preventive health care usage for elderly
ConclusionsConclusions

There is no evidence that impact on school attendance and health care usage has translated into improvement in other related outcomes (such as graduation, grades, child labor, and health status)
There is no evidence that impact on school attendance and health care usage has translated into improvement in other related outcomes (such as graduation, grades, child labor, and health status)
ConclusionsConclusions
