findings from the evaluation of project gate report
TRANSCRIPT

Growing America Through Entrepreneurship: Findings from the Evaluation of Project GATE
May 2008
Jacob Benus (IMPAQ International)
Sheena McConnell (Mathematica Policy Research) Jeanne Bellotti (Mathematica Policy Research)
Theodore Shen (IMPAQ International) Kenneth Fortson (Mathematica Policy Research)
Daver Kahvecioglu (IMPAQ International)
Submitted to:
U.S. Department of Labor Employment and Training Administration 200 Constitution Ave., NW Room N-5637 Washington, DC 20210
Project Officer:
Jonathan Simonetta
Submitted by:
IMPAQ International, LLC 10420 Little Patuxent Parkway, Suite 300 Columbia, MD 21044 Telephone: (443) 367-0088 Facsimile: (443) 367-0477
Project Director:
Jacob Benus
Principal Investigator: Sheena McConnell

ACKNOWLEDGEMENTS
The design, implementation, and analysis of the Growing America Through Entrepreneurship (Project GATE) demonstration required an extensive collaborative effort among the U.S. Department of Labor (USDOL); the Small Business Administration (SBA); the Departments of Labor of Minnesota, Pennsylvania and Maine; IMPAQ International (IMPAQ), Mathematica Policy Research (Mathematica); Battelle Memorial Institute (Battelle); Washington Software and a number of local organizations that provided business assistance services to participants in the project. Many individuals from these and other organizations have made valuable contributions to the success of the Project GATE demonstration.
The authors wish to particularly acknowledge a number of USDOL staff who contributed greatly to the success of the project. We particularly appreciate the support of Jonathan Simonetta, the USDOL Project Officer. Jonathan provided guidance and valuable input throughout the research design, implementation, and analysis stages of the project.
Within IMPAQ, we would like to thank Lisa Lin and Alicia Schoua-Glusberg, who directed the survey data collection; Hugh Carrington who served as Project Manager and site monitor in the early years of the project and Mia Blecher who served as Project Manager in the latter years; Eileen Poe-Yamagata who served as site-monitor and contributed to the process evaluation; and Ben Kong who contributed analytic support. Within Mathematica, we would like to thank Irma Perez-Johnson who contributed to the design of the implementation analysis, Michelle Van Noy who conducted site visits and worked on collecting the state administrative data, Shawn Marsh who developed the survey instrument, and Peter Schochet who provided comments on drafts of the report. We would also like to thank Jamila Henderson and Nora Paxton who contributed to the analytic tasks and the collection of administrative data from participating states. The success of the demonstration also owes much to Terry Johnson and Jeanine Christian of Battelle. Terry provided invaluable guidance throughout the project, and Jeannine supervised the survey data file programming. We also thank the late Walter Corson, co-Principal Investigator at Mathematica. Walt’s ideas contributed significantly to the design of the demonstration.

TABLE OF CONTENTS
EXECUTIVE SUMMARY ..................................................................................................................... i PROJECT GATE DESIGN ..................................................................................................................... ii EVALUATION DESIGN ......................................................................................................................... iii IMPLEMENTATION ANALYSIS ............................................................................................................. iv IMPACT ANALYSIS .................................................................................................................................. v SUBGROUP RESULTS ............................................................................................................................ vii LESSONS LEARNED ............................................................................................................................ viii
CHAPTER I. INTRODUCTION ................................................................................................... 1
1.1 Reasons to Support Self-Employment ......................................................................... 2 1.2 Availability of Assistance for Self-Employment ......................................................... 3 1.3 The Entrepreneurial Population .................................................................................... 5 1.4 Prior Research on Effectiveness of Self-Employment Programs ............................ 7 1.5 The Contribution of Project GATE ............................................................................. 9 1.6 Organization of the Rest of the Report ...................................................................... 11
CHAPTER II. EVALUATION DESIGN ........................................................................................ 12
2.1 The Demonstration Sites .............................................................................................. 12 2.2 Random Assignment and Sample Development ...................................................... 13
2.2.1 The Counterfactual ........................................................................................................ 13 2.2.2 Random Assignment Procedures ................................................................................ 14 2.2.3 Sample Enrollment ........................................................................................................ 15 2.2.4 Business Partners ........................................................................................................... 16
2.3 Implementation Analysis .............................................................................................. 17 2.4 Impact Analysis .............................................................................................................. 18
CHAPTER III. HOW WAS PROJECT GATE IMPLEMENTED? ................................................. 21
3.1 Demonstration Sites ...................................................................................................... 22 3.2 GATE Service Providers .............................................................................................. 26 3.3 Intake Procedures .......................................................................................................... 27 3.4 Outreach and Recruitment ........................................................................................... 28 3.5 Services Offered ............................................................................................................. 32
3.5.1 The Assessment: Tailoring Services to Participants’ Needs ................................... 33 3.5.2 Classroom Training: Building the Framework for New Businesses ..................... 35 3.5.3 Business Counseling ...................................................................................................... 36
3.6 Participant Tracking System ......................................................................................... 36 CHAPTER IV. DID PROJECT GATE INCREASE THE RECEIPT OF SELF EMPLOYMENT
SERVICES? .......................................................................................................... 37 4.1 Services Available To Program and Control Group Members ............................... 38 4.2 Receipt of Any Self-Employment Services ................................................................ 44 4.3 Types of Services Received .......................................................................................... 46 4.4 Hours of Services Received .......................................................................................... 49 4.5 Amount Spent on Services ........................................................................................... 51

4.6 Perceptions of Usefulness of Services ........................................................................ 52 CHAPTER V. DID PROJECT GATE INCREASE BUSINESS OWNERSHIP? ......................... 56
5.1 Business Ownership ...................................................................................................... 57 5.1.1 Overall Impacts on Business Ownership ................................................................... 57 5.1.2 Impacts by Site ............................................................................................................... 59 5.1.3 Impacts by Receipt of Unemployment Insurance .................................................... 61 5.1.4 Impacts by Other Subgroups ....................................................................................... 64
5.2 Impacts on Business Preparation and Start-up Attempts ........................................ 67 5.3 Impacts on Business Openings and Closures ............................................................ 68 5.4 Number of Businesses Owned .................................................................................... 70 5.5 Business Size ................................................................................................................... 71 5.6 Earnings from Businesses ............................................................................................. 75 5.7 Differences in the Types of Businesses Developed ................................................. 76
5.7.1 Ownership Structure ..................................................................................................... 76 5.7.2 Business Financing ........................................................................................................ 77 5.7.3 Industry of Businesses .................................................................................................. 79
5.8 Challenges to Starting a Business ................................................................................ 79 CHAPTER VI. DID PROJECT GATE INCREASE TOTAL EMPLOYMENT AND
EARNINGS? ........................................................................................................ 84 6.1 Sources of Data on Employment and Earnings ...................................................... 86 6.2 Employment Rate ......................................................................................................... 87
6.2.1 Self-Employment Rate ................................................................................................. 87 6.2.2 Employment Rate at Wage and Salary Jobs .............................................................. 88 6.2.3 Total Employment Rate .............................................................................................. 93
6.3 Months Worked ............................................................................................................ 94 6.3.1 Months Worked at Self-Employment ....................................................................... 94 6.3.2 Months Worked at Wage and Salary Jobs ................................................................. 94 6.3.3 Total Months Worked .................................................................................................. 94
6.4 Hours Worked ............................................................................................................... 96 6.4.1 Hours Worked at Self-Employment .......................................................................... 96 6.4.2 Hours Worked at Wage and Salary Jobs ................................................................... 96
6.5 Earnings ......................................................................................................................... 99 6.5.1 Earnings from Self-Employment ............................................................................... 99 6.5.2 Earnings from Wage and Salary Jobs ........................................................................ 99 6.5.3 Total Earnings ............................................................................................................ 106
6.6 Job Satisfaction .......................................................................................................... 107 6.7 Characteristics of Wage and Salary Jobs................................................................. 107
CHAPTER VII. HOW DID PROJECT GATE AFFECT SELF-SUFFICIENCY? ......................... 111
7.1 Receipt of Unemployment Insurance ...................................................................... 112 7.1.1 Impacts Estimated Using the Administrative Data ............................................... 113 7.1.2 Impacts Estimated Using Survey Data .................................................................... 115
7.2 Receipt of Public Assistance ..................................................................................... 116 7.3 Household Income and Earnings of Spouses ........................................................ 117
CHAPTER VIII. IMPACTS OF PROJECT GATE ON THE UNEMPLOYED ............................ 120
8.1 Analysis Samples ......................................................................................................... 121

8.1.1 Not Employed ............................................................................................................. 122 8.1.2 UI Claimants ................................................................................................................ 122
8.2 Analysis of GATE Impacts on the Unemployed ................................................... 125 8.2.1 Recap of Impacts on the Full Sample ...................................................................... 125 8.2.2 Impacts on Unemployed Subgroups ....................................................................... 126
8.3 Implications ................................................................................................................. 134 CHAPTER IX. LESSONS LEARNED ............................................................................................. 136 REFERENCES……….. ................................................................................................................. 13640 APPENDIX A. DATA COLLECTION FOR IMPACT ANALYSIS .............................................. 145
A.1 GATE Application Packet ........................................................................................ 145 A.2 Two Waves of a Follow-Up Survey ......................................................................... 150
A.2.1 Content of Questionnaires ........................................................................................ 151 A.2.2 Survey Response Rates ............................................................................................... 152
A.3 State Unemployment Insurance Agencies ............................................................... 154 A.3.1 Data Collection Strategy ............................................................................................ 154 A.3.2 UI Wage Records ........................................................................................................ 154 A.3.3 Benefits ......................................................................................................................... 156
APPENDIX B. TREATMENT OF SURVEY NONRESPONSE AND MISSING VALUES ..... 157
B.1 Treatment of Survey Nonresponse .......................................................................... 157 B.2 Treatment of Item Nonresponse ............................................................................. 159
APPENDIX C. ESTIMATION OF IMPACTS AND STANDARD ERRORS ............................... 167
C.1 Regression Model for Estimating Overall Impacts of Project Gate ................... 167 C.1.1 Estimation of Impacts ................................................................................................ 168 C.1.2 Choice of Linear Regression ..................................................................................... 168 C.1.3 Regression Predictors ................................................................................................. 169 C.1.4 Estimating Subgroup Impacts................................................................................... 169
C.2 Calculation of Standard Errors ................................................................................. 170 APPENDIX D. SENSITIVITY ANALYSES ................................................................................... 171
D.1 Weighting Sites Equally ............................................................................................. 171 D.2 Including All Business Partners ............................................................................... 173 D.3 Excluding Imputed Values ....................................................................................... 173 D.4 Unweighted Analyses ................................................................................................ 174 D.5 Difference-in-Means Analyses ................................................................................. 174

LIST OF TABLES
Table II.1: Number of GATE Applicants by Site .................................................................... 15 Table III.1: Socioeconomic and Demographic Characteristics of General Population by Site 23 Table III.2: Organizations Involved in Project GATE ........................................................... 26 Table III.3: One-Stop Career Centers Participating in Project GATE ..................................... 30 Table III.4: Summary of GATE Outreach Strategies by Site .................................................. 31 Table III.5: How Orientation Attendees Heard About Project GATE ................................... 32 Table III.6: Summary of GATE Infrastructure at Each Site ................................................... 34 Table IV.1: Programs That Provide Self-Employment Services During Demonstration .......... 40 Table IV.2: Impacts on Receipt of Self-Employment Services ................................................ 45 Table IV.3: Impacts on Hours of Self-Employment Services Received ................................... 50 Table IV.4: Perceptions of Usefulness of Services at the Wave 1 Follow-up ........................... 54 Table V.1: Impacts on Business Ownership ............................................................................ 58 Table V.2: Impacts on Business Ownership for Those Receiving UI at Random Assignment . 62 Table V.3: Impacts on Business Ownership for Those Claimed UI Within 1 Qtr Prior to RA 63 Table V.4: Impacts on Business Ownership in 18 Months after Random Assignment ............. 65 Table V.5: Impacts on Steps Taken to Begin a Business ....................................................... 67 Table V.6: Impacts on Business Openings and Closures ......................................................... 69 Table V.7: Timing of Business Development .......................................................................... 70 Table V.8: Impacts on Number of Businesses Operated ......................................................... 71 Table V.9: Employees and Payroll of Current or Most Recent Businesses ............................... 73 Table V.10: Sales, Expenses, and Salary Payments of Current or Most Recent Business .......... 74 Table V.11: Impacts on Business Earnings .............................................................................. 75 Table V.12: Ownership Structure of Most Recent Business at the Wave 2 Follow-up ............. 77 Table V.13: Financing of Most Recent Business ...................................................................... 78 Table V.14: Industry of Most Recent Business at the Wave 2 Follow-up ................................. 80 Table V.15: Challenges to Starting a Business .......................................................................... 81 Table V.16: Challenges to Starting a Business, By Success at Starting a Business ..................... 82 Table VI.1: Impacts on Employment Using The Survey Data ................................................. 89 Table VI.2: Impacts on Employment For Sample Receiving UI at GATE Application ........... 90 Table VI.3: Impacts on Wage and Salary Employment Using Administrative Data ................ 92 Table VI.4: Impacts on Months Employed ............................................................................. 95 Table VI.5: Impacts on Hours Worked ................................................................................... 97 Table VI.6: Impacts on Part-Time Employment ..................................................................... 98 Table VI.7: Impacts on Earnings Using Survey Data for the Full Sample .............................. 100 Table VI.8: Impacts on Earnings Using Survey Data for Sample Getting UI at Application .. 101 Table VI.9: Impacts on Survey-Reported Wage & Salary in 18 Months After RA ................. 103 Table VI.10: Earnings from Wage and Salary Jobs After RA Using Administrative Data ...... 104 Table VI.11: Earnings from Wage & Salary Jobs Before RA Using Administrative Data ....... 106 Table VI.12: Satisfaction With Employment at the Wave 2 Follow-up .................................. 108 Table VI.13: Current or Most Recent Wage & Salary Jobs at Wave 2 Follow-up ................... 110

Table VII.1: Impacts on Employment Receipt of UI Benefits Using Administrative Data .... 113 Table VII.2: Impacts on UI Benefits Received, Using Admin Data, by Subgroup and Site .... 115 Table VII.3: Impacts on Receipt of Unemployment Insurance Benefits Using Survey Data .. 116 Table VII.4: Impacts on Receipt of Public Assistance ........................................................... 117 Table VII.5: Impacts on Household Income and Spousal Earnings ...................................... 118 Table VIII.1: Program Features of Project GATE for UI Recipients .................................... 124 Table VIII.2: Impacts on Receipt of Unemployment Insurance Benefits .............................. 133 Table VIII.3: Impacts on Receipt of Public Assistance .......................................................... 134 Table A.1: Selected Background Characteristics of Program and Control Groups ................ 148 Table A.2: Response Rates .................................................................................................... 153 Table B.1: Rate of Nonresponse for Variables for Which Missing Values Were Imputed ...... 160 Table D.1: Impacts on Key Outcomes Under Different Specifications ................................. 172 Table D.2: Site Weights Under Alternative Specifications ..................................................... 173

LIST OF FIGURES
Figure III.1: Stages of Participation in Project GATE ............................................................. 25 Figure IV.1: Receipt of Any Self-Employment Services Between RA and Wave 2 Follow-Up . 46 Figure IV.2: Classes, Workshops, and Seminars Between RA and Wave 2 Follow-up ............. 48 Figure IV.3: Participation in Business Counseling Between RA and Wave 2 Follow-up .......... 49 Figure IV.4: Spending on Self-Employment Services Between RA and Wave 2 Follow-up ..... 52 Figure V.1: Business Ownership by Quarter............................................................................ 58 Figure V.2: Impacts on Business Ownership in the 18 Months After RA, By Site ................... 60 Figure V.3: Impacts on Business Ownership in the 6th Quarter After RA, By Site .................. 60 Figure V.4: Impacts in 18 Months After RA, By Site For Those Receiving UI at Application . 63 Figure V.5: Location of Current or Most Recent Business ...................................................... 74 Figure VI.1: Wage and Salary Job Employment by Quarter .................................................... 91 Figure VI.2: Impacts on Whether in Wage and Salary Job in 18 Months After RA, By Site ..... 91 Figure VI.3: Total Employment by Quarter ............................................................................ 93 Figure VIII.1: Impacts on Business Ownership after Random Assignment ........................... 127 Figure VIII.2: Impacts on Working for Someone Else after Random Assignment ................ 129 Figure VIII.3: Impacts on Working for Self or Someone Else after Random Assignment ..... 130 Figure VIII.4: Impacts on Earnings from Businesses after Random Assignment ................. 130 Figure VIII.5: Impacts on Earnings from Wage-and-Salary Jobs after Random Assignment 131 Figure VIII.6: Impacts on Total Earnings in Quarter after Random Assignment .................. 132

Evaluation of Project GATE i May 2008
EXECUTIVE SUMMARY
While many Americans dream about starting their own business and have the motivation to do so,
lack of business expertise and access to credit often prevent them from realizing their dreams.
Recognizing this untapped potential, the U.S. Department of Labor (DOL), Employment and
Training Administration, teamed with the Small Business Administration (SBA) to create a
demonstration project—Project GATE (Growing America Through Entrepreneurship)—designed
to help people create or expand their own business.
Project GATE was implemented in seven sites in three states— Minnesota, Pennsylvania, and
Maine—between fall 2003 and summer 2005. Almost anyone interested in starting or growing a
small business was eligible to participate in Project GATE. Participants were offered an initial
assessment of their business needs, classroom training, one-on-one business counseling, and
assistance in applying for business financing.
DOL’s One-Stop Career Centers were the gateways to the program. These centers, which provide a
wide range of services for job seekers and employers, conducted outreach for Project GATE and
hosted the program’s orientation sessions. Project GATE added another service—one that focused
on helping people become self-employed—to the One-Stop Career Centers’ arsenal of employment
services. By offering this service in One-Stop Career Centers, Project GATE intended to attract
new and more diverse customers.
IMPAQ International and its subcontractor, Mathematica Policy Research, designed and
implemented the evaluation of Project GATE to address the following questions:
Could Project GATE be replicated?
Was Project GATE effective in increasing business ownership, employment, and self-
sufficiency?
This report presents the findings from the evaluation and policy recommendations based on the
evaluation results.

Evaluation of Project GATE ii May 2008
PROJECT GATE DESIGN
Project GATE was designed to serve almost anyone, whether employed or unemployed, who was
interested in starting or expanding a small business. The program was open to anyone 18 years of
age or older who was lawfully able to work in the United States, resided in the state, and wished to
start or expand a business that was legal and appropriate for federal support. If these criteria were
met, no applicant was prevented from participating based on their particular business idea or on
their qualifications for starting a business.
Intake for Project GATE involved three steps. First, people interested in Project GATE registered
at a GATE kiosk at a One-Stop Career Center, at the GATE website, by mailing a postcard, or by
calling a toll-free number. Second, those who registered for Project GATE were asked to attend an
orientation session at a One-Stop Career Center. At the orientation, a video was shown that
described GATE services, the GATE application process, and both the positive and negative
aspects of self-employment. Finally, orientation attendees who wished to apply to Project GATE
were asked to complete an application package and mail it to IMPAQ International.
Project GATE offered three basic services to program participants:
Assessment. Participants were invited to meet with a counselor to determine the
participant’s service needs and the provider that would best meet those needs.
Training. Project GATE offered a wide variety of training courses, including: general
business courses; specific courses on such topics as how to deal with legal and
personnel issues; and specialized training courses on such topics as Quick Books.
Business Counseling. Participants were given the opportunity to meet with business
counselors for one-on-one assistance with their business, business idea, and/or
applications for a business loan.
In order to receive training or business counseling, participants were required to have an initial needs
assessment. However, Project GATE emphasized customer choice: individual participants were
not required to use any of these services. Each participant could decide to receive none of the three
services; only the assessment; the assessment but no training or business counseling; or the
assessment plus training and/or business counseling.

Evaluation of Project GATE iii May 2008
Project GATE was implemented at seven sites:
Philadelphia, Pennsylvania;
Pittsburgh, Pennsylvania;
Minneapolis/St. Paul, Minnesota;
Northeast Minnesota including Duluth, MN and Virginia, MN;
Portland, Maine;
Lewiston, Maine; and
Bangor, Maine.
The sites were selected to include both urban and rural ones. Three sites were in urban areas and
the remaining four were mostly rural—northeast Minnesota and the three sites in Maine.
EVALUATION DESIGN
The cornerstone of the evaluation of Project GATE was random assignment. A total of 4,198
applicants to Project GATE were randomly assigned to either the program group or the control
group. Members of the program group were offered GATE services; members of the control group
were not offered GATE services.
Random assignment ensured that the applicants assigned to the program group would, on average,
have the same observable and unobservable characteristics as applicants assigned to the control
group. As a result, any differences in outcomes between the program and control groups can be
directly attributed to Project GATE with a known degree of statistical precision.
While control group members could not participate in Project GATE, they were not prevented from
receiving any other self-employment services offered in the community. Therefore, this evaluation
does not address the impact of Project GATE compared to receiving no self-employment services.
Instead, it addresses the more policy-relevant question: What is the effect of adding Project GATE
to the array of self-employment services already offered in the community?
The impact evaluation examined whether Project GATE affected four main categories of outcomes:
(1) the receipt of self-employment services;
(2) business ownership;
(3) employment and earnings; and
(4) self-sufficiency.
Evaluation of Project GATE iv May 2008
To evaluate these outcomes and to give context to the findings, the evaluation used four sources of
data:
Participant Tracking System (PTS). The PTS is a web-based data collection system
designed for Project GATE to capture project-related data on all individuals who
expressed an interest in participating in Project GATE.
Site Visits. Four rounds of site visits were conducted. During these visits, interviews
were conducted with Project GATE administrators, instructors, business counselors,
and selected participants.
Two Follow-Up Surveys. The first telephone survey was conducted approximately 6
months after random assignment; a second survey was conducted approximately 18
months after random assignment. The sample frame included everyone who was
randomly assigned to either the program group or the control group. A total of 3,450
Wave 1 interviews were completed, yielding a survey response rate of 82 percent. The
Wave 2 survey yielded 3,039 completed interviews out of 3,450 attempted, for a
response rate of 88 percent. Combining both waves, the overall cumulative response
rate was 72 percent.
Unemployment Insurance (UI) Administrative Data. Quarterly wage records and
UI benefit data were collected for all GATE applicants for the time period covering the
12 months before random assignment and the 12 months following random
assignment.
IMPLEMENTATION ANALYSIS
A detailed implementation analysis, drawing on data from the application and orientation forms, the
PTS, and site visits drew the following conclusions:
Project GATE incorporated a broad array of service providers;
Training courses varied across sites;
A variety of outreach methods were used to attract applicants;
About three-quarters of the program group received classroom training or individual
counseling from Project GATE;
Project GATE participants received about 13 more hours of self-employment services than
control group members;

Evaluation of Project GATE v May 2008
The estimated cost of Project GATE per program group member based on the invoice data
was $1,321;
Project GATE attracted a broad range of applicants; and
Project GATE could be implemented on a wider scale.
IMPACT ANALYSIS
Overall impacts of Project GATE were estimated by comparing the mean value of each outcome
among those in the program group to the mean value of the outcome among those in the control
group. Impacts were also estimated by site and by subgroup. Impact estimates for the full sample
on the key outcomes are presented in detail in Chapters V, VI, and VII. Below is a summary of the
findings from the first 18 months of Project GATE. Please note that to measure the permanent
impacts of Project GATE, a longer observation period would be necessary.
Business Ownership - Project GATE had a small but significant impact on business
ownership. Project GATE increased the probability of owning a business during the 18-
month period after random assignment. Both the program and control groups experienced
a steep growth in business ownership very quickly after random assignment. By the third
quarter after random assignment, 43 percent of the program group and 37 percent of the
control group reported owning a business, a difference of 6 percentage points (statistically
significant at the 1 percent level). By the sixth quarter after random assignment, 44 percent
of the program group and 41 percent of the control group owned a business, a difference of
3 percentage points (statistically significant at the 10 percent level).
Total Employment - Project GATE had no significant effect on total employment.
Overall employment rates—including both working for oneself and working for someone
else—increased from about 70 percent in the first quarter after random assignment to 85
percent by the end of the follow-up period, but there were no significant differences
between the program and control groups in any of the six quarters. Project GATE did,
however, affect the type of employment. Compared to the control group counterparts,
Project GATE participants were more likely to be self-employed and less likely to be
employed in wage and salary jobs.

Evaluation of Project GATE vi May 2008
Earnings from Wage and Salary Jobs - Control group members earned more than
participants from wage and salary jobs. Based on survey responses, over the entire 18-
month follow-up period, Project GATE participants earned about $1,800 less than the
control group members, a difference that is significant at the 10 percent level. Based on
administrative data, however, participants earned only $200 less than control group members
over the first year after random assignment, a difference that is not statistically significant.
Earnings from Self-Employment - Project GATE had no impact on earnings from
self-employment. As most businesses were fledgling ventures, it is not surprising that
business earnings were low—on average both program and control group members received
less than $6,000 in total business earnings over the 18-month follow-up period. Average
business earnings did not differ significantly between members of the program and control
groups.
Total Earnings - Project GATE had a negative impact on overall earnings during
the follow-up period. Since Project GATE participants earned less from wage and salary
jobs than control group members and earned approximately the same amount from self-
employment, overall, Project GATE participants experienced significantly lower total
earnings.
Self-Sufficiency - Project GATE increased the receipt of UI benefits slightly. Project
GATE increased the amount of time spent on UI by about one week and increased the
amount of UI benefits received by about $340 per person. The project also increased the
amount of UI benefits received by those already receiving UI benefits when they applied to
Project GATE by about $605 per person.
Project GATE had no impacts on the receipt of public assistance or other
income. No impact on the likelihood of receiving public assistance, the amount of public
assistance benefits received, household income, or the earnings of the entrepreneur’s spouse
was detected.

Evaluation of Project GATE vii May 2008
SUBGROUP RESULTS
The results presented above reflect the impact of Project GATE on the full sample; that is, a
comparison of key outcomes for the full program group with the same outcomes for the full control
group. Program impacts for various subgroups were also examined. These subgroups included
those who were not employed at the time of application, those who were collecting UI benefits at
the time of application, and recent UI claimants. Moreover, since the design of Project GATE in
Minnesota is similar in many respects to the design of the Self-Employment Assistance (SEA)
program, the evaluation also examined in detail recent UI claimants in Minnesota. It should be
noted, however, that the design of Project GATE in Minnesota did not incorporate one important
feature of the SEA program: cost neutrality to the trust fund. That is, a requirement for the SEA
program was that total expenditures for UI benefits would not change as a result of the SEA
program; no such requirement was made for Project GATE. Furthermore, the sample size in
Minnesota is relatively small (n=459). Below, is a summary of the main findings for this group.
Project GATE had a large and statistically significant impact on business
ownership. Among recent UI claimants in Minnesota, Project GATE dramatically
increased the probability of owning a business during the 18-month period after random
assignment.
Project GATE had a strong positive effect on total employment. During the
second half of the observation period (Q4 – Q6), recent UI claimants in Minnesota
experienced strong and statistically significant employment gains relative to the control
group (7 to 9 percentage points).
Control group members earned more than participants from wage and salary
jobs. During the early quarters following random assignment (Q1- Q3), control group
members earned about $350 per quarter more than participants. In later quarters (Q4 -
Q6), there was no statistically significant difference in earnings from wage and salary
jobs.
Project GATE had no impact on self-employment earnings. Throughout the
observation period, participants and control group members had similar self-
employment earnings.

Evaluation of Project GATE viii May 2008
Project GATE increased the receipt of UI benefits significantly. Project GATE
increased by about three weeks the amount of time spent on UI over the follow-up
period and increased the amount of UI benefits received by about $1,240 per person.
Project GATE had no impacts on the receipt of public assistance or other
income. No impacts on the likelihood of receiving public assistance, the amount of
public assistance benefits received, household income, or the earnings of the
entrepreneur’s spouse were detected.
In summary, the results for recent UI claimants in Minnesota indicate positive impacts on business
formation and employment. With regard to earnings, however, the results are negative.
LESSONS LEARNED
The findings from this report suggest the following lessons:
1. Self-employment service programs could be offered at One-Stop Career Centers. While
One-Stop Career Centers are not traditionally known as places to go for self-employment services,
Project GATE was able, with some marketing, to draw entrepreneurs and prospective entrepreneurs
into the centers.
2. Self-employment services are readily available even in the absence of Project GATE.
The evaluation was designed to examine the impact of adding Project GATE to the array of self-
employment programs already available in the communities. Hence, control group members were
not prevented from receiving other services in the community. Many did—about 70 percent of
control group members received some self-employment services.
3. Increased business ownership may not lead to increased self-employment earnings in
the short run. Even though the program group was more likely to own a business, Project GATE
had no statistically significant impact on business earnings. Project GATE may have an impact on
business earnings later as the businesses mature.

Evaluation of Project GATE ix May 2008
4. Loss of earnings from wage and salary jobs is a significant short-run cost of a self-
employment program. While working on their businesses, GATE participants worked less in
wage and salary jobs than control group members, especially in the first few quarters after applying
to the program. During the same period, the additional earnings from businesses begun by GATE
participants did not yield enough revenue to offset this loss in earnings.
5. Self-employment programs have larger impacts on UI recipients. Impacts on business
ownership were higher for those who were receiving UI when they applied to Project GATE. Not
having a wage and salary job provided UI claimants with more time to work on their businesses,
while the UI benefits provided a regular income.
6. Eighteen months is too short to determine the effectiveness of Project GATE. The
Project GATE evaluation followed the sample members for 18 months after random assignment—
an extremely short period of time to receive services and build a successful business. A longer
follow-up period is needed for a definitive assessment of the effectiveness of Project GATE.

Evaluation of Project GATE 1 May 2008
CHAPTER I. INTRODUCTION
While many Americans dream about starting their own businesses and have the motivation to do so,
lack of business expertise and access to credit often prevent them from realizing their dreams.
Recognizing this untapped potential, the U.S. Department of Labor (DOL), Employment and
Training Administration, teamed with the Small Business Administration (SBA) to create a
demonstration project—Project GATE (Growing America Through Entrepreneurship)—designed
to assist people in creating or expanding their own businesses.
Funded by DOL, the Project GATE demonstration was implemented in seven sites in three
states—Pennsylvania, Minnesota, and Maine—between Fall 2003 and Summer 2005. Almost
anyone who was interested in starting or growing a small business was eligible to participate in
Project GATE. GATE participants were offered an assessment of their business needs, classroom
training, and one-on-one business counseling in developing their businesses and applying to the SBA
MicroLoan Program or other sources of business financing. Nonprofit community-based
organizations (CBOs) and the SBA’s Small Business Development Centers (SBDCs) provided the
services.
DOL’s One-Stop Career Centers were the gateways to the program. These centers, which provide a
wide range of services for job seekers and employers, conducted outreach for Project GATE and
hosted the program’s orientation sessions. Project GATE added another service—one focused on
helping people become self-employed—to the One-Stop Career Centers’ arsenal of employment
services. By offering this service in One-Stop Career Centers, Project GATE intended to attract
new and more diverse customers.
This report presents the findings of an evaluation of Project GATE. It addresses three main
questions:
(1) Can Project GATE be replicated?
(2) Is Project GATE effective in increasing business ownership, employment, and self-
sufficiency?

Evaluation of Project GATE 2 May 2008
(3) Are the benefits of Project GATE commensurate with its costs?
The cornerstone of the evaluation is the random assignment of 4,198 eligible Project GATE
applicants to either a program group or a control group. Program group members were offered
Project GATE services; control group members were not. Using two waves of surveys and
Unemployment Insurance (UI) administrative data, the outcomes of both the program and control
group members were observed for about 18 months after random assignment.
This chapter begins with a discussion of the policy interest in self-employment programs. It then
describes the existing array of services available to provide self-employment assistance, prior
research on the effectiveness of programs to promote self-employment, and how Project GATE is
distinctive from the services already available. The chapter ends with a description of the
organization of the rest of the report.
1.1 Reasons to Support Self-Employment
Self-employment plays a key role in today’s economy. About 11 percent of the nonfarm labor force
work for themselves and this proportion has been growing since the 1970s (Fairlie and Meyer 2000).
Moreover, it has been argued that small businesses create a large share of new jobs and contribute to
innovations in products and production processes (Birch 1979; Lerner 2002).
Some workers view self-employment as a desirable substitute for, or supplement to, wage and salary
employment.1 Some even view it as a way out of poverty when they cannot find a desirable wage
and salary job. Some research suggests that unemployed workers are more likely than wage and
salary earners to enter self-employment (Meager 1992; Rissman 2003). While self-employment is
not for everyone, many Americans do want to be self-employed. Some have a passion for a
particular business idea, while others want to be their own bosses, have no access to wage and salary
jobs in which they can use their skills, and/or desire the flexibility of self-employment. These
people often are willing to work hard and have specific skills, interests, and talents they can use in a
business.
1 Throughout this report, the term wage and salary is used to describe jobs in which people work for someone else.

Evaluation of Project GATE 3 May 2008
For many, however, lack of both business knowledge and access to credit pose significant barriers to
self-employment. This lack of knowledge may encompass marketing, financing, understanding
regulations, developing a business plan, or other aspects of starting and running a business.
Disadvantaged populations in particular are less likely to have access to the information sources that
provide such knowledge and skills (Brush 1990; Gould and Parzen 1990; Keeley 1990). Many
people may need loans to start their businesses but have little collateral and poor or no credit
histories. Moreover, commercial banks are reluctant to make loans to small, risky ventures.
To address these obstacles to self-employment, programs have been developed to provide
classroom training, business counseling, and/or small loans to entrepreneurs. While many of these
programs are open to everyone, they are often focused on the unemployed, welfare recipients, or
other disadvantaged groups.
1.2 Availability of Assistance for Self-Employment
In the late 1970s and early 1980s, several European countries established programs to help
unemployed workers become self-employed. Most of these programs provided either income
support or seed capital, together with some training or business counseling. The Chomeur
Createurs (Unemployed Entrepreneurs) program in France, implemented nationally in 1980, allowed
persons to collect unemployment benefits in a lump sum to finance businesses. The Enterprise
Allowance Scheme, implemented nationally in Britain in 1983, provided business counseling and an
allowance roughly equal to unemployment benefits for up to one year (Robinson 1993).
In the United States, the past two decades have seen a rapid increase in programs designed to assist
people in starting their own businesses. The number of programs offering training, business
counseling, or loan assistance increased from a handful in 1982 to nearly 700 in 2002 (Walker and
Blair 2002). Frequently administered by community action groups, community development
corporations, or women’s economic development centers, the programs target mainly low-income
populations, the unemployed, welfare recipients, refugees, other disadvantaged groups, and women.
Funding for these programs comes from federal, state, or local governments, as well as private
foundations.

Evaluation of Project GATE 4 May 2008
Organizations partially funded by SBA—such as SBDCs and Business Information Centers—also
provide assistance to people interested in starting or expanding businesses. SBDCs, often associated
with a college or university, offer one-on-one business counseling and training in business
development. The Service Corps of Retired Executives (SCORE) is also a partner of the SBA.
Composed of former businessmen and businesswomen, SCORE provides free one-on-one
counseling to those interested in starting businesses. Business Information Centers provide
resources for small business start-up and development, including computer hardware and software; a
library of magazines, books, and videos; and on-site counseling through SCORE.
The SBA has also developed loan programs for small businesses. The most relevant of these for
small start-up businesses is the SBA MicroLoan Program. Under this program, loans of up to
$35,000 are made by nonprofit CBOs.
As a response to positive findings from demonstrations of self-employment programs for UI
recipients, Congress in 1993 authorized states to establish Self-Employment Assistance (SEA)
programs for UI recipients. The authorization was for a five-year period, after which DOL was
required to submit a report to Congress on the status of the programs.
The report to Congress (Vroman, 1997) recommended permanently adding SEA to the array of
programs assisting the unemployed because SEA increased the likelihood of self-employment. The
states with functioning SEA programs served a client base that was older, more highly educated,
with lower minority representation, and more from professional, technical, and managerial
occupations than the UI population as a whole. In 1998, Congress passed new legislation
permanently authorizing SEA programs.
SEA programs provide training and business counseling in self-employment. They also pay the UI
recipient an SEA allowance equal to the participant’s UI benefits, even though the participant does
not need to search for work and can refuse a job offer. The amount of the allowance is not affected
by self-employment income.
Although the SEA legislation authorized all states to implement SEA programs, a majority of states
chose not to implement them. Since its inception, only 11 states passed enabling legislation, and 8
states implemented SEA programs: California, Delaware, Maine, Maryland, New Jersey, New York,

Evaluation of Project GATE 5 May 2008
Oregon, and Pennsylvania. California, however, terminated its program in July 1998. Pennsylvania’s
funding for its SEA program has been intermittent.
1.3 The Entrepreneurial Population
Approximately 11 million individuals in the U.S. are actively working to start a small business. To
study this population, the Panel Study of Entrepreneurial Dynamics (PSED) collects data on the
process of business formation using a nationally representative sample of nascent entrepreneurs.
The first wave (PSED I) began with a telephone screening interview in 1998-2000 which identified a
cohort of 830 individuals actively engaged in creating a small business. Three follow-up interviews
were conducted. Data collected included demographic variables, activities during business start-up,
and characteristics of new firms. A second wave (PSED II) began with a screening interview in
2005-2006 that identified a new cohort of 1,214 nascent entrepreneurs; two follow-up interviews are
administered, at 12 and 24 months.
An analysis of the PSED I data (Gartner et al. 2004) found that the median amount of time between
the first organizing activity performed to start a business and the first receipt of money, income, or
fees from the sale of goods and services was 25 months. A number of different activities may
constitute the first organizing activity, such as buying or leasing equipment, facilities or property; or
establishing credit from a supplier. The PSED I data indicate that among the U.S. entrepreneurial
population as a whole in 1999, the median amount of time between the first organizing activity and
when monthly revenues exceeded monthly expenses was 38 months.
Gartner et al. (2004) also analyzed the demographic data from PSED II. The demographic
characteristics of these individuals are shown in Table I.1. For comparison purposes, we also
present the demographic characteristics of Project GATE applicants.
Approximately two-thirds (64%) of the entrepreneurial population in the U.S. are male and
approximately two-thirds (65%) are white. The percentages are somewhat lower for the GATE
sample with more than half (54%) male and more than half (57%) white. In the U.S., approximately
one out of six people (16%) is Hispanic; among the GATE sample2, a much smaller proportion
2 In this report, “GATE sample” refers to the group of individuals who were randomly assigned to either the Program group or the Control group. “Participants” refers to the individuals who were randomly assigned to the Program group. “Respondents” refers to the individuals who were administered a follow-up survey.

Evaluation of Project GATE 6 May 2008
(5%) is Hispanic. The vast majority of both groups (over 90%) have at least a high school diploma
and a majority has some college education.
Table I.1. Demographic Characteristics of the Entrepreneurial Population
U.S. Entrepreneurial
Population* GATE*
Gender Male 64% 54% Female 36% 46% Race White 65% 57% Black 18% 31% Other 16% 11% Hispanic Descent Hispanic 16% 5% Non‐Hispanic 84% 95% Age 18‐29 31% 13% 30‐44 38% 44% 45‐64 29% 41% 65+ 3% 1% Education Less than HS 8% 4% High School 23% 22% Some College 31% 37% College 26% 18% Post‐Graduate 13% 19% Marital Status Married 57% 43% Never Married 30% 30% Other 14% 26%
Source: Panel Study of Entrepreneurial Dynamics (PSED II), Project GATE PTS Data
* Percentages may not sum to 100 due to rounding or missing values.

Evaluation of Project GATE 7 May 2008
1.4 Prior Research on Effectiveness of Self-Employment Programs
Much of the development of programs to help people become self-employed has been shaped by
research on their effectiveness. This research has shown that self-employment programs can
improve labor market outcomes. Classroom training and one-on-one business counseling have been
found to be key components of these programs.
In the late 1980s, an evaluation of self-employment programs in two states, Massachusetts and
Washington, was conducted in the UI Self-Employment Demonstration (Benus et al. 1995). The
goal of the demonstration in both sites was to help UI recipients create their own jobs by starting
businesses. In both states, UI recipients were required to attend workshops on issues related to
business start-up and were offered financial assistance. The projects differed between the states in
two important ways. First, they differed in their target populations. In Massachusetts, the project
was offered only to those new UI claimants identified using a statistical profiling model as being
likely to exhaust their benefits; in Washington, the project was offered to most new UI claimants.
Second, following the French model, participants in Washington could receive their remaining
available UI benefits in one lump-sum payment after meeting certain business milestones. In
contrast, following the British model, participants in Massachusetts received periodic payments, but
no lump sum.
As with Project GATE, the two demonstrations were evaluated using an experimental approach.
Applicants were randomly assigned to either a program group or a control group. Members of the
program group could participate in the UI Self-Employment program, while control group members
could not. Approximately 1,200 sample members (in both program and control groups) were
followed up in Massachusetts for about 31 months, and approximately 1,500 sample members in
Washington were followed up for about 33 months. The findings from these evaluations were
generally positive but differed somewhat between the two states:
In Massachusetts, program group members were more likely than control group members
to have a spell of self-employment during the follow-up period. However, the impact did
not persist. By the end of the follow-up period, a little more than 30 months after random
assignment, there were no differences between program and control group members in the
prevalence of self-employment in Massachusetts. Combined self-employment and wage
and salary earnings for program group members was about $6,000 higher than combined

Evaluation of Project GATE 8 May 2008
earnings for control group members over the 31 months after random assignment.
However, this resulted from an increase in earnings from jobs in which participants worked
for someone else; self-employment earnings did not increase. In a benefit-cost analysis, the
Massachusetts demonstration yielded net benefits to society and to the government because
of the increase in earnings.
In Washington, program group members were also more likely than control group
members to have a spell of self-employment sometime during the follow-up period. Unlike
in Massachusetts, the impact did persist and the increased self-employment led to increased
self-employment earnings. This increase in self-employment earnings, however, was almost
completely offset by a decrease in earnings from wage and salary employment, so it did not
lead to an increase in total earnings. The demonstration yielded net benefits to society, but
a net cost to the government.
In 1987, the U.S. Department of Health and Human Services approved a demonstration project—
the Self-Employment Investment Demonstration (SEID)—designed to test the viability of self-
employment as a means of helping welfare recipients. Five states implemented and funded the
model: Iowa, Maryland, Michigan, Minnesota, and Mississippi. The SEID model contained four
basic components: (1) business training, (2) self-esteem training, (3) business counseling, and (4)
assistance in securing business financing. Unlike the UI Self-Employment Demonstration, SEID
did not include an evaluation of the impacts of the programs, although some followup of outcomes
was conducted. Of the 1,300 people who enrolled in SEID, 408 started a business during the
demonstration, and about half of the participants were able to leave welfare (Raheim and Alter 1998;
Guy and Fink 1991). The demonstration suggested that when well-targeted and focused, programs
to help people become self-employed could assist some low-income people in achieving economic
self-sufficiency (Servon and Bates 1998).
In a nonexperimental evaluation of the effectiveness of the SEA program in Maine, New Jersey, and
New York, Kosanovich and Fleck (2001) compared the outcomes of SEA participants with those of
persons who were eligible for SEA but decided not to participate in the program. The evaluation
found that two to three years after program enrollment, SEA participants were much more likely to
be self-employed, were more likely to be employed in either their own businesses or in regular wage
and salary jobs, and were more satisfied with their work than were people who were eligible for SEA

Evaluation of Project GATE 9 May 2008
but declined to enroll. They also, on average, received more UI benefits. These findings, while
suggestive, should be interpreted with caution. The differences in outcomes may be due to
unobserved differences in the characteristics of SEA participants and the eligible nonparticipants
rather than to impacts of the program itself.
1.5 The Contribution of Project GATE
DOL contracted with IMPAQ International and its subcontractors3 to design a project that
provided participants with training and business counseling, including help in applying for business
loans. The project sought to increase employment, earnings, and self-sufficiency. By promoting
small businesses and the jobs they create, Project GATE also aimed to promote economic
development in some low-income areas.
Most communities have organizations that provide assistance to people who want to start their own
businesses. Project GATE used many of those organizations to provide similar services. However,
Project GATE differs from the programs already available at the sites in the following ways:
One-Stop Career Centers Played a Key Role – The goal of One-Stop Career Centers is to
provide a wide range of services to assist job seekers in finding employment and to aid
employers in finding employees. While some centers provide information about the SEA
program or other related programs, many provide little or no information about self-
employment programs. Most of the training funded out of One-Stop Career Centers
focuses on developing skills for a particular wage and salary occupation.
Project GATE was viewed as another service to be added to the array of employment
services already provided by the workforce investment system. The One-Stop Career
Centers were the “first stop” in the provision of GATE services. They conducted outreach
by housing electronic kiosks with information about Project GATE within the centers
themselves, placing brochures about GATE in their resource rooms, displaying posters, and
describing the program in orientations. The One-Stop Career Centers also hosted a
mandatory orientation for those interested in Project GATE.
3 Mathematica Policy Research, Inc., Battelle Memorial Institute, and the National Center on Education and the Economy.

Evaluation of Project GATE 10 May 2008
Outreach Was Much More Extensive – Most self-employment service providers do not
conduct extensive outreach. People usually find out about their services through their
websites or through word of mouth. In contrast, Project GATE used a broad outreach
campaign that included paid marketing campaigns, public service announcements, notices
about Project GATE inserted in the envelopes containing UI checks, and information about
the project in the form of posters and flyers at all One-Stop Career Centers.
GATE Assessment Staff Matched and Referred Participants to Providers – Providers
of self-employment services differ in the services they provide and in how they provide
those services. Some focus on providing classroom training; others focus on providing
business counseling. Some providers are more experienced at providing services to well-
educated clients; others are better able to help disadvantaged populations.
Most self-employment providers serve any participant and refer participants to another
provider only for services that they do not provide (such as business loans). Therefore, it is
often up to participants to find the provider that best meets their needs. One of the
innovative aspects of Project GATE was that it involved an individualized needs assessment
and referral to providers. Soon after their eligibility for Project GATE was determined,
participants were invited to meet one-on-one with a trained business counselor to talk about
their business ideas and the challenges they faced in starting a business. As a result of the
assessment, participants were then directed to the services and the GATE providers that
would best meet their needs.
GATE Participants Did Not Pay for Services – Most service providers charge a fee for
their services. SBDCs do not charge for one-on-one business counseling but do charge for
training. CBOs usually charge a fee, often on a sliding scale. In contrast, Project GATE
services were provided free of charge to participants.
Project GATE Did Not Screen Out Applicants Based on Likelihood of Success –
Many programs that provide self-employment services screen out, or strongly discourage,
applicants they view as unlikely to succeed. Reasons for screening out may include the
multiple barriers a participant faces—such as lack of capital, lack of skills or knowledge to
produce the services or product, naiveté about the challenges of starting a business, or an
unrealistic business idea.

Evaluation of Project GATE 11 May 2008
Project GATE accepted into the program everyone who met the eligibility criteria—in order
to be randomly assigned, an applicant was required to be at least 18 years old, lawfully able
to work in the United States, and seeking to start or expand a business that was legal and
appropriate for federal support. If these criteria were met, no applicant was prevented from
being randomly assigned based on a particular business idea or his or her qualifications for
starting a business.
1.6 Organization of the Rest of the Report
This report provides a comprehensive assessment of Project GATE. The next chapter describes the
evaluation design (Chapter II). A discussion of the implementation of Project GATE follows
(Chapter III). The next four chapters describe the impacts of Project GATE on the receipt of self-
employment services (Chapter IV), self-employment (Chapter V), employment in wage and salary
employment and total employment (Chapter VI), and self-sufficiency (Chapter VII). The impact of
Project GATE on the unemployed is discussed in Chapter VIII. The report ends with a summary
of the lessons learned (Chapter IX).

Evaluation of Project GATE 12 May 2008
CHAPTER II. EVALUATION DESIGN
The evaluation of Project GATE addresses three questions:
1) Did Project GATE work?
2) For whom did it work?
3) Under what circumstances did it work?
The evaluation also addresses how Project GATE was implemented and whether it could be
replicated on a wider scale, as well as whether Project GATE met its objectives of increasing
business ownership, increasing employment, and improving self-sufficiency. The evaluation
explores whether the impacts of Project GATE vary by where and how it is implemented. It also
explores whether the impacts of Project GATE vary between various population subgroups.
This chapter describes the design of the evaluation of Project GATE. It begins by describing the
demonstration sites. It then describes random assignment, sample development, the approaches to
conducting the implementation, and the impact analysis.
2.1 The Demonstration Sites
Project GATE was implemented in seven sites:
Philadelphia, Pennsylvania – At this site, five One-Stop Career Centers and three
nonprofit CBOs participated in Project GATE.
Pittsburgh, Pennsylvania – At this site, seven One-Stop Career Centers and the
Duquesne University SBDC participated in Project GATE.
• Minneapolis/St. Paul, Minnesota – At this site, four One-Stop Career Centers (two
in Minneapolis and two in St. Paul), the University of St. Thomas SBDC, and two
CBOs participated.
Northeast Minnesota – The northeast Minnesota site included the cities of Duluth
and Virginia and surrounding areas. Two One-Stop Career Centers, the University of
Minnesota at Duluth SBDC, and one CBO participated.

Evaluation of Project GATE 13 May 2008
Maine – Project GATE was implemented in three sites in Maine. These sites included
the cities of Bangor, Portland, and Lewiston and surrounding areas. Three One-Stop
Career Centers participated, as did the University of Southern Maine SBDC, three
CBOs, and the Center for Entrepreneurship at the University of Southern Maine, in
partnership with the Heart of Maine organization. For analytical purposes, the three
sites in Maine are grouped together into one because of their geographic proximity and
because Maine implemented Project Gate in the three sites as a single administrative
entity.
The sites were selected purposively to include three sites in urban areas and four sites, northeast
Minnesota and three sites in Maine, that comprise largely rural areas.
2.2 Random Assignment and Sample Development
The cornerstone of the evaluation of Project GATE is random assignment. Those who attended a
GATE orientation, submitted a GATE application, and were found eligible for Project GATE were
randomly assigned to either the program group or the control group. Members of the program
group were offered Project GATE services; members of the control group were not offered Project
GATE services.
The use of random assignment ensures that the applicants assigned to the program group will have,
on average, the same observable and unobservable characteristics as applicants assigned to the
control group. As a result, any differences in outcomes between the program and control groups
can be directly attributed to Project GATE with a known degree of statistical precision. Without
random assignment, there is always a concern that any differences in outcomes between the program
and control group members are a result of differences in their underlying characteristics rather than
program participation.
2.2.1 The Counterfactual
The goal of any program evaluation is to provide an estimate of the effects of a program by
comparing outcomes of program participants to what would have happened to them in the absence
of the program. Since it is impossible to do this, an experimental evaluation uses the control group

Evaluation of Project GATE 14 May 2008
as a counterfactual that credibly represents what would have happened to program participants had
they not been offered GATE services.
Control group members could not participate in Project GATE—they could neither receive a
GATE assessment nor be referred to a GATE provider for free business counseling and/or
classroom training. However, control group members were not prevented from receiving any other
self-employment services offered in the community. Hence, they could receive services from
providers that were not chosen for Project GATE or did not want to participate in Project GATE.
They could even receive services from the GATE providers. However, control group members
needed to find these providers on their own and may have had to pay for the services. The names
of the GATE providers were provided only to GATE program group members after random
assignment; control group members were never given the names of any self-employment service
providers.
The services that the control group members receive—the counterfactual—determine the research
questions that the evaluation addresses. Hence, it is important to note that this evaluation does not
address the impact of Project GATE compared to receiving no self-employment services. Instead, it
addresses the more policy-relevant question: What is the effect of adding Project GATE to the
array of self-employment services already offered in the communities?
2.2.2 Random Assignment Procedures
Individuals interested in participating in Project GATE were asked to register for the program and
attend an orientation. At the orientation, they were shown a video that described the challenges of
self-employment, the services provided by Project GATE, and the evaluation, including random
assignment. Those still interested in the program after the orientations were asked to complete a
nine-page application package. This package asked for information to determine eligibility for
Project GATE, including information on the characteristics of the applicant and his or her business
idea, detailed contact information, and the signature of the applicant confirming willingness to
participate in the evaluation. The package was mailed to the evaluation contractor, which checked
that the applicant was eligible, had completed most of the application package, had consented to
participate in the study, and had not applied to Project GATE previously. Once the applicant had
passed these checks, he or she was randomly assigned to the program group or the control group,

Evaluation of Project GATE 15 May 2008
each with a probability of 50 percent. The evaluation contractor then notified the applicant by mail
of their assignment to either the program group or the control group and sent a list of new program
group members to the service providers. After the orientation, applicants took an average of 2.0
weeks to complete an application and mail it to the evaluation contractor. On average, they were
randomly assigned less than one week later.
2.2.3 Sample Enrollment
Nearly all GATE applicants were randomly assigned. Only three applicants were found ineligible,
because their business idea was inappropriate for federal funding. In total, 4,198 applicants were
randomly assigned between September 2003 and July 2005 (see Table II.1); just under half were
assigned to the program group and just over half were assigned to the control group.
Table II.1: Number of GATE Applicants by Site
Number of Applicants
Site Total Program Group Control Group
Philadelphia 1,179 601 578
Pittsburgh 595 288 307
Minneapolis/St. Paul 1,654 834 820
Northeast Minnesota 203 97 106
Maine 567 275 292
Total 4,198 2,095 2,103
More than two-thirds of all applicants were in two sites—Philadelphia and Minneapolis/St. Paul.
Less than one-fifth of the applicants were from the rural sites—northeast Minnesota and the three
sites in Maine. This variation may be explained by various factors, including differences in density
of population, business culture, economic environment, and demographic characteristics of the local
population.
As expected, random assignment produced program and control groups whose members had similar
background characteristics at baseline (Appendix Table A.1). Of the 121 characteristics examined,

Evaluation of Project GATE 16 May 2008
program and control group members differed in 8 characteristics at the 5 percent level of statistical
significance, which is close to what would be expected by chance. Of relevance, program group
members were slightly younger, had received fewer weeks of unemployment insurance (UI) benefits
in the past year, and were slightly less likely to have ever been self-employed. These differences
were accounted for in the impact analyses.
2.2.4 Business Partners
Examination of the application data revealed that some applicants applied to Project GATE with
their business partners. Of the 4,198 applicants, 245 applicants (about 6 percent of all applicants)
reported on their application packages a plan for a business that was identical to that of another
applicant. All but about 2 percent of these applicants lived with the person who had the same plan.
While about 91 percent of these applicants had one other partner who applied, 9 percent were in
partnerships with 2 to 4 other applicants. The 245 applicants represented 118 business partnerships.
The participation of people who work together on a business raises a concern about contamination
in the evaluation. A control group member who had a business partner in the program group could
benefit from any services or information received by his or her partner. Some GATE providers
would even allow business partners to accompany the GATE participant to classes and business
counseling sessions.
To avoid the problem of control group contamination, all members of the business partnership were
deleted from the sample if: (a) at least one member of the business partnership was in the control
group, (b) at least one other member was in the program group, and (c) these two individuals lived
at the same address or submitted the same business idea on their GATE Application Form. Of the
118 business partnerships, 56 (47 percent) had at least one program group member and one control
group member and were removed from the sample. These 56 business partnerships consisted of
120 applicants. The remaining sample of 4,078 people contained only business partners who were
either all in the program group or all in the control group and hence were not at risk of
contamination. The remaining sample members in business partnerships were representative of the
sample members who were removed from the sample and were reweighted such that the weighted
sum of business partnerships was the same as it was in the original sample.

Evaluation of Project GATE 17 May 2008
2.3 Implementation Analysis
The goals of the implementation analysis are to describe how Project GATE was actually
implemented in the demonstration and how it differed by site to derive lessons for other sites
interested in implementing Project GATE or a similar program and to determine whether Project
GATE could be successfully replicated elsewhere.
The analysis uses data collected from the following sources:
GATE Application Package and Orientation Forms – All Project GATE
applicants completed an application package before they were randomly assigned. The
application package provided a rich source of data on the characteristics of the
applicants just prior to random assignment. An orientation form completed by
everyone who attended an orientation provided information on people who attended
the orientation but did not complete an application. In addition, all service providers
collected information on the results of the assessments and the type and intensity of
services the program group members received from Project GATE. These data were
collected by the Participant Tracking System (PTS). A final extract from the PTS was
taken on December 31, 2005. GATE applicants were randomly assigned during the
period from late September 2003 through early July 2005. Hence, at least six months
of data were available on all program group members.
Site Visits – Two rounds of site visits were conducted for the purpose of collecting
detailed information on the implementation of the programs. These site visits took
place in Fall 2004 and Spring 2005. During these site visits, interviews were conducted
with administrators, instructors, and business counselors at the service providers and
observations were made of orientations, assessments, classroom training, and one-on-
one counseling. GATE service providers assisted in the selection of 18 program
participants who were then interviewed in depth about their experiences in Project
GATE and in starting their businesses. During the first round of site visits, eight focus
groups of randomly selected program participants were conducted, with at least one
focus group occurring in each site.
Evaluation of Project GATE 18 May 2008
The findings from the implementation analysis are summarized in Chapter III and discussed in detail
in Bellotti et al (2006).
2.4 Impact Analysis
The main goal of the impact analysis is to determine whether Project GATE was effective in
meeting its goals. Hence, it examines whether Project GATE affected four main categories of
outcomes: (1) the receipt of self-employment services; (2) business ownership, including attempts to
start a business, success in starting a business, and the characteristics of the businesses started; (3)
employment and earnings in both wage and salary jobs and in self-employment; and (4) receipt of
UI benefits, total household income, public assistance, and spouses’ earnings. The analysis also
examines whether these impacts differ for different groups of applicants and whether they varied by
where and how Project GATE was implemented.
The impact analysis draws on two additional sources of data other than the PTS and the site visits:
Two Follow-Up Surveys – A first wave (Wave 1) of telephone interviews was
attempted with all program and control group members approximately 6 months after
random assignment. A second wave (Wave 2) of telephone interviews was then
attempted with respondents to the Wave 1 survey approximately 18 months after
random assignment. These surveys provide detailed information on outcomes such as
the receipt of services, the completion of business plans and applications for loans,
business development, employment, income, and receipt of UI and other benefits. A
total of 3,450 Wave 1 follow-up interviews were completed, yielding a survey response
rate of 82 percent. The Wave 2 follow-up resulted in 3,039 completed interviews, with
a survey response rate of 88 percent of Wave 1 respondents and 72 percent of all
applicants. The response rates were slightly higher for the program group than for the
control group. More details on the response rates are provided in Appendix A.
UI Administrative Data. – To supplement data collected through the follow-up
surveys, state UI administrative records for all applicants were collected. Quarterly
wage records and UI benefit data were collected for the time period covering the 12
months prior to random assignment and the 12 months following random assignment.

Evaluation of Project GATE 19 May 2008
More information about data collected for the impact analysis is provided in Appendix A.
Since applicants were randomly assigned, unbiased estimates of the impact of Project GATE can be
obtained by comparing the average outcomes for those in the program and control groups. To
improve the precision of the estimates and correct for any differences in the sample members’
characteristics that occurred by chance between the two groups, impacts were estimated using
regression models. With each impact estimate is an indication of whether the estimate passes a two-
tailed t-test at the 1 percent, 5 percent, or 10 percent levels of significance. Appendix B provides
detail regarding weighting and imputation procedures, Appendix C provides more details of the
impact estimation, and Appendix D discusses the sensitivity of the findings to the estimation
method.
This report presents estimates of the impacts of Project GATE on all program group members
rather than impacts on those program group members who actually received Project GATE
services. Hence, it is an estimate of the offer of Project GATE services rather than the receipt of
services. However, most participants did receive some services—90 percent of those who were
randomly assigned to the program group received at least an assessment from Project GATE.
Estimates of the impacts on the individuals who actually received services can easily be calculated by
dividing the estimates of the impacts on participants by 0.9 and adjusting the standard errors
accordingly (Bloom 1984; Angrist et al. 1996; Heckman et al. 1998).
The report focuses mainly on overall differences in outcomes between program and control groups
for all of the demonstration sites combined. Each sample member is given equal weight. Hence,
the overall impacts are disproportionately affected by the impacts in Minneapolis/St. Paul and
Philadelphia. Generalizing the results of this report to a larger scale implementation of Project
GATE would require assuming that sites that are like the GATE Minneapolis/St. Paul and
Philadelphia sites would have more participants than sites like the GATE Pittsburgh and rural sites.
If instead each site were given an equal weight, the magnitudes of the impacts would change, but as
discussed in Appendix D, the major findings of the report would remain unchanged.
To assess the variability of the impacts across sites and sample member characteristics, estimates are
presented separately for each study site and for subgroups defined by the following characteristics of

Evaluation of Project GATE 20 May 2008
the sample members as of random assignment: age, gender, race/ethnicity, education level, wage and
salary employment, self-employment, receipt of UI benefits, and self-employment prior to random
assignment. Most of the outcomes considered will be defined for all members of the program and
control groups. However, in some cases the outcomes compare members of the program and
control groups within a particular subset of the sample. In particular, this approach is adopted when
the subsets are defined by the outcome. These differences across subsets defined by outcomes may
be referred to as “conditional differences.” For example, consider the types of businesses formed
by those who start businesses. As the sample members who started businesses are not random, and
participation in Project GATE may affect who starts a business, the differences in the types of
businesses formed by people in the program group and those formed by people in the control group
should not be interpreted as an “impact” of Project GATE. Care should be taken in the
interpretation of these types of differences. The differences in the types of businesses formed, for
example, could have occurred because Project GATE changed the types of businesses formed or
Project GATE could have led to different types of people starting businesses.
Survey data from Wave 1 are available for the 82% of the GATE sample who completed the Wave 1
interview. Survey data from both Wave 1 and Wave 2 are available for the 72% of GATE sample
who completed both interviews. If those in the program group who respond to a survey differ from
those in the control group who respond to the survey, impact estimates may be biased. To adjust
for observable differences in the baseline characteristics of survey respondents and nonrespondents,
and to reduce the potential for biased estimates, the survey data are weighted. The weights are
designed so that the survey respondents represent all the GATE applicants who were randomly
assigned in each research group and site. Some survey respondents did not respond to some
questions (they may not remember the date they began a job, for example). For those missing data
items, standard imputation methods were used to impute a value. Appendix B provides more details
of the weighting and imputation procedures.
In this chapter, the overall design of Project GATE was described. The next chapter addresses the
implementation of Project GATE. It discusses project demonstration sites; GATE service
providers; intake procedures; outreach and recruitment; services offered; and the Participant
Tracking System.

Evaluation of Project GATE 21 May 2008
CHAPTER III. HOW WAS PROJECT GATE IMPLEMENTED?
Project GATE was designed to provide training and business counseling to a broad group of
entrepreneurs. As Project GATE was a new demonstration program, an important goal of the
evaluation was to document how Project GATE was actually implemented and to determine
whether it could be replicated. Hence, if policymakers wish to replicate the program on a wider
scale, they will know whether it is possible and, if so, how it should be implemented. This chapter
describes the implementation of Project GATE in the individual sites. The key findings are
presented in the box below.
Understanding the implementation of Project GATE is critical for three main reasons. First, it
addresses whether Project GATE could be replicated on a wider scale. Further, if Project GATE is
to be replicated, the implementation analysis provides a program blueprint for providers and
policymakers. Second, the implementation analysis provides information to policymakers about
who is served by Project GATE. Third, understanding the program’s implementation assists in the
interpretation of the impact findings—it can help explain the magnitude of impacts and the
differences in impacts across sites or population subgroups.
Key Findings: Implementation of Project GATE
Project GATE was implemented successfully across a variety of sites, suggesting that it could be replicated on a wider scale.
GATE outreach needed to go beyond the One-Stop Career Centers to meet the enrollment targets. In some sites, a mass media campaign was necessary.
GATE service providers and the training offered varied both within and between sites. While some sites offered a wide range of training courses, the choice was more limited in others. CBO and SBDC providers in each site provided different services.
About 90 percent of all GATE program group members received an assessment and about 75 percent received training, business counseling, or both.

Evaluation of Project GATE 22 May 2008
This chapter discusses the main findings from the implementation analysis of Project GATE.4 The
chapter begins by discussing the characteristics of the demonstration sites and the service providers
participating in the program. Next, it describes the intake procedures used to enroll interested
individuals and the specific outreach and recruitment strategies that were used to attract prospective
sample members to the demonstration. The chapter then discusses the services offered by Project
GATE.
3.1 Demonstration Sites
Project GATE was implemented in seven sites in three states: Philadelphia, Pennsylvania;
Pittsburgh, Pennsylvania; Minneapolis/St. Paul, Minnesota; northeast Minnesota; and three sites in
Maine. The sites in Maine included the cities of Bangor, Portland, and Lewiston, and the counties of
Penobscot, Androscoggin, and Cumberland.
These sites, chosen purposively, differ in several key ways. Some key characteristics of the general
population in the communities in which Project GATE was implemented are presented in Table
III.1. First, three sites are urban (Philadelphia, Pittsburgh, and Minneapolis/St. Paul) and four sites
are principally rural (northeast Minnesota and the three sites in Maine). Second, all sites except
Philadelphia have predominantly white populations with small Hispanic/Latino populations. In
contrast, the population in Philadelphia is 43 percent African American and 10 percent
Hispanic/Latino. The Minneapolis/St. Paul area has a substantial Asian population. Third, the sites
vary in the average education and income of their populations. Minneapolis/St. Paul has a more
educated and higher-than-average–income population, while Philadelphia has a less educated and
lower-than-average–income population.
4 Bellotti et al. (2006) provides a detailed analysis of the implementation of Project GATE.

Evaluation of Project GATE 23 May 2008
Table III.1: Socioeconomic and Demographic Characteristics of the General
Population by Site
Sitea
Characteristic Philadelphia Pittsburgh Minneapolis/ St. Paul
NE Minnesota Maine USA
Persons per Square Mile 11,234 1,755 2,005 32 41 80
Race
White 45% 84% 81% 95% 97% 75%
African American 43 12 9 1 1 12
Other 12 3 10 4 3 13
Hispanic/Latino Origin
10 1 5 1 1 14
Education
Less than high school 29% 14% 9% 13% 15% 20%
High school graduate 33 34 21 32 36 29
Some college 20 24 30 34 26 27
Bachelor degree or higher 18 28 39 22 23 24
Median Household Income
$30,746 $38,329 $51,711 $36,306 $37,240 $41,994
Families Below Poverty Level
18%
8%
5%
7%
8%
9%
Workers Who Are Self-Employed
4% 5% 5% 6% 9% 7%
Source: U.S. Census Bureau, 2000 Census; Statistics of U.S. Businesses, 2001; Bureau of Labor Statistics, 2004.
a Statistics given for the County of Philadelphia, Allegheny County, Hennepin County, St. Louis County, the state of Maine, and the United States. The unemployment rates are for 2004; all other data are for 2000.
Finally, the sites vary in the predominance of small businesses. Maine has the largest percentage of
self-employed people—9 percent of all its workers are self-employed. The percentage of workers
who are self-employed at the other sites is lower than the national average of 7 percent. Although
many factors may influence these differences in the prevalence of self-employment, GATE program

Evaluation of Project GATE 24 May 2008
staff in Maine suggested that residents of the state have a tradition of using self-employment to
either make a living or supplement income from other jobs. In contrast, GATE program staff in
both Pennsylvania sites described a tradition of working for large companies in their state.
The GATE Experience
Project GATE consisted of seven distinct stages.
1. Registration. Having heard about Project GATE through the outreach campaign,
individuals expressed interest in finding out more about the project by registering at the
Project GATE Web site, calling a toll-free telephone number, sending in a postcard provided
at One-Stop Career Centers, or registering via the Internet using Project GATE kiosks
placed at One-Stop Career Centers.
2. Orientation. All individuals who registered for the program were mailed a letter inviting
them to attend a one-hour orientation session to learn more about the project.
3. Application. At the end of the orientation session, individuals who were still interested in
participating in the project were provided with a paper Application Form to fill out and mail
to the evaluation contractor. This 9-page form requested extensive information about the
individual’s background and interest in self-employment and served as the primary source of
baseline data for the evaluation.
4. Random Assignment. Using a random number generator, a computer program randomly
assigned eligible applicants to either the program group or the control group, with a 50%
chance of being assigned to either group.
5. Assessment. All individuals who were randomly assigned to the program group were
directed to contact an assessment counselor in their area for the assessment interview.
6. Referral. The assessment counselor, together with the participant, decided which of the
available services would best meet the participant’s self-employment training needs, and
referred the participant to that service provider.
7. Service. The service provider offered entrepreneurship training services, including
classroom training as well as individualized business counseling, to the participant.
These are shown in Figure III.1 below.

Evaluation of Project GATE 25 May 2008
Figure III.1: Stages of Participation in Project GATE

Evaluation of Project GATE 26 May 2008
3.2 GATE Service Providers
Project GATE involved multiple service providers at all sites except Pittsburgh (see Table III.2).
Altogether, fourteen organizations were involved across all sites. Providers were competitively
selected based on four criteria: (1) experience in providing services to assist with business
development; (2) ability to provide training in business development and business counseling,
including assistance with loan applications; (3) ability to serve sufficient numbers of participants; and
(4) ability to provide the services at a reasonable cost.
Table III.2: Organizations Involved in Project GATE
Site Assessment Training and Business Counseling
Philadelphia IMPAQ International5 Women’s Business Development Center (WBDC) Women’s Opportunity Resource Center (WORC) The Enterprise Center
Pittsburgh Duquesne University, SBDC Duquesne University, SBDC
Minneapolis/St. Paul
University of St. Thomas, SBDC Hmong American Mutual Assistance Association (HAMAA)
University of St. Thomas, SBDC WomenVenture Hmong American Mutual Assistance Association (HAMAA)
Northeast Minnesota
University of Minnesota at Duluth, SBDC
University of Minnesota at Duluth, SBDC Northeast Entrepreneur Fund (NEEF)
Maine University of Southern Maine, SBDC
University of Southern Maine, SBDC Maine Centers for Women, Work, and Community (WWC) Penquis Community Action Program (CAP) Coastal Enterprises, Inc. Center for Entrepreneurship at the University of Southern Maine/Heart of Maine
All providers except one were either SBDCs or nonprofit CBOs. The exception was the Center for
Entrepreneurship in Maine, located at the School of Business at the University of Southern Maine,
which partnered with the Heart of Maine, a resource, conservation, and development organization.
5 The original design of GATE called for SBDCs to provide assessments. However, in Philadelphia, the local SBDCs (Wharton and Temple) chose not to participate in the demonstration. Therefore, IMPAQ International, the evaluation contractor, provided assessments in Philadelphia.

Evaluation of Project GATE 27 May 2008
SBDCs and CBOs differ in several important ways, including mission, clientele, staff, and service
provision. The mission of SBDCs is economic development—to provide assistance for small
business development so as to maintain and strengthen the economy. In contrast, the mission of
most CBOs is workforce development—assisting individuals to become self-sufficient. Discussions
with staff at both SBDCs and CBOs suggest that the two types of organizations also serve quite
different clients. SBDCs in general serve clients who are more educated, have higher incomes, are
more likely to be employed, and are further along in starting or planning their businesses than is the
typical client at the CBOs. Staff characteristics also differ, with SBDC staff members more likely to
be male, white, highly educated, and more experienced in providing self-employment assistance than
are staff members at CBOs. Finally, while both SBDCs and CBOs provide training and business
counseling, they differ in the ways they provide these services. SBDC counselors expect their clients
to be very self-directed, while CBOs provide more assistance, give more direction as to what clients
need to do, provide more help with tasks, and follow-up with clients more regularly.
3.3 Intake Procedures
Project GATE was designed to serve almost anyone, whether employed or unemployed, who was
interested in starting a business. The program was open to anyone 18 years of age or older who was
lawfully able to work in the United States, resided in the state, and wished to start or expand a
business that was legitimate and appropriate for federal support.6 If these criteria were met, no
applicants were prevented from participating based on their particular business idea or their
qualifications for starting a business. Instead, individuals were expected to self-select into or out of
the application process through a three-tiered intake procedure that involved (1) registration, (2)
attendance at an orientation, and (3) completion of an application package.
Persons interested in Project GATE first registered for the program by providing their name and
mailing address at a GATE kiosk housed at a One-Stop Career Center, at the GATE Web site, by
mailing a postcard from the GATE brochure or poster, or by calling a toll-free number. Registered
individuals were then notified by mail of the times and locations of GATE orientations in their area.
The letter asked the individual to contact the One-Stop Career Center most convenient to them to
6 Three GATE applications were rejected due to illegal or inappropriate business ideas.

Evaluation of Project GATE 28 May 2008
sign up for an orientation, but did not provide any description of the length of the orientation
session or the topics to be covered in the orientation session.
Orientations were held at the participating One-Stop Career Centers, and attendance was required
before a GATE application could be submitted. In addition to providing information about services
available through Project GATE and at the One-Stop Career Centers, the orientation involved a
discussion of the negative aspects of self-employment, referred to as the “cold shower,” that was
designed to ensure that Project GATE applicants had realistic expectations about self-employment.
The orientation session typically lasted one hour, including a standard video describing self-
employment and Project GATE.
Orientation session attendees who remained interested in participating in Project GATE were then
given a nine-page GATE Application Form to take home to fill out. This application form collected
baseline data on demographics, self-employment experience, and wage and salary employment.
Orientation session leaders were instructed to provide assistance in filling out the Application Form
if explicitly requested to do so by the applicant. However, they were specifically instructed not to
tell attendees the names of the GATE service provider organizations in order to avoid
contamination issues. Upon completion of the Application Form, the applicant mailed the form to
the evaluation contractor.
As intended, the intake process led to some people deciding against participating in Project GATE.
Even though about 16,000 people registered for Project GATE, only 37 percent (about 6,000)
attended an orientation. This large drop-off between registration and orientation likely reflected the
small investment in time required to register compared to attending an orientation. Of those who
attended an orientation, 71 percent (about 4,200) chose to apply to Project GATE.
3.4 Outreach and Recruitment
Many new programs find it challenging to spark interest among their target populations, develop a
reputation within their communities, and achieve a steady enrollment. As a new initiative and one
that included recruitment for a control group, Project GATE required significant outreach efforts to
recruit and enroll sufficient numbers of sample members to support the study’s experimental design.

Evaluation of Project GATE 29 May 2008
While general outreach strategies were initiated at all sites, the types and intensity of recruitment
efforts were driven by each site’s success in meeting its enrollment target.7
One-Stop Career Centers were the foundation of the GATE outreach strategy. These centers offer
a wide range of services for job seekers and employers, but they are not traditionally viewed as a
resource for self-employment services. Project GATE aimed to attract new and more diverse
customers to the One-Stop system. Twenty One-Stop Career Centers participated in GATE; the
number per site ranged from two in northeast Minnesota to seven in Pittsburgh (see Table III.3).
The centers were chosen for the demonstration based on three general criteria. First, larger centers
were generally selected so that they could reach a larger population. Second, some centers were
selected to ensure diversity among clients. Third, centers were selected only if their managers
wanted to offer Project GATE services.
All participating One-Stop Career Centers provided information about Project GATE through
electronic kiosks, flyers, brochures, and posters. These outreach materials promoted the Project
GATE Web site. Many centers also conducted open-house events for individuals interested in self-
employment, mentioned Project GATE in their general orientations, and hosted Project GATE
booths at job fairs. One-Stop Career Center employment counselors also occasionally suggested
that customers who seemed well suited to self-employment attend a Project GATE orientation.
In addition to promoting Project GATE at the One-Stop Career Centers, additional outreach was
conducted in most sites (see Table III.4). Flyers describing Project GATE were periodically mailed
with UI checks in Philadelphia, Pittsburgh, and Maine. Staff at some participating One-Stop Career
Centers led grassroots networking efforts to share information about the program with other local
organizations and government agencies. Finally, mass media marketing—including special media
events, advertisements, press releases, and public service announcements—was used across sites in
varying degrees to increase the visibility of the program. The resources spent on marketing varied,
depending on the success of other outreach strategies; for example, Philadelphia required the largest
marketing budget, which was more than twice that spent in Minneapolis/St. Paul.
7 For a detailed description of outreach efforts in Project GATE, see Bellotti et al. (2006).

Evaluation of Project GATE 30 May 2008
Table III.3: One-Stop Career Centers Participating in Project GATE
Site
Number of One-Stop Career
Centers Participating in Project GATE
Names of One-Stop Career Centers Participating in Project GATE
Philadelphia 5
North Philadelphia CareerLink Center
Northeast Philadelphia CareerLink Center
Northwest Philadelphia CareerLink Center
South Philadelphia CareerLink Center
Calle Americana CareerLink Center
Pittsburgh 7
Pittsburgh/Allegheny County Comprehensive CareerLink Center
McKeesport Comprehensive CareerLink Center
Allegheny West Comprehensive CareerLink Center
Community CareerLink at the Jewish Family and Children’s Services Career and Development Center
Community CareerLink at the Community College of Allegheny County, South Campus
Community CareerLink at the Community College of Allegheny County, North Campus
Community CareerLink at the Community College at the Forbes Road Career and Technology Center
Minneapolis /St. Paul 4
North Minneapolis WorkForce Center
Anoka County WorkForce Center
Midway WorkForce Center
Dakota County North WorkForce Center
Northeast Minnesota 2
Duluth WorkForce Center
Virginia WorkForce Center
Maine 3
Portland CareerCenter
Lewiston CareerCenter
Bangor CareerCenter

Evaluation of Project GATE 31 May 2008
Table III.4: Summary of GATE Outreach Strategies by Site
Philadelphia Pittsburgh Minneapolis
/St. Paul Northeast Minnesota
Maine
One-Stop Promotional Efforts
Number of GATE kiosks 5 3 4 2 3 Open-house events Yes No No No Yes Booths at job fairs Yes Yes No Yes No
Flyers Inserted with UI Checks
Yes Yes Noa Noa Yes
GATE Website National
Grassroots Campaigning Yes Yes Yes Yes Yes
Mass Media Marketing
Date of kickoff event Jun 2004 Feb 2004 Aug 2002 Aug 2004 None
Paid advertising Yes Yes No Yes Yes
Type of organization leading marketing effort Private firm One-Stop
operator One-Stop operator
One-Stop operator
Private firm
Budget $51,355 $39,515 $19,197 $13,211 $34,303
aThe state UI agency in Minnesota was unable to send inserts only to those individuals residing within the two Minnesota sites.
One-Stop Career Centers were the single most important source for prospective GATE sample
members, drawing about 37 percent of orientation attendees; however, other outreach strategies
attracted substantial numbers of applicants (see Table III.5). The GATE website was a particularly
effective and inexpensive recruiting tool that yielded 12 percent of orientation attendees. Referrals
from local agencies drew about 13 percent of orientation attendees, and advertising drew about 12
percent. As Project GATE matured, its reputation spread, and about 23 percent of orientation
attendees reported hearing about the program through friends, relatives, business partners, and
acquaintances.
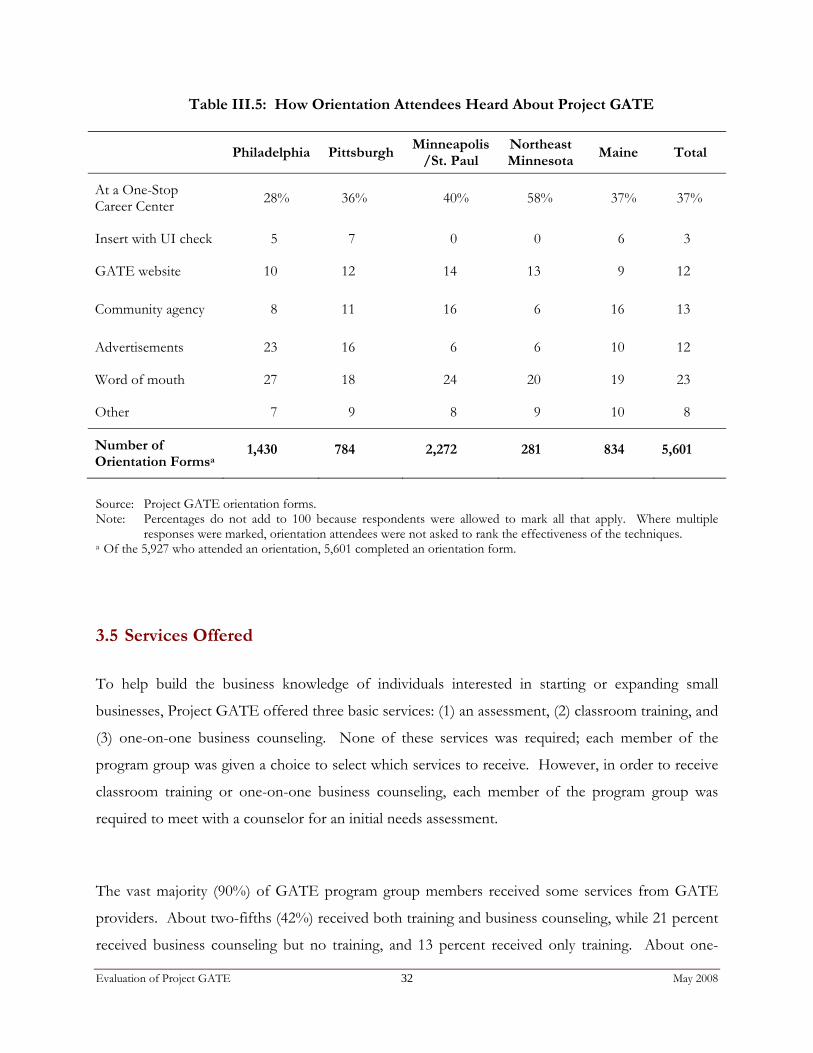
Evaluation of Project GATE 32 May 2008
Table III.5: How Orientation Attendees Heard About Project GATE
Philadelphia PittsburghMinneapolis
/St. Paul Northeast Minnesota
Maine Total
At a One-Stop Career Center 28% 36% 40% 58% 37% 37%
Insert with UI check 5 7 0 0 6 3
GATE website 10 12 14 13 9 12
Community agency 8 11 16 6 16 13
Advertisements 23 16 6 6 10 12
Word of mouth 27 18 24 20 19 23
Other 7 9 8 9 10 8
Number of Orientation Formsa
1,430 784 2,272 281 834 5,601
Source: Project GATE orientation forms. Note: Percentages do not add to 100 because respondents were allowed to mark all that apply. Where multiple
responses were marked, orientation attendees were not asked to rank the effectiveness of the techniques. a Of the 5,927 who attended an orientation, 5,601 completed an orientation form.
3.5 Services Offered
To help build the business knowledge of individuals interested in starting or expanding small
businesses, Project GATE offered three basic services: (1) an assessment, (2) classroom training, and
(3) one-on-one business counseling. None of these services was required; each member of the
program group was given a choice to select which services to receive. However, in order to receive
classroom training or one-on-one business counseling, each member of the program group was
required to meet with a counselor for an initial needs assessment.
The vast majority (90%) of GATE program group members received some services from GATE
providers. About two-fifths (42%) received both training and business counseling, while 21 percent
received business counseling but no training, and 13 percent received only training. About one-

Evaluation of Project GATE 33 May 2008
quarter (24%) received neither training nor business counseling. On average, those GATE
participants who received an assessment received about 15 hours of services.
Figure III.2: Receipt of Service Among Program Group Members
Source: Participant Tracking System
The length of time spent in Project GATE varied across participants. While 17 percent of GATE
participants who received an assessment spent less than one month in Project GATE, 5 percent
spent one year or more. On average, GATE participants who received an assessment spent four
months in the program.
3.5.1 The Assessment: Tailoring Services to Participants’ Needs
As businesses are diverse, so are the needs and goals of aspiring entrepreneurs. The GATE
assessment, the first service provided by the program, was designed to ensure that the services a
participant received were tailored to his or her individual needs. This assessment was conducted
during a counseling session where each GATE participant met one-on-one with an experienced
business counselor. The GATE assessment had two key goals: (1) to provide a professional
appraisal of each participant’s needs, and (2) in all but one site, to make a referral to the most
appropriate GATE provider.

Evaluation of Project GATE 34 May 2008
The infrastructure of GATE providers played a role in shaping the objectives of the sessions at each
site (see Table III.6). In particular, the sites varied as to whether a referral could be made to another
organization or to multiple organizations. In Pittsburgh, the SBDC was the only organization that
provided GATE services—including assessments, training, and business counseling—and, therefore,
referrals were not needed. In Maine, the SBDC conducted the assessment and provided business
counseling, and referrals were made only for classroom training. At all other sites, individuals were
referred to a single provider to receive classroom training, business counseling, or both.
Table III.6: Summary of GATE Infrastructure at Each Site
Site Assessment
Provider
Services Provided by Assessment
Provider
Services Offered by Other GATE
Providers
Referrals Made to Single or
Multiple Providers
Philadelphia IMPAQ International None Training and
business counseling Single
Pittsburgh SBDC Training and business counseling No other providers Not applicable
Minneapolis/St. Paul SBDC Training and business counseling
Training and business counseling Single
Northeast Minnesota SBDC Training and business counseling
Training and business counseling Single
Maine SBDC Business counseling Training Multiple
The assessment often resembled a first business counseling session. Counselors typically held a
semi-structured discussion on topics such as the business idea, prior experience relevant to the
business, credit history and availability of equity and collateral, ability of the participants to support
themselves while starting a business, and other barriers. While GATE providers were instructed not
to deny participants services based on their business ideas or suitability for self-employment, most
providers did give participants frank assessments of their ability to pursue entrepreneurship, and, in
some cases, discouraged GATE participants who they believed would not succeed.
Four main factors influenced the decision on where to refer clients. First, assessors often referred
participants with vague business ideas or little experience to providers that offered introductory
training. Second, the location of services was described as an important factor in the rural areas of

Evaluation of Project GATE 35 May 2008
northeast Minnesota and Maine and the inner city of Philadelphia. Third, given that some training
courses ran for several months, assessors tried to minimize wait times by referring participants to
providers that were about to begin a new training series. Fourth, the need for credit repair
courses—which were scarce—sometimes affected the choice of provider.
3.5.2 Classroom Training: Building the Framework for New Businesses
Across all GATE sites, the program offered a total of 54 different training programs. Some sites
offered several types of training to meet different needs, depending on the education and experience
of participants, the stage of business development, and the types of businesses they wanted to start.
The courses offered included:
General Introductory Courses – General introductory courses were designed for
people who had not yet operated a business and might not even have a clear idea for a
business. Their purpose was to provide an overview of what being an entrepreneur
entails. The training might touch on subjects such as legal structure, business plans, and
marketing. These courses tended to be short, varying from one to five sessions.
General Intermediate Courses – The intermediate courses were designed for people
who knew they wanted to start a business, had an idea of the type of business they
wanted, but had not yet completed a business plan. These programs usually lasted 10 to
12 weeks and ran for 2 or 3 hours per week. In total, they were about 30 hours in
length, although some intermediate courses could be as long as 60 hours.
General Advanced Courses – The advanced courses were designed for people who
had already started a small business but wanted it to grow. In these classes, more
advanced material was presented on each topic than was presented in the introductory
courses. In addition, other topics might be covered, such as how to manage growth in a
business or how to deal with legal and personnel issues. Sometimes, there was a
prerequisite that the business achieve a certain size before a participant could attend an
advanced course.
Specialized Courses – Many providers also offered specialized training programs that
focused on using the Internet for business, learning computer programs useful to

Evaluation of Project GATE 36 May 2008
business owners (such as QuickBooks), or assisting with specific types of businesses
(such as starting a child care business).
These training programs were generally the same programs that the providers had offered prior to
Project GATE. As a result, the number and variety of programs offered by a particular site varied
considerably and reflected the availability of programs in the local markets. To accommodate the
increased demand resulting from participants in Project GATE, however, the training courses were
sometimes offered at additional locations or more frequently. Several providers also adapted the
curricula to the needs of GATE participants; for example, some added training components on
credit repair.
3.5.3 Business Counseling
In addition to classroom training, members of the GATE program group were offered business
counseling in the form of one-on-one counseling sessions. In these sessions, participants were
provided access to experienced business counselors who could offer advice and guidance on all
aspects of creating or expanding a small business.
3.6 Participant Tracking System
To track individuals through the stages of Project GATE, a Web-based data collection system called
the Participant Tracking System (PTS) was developed. This system received input from individuals
registering for the project, orientation session leaders, data entry staff processing the completed
paper Application Forms, assessment counselors, and service provider staff. The PTS provided
output in the form of management and monitoring reports to provide project managers with
insights into the project status and recent trends in enrollment and participation. Also, the
Application Form data were used as baseline data on all applicants.
This chapter has presented details about the implementation of Project GATE in the participating
sites. The next chapter reviews the impact of Project GATE on receipt of self-employment services,
types and hours of services received; amount spent on services; and perception of usefulness of
services.

Evaluation of Project GATE 37 May 2008
Key Findings: Impacts on Self-Employment Service Receipt
• About 70 percent of the control group received some self-employment services
during the follow-up period compared to about 90 percent of the program group.
• During the follow-up period, Project GATE participants received 13 more hours of services than control group members—8 more hours of classroom training, 2 more hours of business counseling, and 3 more hours of other services.
• GATE participants spent on average $131 less of their own funds on self-employment training services.
• GATE participants were more likely than control group members to report that they found the services they received to be useful.
CHAPTER IV. DID PROJECT GATE INCREASE THE RECEIPT
OF SELF-EMPLOYMENT SERVICES?
Service providers affiliated with Project GATE offered GATE participants classroom instruction on
starting or growing a business and the opportunity to receive advice from a trained business
counselor. This chapter examines the impact of Project GATE on the types and amount of self-
employment services received. The key findings are listed in the following box.
The chapter first describes the services offered by Project GATE as well as the services available to
the control group and it then describes the estimated impacts on the receipt of self-employment
services (regardless of whether those services were part of Project GATE) during the follow-up
period. The types of services received, the service providers, the number of hours of services
received, and the amount spent on services are then described. The chapter ends with a discussion
of the survey respondents’ assessment of the usefulness of the services they received.

Evaluation of Project GATE 38 May 2008
4.1 Services Available To Program and Control Group Members
Project GATE offered program group members three main types of services: (1) assessment, (2)
classroom instruction, and (3) business counseling. Program group members received these services
free of charge from a GATE provider. As described in Chapter III, soon after being randomly
assigned to the program group, participants received a letter asking them to set up an appointment
with a GATE assessment counselor. During the assessment, the counselor determined the
participant’s need for services and the most appropriate GATE provider (in Pittsburgh there was
only one provider). The assessment counselor would then make a referral and notify the provider of
the referral.
While training and business counseling are the two most commonly offered self-employment
services, other forms of self-employment services were sometimes available. Both GATE providers
and providers that did not participate in the demonstration would sometimes offer additional
services such as:
Mentoring – Some organizations link a new entrepreneur with an experienced businessman
or businesswoman. This differs from business counseling in that the mentor is a volunteer,
not a professional business counselor. The Service Corps of Retired Executives (SCORE),
for example, links new entrepreneurs with volunteer retired business executives.
Peer Support or Networking – Some providers organize meetings for people who are
interested in starting a business so that they can give one another advice and support.
Individual Development Accounts – Individual development accounts, administered by
nonprofit CBOs, help people save for a specific goal, such as starting a business.
Participants deposit funds into the accounts, and these funds are matched by the CBO.
Participants can withdraw funds from the accounts to start or grow a business or for other
specific goals.
Business Incubators – Some providers offer incubators or low-cost space with subsidized
overhead costs for start-up businesses for a limited period of time.

Evaluation of Project GATE 39 May 2008
Credit Repair – Some organizations provide classes on becoming credit worthy, including
repairing bad credit histories and personal financial management.
Business Libraries – Providers often have business libraries that house the information
necessary to conduct market research. Some providers also provide access to online
business library services, such as HillSearch.
Table IV.1 provides a list of self-employment service providers at each site during the
demonstration; the GATE providers are indicated with an asterisk. While this list may not be
exhaustive, it does include all the providers identified from discussions with One-Stop Career Center
staff, discussions with other self-employment service providers at each site, an Internet search, and a
directory of U.S. self-employment programs compiled by the Aspen Institute (Walker and Blair
2002). Some providers were not asked to participate in Project GATE, usually because they did not
have the ability to provide both business counseling and classroom training.
Although at least one SBDC and one CBO offered self-employment services in each site, the
number of providers varied considerably. The most providers were identified in the large cities—
Minneapolis/St. Paul and Philadelphia. Northeast Minnesota had the fewest providers. SCORE
had chapters in Pittsburgh, Minneapolis/St. Paul, and Maine, but not in Philadelphia or northeast
Minnesota.

Evaluation of Project GATE 40 May 2008
Table IV.1: Programs That Provide Self-Employment Services at GATE Sites During the GATE Demonstration
Site SBA-Affiliated
Programs Community-Based Organizations and Others
Philadelphia,
PA
Temple University
Wharton School of Business
Women’s Business Development Center (WBDC)*
Women’s Opportunity Resource Center (WORC)*
The Enterprise Center*
Philadelphia Minority Business Development Corporation
Ben Franklin Technology Partners of Southeastern Pennsylvania
Philadelphia Commercial Development Corporation
Philadelphia Development Partnership
Technical Assistants
Community College of Philadelphia
Pittsburgh,
PA
Duquesne University*
University of Pittsburgh
SCORE
Microenterprise Training Program
Northside Community Development Fund
McKeesport CareerLink Center
Minneapolis
/St. Paul,
MN
University of St. Thomas*
SCORE
WomenVenture*
Hmong American Mutual Assistance Association (HAMAA)*
Neighborhood Development Center Inc.
Phillips Community Development Corporation
Whittier Community Development Corporation
Community Action of Minneapolis
Metropolitan Economic Development Association
Microenterprise Grant Program
Minneapolis Consortium of Community Developers
Southeastern Minnesota Microenterprise Fund
Northeast
Minnesota University of Minnesota at Duluth*
Northeast Entrepreneur Fund (NEEF)*
Maine
University of Southern Maine*
SCORE
Maine Centers for Women, Work, and Community (WWC)*
Penquis Community Action Program (CAP)*
Coastal Enterprises, Inc. (CEI)*
Center for Entrepreneurship at the University of Southern Maine
and the Heart of Maine*
*Participated in Project GATE.

Evaluation of Project GATE 41 May 2008
Two GATE sites—Pennsylvania and Maine—operated the SEA program prior to and during the
implementation of Project GATE. The SEA program provides free self-employment training and
business counseling from providers in the community to UI recipients. The programs in
Pennsylvania and Maine were small—there were fewer than 100 SEA participants annually in
Philadelphia and Pittsburgh and about 100 to 200 in Maine. Persons eligible for SEA were also
eligible for Project GATE and could participate in SEA, GATE, or both. In Pennsylvania, there
were relatively few GATE applicants who were also eligible for SEA. In Maine, about one-quarter
of GATE applicants were accepted in the SEA program. Eligibility for SEA was unaffected by
random assignment—both program and control group members could participate in SEA.
Program group members were offered GATE services. They might also be offered additional
services from the GATE providers, as well as from providers not in the demonstration, if they met
the eligibility requirements and paid any required fees.
Control group members could not participate in Project GATE, but they could receive self-
employment services offered in the community. Hence, they could receive training and business
counseling or other services. They could receive these services from any provider, irrespective of
whether the provider participated in Project GATE.
However, the services offered to GATE participants differed from the services that control group
members could receive in five important ways. Specifically, GATE participants were:
Provided Assistance Finding Services – The letter notifying program group members
that they were eligible for Project GATE included the name and telephone number of an
assessment counselor. The assessment counselors were also notified of the assignments,
and if they did not hear from a participant, they would call the participant to schedule the
assessment. In contrast, control group members were told that they were not eligible for
Project GATE and were not given the names of any service providers. Prior to random
assignment, neither program nor control group members were given names of providers.
Provided an Assessment of Their Needs – Program group members received an
assessment of their needs and a referral to the most appropriate GATE service provider.
Control group members might also find a service provider who would assess their needs.

Evaluation of Project GATE 42 May 2008
However, control group members may have been charged for an assessment. Moreover,
due to competition between providers for clients and funding, the assessor would have
been unlikely to refer the control group member to another organization.
Provided Services Free of Charge – Program group members did not pay for their
assessment, training, or business counseling. Control group members may have had to pay
for these services. Most providers usually charged for training and business counseling to
people not in Project GATE, though the charges would typically be on a sliding scale and
would not cover all the costs. SBDCs, however, always provided business counseling
(though not training) free of charge.
Not Refused Services – Program group members could not be denied GATE services for
any reason. In contrast, some providers would screen out clients who they thought would
not succeed in their business endeavors. Hence, some providers may have denied services
to control group members.
Given Preference for Services – GATE providers would give priority to GATE program
group members in filling slots for a class or assigning a business counselor.
The control group was designed to represent the counterfactual—what would have happened to
program group members in the absence of Project GATE. However, the experiences of control
group members may have differed from their experiences in the absence of Project GATE in three
ways:
Increased Capacity – Some providers used the GATE funds to add classes. These were
usually classes that they had provided previously. With the GATE funds, however, they
were able to provide classes more frequently and/or in additional locations. To the extent
that GATE participants did not fill these classes, the new classes increased the availability of
services to control group members. This would imply that control group members would
receive more services than they would have in the absence of Project GATE, and impact
estimates on service receipt would be downwardly biased.
Crowding Out – Conversely, some GATE providers did not hire new staff and did not
increase their total service capacity because of Project GATE. Program group members

Evaluation of Project GATE 43 May 2008
were given priority for program slots. If the provider had no excess capacity, program
group members may have taken slots that in the absence of Project GATE would have
been available for control group members. This would imply that control group members
would receive fewer services than they would have in the absence of Project GATE, and
impact estimates on service receipt would be upwardly biased.
Contamination – One-Stop Career Staff were asked not to provide the names of any
GATE service provider (or any other provider) to control group members. However, some
control group members may have learned about the availability of services at GATE
providers from program group members they knew or met earlier during the orientation.
This would imply that control group members would receive more services than they would
have in the absence of Project GATE, and impact estimates on service receipt would be
downwardly biased.
For the most part, control group members’ experiences do approximate what their experiences
would have been in the absence of Project GATE and these potential sources of bias are relatively
small. It is possible that the estimates may be slightly downwardly biased in Maine because
providers there increased their capacity to provide classes and most attendees at these new classes
were not GATE participants. On the other hand, the estimates may be somewhat upwardly biased
in Minneapolis/St. Paul because providers there served the most GATE participants and some
providers noted that there were waiting lists for services.
As described in Section 2.2.4, contamination becomes an issue among control group members who
were business partners with program group members. To eliminate this problem from the analysis,
the 2.9% of our original sample of 4,198 applicants who were in mixed program/control group
business partnerships were removed from the sample prior to analysis.

Evaluation of Project GATE 44 May 2008
4.2 Receipt of Any Self-Employment Services
Nearly all program group members (91 percent) reported receiving some self-employment
services—classroom instruction, business counseling, mentoring, peer-to-peer support, or some
other service—between random assignment and the second survey (Wave 2 follow-up) (see Table
IV.2). About 10 percent of program group members reported they did not receive any self-
employment services from Project GATE or elsewhere. According to the data entered into the
GATE Participant Tracking System (PTS) by service providers, 76 percent of program group
members received training and/or business counseling through Project GATE, suggesting that at
least 15 percent of program group members received other types of services or services from
another source (Bellotti et al. 2006).
More than 70 percent of control group members found some self-employment services in the
follow-up period after random assignment (see Table IV.2). Hence, the majority of control group
members were able to obtain some type of self-employment services.
Program group members thus received more self-employment services than control group members.
Over the entire follow-up period, Project GATE increased the probability of receiving some type of
self-employment service by 20 percentage points, a statistically significant impact.
Project GATE had the largest impact on the receipt of services prior to the first survey or Wave 1
follow-up. Before the Wave 1 follow-up, program group members were 28 percentage points more
likely than control group members to receive services, a statistically significant impact (see Table
IV.2). In the year between the Wave 1 and Wave 2 follow-ups, program group members were 3
percentage points more likely to receive services—a difference that is not statistically significant.
This is not surprising as Project GATE participants spent an average of four months in the program
and most of the self-employment training that program group members received occurred in the
first six months after random assignment.

Evaluation of Project GATE 45 May 2008
Table IV.2: Impacts on Receipt of Self-Employment Services
Outcome
Program
Group Mean
Control
Group Mean
Impact on All
Eligible
Applicants
Any Self-Employment Services Between random assignment and Wave 1 survey 87% 59% 28 *** Between Wave 1 survey and Wave 2 survey 54 51 3 Between random assignment and Wave 2 survey 91 71 20 ***
Any Classes, Workshops, or Seminars Between random assignment and Wave 1 survey 68% 38% 30 *** Between Wave 1 survey and Wave 2 survey 35 33 3 Between random assignment and Wave 2 survey 74 50 24 ***
Any One-on-One Business Counseling Between random assignment and Wave 1 survey 54% 20% 34 *** Between Wave 1 survey and Wave 2 survey 18 14 4 *** Between random assignment and Wave 2 survey 59 27 31 ***
Any Mentoring Between random assignment and Wave 1 survey 30% 28% 3 Between Wave 1 survey and Wave 2 survey 28 26 2 Between random assignment and Wave 2 survey 43 39 4 **
Any Peer Support/Networking Between random assignment and Wave 1 survey 15% 11% 4 *** Between Wave 1 survey and Wave 2 survey 11 9 2 * Between random assignment and Wave 2 survey 22 17 5 ***
Any Other Self-Employment Services Between random assignment and Wave 1 survey 7% 5% 2 ** Between Wave 1 survey and Wave 2 survey 3 3 1 Between random assignment and Wave 2 survey 10 7 3 ***
Number of Respondents 1,516 1,430 2,946 Source: Follow-up surveys, Waves 1 and 2. Notes: Reported means and impacts are regression-adjusted to control for differences between the program and
control group members in baseline characteristics. Estimates were obtained using weights to adjust for differences between survey respondents and nonrespondents in baseline characteristics.
*/**/*** Estimate significantly different from zero at the 0.10/0.05/0.01 level.
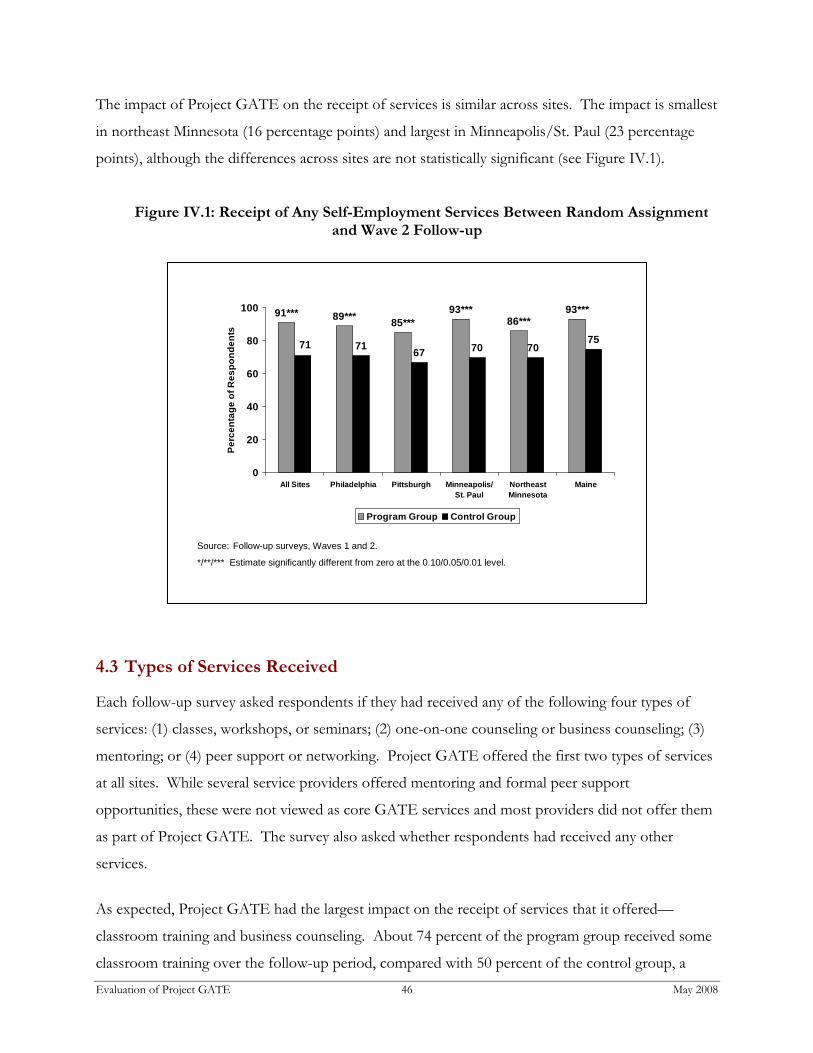
Evaluation of Project GATE 46 May 2008
The impact of Project GATE on the receipt of services is similar across sites. The impact is smallest
in northeast Minnesota (16 percentage points) and largest in Minneapolis/St. Paul (23 percentage
points), although the differences across sites are not statistically significant (see Figure IV.1).
Figure IV.1: Receipt of Any Self-Employment Services Between Random Assignment and Wave 2 Follow-up
4.3 Types of Services Received
Each follow-up survey asked respondents if they had received any of the following four types of
services: (1) classes, workshops, or seminars; (2) one-on-one counseling or business counseling; (3)
mentoring; or (4) peer support or networking. Project GATE offered the first two types of services
at all sites. While several service providers offered mentoring and formal peer support
opportunities, these were not viewed as core GATE services and most providers did not offer them
as part of Project GATE. The survey also asked whether respondents had received any other
services.
As expected, Project GATE had the largest impact on the receipt of services that it offered—
classroom training and business counseling. About 74 percent of the program group received some
classroom training over the follow-up period, compared with 50 percent of the control group, a
71 67 7075
93***86***
93***85***89***91***
7071
0
20
40
60
80
100
All Sites Philadelphia Pittsburgh Minneapolis/St. Paul
NortheastMinnesota
Maine
Perc
enta
ge o
f Res
pond
ents
Program Group Control Group
Source: Follow-up surveys, Waves 1 and 2.
*/**/*** Estimate significantly different from zero at the 0.10/0.05/0.01 level.

Evaluation of Project GATE 47 May 2008
statistically significant difference (see Table IV.2). Most of this difference occurred soon after
random assignment—the percentages of program and control group members who received any
services between the first and second waves of the survey are similar. The impact on receipt of
business counseling is larger—59 percent of the program group received business counseling
compared with 27 percent of the control group. This is probably because it was relatively easier for
control group members to find classroom instruction in starting a business than it was to obtain the
more costly one-on-one business counseling. The impact on business counseling persisted after the
Wave 1 follow-up, although it became much smaller.
Project GATE participants were also slightly more likely than control group members to receive
mentoring and peer support—two services that were not specifically offered as part of Project
GATE. About 39 percent of control group members received mentoring services over the follow-
up period. This was not unexpected since mentoring services are usually free of charge, and a
chapter of SCORE—a program that provides mentoring—was present in Pittsburgh,
Minneapolis/St Paul, and Maine. Interestingly, however, program group members were 4
percentage points more likely than control group members to have received mentoring services.
Similarly, program group members were 5 percentage points more likely than control group
members to receive peer support. GATE had a positive impact on the receipt of these services in
most sites (though the impacts were not all statistically significant), which implies that the impacts
did not just occur in those sites in which these services were offered as part of Project GATE. This
suggests that once connected with a GATE service provider, participants found it easier than
control group members to access other services.
The impact of Project GATE on receipt of classroom training and business counseling varied
somewhat by site. (The differences in the impacts as measured by an F-test were significant at the 5
percent level of significance.) The impact on classroom training was largest in northeast Minnesota
(see Figure IV.2) where program group members were more likely to receive classroom training than
were control group members. One possible reason is that the SBDC at the University of Minnesota
at Duluth—one of the few providers in northeast Minnesota—offered many short courses on
computer-related topics (such as using QuickBooks or developing a website). These courses were
popular among, and free for, GATE participants but quite expensive for control group members.
The impact on classroom training was smallest in Maine, where Project GATE may have increased
the number of slots in classroom training for both program and control group members.

Evaluation of Project GATE 48 May 2008
Figure IV.2: Participation in Classes, Workshops, or Seminars Between Random Assignment and Wave 2 Follow-up
The impact on receipt of business counseling was similar across sites with the exception of
Philadelphia (see Figure IV.3). It was particularly low in Philadelphia because program group
members there were less likely than program group members in other sites to receive business
counseling.
5143
5156
67**
78***76***70***
78***74***
4350
0102030405060708090
100
All Sites Philadelphia Pittsburgh Minneapolis/St. Paul
NortheastMinnesota
Maine
Perc
enta
ge o
f Res
pond
ents
Program Group Control Group
Source: Follow-up surveys, Waves 1 and 2.
*/**/*** Estimate significantly different from zero at the 0.10/0.05/0.01 level.

Evaluation of Project GATE 49 May 2008
Figure IV.3: Participation in Business Counseling Between Random Assignment and Wave 2 Follow-up
4.4 Hours of Services Received
Averaging over all participants, including those who did not receive services, GATE participants
received an average of about 37 hours of services. By contrast, control group members received an
average of about 24 hours of service (see Table IV.3). Hence, over the entire follow-up period,
Project GATE led to participants receiving about 13 more hours of self-employment services than
did control group members.
While program group members received more hours of services than control group members both
before Wave 1 and between Waves 1 and 2 of the survey, most of the impact occurred in the
months prior to Wave 1 (see Table IV.3). Between Wave 1 and Wave 2 of the survey, program
group members received about one more hour of service than control group members—a
difference that is not statistically significant.
2520
27
39
72***
57***64***
56***
44***
59***
2927
0102030405060708090
100
All Sites Philadelphia Pittsburgh Minneapolis/St. Paul
NortheastMinnesota
Maine
Perc
enta
ge o
f Res
pond
ents
Program Group Control Group
Source: Follow-up surveys, Waves 1 and 2.
*/**/*** Estimate significantly different from zero at the 0.10/0.05/0.01 level.

Evaluation of Project GATE 50 May 2008
Table IV.3: Impacts on Hours of Self-Employment Services Received
Outcome
Program Group Mean
Control Group Mean
Impact on All Eligible Applicants
Total
Between random assignment and Wave 1 survey 25 14 11 *** Between Wave 1 survey and Wave 2 survey 13 12 1 Between random assignment and Wave 2 survey 37 24 13 ***
Classes, workshops, or seminars
Between random assignment and Wave 1 survey 14 6 8 *** Between Wave 1 survey and Wave 2 survey 6 5 1 Between random assignment and Wave 2 survey 20 11 8 ***
One-on-one counseling/business counseling
Between random assignment and Wave 1 survey 2 1 1 *** Between Wave 1 survey and Wave 2 survey 1 1 0 Between random assignment and Wave 2 survey 3 2 2 ***
Mentoring Between random assignment and Wave 1 survey 7 6 1 Between Wave 1 survey and Wave 2 survey 6 5 1 Between random assignment and Wave 2 survey 12 9 3
Peer support/networking Between random assignment and Wave 1 survey 2 1 0 Between Wave 1 survey and Wave 2 survey 1 1 0 Between random assignment and Wave 2 survey 3 2 0
Number of Respondents 1,516 1,430 2,946 Source: Follow-up surveys, Waves 1 and 2. Notes: Reported means and impacts are regression-adjusted to control for differences between the program and
control group members in baseline characteristics. Estimates were obtained using weights to adjust for differences between survey respondents and nonrespondents in baseline characteristics.
*/**/*** Estimate significantly different from zero at the 0.10/0.05/0.01 level.

Evaluation of Project GATE 51 May 2008
Program group members received more hours of each type of service than did control group
members. The difference was statistically significant for classroom training and business counseling
(see Table IV.3). Program group members received about eight hours more of classroom training
and one more hour of business counseling. Both of these impacts were statistically significant.
Both program and control group members spent more hours in the classroom than in other self-
employment services (see Table IV.3). Of the 37 hours of self-employment services received by
program group members, just over half were spent in the classroom. For control group members,
just under half of the hours of self-employment services received were spent in the classroom.
In GATE, some service providers offered a mentoring service. Mentoring typically involved pairing
a GATE participant with an individual in the community who was experienced in starting a small
business, such as a retired individual. The mentor provided individualized assistance to the GATE
participant outside the context of any GATE service provider. By contrast, business counseling
involved one-on-one sessions between the GATE participant and a staff person in the service
provider organization.
Sample members in both groups spent many more hours receiving mentoring than business
counseling. The program group received on average 12 hours of mentoring and 3 hours of business
counseling (see Table IV.3). In contrast, the control group received an average of 9 hours of
mentoring and 2 hours of business counseling. One explanation is that one-on-one business
counseling is much more costly to provide than mentoring, which is typically provided by
volunteers.
4.5 Amount Spent on Services
While Project GATE offered services free of charge, many other providers charged for services. On
average, members of the program group spent $244 on self-employment services during the follow-
up period compared with $375 spent by members of the control group (see Figure IV.4). These are
means taken over all members of the program and control groups, including those who received no
services. Among those program group members who received and paid for non-GATE services,
the average amount paid was about $292. In contrast, control group members who received and

Evaluation of Project GATE 52 May 2008
paid for such services, paid an average of $528. The impact on the amount spent on self-
employment services did not vary significantly by site or subgroup.
Figure IV.4: Amount Spent on Self-Employment Services Between Random Assignment
and the Wave 2 Follow-up
4.6 Perceptions of Usefulness of Services
Those survey respondents who had received self-employment services were asked in each survey
about the perceived usefulness of the services received. In general, services received by control
group members were from service providers not affiliated with GATE, or were from GATE service
providers but were not offered free of charge. Table IV.4 presents the responses to these questions
at Wave 1, which occurred soon after program group members began to participate in Project
GATE. The responses at Wave 2 were similar.
Project GATE participants were much more likely than control group members to respond that the
self-employment services that they received were “very useful.” About 52 percent of program group
members viewed the services as “very useful,” compared with 36 percent of control group members,
$244
$375***
$0
$50
$100
$150
$200
$250
$300
$350
$400
$450
Program Group Control Group
Source: Follow-up surveys, Waves 1 and 2.
*/**/*** Estimate significantly different from zero at the 0.10/0.05/0.01 level.

Evaluation of Project GATE 53 May 2008
a statistically significant difference (see Table IV.4). Conversely, control group members were more
likely to report the services were “not at all useful.” Among program group members, 6 percent of
the program group reported that the services they received were “not at all useful,” compared to 14
percent of the control group.
Survey respondents who said the services they received helped “a lot” or “somewhat” were asked
about the ways in which the services helped. It is striking that program group members who were
asked these questions were more likely than their counterparts in the control group to respond that
the services helped in each specific way mentioned. All but 4 percent of program group members
and all but 12 percent of control group members who said that services helped “a lot” or
“somewhat” responded that the services helped them develop a business plan. Program group
responders were particularly more likely than control group responders to report that the services
were helpful in: (1) deciding whether to pursue self-employment, (2) refining a business idea, (3)
dealing with credit issues, (4) developing a marketing strategy, and (5) dealing with accounting issues.
Although most program and control group members reported that the services they received were at
least “somewhat useful,” the evidence suggests that program group members were more satisfied
with the services they received. This suggests that the GATE program was able to offer better
quality services than those attainable by the control group. This could have occurred for two
reasons. First, only providers that were considered to be of good quality were chosen to participate
in Project GATE, and these were the providers that GATE participants were directed to. Second,
business counselors may have effectively steered GATE participants to the providers that best met
the participants’ needs.
All survey respondents were asked whether there were services that they did not receive or did not
receive enough of that could have helped them start or grow a business. Nearly two-thirds of both
program and control group members responded that they would have liked additional services. The
proportion was 61 percent among program group members and 64 percent among control group
members (see Table IV.4).

Evaluation of Project GATE 54 May 2008
Table IV.4: Perceptions of Usefulness of Services at the Wave 1 Follow-up
Outcome Program Group Mean
Control Group Mean
Conditional Differences
Perceived Usefulness of Servicesa, b Very useful 52% 36% 16 *** Somewhat useful 33 40 -6 *** Not very useful 9 11 -2 Not at all useful 6 14 -8 ***
Ways Services Viewed as Helping “A Lot” or “Somewhat” Developing a business plan 96% 88% 8 *** Deciding whether to pursue self-employment 73 54 19 *** Refining a business idea 71 54 17 *** Developing a marketing strategy 69 52 17 *** Networking 68 55 13 *** Dealing with accounting issues 60 39 21 *** Dealing with legal issues 55 40 14 *** Dealing with clients 51 42 9 *** Providing psychological support 48 38 10 *** Dealing with credit issues 43 28 15 *** Using computers and technology 41 35 6 ** Hiring and dealing with employees 37 25 12 *** Applying for loans 35 24 11 ***
Were There Other Services Would Have Liked to Receive 61% 64% -3 * Types of Services they Would Have Liked to Received
Classroom Training 20% 16% 4 ** Business counseling 22 18 4 ** Peer Support/Networking 7 10 -3 ** Mentoring 13 15 -2 Loans/Finance/Credit 27 30 -4 Sales 6 7 -1 Accounting 5 3 2 ** Business Plan 5 5 -1 Legal Issues 4 2 2 *** Other 18 37 -19 ***
Source: Wave 1 follow-up survey. Notes: Reported means and differences are regression-adjusted to control for differences between the program and
control group members in baseline characteristics. aMeans computed using only the 2,429 sample members who reported receiving services. bThe p-value for a chi-square test of distributional differences is 0.00. cMeans computed using only the 1,964 sample members who reported that the services they received helped “a lot” or “somewhat.”
dMeans computed using only the 1,943 sample members who reported that they would have liked to receive other services.
*/**/*** Estimate significantly different from zero at the 0.10/0.05/0.01 level.

Evaluation of Project GATE 55 May 2008
Surprisingly, when asked about the types of services they would have liked to receive, program
members were most likely to report that they would like to receive more classroom training and
business counseling—the two services offered by Project GATE (see Table IV.4). The other
services that many program and control group members desired were mentoring and help with
obtaining financing for their businesses.
This chapter has described the impact of Project GATE on key measures of self-employment
services received by nascent entrepreneurs. The following chapter addresses whether Project GATE
increased business ownership. It discusses business ownership; impacts on business preparation and
start-up attempts; impacts on business openings and closures; number of businesses owned;
business size; earnings from businesses; differences in the types of businesses developed; and
challenges to starting a business.

Evaluation of Project GATE 56 May 2008
Key Findings: Impacts on Business Ownership
Project GATE had a small but significant impact of 6 percentage points on the probability of owning a business at some time during the 18 months after random assignment.
Impacts on business ownership peaked shortly after random assignment and
then began to fade. By the Wave 2 survey, program group members were only 3 percentage points more likely to be self-employed than control group members, a difference that is statistically significant at the 10 percent level.
The impact on business ownership was larger among individuals who were
receiving Unemployment Insurance at random assignment, especially in Pittsburgh and the two Minnesota sites. Men were also significantly more likely to benefit from Project GATE than women.
The businesses started by both program and control group members were very
small and yielded little revenue as of the 18-month follow-up survey.
Project GATE had no impact on earnings from self-employment during the 18-month follow-up period.
The most common challenges to starting a business were lack of startup
capital, finding customers, and becoming known or getting exposure.
CHAPTER V. DID PROJECT GATE INCREASE BUSINESS
OWNERSHIP?
Project GATE aimed to impart business knowledge, entrepreneurial skills, and access to resources
that could help participants successfully move toward self-employment. Chapter IV presented
evidence that Project GATE did lead to a modest increase in the receipt of training, business
counseling, and other self-employment services. This chapter presents estimates of the impacts of
receiving these additional services on business ownership. The key findings are summarized in the
box below.
This chapter presents the impacts on business ownership among the entire GATE sample, by site
and by subgroup. It then discusses impacts on business preparation and start-up activities, business

Evaluation of Project GATE 57 May 2008
openings and closures, and the number of businesses owned. These sections are followed up by a
discussion of the impacts on business size and a discussion of the impacts on earnings from the
businesses. The chapter then describes differences in the types of businesses owned by program
and control group members. Finally, the chapter reviews challenges that program and control group
members faced while pursuing self-employment.
5.1 Business Ownership
The ultimate success of Project GATE depends upon its ability to support participants’ efforts
toward self-employment. This section discusses the impact of Project GATE on patterns of
business ownership over time, as well as differences in impacts across the participating sites and
across key subgroups.
5.1.1 Overall Impacts on Business Ownership
Project GATE had a modest but statistically significant impact of 6 percentage points on the
probability of owning a business at some time during the 18 months after random assignment (see
Table V.1). About 20 percent of both the program and control groups reported owning a business
at the time of their application to Project GATE. About 18 months later, 55 percent of the program
group and 49 percent of the control group reported having ever owned a business during the follow-
up period. The estimated impact of 6 percentage points is statistically significant at the 1 percent
level.
As shown in Figure V.1, both groups experienced a steep growth in business ownership very quickly
after random assignment. By the end of the first quarter after random assignment, the program
group had nearly doubled its rate of business ownership to 37 percent, about 5 percentage points
higher than the control group. Both groups experienced consistent but more modest growth in
business ownership throughout the remainder of the follow-up period.
The impact of Project GATE peaked at 6 percentage points in the third quarter after random
assignment with 43 percent of the program group and 37 percent of the control group reporting
owning a business. This peak in impact three quarters after random assignment was likely caused by
two related factors. First, the main dose of GATE services occurred within the first two quarters
after random assignment. When accepted into Project GATE, many program group members

Evaluation of Project GATE 58 May 2008
quickly enrolled in services and almost immediately began work on their businesses. The initial push
from Project GATE likely sparked the larger surge in business ownership among program group
Table V.1: Impacts on Business Ownership
Outcome Program
Group MeanControl
Group Mean
Impact on All Eligible
Applicants
Owned a Business at: Random assignment 19% 20% -1 Wave 1 survey 42 36 6 *** Wave 2 survey 44 40 3 *
Owned a Business in Quarter After Random Assignment
Quarter 1 37% 32% 5 *** Quarter 2 41 36 5 *** Quarter 3 43 37 6 *** Quarter 4 42 38 4 *** Quarter 5 44 40 4 *** Quarter 6 44 41 3 * Any quarter 1 to 6 55 49 6 ***
Number of Respondents 1,516 1,430 2,946 Source: Follow-up surveys, Waves 1 and 2. Notes: Reported means and impacts are regression-adjusted to control for differences between the program and
control group members in baseline characteristics. Estimates were obtained using weights to adjust for differences between survey respondents and nonrespondents in baseline characteristics.
*/**/*** Estimate significantly different from zero at the 0.10/0.05/0.01 level.
Figure V.1: Business Ownership by Quarter
19
37***41*** 43*** 42*** 44*** 44* 44*
20
3832 36 37 40 41 40
0102030405060708090
100
RandomAssignment
1 2 3 4 5 6 Wave 2Survey
Quarter Since Random Assignment
Per
cent
age
of R
espo
nden
ts
Program Group Control Group
Source: Follow-up surveys, Waves 1 and 2.
*/**/*** Estimate significantly different from zero at the 0.10/0.05/0.01 level.

Evaluation of Project GATE 59 May 2008
members. Second, and equally important, the control group experienced a slight delay in service
receipt and the start-up of business activities after their rejection from Project GATE, but they
ultimately caught up. As discussed in Chapter IV, many control group members eventually found
self-employment services on their own. As a result, they began to close the gap in business
ownership rates with their program group counterparts after the first few quarters following random
assignment.
5.1.2 Impacts by Site
Key elements of the GATE intervention were implemented across all the sites, although the exact
mix of services offered and the organizations providing those services varied substantially. Despite
this variation, no significant differences in the impacts on business ownership across the
participating sites were found. Small sample sizes in some sites, however, make it hard to draw
strong conclusions from this finding.
The impact on business ownership within the 18 months after random assignment was largest and
statistically significant, at 9 percentage points, in Minneapolis/St. Paul (see Figure V.2). This site
also experienced among the highest levels of business ownership, with 64 percent among program
group members and 55 percent among control group members. Northeast Minnesota and
Pittsburgh experienced more modest impacts at 5 percentage points, but these impacts were
insignificant. The impacts were 3 percentage points and 1 percentage point in Maine and
Philadelphia, respectively, neither of which were significantly different from zero.
By the sixth quarter after random assignment, there remained a statistically significant impact of 6
percentage points on business ownership in Minneapolis/St. Paul (see Figure V.3). The impact in
northeast Minnesota actually increased slightly to 6 percentage points, although it is not statistically
significant, likely due to the small sample size in the site. Interestingly, however, the impact fell to
near zero or was slightly negative within the three remaining sites.

Evaluation of Project GATE 60 May 2008
Figure V.2: Impacts on Business Ownership in the 18 Months After Random Assignment By Site
Figure V.3: Impacts on Business Ownership in the 6th Quarter After Random Assignment, By Site
39 40
55 576153
64***
4640
55***4849
0102030405060708090
100
All Sites Philadelphia Pittsburgh Minneapolis/St.Paul
NortheastMinnesota
Maine
Perc
enta
ge o
f Res
pond
ents
Program Group Control Group
Source: Follow-up surveys, Waves 1 and 2.
*/**/*** Estimate significantly different from zero at the 0.10/0.05/0.01 level.
32 32
4752
474453**
3331
44*3841
0102030405060708090
100
All Sites Philadelphia Pittsburgh Minneapolis/St. Paul
NortheastMinnesota
Maine
Perc
enta
ge o
f Res
pond
ents
Program Group Control Group
Source: Follow-up surveys, Waves 1 and 2.
*/**/*** Estimate significantly different from zero at the 0.10/0.05/0.01 level.

Evaluation of Project GATE 61 May 2008
5.1.3 Impacts by Receipt of Unemployment Insurance
The sample members who were receiving UI benefits at application are a subgroup of particular
interest for several reasons. First, the UI Self-Employment Demonstration served UI recipients
who were expected to exhaust their UI benefits and an evaluation of this demonstration found
sizeable impacts on business ownership (Benus et al. 1995). Second, the SEA program serves UI
recipients who are expected to exhaust their UI benefits. Third, UI recipients comprise about 40
percent of all GATE applicants.
In every quarter after random assignment, the impact on business ownership was larger among
those individuals receiving UI at the time of their application to GATE than among those who were
not (see Table V.2). Over the 18-months after random assignment, UI recipients experienced an
impact of 9 percentage points on business ownership (statistically significant) while non-UI
recipients experienced an impact of 3 percentage points (not statistically significant). An F-test
found that these impacts differed between the two subgroups at the 10 percent level of significance.
As in the full sample, the impacts on business ownership for UI recipients vary by site (see Table
V.2 and Figure V.4). Statistically significant impacts were found in Minneapolis/St. Paul and
Pittsburgh.
The pattern over time in the impacts seen in the full sample is mirrored in the UI sample. The
impacts on business ownership peak in the third quarter after random assignment and then decline
(see Table V.2). However, at the time of the Wave 2 interview, the impact on business ownership
for UI recipients is still 5 percentage points, which is statistically significant, compared with the
impact for those not receiving UI at random assignment of 2 percentage points, which is not
statistically significant. However, the difference in the impacts between the subgroups was no
longer significant by this time.
The impacts are larger for those applicants who had recently claimed UI benefits prior to random
assignment. Table V.3 shows the impacts on business ownership for those GATE applicants who
submitted a UI claim in the quarter prior to random assignment, about 63 percent of all UI
recipients who applied to Project GATE. For these applicants, the impact at Wave 1 is 15
percentage points compared to 10 percentage points for all UI recipients and the impact is still 9

Evaluation of Project GATE 62 May 2008
percentage points by the Wave 2 survey. The impact is statistically significant in Minneapolis/St.
Paul for both waves, and in Philadelphia for Wave 1.
Table V.2: Impacts on Business Ownership for Those Receiving Unemployment Insurance at Random Assignment
Impact on All Eligible Applicants
All Sites Philadelphia Pittsburgh
Minneapolis/ St. Paul
Northeast Minnesota Maine
Receiving UI at Application Owned a Business at:
Wave 1 survey 10 *** 5 11 * 14 *** 4 7 Wave 2 survey 5 ** 4 4 8 ** 24 * 7
Owned a Business in Quarter After Random Assignment
Quarter 1 7 *** 1 12 ** 9 ** 13 2 Quarter 2 9 *** 3 15 ** 12 *** 8 5 Quarter 3 9 *** 5 13 * 14 *** 8 3 Quarter 4 7 ** 5 9 12 *** 3 6 Quarter 5 8 *** 2 10 12 *** 13 7 Quarter 6 6 ** 0 10 10 ** 17 5 Any quarter 1 to 6 9 *** -2 16 ** 14 *** 13 1
Not Receiving UI at Application Owned a Business at:
Wave 1 survey 4 * 5 -2 3 6 7 Wave 2 survey 2 4 -4 2 -6 7
Owned a Business in Quarter After Random Assignment
Quarter 1 3 * 1 7 3 14 * 1 Quarter 2 3 3 1 4 1 3 Quarter 3 4 * 5 -3 3 3 9 *Quarter 4 2 5 -10 * 3 -4 8 Quarter 5 2 2 -8 4 -2 8 Quarter 6 1 0 -5 2 -5 5 Any quarter 1 to 6 3 3 -2 5 -4 4
Number of UI Respondents Number of Non-UI Respondents
1,204
1,742
216
522
173
243
558
649
62
83
195
245 Source: Follow-up surveys, Waves 1 and 2. Notes: Reported means and impacts are regression-adjusted to control for differences between the program and
control group members in baseline characteristics. Estimates were obtained using weights to adjust for differences between survey respondents and nonrespondents in baseline characteristics.
*/**/*** Estimate significantly different from zero at the 0.10/0.05/0.01 level.

Evaluation of Project GATE 63 May 2008
Figure V.4: Impacts on Business Ownership in the 18 Months After Random Assignment By Site For Those Receiving Unemployment Insurance at Application
Table V.3: Impacts on Business Ownership for Those Who Claimed Unemployment Insurance Within One Quarter Prior to Random Assignment
Impact on All Eligible Applicants
All Sites Philadelphia Pittsburgh
Minneapolis/ St. Paul
Northeast Minnesota Maine
Owned a Business at:
Wave 1 survey 15 *** 15 * 16 17 *** 5 9Wave 2 survey 9 *** 6 0 14 *** 28 4
Whether Owned a Business in Quarter After Random Assignment
Quarter 1 12 *** 7 11 13 ** 29 ** 8Quarter 2 14 *** 10 18 ** 15 *** 13 9Quarter 3 14 *** 11 18 ** 15 *** 12 7Quarter 4 12 *** 8 11 16 *** 2 9Quarter 5 11 *** 6 10 15 *** 12 8Quarter 6 9 *** 1 8 14 *** 16 5 Any quarter 1 to 6 9 *** 2 10 14 *** 16 1
Number of Respondents 759 101 118 364 37 139
Source: Follow-up surveys, Waves 1 and 2.
Notes: Reported means and impacts are regression-adjusted to control for differences between the program and control group members in baseline characteristics. Estimates were obtained using weights to adjust for differences between survey respondents and nonrespondents in baseline characteristics.
*/**/*** Estimate significantly different from zero at the 0.10/0.05/0.01 level.
37 34
535860
6967***
50**40
58*** 5549
0
10
20
30
4050
60
70
8090
100
All Site
s
Philad
elphia
Pittsburgh
Minneap
olis/St.P
aul
Northeas
t Minn
esota
Maine
Perc
enta
ge o
f Res
pond
ents
Program Group Control Group
Source: Follow-up surveys, waves 1 and 2.
*/**/*** Estimate significantly different from zero at the 0.10/0.05/0.01 level.
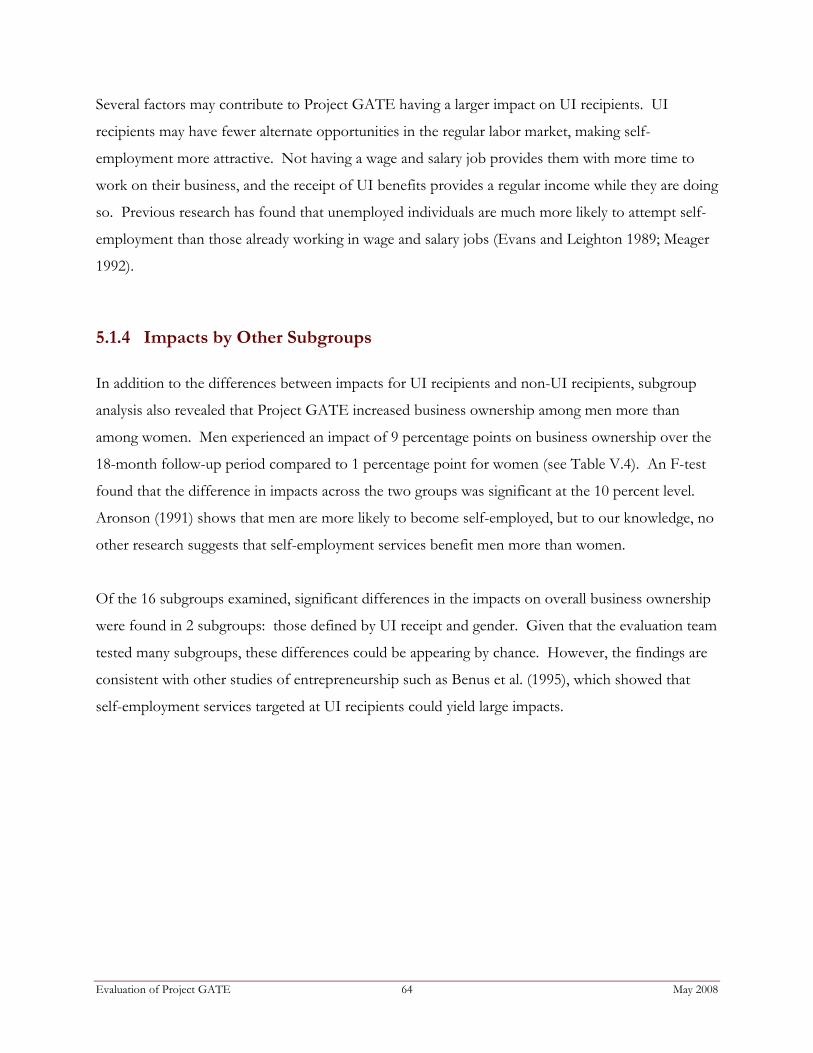
Evaluation of Project GATE 64 May 2008
Several factors may contribute to Project GATE having a larger impact on UI recipients. UI
recipients may have fewer alternate opportunities in the regular labor market, making self-
employment more attractive. Not having a wage and salary job provides them with more time to
work on their business, and the receipt of UI benefits provides a regular income while they are doing
so. Previous research has found that unemployed individuals are much more likely to attempt self-
employment than those already working in wage and salary jobs (Evans and Leighton 1989; Meager
1992).
5.1.4 Impacts by Other Subgroups
In addition to the differences between impacts for UI recipients and non-UI recipients, subgroup
analysis also revealed that Project GATE increased business ownership among men more than
among women. Men experienced an impact of 9 percentage points on business ownership over the
18-month follow-up period compared to 1 percentage point for women (see Table V.4). An F-test
found that the difference in impacts across the two groups was significant at the 10 percent level.
Aronson (1991) shows that men are more likely to become self-employed, but to our knowledge, no
other research suggests that self-employment services benefit men more than women.
Of the 16 subgroups examined, significant differences in the impacts on overall business ownership
were found in 2 subgroups: those defined by UI receipt and gender. Given that the evaluation team
tested many subgroups, these differences could be appearing by chance. However, the findings are
consistent with other studies of entrepreneurship such as Benus et al. (1995), which showed that
self-employment services targeted at UI recipients could yield large impacts.

Evaluation of Project GATE 65 May 2008
Table V.4: Impacts on Business Ownership in the 18 Months after Random Assignment, By Subgroup
Subgroupa
Program Group Mean
Control Group Mean
Impact on All Eligible
Applicants
Receiving Unemployment Insurance at Random Assignment
Yes 58% 49% 9 ***† No 52 49 3
Submitted a UI Claim in Quarter Prior to Random Assignment
Yes 62 53 9 *** No 52 48 4 **
Working at Random Assignment Yes 43 41 2 No 59 52 7 ***
Self Employed at Random Assignment Yes 90 87 3 No 46 40 6 ***
Ever Self Employed Prior to Random Assignment Yes 74 67 8 *** No 42 38 4 *
Gender Male 60 51 9 *** Female 48 47 1
Age Greater Than or Equal to 40 Years Yes 56 50 6 *** No 52 47 5 *
Education Greater Than 12th Grade Yes 63 57 6 ** No 49 44 5 **
Race is White Yes 62 55 6 *** No 45 40 5 *
Past Credit Problems Yes 46 41 5 ** No 62 56 6 **
Minor Living in the Household Yes 53 49 4 No 56 49 7 ***
Have More than 5 Years of Managerial Experience Yes 61 56 5 No 51 46 5 **
Household Income Less than $25,000 46 42 4 Greater than or equal to $25,000 59 52 6 ***
Lacks A Car, Telephone, Computer, or Bank Account Yes 40 33 7 * No 59 53 5 ***

Evaluation of Project GATE 66 May 2008
Subgroupa
Program Group Mean
Control Group Mean
Impact on All Eligible
Applicants
Receiving TANF, Food Stamps, SSI, or General Assistance
Yes 42 35 7 No 56 51 5 ***
Score on Personal Assessment of Suitability for Self Employmentb
Less than 90 55 49 6 ** Greater Than or Equal to 90 54 49 5 **
Number of Respondents 1,516 1,430 2,946
Source: Follow-up surveys, Waves 1 and 2.
Notes: Reported means and impacts are regression-adjusted to control for differences between the program and control group members in baseline characteristics. Estimates were obtained using weights to adjust for differences between survey respondents and nonrespondents in baseline characteristics.
aDefined by characteristics reported on the GATE application form prior to random assignment. bThe GATE application form asked whether the applicant would say whether 21 statements about their personality were “very true,” “somewhat true,” “neither true nor untrue,” “somewhat untrue,” or “very untrue.” A scale was developed from these scores that could range from 21 to 105, with a higher score indicating a personality that is usually viewed as more conducive to business development.
*/**/*** Estimate significantly different from zero at the 0.10/0.05/0.01 level.
†/††/††† Estimates significantly different between subgroups at the 0.10/0.05/0.01 level.
While the differences in impacts were not significant between any other subgroups, as indicated in
Table V.4, the analysis reveals some interesting findings about Project GATE’s effect on business
ownership among some groups. Significant impacts at the 1 percent level were found for (1) those
who were not self-employed at random assignment, (2) those who had been self-employed prior to
random assignment, (3) those over 40 years of age, (4) those who reported their race as white/non-
Hispanic, (5) those without minors living in their home, (6) those with a car, telephone, computer,
and bank account, and (7) those who were not receiving public assistance at random assignment (see
Table V.4). Many of these subgroups contain a higher percentage of UI recipients. Hence, it is not
clear whether it is the receipt of UI benefits or these other characteristics that explain the differences
between those who receive UI benefits and those who do not.

Evaluation of Project GATE 67 May 2008
5.2 Impacts on Business Preparation and Start-up Attempts
Formal business plans help ensure that prospective entrepreneurs have considered a broad range of
issues that could potentially affect their business operations. Lenders also often require these plans
when entrepreneurs seek formal business financing. Project GATE significantly increased the
proportion of participants who modified or developed a formal business plan. About 60 percent of
GATE participants reported writing or revising a plan by the time of the Wave 2 survey, compared
to 47 percent of control group members (see Table V.5). While the impact was larger in the first six
months after random assignment, it remained significant between the Wave 1 and 2 surveys.
Table V.5: Impacts on Steps Taken to Begin a Business
Outcome Program
Group Mean Control
Group Mean
Impact on All Eligible
Applicants
Developed or Revised a Written Business Plan Between random assignment and Wave 1 survey 50% 36% 13 ***Between Wave 1 and Wave 2 survey 35 29 6 ***Between random assignment and Wave 2 survey 60 47 13 ***
Applied for a Business Loan
Between random assignment and Wave 1 survey 6% 6% -1 Between Wave 1 and Wave 2 survey 6 5 2 * Between random assignment and Wave 2 survey 10 9 1
Attempted but Did Not Own a Business
Between random assignment and Wave 1 survey 20% 20% -1 Between Wave 1 and Wave 2 survey 14 13 1 Between random assignment and Wave 2 survey 20 19 1
Number of Respondents 1,516 1,430 2,946
Source: Follow-up surveys, Waves 1 and 2.
Notes: Reported means and impacts are regression-adjusted to control for differences between the program and control group members in baseline characteristics. Estimates were obtained using weights to adjust for differences between survey respondents and nonrespondents in baseline characteristics.
*/**/*** Estimate significantly different from zero at the 0.10/0.05/0.01 level.
Despite an increase in business plan development, a very small proportion of participants applied
for business loans, and only a marginal difference between program and control group members was
found. Approximately 6 percent of the program group, compared to 5 percent of the control group,
applied for a loan between the Wave 1 and 2 surveys. This impact was significant at the 10 percent
level. No significant impact between random assignment and Wave 1 or across the entire follow-up

Evaluation of Project GATE 68 May 2008
period from random assignment to Wave 2 was found. While Project GATE originally aimed to
support participants in identifying and applying for business loans, the implementation analysis
revealed that very few participants qualified for traditional business financing. Service providers
described most GATE participants as “not bankable” due to poor credit and limited assets. In
addition, most businesses were at the early stages of business development and did not have an
established business history.
5.3 Impacts on Business Openings and Closures
The life cycle of business start-ups can vary dramatically. Data from the first U.S. Panel Study of
Entrepreneurial Dynamics reveals that, after about four and a half years, approximately one-third of
individuals were operating a new business, one-third were still in the active start-up phase, and one-
third had disengaged from the entrepreneurial process (Gartner et al. 2004). While the GATE
follow-up period is much shorter, this begs the question of how GATE may have affected new
business openings and closures. The vast majority (about 95%) of businesses owned by sample
members were started from scratch. Less than 5 percent of program or control group members
acquired their businesses through a purchase, inheritance, or other transfer of ownership.
Program group members, however, were significantly more likely to start a new business after
random assignment. About 31 percent of GATE participants, compared to 27 percent of control
group members, reported owning a business that was established after their application to the
GATE program, a difference that is significant at the 5 percent level (see Table V.6). The bulk of
this difference occurred within the first six months after random assignment.
Project GATE also had a marginal impact on the timing of new businesses. Program group
members who started a business during the follow-up period took, on average, 5.5 months to begin
their first business compared to 6.2 months for control group members who started a business,
significant at the 10 percent level (see Table V.6). This is likely due to the fact that GATE
participants entered self-employment programs more quickly than control group members
(encouraging earlier business development) and that Project GATE led to different people starting
businesses.

Evaluation of Project GATE 69 May 2008
Given this, businesses owned by program group members had, somewhat surprisingly, been in
operation for slightly shorter periods of time at the Wave 1 survey. Specifically, among those who
owned a business between random assignment and Wave 1, control group businesses were operating
for an average of about 34 months compared to 28 months for GATE participants, a difference that
is statistically significant at the 5 percent level (see Table V.7).
Table V.6: Impacts on Business Openings and Closures
Outcome Program
Group Mean Control
Group Mean Impact on All Eligible
Applicants
Developed a New Business Between random assignment and Wave 1 24% 19% 5 *** Between Wave 1 and Wave 2 12 11 0 Between random assignment and Wave 2 31 27 4 **
Business Closed
Between random assignment and Wave 1 2% 2% 0 Between Wave 1 and Wave 2 10 8 1 Between random assignment and Wave 2 12 10 2 *
Number of Respondents 1,516 1,430 2,946
Source: Follow-up surveys, Waves 1 and 2.
Notes: Reported means and impacts are regression-adjusted to control for differences between the program and control group members in baseline characteristics. Estimates were obtained using weights to adjust for differences between survey respondents and nonrespondents in baseline characteristics.
*/**/*** Estimate significantly different from zero at the 0.10/0.05/0.01 level.
Despite this slight increase in new business openings, Project GATE participants were also
somewhat more likely, by 2 percentage points, to have owned a business that closed during the
follow-up period (see Table V.6). Approximately 12 percent of program group members and 10
percent of control group members reported owning a business sometime during the follow-up
period but were no longer self-employed at the time of the Wave 2 survey, a difference that is
significant at the 10 percent level. Less than 1 percent of businesses were sold. The remainder were
abandoned, failed, or closed for some other reason.

Evaluation of Project GATE 70 May 2008
Table V.7: Timing of Business Development
Outcome Program
Group MeanControl
Group Mean Conditional Difference
Number of Months After Random Assignment Until First Business Was Developeda
Average 5.5 6.2 -0.7 * 1 to 3 40% 40% 0 3 to 6 23 20 4 6 to 12 24 24 0 12 or more 12 16 -4 *
Average Number of Months That Most Recent Business Has Been in Operation Since Its Creationb
Wave 1 27.5 34.2 -6.7 ** Wave 2 36.1 38.3 -2.2
Source: Follow-up surveys, Waves 1 and 2.
Notes: Reported means and differences are regression-adjusted to control for differences between the program and control group members in baseline characteristics. Estimates were obtained using weights to adjust for differences between survey respondents and nonrespondents in baseline characteristics. Means computed using only sample members who owned a business after random assignment. As the means were computed over nonrandom samples of the program and control group, the differences should not be interpreted as impacts.
aMeans computed over 763 respondents who started a business since random assignment. bMeans computed over 1,558 respondents who ever owned a business between random assignment and the Wave 2 survey.
*/**/*** Estimate significantly different from zero at the 0.10/0.05/0.01 level
5.4 Number of Businesses Owned
As indicated in Table V.8, 39 percent of GATE participants, compared to 33 percent of control
group members, reported having owned one business between random assignment and the Wave 1
survey, a difference significant at the 1 percent level. However, when examining the period between
random assignment and the Wave 2 survey, this difference diminished to 2 percentage points and
was not statistically significant at the 10 percent level. The average number of businesses owned
between random assignment and the Wave 1 survey was slightly higher among program group
members compared to control group members (0.5 vs. 0.4, significant at the 1 percent level), but this
difference also disappeared when considering the period between random assignment and the Wave
2 survey.

Evaluation of Project GATE 71 May 2008
Table V.8: Impacts on Number of Businesses Operated
Outcome Program
Group MeanControl
Group Mean Impact on All
Eligible Applicants
Number of Businesses Operated Between Random Assignment and Wave 1
Average 0.5 0.4 0.1 *** 0 56% 62% -7 *** 1 39 33 6 *** 2 5 3 1 *
3 or more 0 0 0
Number of Businesses Operated Between Wave 1 and Wave 2
Average 0.5 0.5 0.0 0 54% 57% -3 * 1 40 38 2 2 5 4 1 *
3 or more 1 1 0
Number of Respondents 1,516 1,430 2,946
Source: Follow-up surveys, Wave 1 and 2.
Notes: Reported means and impacts are regression-adjusted to control for differences between the program and control group members in baseline characteristics. Estimates were obtained using weights to adjust for differences between survey respondents and nonrespondents in baseline characteristics.
*/**/*** Estimate significantly different from zero at the 0.10/0.05/0.01 level.
5.5 Business Size
Businesses owned by both the program and control group members were generally very small.
Given that the evaluation’s follow-up was only 18 months after random assignment, it is not
surprising that most businesses were fledgling ventures with few employees and very small payrolls.
Indicative of the start-up phase, most sample members reported very low levels of monthly sales
and business expenditures, although the program group reported some growth over time. While
there were very few statistically significant differences in the characteristics of businesses between
the program and control groups, those started by control group members appeared to be slightly
larger and more established in the early follow-up period.

Evaluation of Project GATE 72 May 2008
Although the differences in the sizes of the businesses are informative, they should not be
considered as impacts of Project GATE. The observed differences could be a result of an impact of
Project GATE on the size of business owned or a result of Project GATE leading to different types
of people starting a business.
More than three-quarters of business owners in the sample reported at the Wave 2 survey that they
worked alone on their current businesses with no full-time or part-time employees (see Table V.9).
For both program and control groups, there appeared to be small increases in the prevalence of
businesses employees between the Wave 1 and Wave 2 surveys, indicating modest business growth.
However, the vast majority of businesses were still small in size, with only a handful reporting more
than five employees (not shown).
Average payroll amounts were also small, and no significant differences in the size of payrolls
between the program and control group were found at either follow-up. There was some growth,
however, for both groups between Waves 1 and 2. For those who owned a business during the
follow-up period, payrolls were on average $3,100 per month for the program group and $4,900 for
the control group at Wave 1 (see Table V.9). These figures grew by 55 percent for GATE
participants and 33 percent for control group members by the time of the Wave 2 survey, when the
average monthly payrolls were $4,900 and $6,500 for the two groups, respectively. Very few
businesses offered employee benefits, and there were very few differences in the types of benefits
offered to employees of program and control group businesses.

Evaluation of Project GATE 73 May 2008
Table V.9: Employees and Payroll of Current or Most Recent Businesses
Outcome Program
Group MeanControl
Group MeanConditional Difference
Has Any Employees
Wave 1a 21% 18% 3 Wave 2b 23 23 0
Has Full-Time Employees Wave 1a 9% 11% -2 Wave 2b 12 12 -1
Has Part-Time Employees Wave 1a 17% 14% 3 Wave 2b 16 16 0
Average Monthly Payroll Wave 1a $3,076 $4,945 -$1,869 Wave 2b 4,883 6,547 -1,664
Source: Follow-up survey, Waves 1 and 2.
Notes: Reported means and differences are regression-adjusted to control for differences between the program and control group members in baseline characteristics. Estimates were obtained using weights to adjust for differences between survey respondents and nonrespondents in baseline characteristics. As the means were computed over nonrandom samples of the program and control group, the differences should not be interpreted as impacts.
aMeans computed over 1,217 respondents who owned a business between random assignment and the Wave 1 survey. bMeans computed over 1,318 respondents who owned a business between the Wave 1 and 2 surveys.
*/**/*** Estimate significantly different from zero at the 0.10/0.05/0.01 level.
Consistent with the fact that most entrepreneurs worked alone, about 79 percent of all businesses
discussed during the Wave 2 survey were operated out of the respondents’ home (see Figure V.6).
Another 16 percent were located in commercially available space. No differences in business
location among the program and control groups were found.
Control group members’ businesses appeared to be slightly more profitable during the Wave 1
follow-up period than businesses owned by program group members. When asked about their
current or most recent business, both program and control group members reported relatively
comparable expenses around $1,100 per month (see Table V.10). However, control group members
reported higher sales, at nearly $2,200 per month compared to $1,500 per month for the program
group. When subtracting expenses from sales, significantly more control group members’
businesses yielded a profit at Wave 1. This difference shrinks to insignificant by Wave 2, showing a
pattern consistent with program group members operating more start-up ventures during the early
follow-up period.
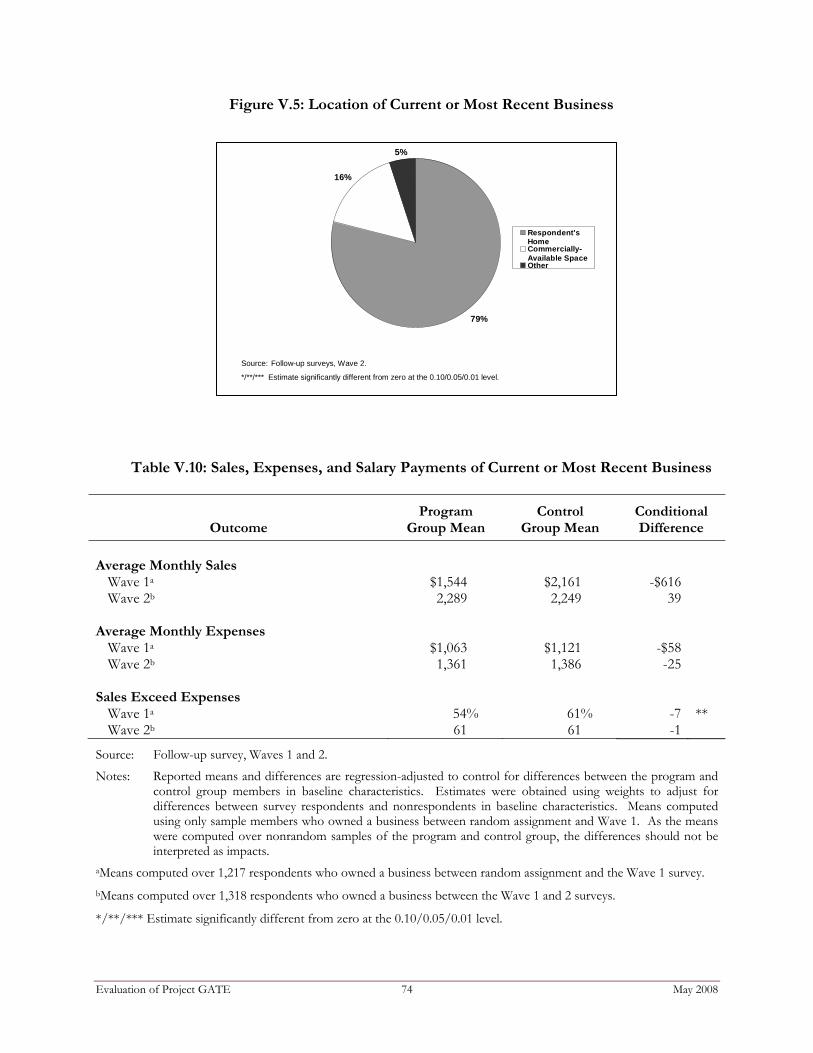
Evaluation of Project GATE 74 May 2008
Figure V.5: Location of Current or Most Recent Business
Table V.10: Sales, Expenses, and Salary Payments of Current or Most Recent Business
Outcome Program
Group Mean Control
Group Mean Conditional Difference
Average Monthly Sales
Wave 1a $1,544 $2,161 -$616 Wave 2b 2,289 2,249 39
Average Monthly Expenses
Wave 1a $1,063 $1,121 -$58 Wave 2b 1,361 1,386 -25
Sales Exceed Expenses
Wave 1a 54% 61% -7 ** Wave 2b 61 61 -1
Source: Follow-up survey, Waves 1 and 2.
Notes: Reported means and differences are regression-adjusted to control for differences between the program and control group members in baseline characteristics. Estimates were obtained using weights to adjust for differences between survey respondents and nonrespondents in baseline characteristics. Means computed using only sample members who owned a business between random assignment and Wave 1. As the means were computed over nonrandom samples of the program and control group, the differences should not be interpreted as impacts.
aMeans computed over 1,217 respondents who owned a business between random assignment and the Wave 1 survey. bMeans computed over 1,318 respondents who owned a business between the Wave 1 and 2 surveys.
*/**/*** Estimate significantly different from zero at the 0.10/0.05/0.01 level.
16%
79%
Respondent'sHomeCommercially-Available SpaceOther
Source: Follow-up surveys, Wave 2.
*/**/*** Estimate significantly different from zero at the 0.10/0.05/0.01 level.
5%

Evaluation of Project GATE 75 May 2008
5.6 Earnings from Businesses
Survey respondents who had owned businesses were asked about the wages and salaries they paid
themselves from each of their own businesses. In spite of the relatively high self-employment rates,
with two out of every five individuals having ever owned a business, very few people reported
receiving wages or salaries through self-employment. Over the entire 18-month follow-up, the
program group earned about $3,200 on average in wages and salary from self-employment, while the
control group earned an average of about $3,400 (see Table V.11). This difference between the
program and control groups was not statistically significant.
Table V.11: Impacts on Business Earnings
Outcome Program
Group MeanControl
Group Mean Impact on All
Eligible Applicants
Earnings from Businesses in Quarter After Random Assignment
Quarter 1 $360 $405 -$44 Quarter 2 463 526 -63 Quarter 3 505 543 -38 Quarter 4 600 608 -8 Quarter 5 634 639 -5 Quarter 6 631 643 -11 All quarters 1 to 6 $3,193 $3,364 -$170
Total Non-Salary Income from Businesses $2,357 $2,511 -$154
Number of Respondents 1,516 1,430 2,946
Source: Follow-up surveys, Waves 1 and 2.
Notes: Reported means and impacts are regression-adjusted to control for differences between the program and control group members in baseline characteristics. Estimates were obtained using weights to adjust for differences between survey respondents and nonrespondents in baseline characteristics.
*/**/*** Estimate significantly different from zero at the 0.10/0.05/0.01 level.
Earnings from businesses were very low. Specifically, earnings from businesses were $5,600 for the
program group members and $7,000 for the control group members (not shown) when conditioned
upon owning a business in the 18 months after random assignment.
Besides wages and salaries, self-employed individuals could have other sources of income through
their businesses, such as bonuses, profit distribution, or owners’ draw from revenues. Such sources

Evaluation of Project GATE 76 May 2008
of non-salary income through self-employment were also low for both the program and control
groups, averaging about $2,500.8
5.7 Differences in the Types of Businesses Developed
Project GATE may influence not only the prevalence and timing of business ownership but also the
characteristics of businesses developed by participants. This section examines the ownership
structure and location, business financing, and industries in which businesses were developed.
5.7.1 Ownership Structure
The ownership structure of respondents’ businesses did not differ significantly between the program
and control group at the Wave 2 survey. Over 60 percent of respondents reported that their current
or most recent business was a sole proprietorship (see Table V.12). Another 25 percent reported
owning corporations, and about 5 percent had partnerships. The control group was more likely to
report a sole proprietorship during the first follow-up, but that difference disappeared by the second
follow-up.
8 The low level of reported total compensation from businesses may be real—most businesses are in their infancy. However, income underreporting may also be playing a role. Underreporting by the self-employed is well documented. Kesselman (1989) estimates that while nearly all wage and salary earnings (98 to 99 percent) were reported to the Internal Revenue Service, those who were self-employed reported only 79 percent of their income. This may be because it is more difficult to accurately measure business earnings than it is to measure wage and salary earnings, or it may be driven by people intentionally understating income for tax reasons. Since more program group members than control group members owned businesses, possible underreporting of self-employment income may disproportionately underestimate the income of the program group.

Evaluation of Project GATE 77 May 2008
Table V.12: Ownership Structure of Most Recent Business at the Wave 2 Follow-up
Program
Group Mean Control
Group Mean Conditional Difference
Sole proprietorship 61% 64% -3
Corporation 27 25 2
Partnership 5 5 0
Cooperative 1 0 1
Other 6 5 1
Number of Respondents 694 624 1,318
Source: Follow-up survey, Wave 2.
Notes: Reported means and differences are regression-adjusted to control for differences between the program and control group members in baseline characteristics. Estimates were obtained using weights to adjust for differences between survey respondents and nonrespondents in baseline characteristics. Means computed using only sample members who owned a business between random assignment and Wave 1. As the means were computed over nonrandom samples of the program and control group, the differences should not be interpreted as impacts.
aThe p-value of a chi-square test of distributional differences equals 0.58.
*/**/*** Estimate significantly different from zero at the 0.10/0.05/0.01 level.
5.7.2 Business Financing
Given that most businesses owned by the study sample were small start-ups, it is not surprising that
respondents tended to fund their businesses with personal resources. About 75 percent of both
program and control group members used their own savings to support their businesses (see Table
V.13). Just over 11 percent took out personal loans, 6 percent received business loans, and 9
percent used other sources of capital.
No significant differences between the program and control groups in whether individuals borrowed
funds overall or from any particular source were detected. Personal loans came from a wide range
of sources, including home equity lines of credit, credit cards, family members, and friends.
Business loans were most often drawn from banks or credit unions. Six GATE participants and two
control group members reported receiving a loan from the SBA’s Microloan program. As discussed
earlier, very few GATE participants had enough personal assets to qualify for traditional business
loans, and their businesses were often not mature enough to show solid earnings histories to satisfy
lenders.

Evaluation of Project GATE 78 May 2008
Table V.13: Financing of Most Recent Business
Outcome Program
Group MeanControl
Group Mean Conditional Difference
Types of Investments in the Business at Wave 2a,b
Participant’s savings 75% 76% -1 Personal loans 11 12 -1 Business loans 6 5 1 Grants 1 1 0 Other capital 9 8 1
Average Amount of Investments in the Business at Wave 2a,c
Total $13,391 $15,655 -$2,264 Participant’s own money $7,296 $8,009 -$713 Personal loans $2,484 $3,701 -$1,216 Business loans $3,245 $2,568 $677 Grants $80 $595 -$515 Other capital $479 $513 -$35
Family Member Owned Part of the Business
Wave 1d 9% 5% 4 *** Wave 2a 10 7 3 *
Percent of Business Owned at Wave 1d
By participant 91% 93% -2 * By family member 4 2 2 ***
Percent of Business Owned at Wave 2a By participant 92% 92% 0 By family member 5 3 2 **
Source: Follow-up survey, Waves 1 and 2.
Notes: Reported means and differences are regression-adjusted to control for differences between the program and control group members in baseline characteristics. Estimates were obtained using weights to adjust for differences between survey respondents and nonrespondents in baseline characteristics. Means computed using only sample members who owned a business between random assignment and Wave 1. As the means were computed over nonrandom samples of the program and control group, the differences should not be interpreted as impacts.
aMeans computed over 1,318 respondents who owned a business between the Wave 1 and 2 surveys. bPercentages do not add to 100 because categories are not mutually exclusive. cAmounts do not add to the total due to missing values in some categories. dMeans computed over 1,217 respondents who owned a business between random assignment and the Wave 1 survey.
*/**/*** Estimate significantly different from zero at the 0.10/0.05/0.01 level.

Evaluation of Project GATE 79 May 2008
It appears, however, that program group members relied more heavily on immediate family
members to invest in their businesses, while control group members invested slightly more of their
own money.
5.7.3 Industry of Businesses
Respondent businesses spanned a very broad spectrum of industries. The most common businesses
included professional services, construction, retail trade, and other services. Individuals who started
professional services businesses were most often consultants in areas such as engineering, marketing,
human resources, computers and information technology, web design, graphic design, legal services,
and accounting. Construction businesses often involved home remodeling, basic carpentry,
plumbing, electrical, and other trades. Most retail businesses involved sales of jewelry, women’s
clothing, gift items, home décor, and other personal items, but some entrepreneurs sold items as
diverse as organic vegetables, firewood, and cremation urns. Massage therapy was the single largest
trade within the other services category, although this group included businesses such as pet
grooming, spiritual consulting, and laundry services.
Project GATE may have affected the types of industries in which participants chose to pursue their
businesses. Classes and business counseling that address issues related to marketing, local
competition, regulations, and other factors could help participants understand whether entering
certain markets was feasible and potentially profitable. Despite this, Project GATE had very little
impact on the types of industries selected by participants for their businesses (see Table V.14).
5.8 Challenges to Starting a Business
Self-employment is not an easy pursuit. Every respondent who attempted to own a business during
the follow-up period reported facing at least one challenge. The most common challenges faced by
both program and control group members were insufficient capital or startup funds, finding clients,
and becoming known or getting exposure (see Table V.15). The challenges reported in the Wave 2
survey were generally similar for the two groups.

Evaluation of Project GATE 80 May 2008
Table V.14: Industry of Most Recent Business at the Wave 2 Follow-up
Program
Group MeanControl
Group Mean Conditional Difference
Professional, Scientific, and Technical Services 17% 14% 2
Construction 10 10 0
Retail Trade 10 11 -2
Other Services (except Public Administration) 10 8 2
Manufacturing 6 4 2 *
Administrative and Support 6 7 -1
Information 5 3 1
Health Care and Social Assistance 5 7 -2
Finance and Insurance 4 3 0
Real Estate and Rental and Leasing 4 5 0
Education Services 4 4 0
Transportation and Warehousing 3 3 1
Arts, Entertainment, and Recreation 2 4 -2 *
Accommodation and Food Services 2 2 1
Wholesale Trade 1 1 0
Agriculture, Forestry, Fishing and Hunting 0 1 -1 *
Other 11 13 -2
Number of Respondents 694 624 1,318 Source: Follow-up survey, Wave 2. Notes: Reported means and differences are regression-adjusted to control for differences between the program and
control group members in baseline characteristics. Estimates were obtained using weights to adjust for differences between survey respondents and nonrespondents in baseline characteristics. Means computed using only sample members who owned a business between random assignment and Wave 1. As the means were computed over nonrandom samples of the program and control group, the differences should not be interpreted as impacts.
aThe p-value of a chi-square test of distributional differences equals 0.42.
*/**/*** Estimate significantly different from zero at the 0.10/0.05/0.01 level.

Evaluation of Project GATE 81 May 2008
Table V.15: Challenges to Starting a Business
Challenge Program
Group Mean Control
Group Mean Conditional Difference
Lack of capital or start-up funds 23% 26% -3
Finding clients 18 20 -3
Becoming known or getting exposure 17 18 -1
Insufficient cash flow 9 9 0
Amount of time and work involved 7 9 -2
Regulations or licenses 5 3 2
Insurance 4 5 0
Problems with Supply or Product or Material Availability 4 4 0
Uncertainty or changing economy 3 2 2 *
Personal or Family Barriers 3 2 1
Insufficient sales 2 1 1
Difficulties hiring qualified staff 2 3 0
Dealing with clients 2 1 1
Finding a location 2 1 1
Local competition 1 1 1
Taxes 1 3 -2 *
Other 23 22 1
Number of Respondents 694 624 1,318
Source: Follow-up surveys, Wave 2.
Notes: Reported means and differences are regression-adjusted to control for differences between the program and control group members in baseline characteristics. Estimates were obtained using weights to adjust for differences between survey respondents and nonrespondents in baseline characteristics. Means computed using only sample members who owned a business between Waves 1 and 2. As the means were computed over nonrandom samples of the program and control group, the differences should not be interpreted as impacts.
*/**/*** Estimate significantly different from zero at the 0.10/0.05/0.01 level.
Table V.16 presents the challenges reported by those who tried to start a business but were not
ultimately successful. Not surprisingly, the types of challenges reported by these individuals differed
sharply from those who owned a business during the follow-up period. Lack of capital or start-up
funds was the single biggest challenge for those who unsuccessfully attempted to start a business.
Finding a location was a barrier for significantly more respondents who were not able to become
self-employed. By comparison, those who reported owning a business during the follow-up period

Evaluation of Project GATE 82 May 2008
were more likely to report challenges related to finding clients, becoming known or getting exposure,
hiring staff, and insufficient cash flow.
Table V.16: Challenges to Starting a Business, By Success at Starting a Business, Among Both Program and Control Groups
Challenge
Mean for Those Who
Attempted But Did Not Own
A Business
Mean for Those Who Owned A Business
Conditional Difference
Lack of capital or start-up funds 51% 25% -26 ***
Becoming known or getting exposure 11 17 6 ***
Finding clients 11 19 8 *** Amount of time and work involved 7 8 1
Regulations or licenses 6 5 -1
Finding a location 4 2 -2 *
Insufficient cash flow 3 9 6 ***
Insurance 3 4 1
Problems with supply or product or material availability 3 4 1 Taxes 2 2 1
Uncertainty or changing economy 2 2 1
Personal or family barriers 2 3 0
Insufficient sales 1 1 0
Local competition 1 1 0
Dealing with clients 1 1 0
Difficulties hiring qualified staff 0 2 2 ***
Other 27 23 -4
Number of Respondents 418 1,318 1,736 Source: Follow-up surveys, Wave 2. Notes: Reported means and differences are regression-adjusted to control for differences between the program and
control group members in baseline characteristics. Estimates were obtained using weights to adjust for differences between survey respondents and nonrespondents in baseline characteristics. As the means were computed over nonrandom samples of the program and control group, the differences should not be interpreted as impacts.
*/**/*** Estimate significantly different from zero at the 0.10/0.05/0.01 level.

Evaluation of Project GATE 83 May 2008
This chapter has examined the impact of Project GATE on business ownership and the dynamics of
business start-up. The next chapter examines whether Project GATE increased total employment
and earnings from self-employment and wage and salary employment combined. Outcomes of
interest include the total employment rate, the number of months worked, the number of hours
worked, earnings, and job satisfaction. Characteristics of wage and salary jobs held by GATE
sample members are also described.

Evaluation of Project GATE 84 May 2008
Key Findings: Impacts on Employment and Earnings
Project GATE had no significant impact on the likelihood of participants being
employed, either from self-employment or from working for someone else, at any point during the follow-up period.
Project GATE did, however, affect the type of employment. GATE participants were less likely to be employed in wage and salary jobs during the first six months after random assignment and more likely to be self-employed compared to their control group counterparts. There were no significant differences later in the follow-up period.
Project GATE did not increase earnings from employment and may have significantly decreased them. Project GATE had no impact on self-employment earnings. On the survey, GATE participants reported earning about $1,800 less from wage and salary jobs over the follow-up period, and hence, their total earnings were significantly lower than the control group’s earnings. However, no impacts on earnings from wage and salary jobs were found using the administrative data.
Individuals who were UI recipients at the time of application to Project GATE suffered less of a fall in wage and salary earnings from participating in Project GATE than non-UI recipients.
CHAPTER VI. DID PROJECT GATE INCREASE TOTAL
EMPLOYMENT AND EARNINGS?
While the primary objective of Project GATE was business development, the project was also
viewed as a workforce development tool. The hope was that Project GATE would increase
employment and self-sufficiency by providing another avenue for employment—working for
oneself. This chapter explores how Project GATE affected employment and earnings from wage
and salary jobs and thus affected total employment—whether working for oneself or for someone
else. The key findings are summarized in the box below.
The findings presented in Chapter V suggest that Project GATE increased self-employment but had
no impacts on self-employment earnings. Project GATE could still affect total employment and
earnings, however, if the program affected employment in wage and salary jobs.

Evaluation of Project GATE 85 May 2008
Hypothetically, Project GATE could affect employment at wage and salary jobs in several different
ways. If GATE participants mainly start small-scale businesses that they operate in addition to their
regular jobs, it might have no effect on employment in wage and salary jobs. More likely, though,
some GATE participants will elect to stop working or cease searching for jobs in favor of pursuing
self-employment opportunities. Conversely, GATE may help participants to recognize sooner the
challenges of owning a business, in which case some participants may be less inclined to start a
business and will instead be more likely to seek employment at a wage and salary job. Furthermore,
GATE participants may also increase employment in wage and salary jobs if GATE participants
who do not start businesses still develop skills or contacts that can help them find wage and salary
jobs.
If Project GATE leads to more people starting a business rather than taking wage and salary jobs or
more people starting businesses concurrently with wage and salary jobs, total employment would
remain unchanged. But total employment could in fact increase if Project GATE helps people who
would struggle to find employment or who would not have chosen to work at a wage and salary job
to start their own businesses. This is consistent with previous findings in separate studies by Evans
and Leighton (1989) and Meager (1992). An evaluation of the UI Self-Employment Demonstration
in Massachusetts also found some evidence of this. The Massachusetts program increased the
number of months in self-employment and employment in wage and salary jobs, and hence
increased total employment (Benus et al. 1995). The same evaluation found that participants in
Washington were more likely to be self-employed and less likely to be employed in wage and salary
jobs, but the former effect was larger, leading to increases in total employment.
This chapter begins by discussing the sources of data on employment and earnings. It then
discusses the impacts of Project GATE on employment rates and months and hours worked. Next,
it discusses the impacts on participants’ earnings. The chapter concludes with an examination of the
effects of Project GATE on job satisfaction and the characteristics of jobs for those who were
employed.

Evaluation of Project GATE 86 May 2008
6.1 Sources of Data on Employment and Earnings
Two sources of data are available on employment and earnings: survey data and UI administrative
data. The survey data was collected in two waves (at approximately 6 months and approximately 18
months after random assignment). At each wave of the survey, respondents were asked about all
the wage and salary jobs they had held since either random assignment (at the Wave 1 survey) or the
previous wave of the survey (at the Wave 2 survey). Specifically, the respondents were asked about
“full and part-time jobs (including military service) you may have held since random assignment or
the date of last interview where you were working for someone else.” If they reported that they had
worked at a wage and salary job, they were asked about the beginning and end date of each job.
These data were then used to construct a history of employment over each week of the follow-up
period.
The UI administrative data consist of total quarterly earnings reported by employers to state UI
agencies. By law, most employers are subject to a state UI tax and must report what is paid to each
employee, including regular earnings, overtime, tips, and bonuses. Excluded workers include
railroad employees, workers in service for relatives, most agricultural labor, some domestic service
workers, part-time employees of nonprofit organizations, and some workers who are casually
employed “not in the course of the employer’s business” (Federal Unemployment Tax Act, Section
3306). They also exclude workers whose employers (illegally) do not report their earnings to the UI
agency. As these data are collected by each state UI agency, they cover only jobs in that state.
Perhaps most importantly for this study, self-employed workers are not included, so this data source
can only be used for wage and salary jobs.
UI administrative data were collected from each of the three demonstration states for four quarters
before and four quarters after random assignment. Due to lags in the availability of UI
administrative data, data for the fifth and sixth quarters after random assignment were not obtained.
The UI records only provide data on earnings by quarters. These quarters are defined as calendar
quarters, and so they cannot be cleanly mapped into 13-week periods relative to the date of random
assignment. In an attempt to line up the calendar quarters with time since random assignment, the
first quarter after random assignment is defined as the calendar quarter in which a customer was

Evaluation of Project GATE 87 May 2008
randomly assigned if random assignment for that person happened during the first half of the
quarter, or the following calendar quarter if random assignment was in the latter half of a calendar
quarter.
Each data source has its advantages and disadvantages. The advantages of the survey data source
are that it includes all employment—irrespective of whether the job was covered by the UI data or
which state it was in—and the exact timing of the employment is known. In addition, it provides
data on self-employment. The advantages of the administrative data are that it is free of survey
recall error and is available for all sample members, not just those who responded to the survey.
However, the data cover only wage and salary employment and information is only available by
calendar quarter.
6.2 Employment Rate
This section examines the impact of Project GATE on the probability of being self-employed, the
probability of being employed in a wage and salary job, and the probability of total employment—
defined as either self-employment or working for someone else.
6.2.1 Self-Employment Rate
Project GATE participants were more likely to report owning a business in each quarter, an effect
that is especially pronounced in the early quarters after random assignment (see Table VI.1). The
impact is 5 percentage points for the first two quarters after random assignment and 6 percentage
points in the third quarter, but falls to 3 percentage points by the end of the follow-up period.
Also, as reported earlier, the impact on the self-employment rate was larger for those sample
members who were receiving UI when they applied to Project GATE. The impact was 7 and 9
percentage points in the first two quarters after random assignment and fell to 6 percentage points
by the end of the follow-up period (see Table VI.2).

Evaluation of Project GATE Page 88 May 2008
6.2.2 Employment Rate at Wage and Salary Jobs
While administrative data are not available on self-employment, data on employment in wage and
salary jobs are available from both the follow-up surveys and the UI administrative data.
Survey Data. In the survey data, the positive impact on the probability of being self-employed was
mirrored by a correspondingly negative impact on being employed in a wage and salary job. In the
first quarter after random assignment, 45 percent of GATE participants were employed in a wage
and salary job compared with 50 percent of the control group (see Table VI.1 and Figure VI.1). The
impact on the wage and salary employment rate was negative in each quarter. At the time of the
Wave 2 survey, the impact was only 2 percentage points and was not statistically significant.
The percentage of sample members in wage and salary jobs grew over the follow-up period in both
groups, and in the final quarter, three out of every five individuals in each group were employed in a
wage and salary job. Over the entire follow-up period, 77 percent of control group members had
been employed at a wage and salary job compared to 74 percent of program group members, a
statistically significant difference at the 5 percent level.
This general employment pattern holds for all the sites and most subgroups but is especially
pronounced in the largest site, Minneapolis/St. Paul, as well as in Pittsburgh (see Figure VI.2)—the
two sites with the largest impact on the probability of self-employment. The point estimate for
northeast Minnesota is large and positive, but due to the small sample in this site, it is not precisely
estimated.
The impacts on employment for participants who received UI at application are shown in Table
VI.2. As expected, UI recipients in both the program and control groups are less likely than non
UI-recipients to be employed in wage and salary jobs in the first quarter after random assignment.
However, the difference is larger for the program group. Hence, the negative impact on
employment in the first quarter is larger for the UI recipients—10 percentage points, which is
significant at the 1 percent level, compared with 3 percentage points for non UI-recipients (not
shown), which is not statistically significant. By the end of the follow-up period, the impact on
employment was not statistically significant for either UI recipients or non-UI recipients.

Evaluation of Project GATE 89 May 2008
Table VI.1: Impacts on Employment Using The Survey Data
Outcome Program
Group MeanControl
Group Mean
Impact on All Eligible
Applicants
Self-Employed in Quarter After Random Assignment
Quarter 1 37% 32% 5 ***Quarter 2 41 36 5 ***Quarter 3 43 37 6 ***Quarter 4 42 38 4 ***Quarter 5 44 40 4 ***Quarter 6 44 41 3 * Any quarter 1 to 6 55 49 6 ***
Currently Self-Employed at Wave 2 Follow-up 44% 40% 3 *
Worked for Someone Else in Quarter After Random Assignment
Quarter 1 45% 50% -5 ***Quarter 2 55 59 -4 ***Quarter 3 57 60 -2 Quarter 4 56 59 -3 Quarter 5 58 62 -4 ** Quarter 6 60 63 -2 Any quarter 1 to 6 74 77 -3 **
Currently Employed in Wage and Salary Job at Wave 2 Follow-up
56% 59% -2
Worked for Self or Someone Else in Quarter After Random Assignment
Quarter 1 71% 70% 1 Quarter 2 80 80 0 Quarter 3 83 82 2 Quarter 4 82 81 1 Quarter 5 85 84 0 Quarter 6 86 85 1 Any quarter 1 to 6 94 93 1
Number of Respondents 1,516 1,430 2,946
Source: Follow-up surveys, Waves 1 and 2.
Notes: Reported means and impacts are regression-adjusted to control for differences between the program and control group members in baseline characteristics. Estimates were obtained using weights to adjust for differences between survey respondents and non-respondents in baseline characteristics.
*/**/*** Estimate significantly different from zero at the 0.10/0.05/0.01 level.

Evaluation of Project GATE 90 May 2008
Table VI.2: Impacts on Employment Using The Survey Data For Sample Members Who Were Receiving Unemployment Insurance at GATE Application
Outcome Program
Group MeanControl
Group Mean
Impact on All Eligible
Applicants
Self-Employed After Random Assignment
Quarter 1 38% 31% 7 *** Quarter 2 45 36 9 *** Quarter 3 46 37 9 *** Quarter 4 46 39 7 ** Quarter 5 47 40 8 *** Quarter 6 47 41 6 **
Any quarter 1 to 6 58 49 9 ***
Currently Self-Employed at Wave 2 Follow-up 44% 41% 5 **
Worked for Someone Else After Random Assignment
Quarter 1 33% 43% -10 *** Quarter 2 49 57 -7 ** Quarter 3 56 59 -3 Quarter 4 56 62 -7 ** Quarter 5 60 65 -6 ** Quarter 6 63 65 -2
Any quarter 1 to 6 74 78 -4
Currently Employed in Wage and Salary Job at Wave 2
59% 61% -2
Worked for Self or Someone Else After Random Assignment
Quarter 1 63% 64% -2 Quarter 2 79 80 -0 Quarter 3 85 82 3 Quarter 4 84 85 -1 Quarter 5 88 87 1 Quarter 6 91 89 2
Any quarter 1 to 6 96 95 1
Number of Respondents 642 562 1,204
Source: Follow-up surveys, Waves 1 and 2.
Notes: Reported means and impacts are regression-adjusted to control for differences between the program and control group members in baseline characteristics. Estimates were obtained using weights to adjust for differences between survey respondents and non-respondents in baseline characteristics.
*/**/*** Estimate significantly different from zero at the 0.10/0.05/0.01 level.

Evaluation of Project GATE 91 May 2008
Figure VI.1: Wage and Salary Job Employment by Quarter
Figure VI.2: Impacts on Whether Employed at a Wage and Salary Job In the 18 Months After Random Assignment, By Site
81 8375
7068
81
70**74**82
74** 7577
0102030405060708090
100
All Sites Philadelphia Pittsburgh Minneapolis/St. Paul
NortheastMinnesota
Maine
Perc
enta
ge o
f Res
pond
ents
Program Group Control Group
Source: Follow-up surveys, Waves 1 and 2.
*/**/*** Estimate significantly different from zero at the 0.10/0.05/0.01 level.
6058**565755**45***
63595959 62
50
0102030405060708090
100
1 2 3 4 5 6Quarter Since Random Assignment
Perc
enta
ge o
f Res
pond
ents
Program Group Control Group
Source: Follow-up surveys, Waves 1 and 2.
*/**/*** Estimate significantly different from zero at the 0.10/0.05/0.01 level.

Evaluation of Project GATE 92 May 2008
Administrative Data. The estimated impacts on the employment rate from the administrative and
survey data were qualitatively similar, and the mean employment rates for the program and control
groups were also similar (see Table VI.3). The employment rate was 51 and 52 percent in the first
quarter after random assignment (for the program and control group, respectively) and rose to 57
and 58 percent in the fourth quarter after random assignment. In each of the first three quarters
after random assignment, the impacts were negative whether estimated using the survey or
administrative data. However, unlike the findings from the survey data, the UI administrative data
yielded no significant impacts on employment in the first four quarters after random assignment,
with the exception of the second quarter after random assignment, when the three percentage point
impact was significant at the 10 percent level. This finding was consistently observed for each site
and subgroup, including those who were receiving UI at application.
Table VI.3: Impacts on Wage and Salary Employment Using Administrative Data
Outcome Program
Group MeanControl
Group Mean
Impact on All Eligible
Applicants
Worked for Someone Else in Quarter After Random Assignment
Four quarters before random assignment 74% 72% 2 Three quarters before random assignment 73 71 2 Two quarters before random assignment 69 68 1 One quarter before random assignment 60 58 2
Quarter 1 51 52 -1 Quarter 2 54 57 -3 * Quarter 3 57 58 -1 Quarter 4 57 58 0
Any quarter 1 to 4 73 74 -1
Full Sample Size 2,034 2,044 4,078 Source: UI administrative earnings records.
Notes: Reported means and impacts are regression-adjusted to control for differences between the program and control group members in baseline characteristics.
*/**/*** Estimate significantly different from zero at the 0.10/0.05/0.01 level.

Evaluation of Project GATE 93 May 2008
6.2.3 Total Employment Rate The findings thus far have demonstrated that GATE participants are more likely to be self-
employed but less likely to be working in wage and salary jobs during the early quarters after random
assignment. Combining these measures permits a more formal exploration of whether Project
GATE is causing prospective entrepreneurs to stop working in wage and salary jobs in favor of
starting their own businesses or if Project GATE is generating a net gain in overall employment,
combining self-employment and wage and salary jobs.
Overall employment rates increased from about 70 percent in the first quarter after random
assignment to 85 percent by the end of the follow-up period, but there were no significant
differences between the program and control groups in any of the six quarters or in the six quarters
combined (see Table VI.1 and Figure VI.3). At some point in the six quarters after random
assignment, 94 percent of GATE participants and 93 percent of the control group were employed in
some form. This finding was generally similar across all sites and subgroups.
Figure VI.3: Total Employment by Quarter
As some people work in the same quarter on their business and have a wage and salary job, the sum
of the self-employment rate and the wage and salary employment rate exceeds the total employment
rate.
7080 82 81 84 85
8682838085
71
0102030405060708090
100
1 2 3 4 5 6
Quarter Since Random Assignment
Perc
enta
ge o
f Res
pond
ents
Program Group Control Group
Source: Follow-up surveys, Waves 1 and 2.
*/**/*** Estimate significantly different from zero at the 0.10/0.05/0.01 level.

Evaluation of Project GATE 94 May 2008
For example, in the sixth quarter after random assignment, 26 percent of the program group only
worked for themselves and 42 percent only worked at a wage and salary job, 18 percent worked for
themselves and someone else, and only 14 percent did not work at all.
6.3 Months Worked
The employment rate only indicates whether the sample member worked at all during the quarter.
Another indication of the extent of employment is the number of months worked. Data on the
number of months in self-employment and wage and salary employment are available from the
survey, but not from the UI administrative data.
6.3.1 Months Worked at Self-Employment
The number of months that sample members worked for themselves follows the pattern of the self-
employment rate. In the first three-month quarters after random assignment, program group
members worked 1 month and control group members worked 0.9 of a month (see Table VI.4).
The impact of 0.1 of a month (about 3 days) is statistically significant. The impact peaks at 0.2 of a
month in quarters 2 and 3 and then declines back to 0.1 of a month.
6.3.2 Months Worked at Wage and Salary Jobs
The number of months that sample members worked at a wage and salary job mirrors the number
of months sample members worked for themselves. In each quarter program group members work
about 0.1 of a month less than control group members, a difference that is statistically significant in
four out of the six quarters (see Table VI.4).
6.3.3 Total Months Worked
The impacts on total months employed followed a similar pattern to the impacts on total
employment rates (see Table VI.4). In the first quarter after random assignment, sample members
worked—in either self-employment or wage and salary employment—about 1.8 out of the 3 months
in the quarter. This increased to about 2.4 months out of the 3 months in the final quarter of the
follow-up period, but in none of the quarters were there any differences between the program and
control group members.

Evaluation of Project GATE 95 May 2008
Table VI.4: Impacts on Months Employed
Outcome Program
Group MeanControl
Group Mean Impact on All
Eligible Applicants
Months Self-Employed in Quarter After Random Assignment
Quarter 1 1.0 0.9 0.1 ** Quarter 2 1.2 1.0 0.2 *** Quarter 3 1.3 1.1 0.2 *** Quarter 4 1.2 1.1 0.1 *** Quarter 5 1.3 1.1 0.1 *** Quarter 6 1.2 1.2 0.1 * All quarters 1 to 6 7.1 6.3 0.8 ***
Months Working in Wage and Salary Jobs in Quarter After Random Assignment
Quarter 1 1.1 1.2 -0.1 *** Quarter 2 1.4 1.5 -0.1 ** Quarter 3 1.6 1.6 -0.1 Quarter 4 1.6 1.6 -0.1 Quarter 5 1.6 1.7 -0.1 ** Quarter 6 1.6 1.7 -0.1 * All quarters 1 to 6 8.8 9.4 -0.5 **
Months Either Self-Employed or Working in Wage and Salary Jobs in Quarter After Random Assignment
Quarter 1 1.8 1.8 0.0 Quarter 2 2.2 2.2 0.0 Quarter 3 2.4 2.3 0.1 Quarter 4 2.4 2.3 0.1 Quarter 5 2.4 2.4 0.0 Quarter 6 2.4 2.4 0.0 All quarters 1 to 6 13.5 13.3 0.2
Number of Respondents 1,516 1,430 2,946
Source: Follow-up surveys, Waves 1 and 2.
Notes: Reported means and impacts are regression-adjusted to control for differences between the program and control group members in baseline characteristics. Estimates were obtained using weights to adjust for differences between survey respondents and nonrespondents in baseline characteristics.
*/**/*** Estimate significantly different from zero at the 0.10/0.05/0.01 level.

Evaluation of Project GATE 96 May 2008
6.4 Hours Worked
Employment rates and months worked are informative about whether individuals worked, but they do
not address how much people worked. A related measure that more directly addresses the intensity of
employment is hours worked in a given time period, the focus of this section. Project GATE could
have affected hours worked either through employment rates or by increasing the number of hours
worked by individuals who were employed, or both. As hours worked are not tracked in the UI
administrative data, the results in this section come exclusively from the survey data.
6.4.1 Hours Worked at Self-Employment
Consistent with their employment rates, Project GATE participants also worked more total hours in
self-employment during this period. The program group spent 205 hours in self-employment during
the sixth (final) quarter of the follow-up period compared to 176 for the control group (see Table
VI.5). The impact on hours worked is especially notable because in percentage terms, the 30-hour
impact is larger than the difference in the self-employment rate in quarter 6 and is statistically
significant at the 5-percent level, whereas the impact on self-employment rates is only marginally
significant. This occurred because Project GATE increased the hours worked per week among the
self-employed as well as the self-employment rate.
6.4.2 Hours Worked at Wage and Salary Jobs
Consistent with the pattern of employment rates and months worked found in the survey data,
Project GATE participants worked fewer hours at wage and salary jobs in each quarter (see Table
VI.5). While the positive impacts on hours of self-employment were largest in the third to sixth
quarters, the negative impacts on hours in wage and salary employment were only statistically
significant in the first three quarters. In the first quarter after random assignment, the program
group worked 27 hours less at wage and salary jobs than did the control group (169 compared with
196), and over the full follow-up period, the program group worked an average of 1,419 hours, or
121 hours less than the control group.

Evaluation of Project GATE 97 May 2008
Table VI.5: Impacts on Hours Worked
Outcome Program
Group MeanControl
Group Mean
Impact on All Eligible
Applicants
Hours Worked at Own Businesses in Quarter After Random Assignment
Quarter 1 152 138 13 Quarter 2 191 165 25 *** Quarter 3 205 171 34 *** Quarter 4 201 170 31 *** Quarter 5 212 175 37 *** Quarter 6 205 176 30 *** All quarters 1 to 6 1,162 992 170 ***
Hours Worked at Wage and Salary Jobs in Quarter After Random Assignment
Quarter 1 169 196 -27 *** Quarter 2 220 249 -29 *** Quarter 3 248 272 -25 ** Quarter 4 256 265 -8 Quarter 5 271 285 -13 Quarter 6 270 284 -14 All quarters 1 to 6 1,419 1,540 -121 ***
Hours Worked at Both Wage and Salary Jobs and Self-Employment in Quarter After Random Assignment
Quarter 1 321 334 -13 Quarter 2 411 415 -4 Quarter 3 455 446 10 Quarter 4 458 434 23 ** Quarter 5 484 459 24 ** Quarter 6 475 459 16 All quarters 1 to 6 2,594 2,543 51
Number of Respondents 1,516 1,430 2,946
Source: Follow-up surveys, Waves 1 and 2.
Notes: Reported means and impacts are regression-adjusted to control for differences between the program and control group members in baseline characteristics. Estimates were obtained using weights to adjust for differences between survey respondents and nonrespondents in baseline characteristics.
*/**/*** Estimate significantly different from zero at the 0.10/0.05/0.01 level.
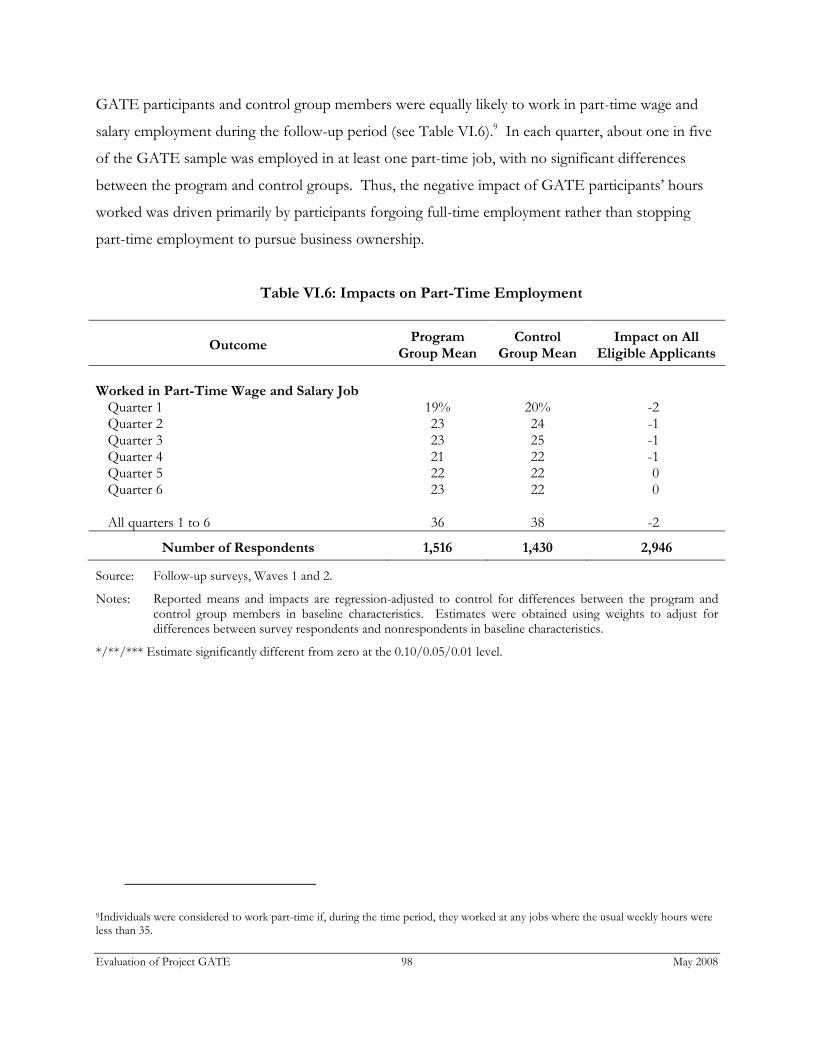
Evaluation of Project GATE 98 May 2008
GATE participants and control group members were equally likely to work in part-time wage and
salary employment during the follow-up period (see Table VI.6).9 In each quarter, about one in five
of the GATE sample was employed in at least one part-time job, with no significant differences
between the program and control groups. Thus, the negative impact of GATE participants’ hours
worked was driven primarily by participants forgoing full-time employment rather than stopping
part-time employment to pursue business ownership.
Table VI.6: Impacts on Part-Time Employment
Outcome Program
Group Mean Control
Group Mean Impact on All
Eligible Applicants
Worked in Part-Time Wage and Salary Job
Quarter 1 19% 20% -2 Quarter 2 23 24 -1 Quarter 3 23 25 -1 Quarter 4 21 22 -1 Quarter 5 22 22 0 Quarter 6 23 22 0 All quarters 1 to 6 36 38 -2
Number of Respondents 1,516 1,430 2,946
Source: Follow-up surveys, Waves 1 and 2.
Notes: Reported means and impacts are regression-adjusted to control for differences between the program and control group members in baseline characteristics. Estimates were obtained using weights to adjust for differences between survey respondents and nonrespondents in baseline characteristics.
*/**/*** Estimate significantly different from zero at the 0.10/0.05/0.01 level.
9Individuals were considered to work part-time if, during the time period, they worked at any jobs where the usual weekly hours were less than 35.

Evaluation of Project GATE 99 May 2008
6.5 Earnings
From a benefit-cost perspective, the most important employment outcome is the impact of Project
GATE on participants’ earnings. This impact not only informs the extent to which Project GATE
increased participants’ overall income, but is also a measure of the additional output produced in
society as a whole. Measures of participants’ earnings from wage and salary jobs are available
through both the survey and UI administrative data; however, self-employment is not covered by UI
law, and consequently, measures of earnings from self-employment must rely on the follow-up
surveys alone.
6.5.1 Earnings from Self-Employment
As discussed in the previous chapter, earnings from businesses were extremely low in every quarter.
Moreover, even though program group members were slightly more likely to start a business, their
earnings from self-employment were no higher than the control group members’ earnings from self-
employment (see Table VI.7).
Even among UI recipients, for whom the impacts on business ownership were largest, Project
GATE had no significant impact on earnings from self-employment (see Table VI.8). The impacts
on earnings from businesses in each quarter after random assignment were negative, but small and
not statistically significant.
6.5.2 Earnings from Wage and Salary Jobs
Survey Data. Given that GATE participants were less likely to be employed in wage and salary
jobs and worked fewer total hours, it is not surprising that their earnings were also lower. GATE
participants reported on the surveys earning less than the control group from wage and salary jobs in
each of the six quarters after random assignment, a difference that was statistically significant in the
first three quarters (see Table VI.7). While the differences were not statistically significant in
quarters 4 through 6, over the six quarters combined, GATE participants earned on average $1,798
less than their control group counterparts ($24,337 versus $26,135), a difference that was statistically
significant at the 10 percent level.

Evaluation of Project GATE 100 May 2008
Table VI.7: Impacts on Earnings Using Survey Data for the Full Sample
Outcome Program
Group MeanControl
Group Mean Impact on All
Eligible Applicants
Earnings from Businesses in Quarter After Random Assignment
Quarter 1 $360 $405 -$44 Quarter 2 $463 $526 -$63 Quarter 3 $505 $543 -$38 Quarter 4 $600 $608 -$8 Quarter 5 $634 $639 -$5 Quarter 6 $631 $643 -$11 All quarters 1 to 6 $3,193 $3,364 -$170
Total Non-Salary Income from Businesses $2,357 $2,511 -$154
Earnings from Wage and Salary Jobs in Quarter After Random Assignment
Quarter 1 $2,712 $3,063 -$351 ** Quarter 2 $3,586 $3,943 -$357 * Quarter 3 $4,126 $4,471 -$345 * Quarter 4 $4,441 $4,545 - $104 Quarter 5 $4,730 $4,996 -$266 Quarter 6 $4,745 $5,098 -$353 All quarters 1 to 6 $24,337 $26,135 -$1,798 *
Total Earnings from All Jobs and Businesses in Quarter After Random Assignmenta
Quarter 1 $3,072 $3,468 -$396 ** Quarter 2 $4,049 $4,469 -$420 ** Quarter 3 $4,632 $5,014 -$381 * Quarter 4 $5,044 $5,153 -$110 Quarter 5 $5,366 $5,635 -$270 Quarter 6 $5,279 $5,741 -$362 All quarters 1 to 6 $27,543 $29,504 -$1,960 *
Number of Respondents 1,516 1,430 2,946 Source: Follow-up surveys, Waves 1 and 2. Notes: Reported means and impacts are regression-adjusted to control for differences between the program and
control group members in baseline characteristics. Estimates were obtained using weights to adjust for differences between survey respondents and nonrespondents in baseline characteristics.
a Does not include non-salary income from businesses */**/*** Estimate significantly different from zero at the 0.10/0.05/0.01 level.

Evaluation of Project GATE 101 May 2008
Table VI.8: Impacts on Earnings Using Survey Data for Sample Members Who Received UI at Application
Outcome Program
Group MeanControl
Group Mean Impact on All
Eligible Applicants
Earnings from Businesses in Quarter After Random Assignment
Quarter 1 $290 $438 -$148 Quarter 2 $421 $574 -$152 Quarter 3 $494 $630 -$136 Quarter 4 $587 $658 -$72 Quarter 5 $671 $752 -$82 Quarter 6 $651 $724 -$73 All quarters 1 to 6 $3,114 $3,776 -$662
Total Non-Salary Income from Businesses $3,033 $2,410 $623
Earnings from Wage and Salary Jobs in Quarter After Random Assignment
Quarter 1 $1,659 $2,285 -$626 ** Quarter 2 $3,123 $3,759 -$636 * Quarter 3 $4,166 $4,493 -$326 Quarter 4 $4,784 $4,608 $176 Quarter 5 $5,279 $5,000 $278 Quarter 6 $5,384 $5,185 $198 All quarters 1 to 6 $24,404 $25,340 -$936
Total Earnings from All Jobs and Businesses in Quarter After Random Assignmenta
Quarter 1 $1,949 $2,724 -$775 *** Quarter 2 $3,544 $4,334 -$789 ** Quarter 3 $4,660 $5,124 -$464 Quarter 4 $5,371 $5,266 $105 Quarter 5 $5,951 $5,752 $198 Quarter 6 $6,036 $5,909 $127 All quarters 1 to 6 $27,522 $29,123 -$1,601
Number of Respondents 642 562 1,204 Source: Follow-up surveys, Waves 1 and 2. Notes: Reported means and impacts are regression-adjusted to control for differences between the program and
control group members in baseline characteristics. Estimates were obtained using weights to adjust for differences between survey respondents and nonrespondents in baseline characteristics.
a Does not include non-salary income from businesses */**/*** Estimate significantly different from zero at the 0.10/0.05/0.01 level.

Evaluation of Project GATE 102 May 2008
The impacts on earnings could conceivably be driven by a handful of individuals with unusually high
earnings. To check the extent to which the impacts hold across the earnings distribution—not just
for the highest earners in the sample—impacts for the median participant were separately estimated
and then compared to the reported average impacts. These results used quantile regressions to
control for baseline characteristics, analogous to the main set of results. The findings corroborated
both the statistical significance and the magnitude of the results reported here; the impacts were
somewhat smaller in the first two quarters after random assignment, but still negative.
As with employment rates, the impacts were most pronounced in Minneapolis/St. Paul (not shown).
The impacts on wage and salary earnings were negative in all sites except Maine. The decrease in
earnings was largest in the Minnesota sites, although an F-test could not reject that the impacts were
the same in all sites.
The impacts on wage and salary earnings for those who received UI at application follow a similar
pattern to the impacts for the full sample (see Table VI.8). In the first few quarters, the impact is
negative and statistically significant. However, unlike the full sample, the impacts on wage and salary
earnings for UI recipients become positive in quarter 4, although they are not statistically significant.
Over the entire follow-up period, program group members in this subgroup earn about $900 less
than the control group members in this subgroup, although this impact is not statistically significant.
Table VI.9 presents the impacts on wage and salary earnings for a number of subgroups. The
negative impact on earnings was largest for those who were less than 40 years old at GATE
application. However, the difference in the impacts between those in the subgroup and those not in
the subgroup was not statistically significant for any of the subgroups in Table VI.9.
Administrative Data. The earnings in the UI administrative data were lower than the earnings
reported on the survey in each quarter. For example, in the first quarter after random assignment,
the average control group member earned $3,063 according to the survey data (see Table VI.7) and
$2,871 according to the administrative data (see Table VI.10)—a 7 percent difference.

Evaluation of Project GATE 103 May 2008
Table VI.9: Impacts on Survey-Reported Wage and Salary Earnings in the 18 Months After Random Assignment, By Subgroup
Subgroupa Program
Group MeanControl
Group Mean
Impact on All Eligible
Applicants
Receiving Unemployment Insurance at Random Assignment
Yes $24,404 $25,340 -$936 No 24,304 26,607 -2,302 *
Submitted a UI Claim in Quarter Prior to Random Assignment
Yes 22,693 25,296 -2,603 No 24,959 26,370 -1,412
Working at Random Assignment Yes 37,733 40,604 -2,870 No 18,934 20,226 -1,292
Self-Employed at Random Assignment Yes 18,759 18,971 -212 No 25,759 27,880 -2,122 *
Ever Self-Employed Prior to Random Assignment
Yes 20,058 20,294 -237 No 27,137 29,802 -2,665 *
Gender Male 25,767 26,835 -1,068 Female 22,789 25,347 -2,558 *
Age Greater Than or Equal to 40 Years Yes 23,373 23,734 -361 No 26,439 30,341 -3,902 **
Education Greater Than 12th Grade Yes 30,443 30,388 55 No 20,226 23,080 -2,854 **
Race is White Yes 24,060 25,602 -1,542 No 24,763 26,785 -2,021
Source: Follow-up surveys, Waves 1 and 2.
Notes: Reported means and impacts are regression-adjusted to control for differences between the program and control group members in baseline characteristics. Estimates were obtained using weights to adjust for differences between survey respondents and nonrespondents in baseline characteristics.
aDefined by characteristics reported on the GATE application form prior to random assignment.
*/**/*** Estimate significantly different from zero at the 0.10/0.05/0.01 level.
†/††/††† Estimates significantly different between subgroups at the 0.10/0.05/0.01 level.

Evaluation of Project GATE 104 May 2008
Unlike the survey data, the UI administrative earnings records revealed a very small negative impact
on wage and salary earnings of $196 over the first year after random assignment, a difference that is
not statistically significant.
The impact on wage and salary earnings over the first four quarters among UI recipients (not
shown) was positive in the administrative earnings data ($633) and negative in the survey data
(-$1,412), although it was not statistically significant using either source of data.
Table VI.10: Earnings from Wage and Salary Jobs After Random Assignment Using Administrative Data
Outcome Program
Group Mean Control
Group Mean
Impact on All Eligible
Applicants
Earnings from Wage and Salary Jobs in Quarter After Random Assignment
Quarter 1 2,892 2,871 22 Quarter 2 3,282 3,412 -130 Quarter 3 3,727 3,807 -80 Quarter 4 3,921 3,929 -8 All quarters 1 to 4 13,823 14,019 -196
Full Sample Size 2,034 2,044 4,078 Source: UI administrative earnings records.
Notes: Reported means and impacts are regression-adjusted to control for differences between the program and control group members in baseline characteristics.
*/**/*** Estimate significantly different from zero at the 0.10/0.05/0.01 level.
Differences Between the Two Sources of Data. The earnings reported on the survey are higher
than the earnings reported in the administrative data for both the program and control groups
(except in the first quarter). However, the differences in the impacts occur because the differences
in earnings between the two data sources are larger for the control group. In quarter 2, for example,
the survey-reported earnings are higher than the administrative-reported earnings by 9 percent for
the program group and 16 percent for the control group.

Evaluation of Project GATE 105 May 2008
Conceivably, the two sources of data could have yielded different estimates because the survey data
was restricted to survey respondents whereas the UI administrative data is available for the full
sample. However, the findings on employment rates and earnings were similar when the analysis of
UI administrative data was restricted to survey respondents, suggesting that survey nonresponse was
not biasing the estimates based on survey data.
The survey data and UI administrative data could have differed for other reasons. As mentioned
above, UI administrative data come from the records filed by employers with their states’ UI
agencies, and thus, these records will not include jobs in which the employer does not report
earnings because the earnings are not covered by the UI system. In other cases, the UI
administrative data for a given individual may be missing if the person moved out of state or the
employer did not have the correct Social Security Number, in which case the person would be
incorrectly categorized as non-employed (Hotz and Scholz 2001).
Employers could also understate earnings or pay workers in cash to avoid taxes. On the other hand,
the survey respondents may not have accurately recalled when jobs started and ended. For the
overall impacts to deviate so strongly in the first two quarters of the follow-up period would require
that the discrepancies were systematically different for the program and control groups.
In the survey, the program and control groups were equally likely to have reported working but not
have any record of employment in the administrative data (and vice versa). The main discrepancy is
in reported earnings among those who were employed according to both sources of data—on
average, the gap between earnings according to the survey data compared to the administrative data
is positive for both the program and control groups, but it is larger for the control group. This
finding remains a puzzle, and consequently, the negative impacts on earnings reported in the survey
must be interpreted with caution. Nonetheless, both sources of data confirm that GATE did not
increase earnings.
Earnings Prior to Random Assignment. Administrative data on the earnings of program and
control group are also available for the four quarters before random assignment. As expected,
because the two groups were chosen randomly, there were no significant differences in earnings

Evaluation of Project GATE 106 May 2008
prior to random assignment. For both the program and control group, the average quarterly
earnings fell during the year before random assignment. For the control group, for example,
earnings four quarters prior to random assignment are about $6,300 compared to $4,000 in the
quarter prior to random assignment (see Table VI.11). This is consistent with people deciding to
apply to Project GATE after a loss of employment. This downward trend in earnings prior to
entering an employment and training program is frequently observed and is known as the
“Ashenfelter dip” (Ashenfelter 1978). While there was an upward trend for both program and
control group members in earnings from wage and salary employment after random assignment,
earnings did not regain their pre-GATE levels within the first year after random assignment.
Table VI.11: Earnings from Wage and Salary Jobs Before Random Assignment Using Administrative Data
Outcome Program
Group Mean Control
Group Mean
Impact on All Eligible
Applicants
Earnings from Wage and Salary Jobs in Quarters Before Random Assignment
Four quarters before $6,546 $6,307 $239 Three quarters before 6,510 6,271 239 Two quarters before 5,787 5,668 119 One quarter before 4,126 3,971 155
Full Sample Size 2,034 2,044 4,078 Source: UI administrative earnings records.
Notes: Reported means and impacts are regression-adjusted to control for differences between the program and control group members in baseline characteristics.
*/**/*** Estimate significantly different from zero at the 0.10/0.05/0.01 level.
6.5.3 Total Earnings
Overall, the total earnings of the sample were relatively low, but GATE participants earned
significantly less in total, because their earnings from self-employment during the 18-month follow-
up period did not compensate for the loss of earnings from wage and salary jobs. According to the
survey data, GATE participants earned an average of $24,337 from wage and salary employment in
the six quarters after random assignment, and the control group members earned $26,135 in total, a
statistically significant difference at the 10 percent level of $1,798 (see Table VI.7). Moreover, as
reported previously, this was not offset by an increase in income from businesses. Even if the

Evaluation of Project GATE 107 May 2008
administrative earnings data are used instead of the survey data, compared with the control group,
the program group had both lower earnings from wage and salary jobs (though only by $196) and
lower earnings from businesses.
For those sample members who were receiving UI when they applied to Project GATE, total
earnings from wage and salary jobs over the follow-up period were $936 lower for the program
group compared with the control group and this was not offset by an increase in business earnings
(see Table VI.8). However, over the entire follow-up period, none of the impacts on earnings for
this subgroup, whether from businesses or wage and salary jobs, were statistically significant.
6.6 Job Satisfaction
The fact that many people chose to own their own businesses rather than work as wage and salary
earners implies that self-employment may have non-pecuniary benefits that cannot be captured by
measures of earnings alone, as hypothesized by Hamilton (2000). However, Table VI.12 reveals that
GATE participants were not much more satisfied in their employment positions than the control
group members. Just under half of both groups reported being very satisfied with their employment
situations and an additional 37 percent were somewhat satisfied. Although GATE participants were
significantly less likely than control group members to be very dissatisfied, few people in either
group were dissatisfied. Among those who were exclusively self-employed, GATE participants were
less likely to be very satisfied (58 compared to 65 percent) but equally likely to be at least somewhat
satisfied (92 versus 93 percent). GATE participants who worked exclusively in wage and salary jobs
also had similar levels of satisfaction to their control group counterparts.
6.7 Characteristics of Wage and Salary Jobs
This section turns to the characteristics of jobs among those who were employed in wage and salary
jobs at some point during the follow-up period. It is important to bear in mind, however, that these
differences are not experimental impacts—only individuals who were ever employed in the follow-
up period are included. Hence, any differences between program and control group may be either

Evaluation of Project GATE 108 May 2008
because Project GATE led to different jobs or because the characteristics of people with jobs differ
between the two groups.
Table VI.12: Satisfaction With Employment at the Wave 2 Follow-up
Outcome Program
Group MeanControl
Group Mean Conditional Difference
For Those Employed in Either Wage and Salary Job or for Themselvesa
Very satisfied 49% 48% 1 Somewhat satisfied 37 36 1 Somewhat dissatisfied 11 10 1 Very dissatisfied 4 6 -3 ***
For Those Working for Themselves Onlyb
Very satisfied 58% 65% -7 * Somewhat satisfied 34 27 8 ** Somewhat dissatisfied 6 6 0 Very dissatisfied 2 3 -1
For Those Employed in Wage and Salary Jobs Onlyc
Very satisfied 41% 38% 3 Somewhat satisfied 40 41 -2 Somewhat dissatisfied 14 12 2 Very dissatisfied 5 8 -4 **
Number of Respondents 1,276 1,176 2,452
Source: Follow-up survey, Wave 2.
Notes: Reported means and differences are regression-adjusted to control for differences between the program and control group members in baseline characteristics. Estimates were obtained using weights to adjust for differences between survey respondents and nonrespondents in baseline characteristics. Means computed using only sample members who worked at a wage and salary job between Waves 1 and 2. As the means were computed over nonrandom samples of the program and control group, the differences should not be interpreted as impacts.
aThe p-value on a chi-square test of distributional differences equals 0.04. bThe p-value on a chi-square test of distributional differences equals 0.11. cThe p-value on a chi-square test of distributional differences equals 0.20.
*/**/*** Estimate significantly different from zero at the 0.10/0.05/0.01 level.

Evaluation of Project GATE 109 May 2008
Consistent with the finding that employment at wage and salary jobs was lower for GATE
participants in the two quarters immediately after random assignment, GATE participants took
longer before starting their first jobs. It was about 14 weeks after random assignment on average
before unemployed GATE participants began their first jobs compared with 12 weeks for the
control group (see Table VI.13). This was especially prominent in Philadelphia and Minneapolis/St.
Paul.
Among those who had worked in at least one job, both groups worked 36 hours per week on
average at their current or most recent jobs as of the Wave 2 survey (see Table VI.13). Both the
program and control group earned about $16 to $17 per hour.
Both program and control group members who worked at wage and salary jobs were equally likely
to have received fringe benefits through their most recent jobs as of the Wave 2 survey. About 50
percent of the full sample received paid sick leave, and this was similar for paid vacation, paid
holidays, health insurance, and retirement benefits (see Table VI.13).
Both groups also worked at jobs across a wide range of industries and occupations, but the
distributions of each were strikingly similar. A chi-square test confirms the similarity of these
distributions. Overall, there is little evidence that Project GATE affected the characteristics of wage
and salary jobs, with the exception that participants’ wages at their most recent jobs were somewhat
lower.

Evaluation of Project GATE 110 May 2008
Table VI.13: Characteristics of Current or Most Recent Wage and Salary Job at the Wave 2 Follow-up
Outcome Program
Group MeanControl
Group Mean Conditional Difference
Weeks after Random Assignment Before First Job Began 14 12 2 **
Average Hours per Week Worked 36 36 0
Average Hourly Wage $16.31 $17.42 -$1.11
Fringe Benefits Received
Paid sick leave 50 49 1
Paid vacation 57 56 1
Paid holidays 57 59 -2
Health insurance or membership in an HMO or PPO plan 59 58 0
Retirement, pension benefits, or a 401K plan 51 51 0
Life insurance 48 49 -1
Number of Respondents 1,162 1,109 2,271
Source: Follow-up survey, Wave 2.
Notes: Reported means and differences are regression-adjusted to control for differences between the program and control group members in baseline characteristics. Estimates were obtained using weights to adjust for differences between survey respondents and nonrespondents in baseline characteristics. Means computed using only sample members who worked at a wage and salary job between Waves 1 and 2. As the means were computed over nonrandom samples of the program and control group, the differences should not be interpreted as impacts.
HMO = health maintenance organization; PPO = preferred provider organization.
*/**/*** Estimate significantly different from zero at the 0.10/0.05/0.01 level.
In this chapter, impacts of Project GATE on total employment and earnings were examined. The
following chapter describes how Project GATE affected self-sufficiency. Topics include receipt of
unemployment insurance based on both administrative data and survey data; receipt of public
assistance; and household income and earnings of spouses.

Evaluation of Project GATE 111 May 2008
Key Findings: Impacts on Self-Sufficiency
Project GATE increased by about one week the amount of time spent on
UI over the follow-up period and increased the amount of UI benefits received by about $300 per program group member.
The impact on the receipt of UI benefits was larger for those who were receiving UI when they applied for Project GATE.
Project GATE had no impact on the receipt of public assistance benefits, household income, or the earnings of the entrepreneur’s spouse.
CHAPTER VII. HOW DID PROJECT GATE AFFECT SELF-
SUFFICIENCY?
By providing an alternative to wage and salary employment, one of Project GATE’s objectives was
to increase employment and hence participants’ self-reliance. However, Project GATE did not
increase employment and may have even decreased earnings at the beginning of the follow-up
period. This chapter explores whether Project GATE led to an increase in participants’ reliance on
UI and public assistance such as food stamps as they began working on their businesses. It also
explores the impacts of Project GATE on household income and the labor market participation of
the entrepreneurs’ spouses. The key findings are presented in the box below.
This chapter begins with a discussion of the impacts of Project GATE on UI receipt, using both
administrative and survey data. It then discusses the impact of Project GATE on the receipt of
public assistance. The chapter ends with a discussion of the impact of Project GATE on total
household income and the labor market participation of the participant’s spouse.

Evaluation of Project GATE 112 May 2008
7.1 Receipt of Unemployment Insurance
While a long-run goal of Project GATE was to increase self-sufficiency and hence decrease UI
receipt, the expected direction of any effect on UI receipt in the short-run is unclear. While GATE
participants focus on starting or growing a business, they may be less likely to work in a wage and
salary job. Chapter VI provides some evidence that Project GATE decreased wage and salary
employment in the first months after random assignment. All else being equal, the decreased wage
and salary earnings would increase the likelihood that Project GATE participants were eligible for
UI. In addition, in the Minnesota sites, the work search requirement was waived for Project GATE
program group members – but not for GATE control group members. Hence Project GATE may
have increased the time that program group members could stay on UI and still work on their
business, relative to control group members.10 On the other hand, UI agencies in all three
demonstration states consider working more than 32 hours per week on a business as making the
person “unavailable for work” and hence ineligible for benefits. Any earnings from self-
employment could also lead to a reduction in UI benefits.
The impact of Project GATE on UI receipt was estimated using two data sources: (1) administrative
records collected from the state UI agencies, and (2) the two follow-up surveys. Both data sources
include information on Trade Adjustment Assistance, Trade Readjustment Allowances, and
Extended UI Benefits, as well as regular UI benefits.
The main advantages of the administrative data are that they are accurate and available for all sample
members, not just the survey respondents. On the other hand, they provide information only on
claims and total payments over the claim period and so it is not always possible to identify whether
payments were made before or after random assignment. Due to time lags in data availability, the
administrative data are also available for only four quarters after random assignment.
10In Pennsylvania, there was no work search requirement for either program or control group members and in Maine the work search requirement was waived for both program and control group members who participated in the Self-Employment Assistance (SEA) program there.

Evaluation of Project GATE 113 May 2008
The advantages of the survey data are that they are available for six quarters after random
assignment and provide data on the receipt of benefits over the follow-up period. However, the
survey data are subject to recall error and are only available for survey respondents.
7.1.1 Impacts Estimated Using the Administrative Data
According to the administrative data, Project GATE had at most a very modest impact on the
probability of establishing a new UI claim (see Table VII.1). The program group members were
slightly less likely to establish a claim in the first quarter after random assignment, but the impact
was only about 1 percentage point and statistically significant at the 10 percent level. No statistically
significant impact on the probability of establishing a claim was found in any subsequent quarter or
in the full year after random assignment.
Table VII.1: Impacts on Employment Receipt of Unemployment Insurance Benefits Using Administrative Data
Outcome Program Group Mean
Control Group Mean
Impact on All Eligible Applicants
Established a New Unemployment Insurance (UI) Claim
Quarter 1 3% 3% -1 * Quarter 2 2 1 1 Quarter 3 3 3 0 Quarter 4 4 3 1 Any quarter 1 to 4 11 11 0
Number of Weeks Paid over 24 Months
New claim established before random assignment 10.5 9.9 0.6 ** New claim established after random assignment 1.9 1.7 0.2 New claim established either before or after random assignment 12.4 11.6 0.8 **
Total UI Payments
New claim established before random assignment $3,800 $3,521 $280 *** New claim established after random assignment 584 529 55 New claim established either before or after random assignment 4,385 4,050 335 ***
Sample Size 2,034 2,044 4,078 Source: State Unemployment Insurance records. Notes: Reported means and impacts are regression-adjusted to control for differences between the program and
control group members in baseline characteristics. */**/*** Estimate significantly different from zero at the 0.10/0.05/0.01 level.

Evaluation of Project GATE 114 May 2008
As the UI data provided only total benefits paid during the entire claim, all payments made on a
claim were considered, whether the payments were made before or after random assignment. As the
program and control group were chosen randomly, few differences between the two groups in UI
receipt should exist prior to random assignment. Measures of UI receipt prior to random
assignment collected from the GATE application form are also included in the regression models to
adjust for the differences that do exist. Hence, the difference between UI payments made to
program and control group members should reflect the impact of the program after random
assignment.
The number of weeks of UI receipt and total UI payments were examined for three different time
periods: (1) the 12 months prior to random assignment, (2) the 12 months after random
assignment, and (3) the 24 months that include the 12 months before and 12 months after random
assignment.
Project GATE had small positive impacts on the number of weeks of UI paid and the total UI
payments made (see Table VII.1). For any claim established within the 12 months before or 12
months after random assignment, Project GATE increased the number of weeks paid by about
three-quarters of a week and increased total payments by $335. Most of this effect came from
claims established prior to random assignment. Hence, the impact was not from participants
establishing new claims, but from them claiming more weeks of payments during the claim year.
As expected, the impact on the amount of UI benefits received was larger—$605—for the subgroup
of participants who were already receiving UI at the time they applied to Project GATE (see Table
VII.2). The impact was even larger—$1,045—for those who submitted a UI claim in the quarter
prior to random assignment. The impact on UI receipt is especially large for the UI recipients in the
Minnesota sites, where the UI work search requirements were waived for Project GATE
participants.
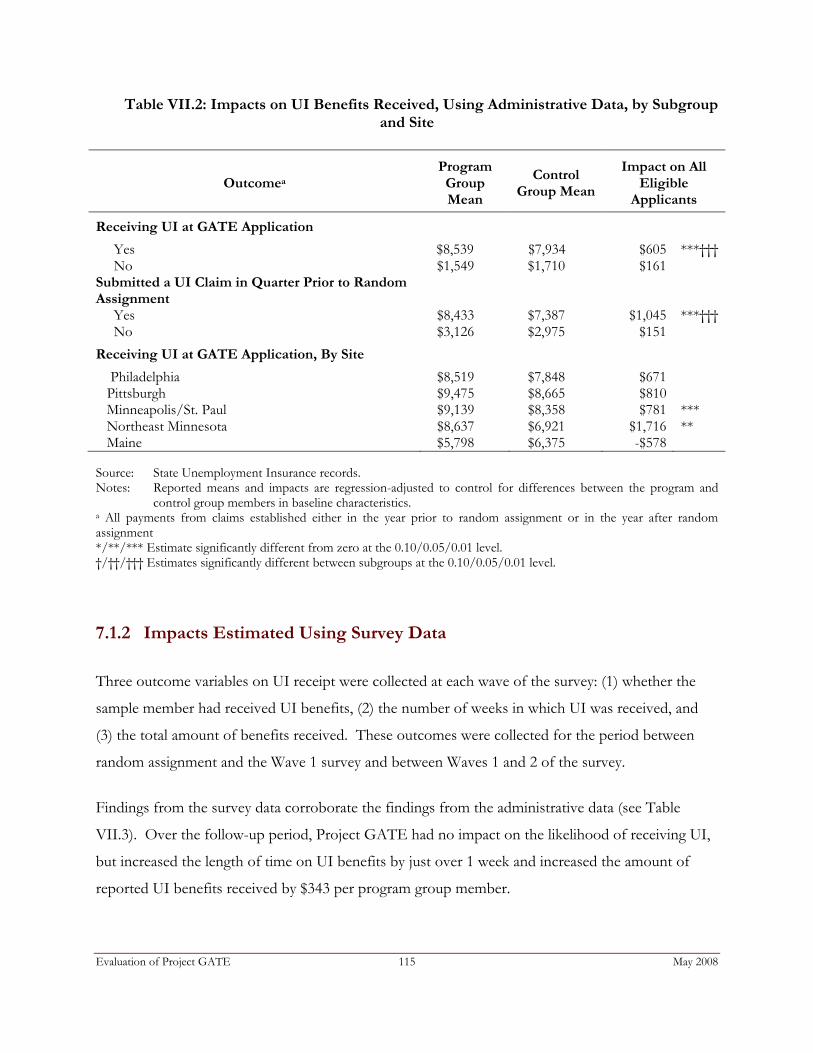
Evaluation of Project GATE 115 May 2008
Table VII.2: Impacts on UI Benefits Received, Using Administrative Data, by Subgroup and Site
Outcomea Program Group Mean
Control Group Mean
Impact on All Eligible
Applicants
Receiving UI at GATE Application
Yes $8,539 $7,934 $605 ***††† No $1,549 $1,710 $161
Submitted a UI Claim in Quarter Prior to Random Assignment
Yes $8,433 $7,387 $1,045 ***††† No $3,126 $2,975 $151
Receiving UI at GATE Application, By Site
Philadelphia $8,519 $7,848 $671 Pittsburgh $9,475 $8,665 $810 Minneapolis/St. Paul $9,139 $8,358 $781 *** Northeast Minnesota $8,637 $6,921 $1,716 ** Maine $5,798 $6,375 -$578 Source: State Unemployment Insurance records. Notes: Reported means and impacts are regression-adjusted to control for differences between the program and
control group members in baseline characteristics. a All payments from claims established either in the year prior to random assignment or in the year after random assignment */**/*** Estimate significantly different from zero at the 0.10/0.05/0.01 level. †/††/††† Estimates significantly different between subgroups at the 0.10/0.05/0.01 level.
7.1.2 Impacts Estimated Using Survey Data
Three outcome variables on UI receipt were collected at each wave of the survey: (1) whether the
sample member had received UI benefits, (2) the number of weeks in which UI was received, and
(3) the total amount of benefits received. These outcomes were collected for the period between
random assignment and the Wave 1 survey and between Waves 1 and 2 of the survey.
Findings from the survey data corroborate the findings from the administrative data (see Table
VII.3). Over the follow-up period, Project GATE had no impact on the likelihood of receiving UI,
but increased the length of time on UI benefits by just over 1 week and increased the amount of
reported UI benefits received by $343 per program group member.

Evaluation of Project GATE 116 May 2008
Table VII.3: Impacts on Receipt of Unemployment Insurance Benefits Using Survey Data
Outcome Program
Group MeanControl
Group Mean Impact on All
Eligible Applicants
Received Unemployment Insurance
Between random assignment and Wave 1 survey 38% 38% 0 Between Wave 1 survey and Wave 2 survey 12 11 1 Between random assignment and Wave 2 survey 44 43 1
Weeks of UI received
Between random assignment and Wave 1 survey 7 6 0 Between Wave 1 survey and Wave 2 survey 2 1 1 ** Between random assignment and Wave 2 survey 9 7 1 **
Amount of UI received
Between random assignment and Wave 1 survey $2,114 $1,926 $188 * Between Wave 1 survey and Wave 2 survey 525 388 137 * Between random assignment and Wave 2 survey 2,622 2,279 343 **
Number of Respondents 1,516 1,430 2,946
Source: Follow-up surveys, Waves 1 and 2.
Notes: Reported means and impacts are regression-adjusted to control for differences between the program and control group members in baseline characteristics. Estimates were obtained using weights to adjust for differences between survey respondents and nonrespondents in baseline characteristics.
*/**/*** Estimate significantly different from zero at the 0.10/0.05/0.01 level.
7.2 Receipt of Public Assistance
A key measure of self-sufficiency is the extent to which participants need to rely on public
assistance. The follow-up surveys asked about the receipt of food stamps, cash welfare (such as
Temporary Assistance for Needy Families (TANF), Social Security benefits, and veterans’ benefits).
The respondents were asked whether they had received the benefits and, if so, for how many
months over the follow-up period, and how much they received on average per month.
Project GATE had no statistically significant impact on the likelihood of the participant receiving
any benefit or on the amount of benefits received (see Table VII.4). This was true for both the full
sample and the subgroup of sample members who were receiving UI when they applied to Project
GATE. The majority of members of both the program and control groups received no benefits.

Evaluation of Project GATE 117 May 2008
Food stamps were the most common type of assistance received, but over the entire follow-up
period, only 17 percent of the sample members received them.
Table VII.4: Impacts on Receipt of Public Assistance
Outcome Program
Group MeanControl
Group Mean
Impact on All Eligible
Applicants
Received Benefit
Food stamp benefits 17% 17% 0 Temporary Assistance for Needy Families (TANF) or
cash welfare 9 10 -1
Social Security Retirement (SSR), Social Security Disability (SSD), or Social Security Survivors (SSS) benefits
14 15 -1
Veterans’ benefits 3 3 0 Months Received Benefits
Food stamp benefits 1.6 1.7 -0.2 TANF or cash welfare 0.7 0.9 -0.2 SSR, SSD, or SSS benefits 1.9 1.8 0.0 Veterans’ benefits 0.4 0.3 0.0
Amount of Benefits Received
Food stamp benefits $331 $374 -$43 TANF or cash welfare 268 347 -78 SSR, SSD, or SSS benefits 1,788 1,587 201 Veterans’ benefits 171 155 16
Number of Respondents 1,516 1,430 2,946
Source: Follow-up surveys, Waves 1 and 2.
Notes: Reported means and impacts are regression-adjusted to control for differences between the program and control group members in baseline characteristics. Estimates were obtained using weights to adjust for differences between survey respondents and nonrespondents in baseline characteristics.
*/**/*** Estimate significantly different from zero at the 0.10/0.05/0.01 level.
7.3 Household Income and Earnings of Spouses
Household income is another important key measure of the participant’s well-being. While the
previous chapter discussed the impacts of Project GATE on earnings from self-employment or
wage and salary jobs, this section describes the impact of Project GATE on total household income.
Each survey asked respondents to report on their household income in the previous 12 months.

Evaluation of Project GATE 118 May 2008
Household income includes income from businesses, wage and salary employment, employment of
other members of the household, as well as UI and public assistance.
Project GATE had a small, but not significant, negative impact on average household income. In
the year prior to the Wave 1 survey, average annual income was $41,800 for the program group
members and $43,000 for the control group members (see Table VII.5). By Wave 2 of the survey,
average household income had risen to $46,200 for the program group and $45,900 for the control
group. This negative impact on household income of about $1,200 at the first wave is smaller than
would be expected from the negative impact on wage and salary earnings of about $2,700 in the first
two quarters after random assignment. A small amount of this discrepancy can be explained by the
increase in the amount of UI received. It is possible that the rest of the discrepancy reflects
measurement error. Household income is frequently underreported, especially when the respondent
is asked about aggregate annual income (Moore et al. 2005).
Table VII.5: Impacts on Household Income and Spousal Earnings
Outcome Program
Group MeanControl
Group Mean
Impact on All Eligible
Applicants
Household Income During 12 Months Before Wave 1 Follow-up
$41,782
$43,022
-$1,240 Household Income During 12 Months Before Wave 2 Follow-up $46,162 $45,924 $238
Married at Wave 2 Follow-up 45% 45% -1 Spouse Works at Wave 2 Follow-up 34 34 0 Weekly Earnings of Spouse at Wave 2 Follow-up $231 $215 $16
Number of Respondents 1,516 1,430 2,946
Source: Follow-up surveys, Waves 1 and 2.
Notes: Reported means and impacts are regression-adjusted to control for differences between the program and control group members in baseline characteristics. Estimates were obtained using weights to adjust for differences between survey respondents and nonrespondents in baseline characteristics.
*/**/*** Estimate significantly different from zero at the 0.10/0.05/0.01 level.

Evaluation of Project GATE 119 May 2008
The fact that GATE participants were more likely to have worked on starting a business than
control group members during the follow-up period could have affected their husbands and wives in
one of two opposing ways. A reduction in the participant’s earnings could have encouraged the
spouse to work more. On the other hand, the spouse may have reduced his or her participation in
wage and salary employment to help the GATE participant start his or her business. Reports from
the Wave 2 survey suggest that Project GATE had no lasting effect on whether the GATE
participant was married, whether his or her spouse worked, and the amount of his or her spouse’s
earnings from wage and salary employment. This chapter presented findings on the impact of Project GATE on receipt of UI, receipt of public
assistance, and spouse and household income. In the next chapter, impacts of Project GATE on the
unemployed are analyzed.

Evaluation of Project GATE 120 May 2008
CHAPTER VIII. IMPACTS OF PROJECT GATE ON THE
UNEMPLOYED
Previous chapters presented the impact of Project GATE on business ownership (Chapter V),
earnings (Chapter VI), and self-sufficiency (Chapter VII). Each of these chapters focused on
measuring program impacts by comparing outcomes of all program group members with the
outcomes of all control group members. This chapter focuses on measuring program impacts for an
important subgroup of interest – the unemployed.
The unemployed are of particular interest because self-employment has been shown to be a
promising reemployment strategy for some unemployed individuals. For example, the UI Self-
Employment Demonstration study found that self-employment assistance programs are viable
policy tools to promote the rapid reemployment of unemployed workers (Benus, et al. 1995).
Currently, a number of states (Delaware, Maine, Maryland, New Jersey, New York, Oregon and
Pennsylvania) operate SEA programs, providing self-employment assistance for UI recipients.
The remainder of this chapter is organized as follows. It begins by describing two important
subgroups: (1) individuals not employed at the time of application to GATE, and (2) UI claimants.
The description of these groups is followed by a discussion of why these groups are important for
the analysis of Project GATE impacts. Next, impact estimates for the full sample are summarized
followed by impact estimates for the two unemployed subgroups. The chapter concludes with a
discussion of the implications of the findings. The key findings are presented in the box below.

Evaluation of Project GATE 121 May 2008
Key Findings: Impacts on the Unemployed
Project GATE increased business ownership of those who were not employed by more than it increased business ownership of those who were employed prior to random assignment.
Among recent UI claimants in Minnesota, Project GATE increased the probability of owning a business (12 to 15 percentage points).
During the second half of the observation period, recent UI claimants in Minnesota experienced strong and statistically significant employment gains (7 to 9 percentage points).
Increased likelihood of business ownership and increased employment gains, however, did not result in an increase in earnings.
8.1 Analysis Samples
DOL programs serve the entire labor force, both the employed and unemployed. DOL programs
that are designed to serve unemployed workers generally help these workers gain new skills, find
productive employment, and provide support during brief periods of unemployment. Thus, the
unemployed represent a key constituency group for DOL.
One DOL program which focuses on self-employment, the SEA program, enables unemployed
workers to create their own jobs by starting their own small businesses. SEA is a voluntary program
for States and, currently, only Delaware, Maine, Maryland, New Jersey, New York, Oregon and
Pennsylvania operate SEA programs.
While the GATE demonstration was designed to serve anyone interested in self-employment (i.e.,
employed, unemployed, and out-of-the-labor-force individuals), the following groups are of special
interest: (1) individuals not employed at the time of application, and (2) UI claimants. These two
groups are described below.

Evaluation of Project GATE 122 May 2008
8.1.1 Not Employed
The “not employed” group includes both the unemployed and those who are out of the labor force.
Since self-employment is a potential path into the labor force for those who are out of the labor
force (e.g., homemakers) and since self-employment is a potential path into employment for the
unemployed, it is important for DOL to determine whether Project GATE helped individuals who
were not employed at the time of their application to GATE.
Another reason for analyzing the not employed group is to determine if the observed GATE
impacts for the not employed group differ from the full sample impacts. That is, one may expect
differential impacts for this group vis-à-vis the full sample since the opportunity cost of working full
time towards self-employment is lower for this group than for employed individuals. Previous
research has found that unemployed individuals are much more likely to attempt self-employment
than those already working in wage and salary jobs (Evans and Leighton 1989; Meager 1992).
Still another reason for analyzing the not employed group is that GATE appears to have been highly
attractive to this group. That is, even though Project GATE targeted anyone interested in self-
employment – working or not working – Project GATE attracted mostly individuals without jobs.
Over half (56 percent) of GATE applicants did not have a job at the time of application.
8.1.2 UI Claimants
Among the group that is not employed, there is an important subgroup – UI recipients. UI
recipients who participate in self-employment training programs represent an important group since
this group is currently served by DOL’s SEA program. Below, features of the SEA program are
described.
SEA program
Under the SEA program, states can pay a self-employment allowance instead of regular UI benefits,
to help unemployed workers while they are establishing businesses and becoming self-employed.
SEA participants receive weekly allowances while they are getting their businesses off the ground.
These allowances are the same weekly amounts as the worker's regular UI benefits.

Evaluation of Project GATE 123 May 2008
In addition to the financial support provided by the allowances, the SEA program incorporates
another interesting feature: a work search waiver. That is, SEA participants may work full-time on
starting their business instead of looking for wage and salary jobs (as is typically required when
collecting UI benefits). In effect, participants in SEA are exempt from work search while
participating in the SEA program.
The design of the GATE demonstration in Minnesota resembles the design of the SEA program.
That is, like the SEA program, the Minnesota GATE demonstration incorporates self-employment
training and a job search waiver (while collecting UI benefits). It should be noted, however, that the
design of Project GATE in Minnesota differed from the SEA program in one important respect:
cost neutrality to the trust fund. That is, the SEA program was required to not increase the total
amount of UI benefits paid out to recipients, while the design of Project GATE did not incorporate
this feature. Thus, while an analysis of the impacts of Project GATE on the Minnesota UI may shed
some light on the effectiveness of DOL’s SEA program, it does not represent a rigorous evaluation
of the SEA program.
Project GATE and UI Claimants
The major program features of Project GATE in Minnesota, Pennsylvania, and Maine are presented
in Table VIII.1. As indicated in this table, in Minnesota, GATE UI recipients received a work
search waiver, self-employment training, and business counseling; control group members did not
receive these services. As a result, in Minnesota it is possible to measure the impact of self-
employment services combined with the work search waiver by comparing program group members
who are also UI claimants with similar control group members.
In Pennsylvania, there was no work search requirement for either program or control group
members. As a result, comparing program group members who are also UI claimants with similar
control group members, only measures the effect of self-employment training and business
counseling (since both program and control groups have similar work search requirements). Thus,
the GATE demonstration in Pennsylvania cannot shed much light on the effectiveness of a program
that includes both training and a work search waiver.
In Maine, some GATE program group members received a work search waiver while others did not;
the same was true for control group members (some did and others did not receive a work search

Evaluation of Project GATE 124 May 2008
waiver). In Maine, only individuals who participated in the Maine SEA program received a work
search waiver - whether they were in the program or the control group. As a result, the GATE
demonstration in Maine also cannot shed much light on the effectiveness of a program that
combines self-employment training and business counseling with a work search waiver. In
summary, only the Minnesota design can shed light on the effectiveness of the SEA program.
Table VIII.1: Program Features of Project GATE for UI Recipients
State Program Group Members Control Group Members
Minnesota
Work search waived for GATE participants No work search waiver
Self-employment training No self-employment training
Pennsylvania
No work search requirements No work search requirements
Self-employment training No self-employment training
Maine
Work search waived only if participate in the Maine SEA program
Work search waived only if participate in the Maine SEA program
Self-employment training No self-employment training
Minnesota UI Claimant Analysis Sample
An analysis of GATE program impacts for UI claimants in Minnesota is interesting for a number of
reasons. First, an analysis of program impacts for this group can shed light on SEA program
impacts. Another important reason for analyzing GATE program impacts for UI claimants in
Minnesota is to assess whether the GATE impact results corroborate the findings of an earlier self-
employment training experimental design demonstration. That is, the GATE impact estimates for
the full sample (presented in earlier chapters) are substantially smaller than the impacts found in an
earlier study - the UI Self-Employment Demonstration study. To reconcile the difference in impact
estimates from the two studies, it is important to measure the impacts of GATE on a similar sample
as was used in the previous study. Since the previous study analyzed program impacts on

Evaluation of Project GATE 125 May 2008
unemployed workers, for comparability, it is important to also analyze GATE program impacts for
the unemployed.
The UI Self-Employment Demonstration targeted only recent UI claimants. Therefore, to make the
two analyses even more comparable, it is necessary to identify only the recent UI claimants in
Minnesota. Thus, the final analysis sample includes only GATE applicants who filed a UI claim
within one quarter (13 weeks) prior to random assignment.
8.2 Analysis of GATE Impacts on the Unemployed
This section presents the impacts of Project GATE on the unemployed subgroups and discusses
how these impacts differ from the impacts for the full sample. First, a brief summary describes the
impacts of GATE on key outcomes for the full sample. Next, these findings are compared with the
findings for the unemployed groups.
In the following discussion, business earnings include only wages and salaries that business owners
pay themselves. Business earnings thus exclude such non-salary items as bonuses and profit. As a
result of these exclusions, business earnings may understate the true income of the self-employed.
8.2.1 Recap of Impacts on the Full Sample
This section briefly reviews the impacts estimated in earlier chapters for the full sample. Specifically,
findings on the following key outcomes are summarized: business ownership, wage and salary
employment, overall employment, earnings, and receipt of UI benefits and other public assistance.
Business Ownership – As discussed in Chapter V, Project GATE had a small and
declining impact on the likelihood of self-employment over the follow-up period.
Wage and Salary Employment – The positive impact on the probability of being self-
employed was mirrored by a corresponding negative impact on being employed in a wage
and salary job.
Overall Employment – GATE participants were about as likely to be employed (whether
for themselves or someone else) as those who did not participate in Project GATE.

Evaluation of Project GATE 126 May 2008
Earnings – Project GATE decreased earnings from wage and salary jobs by about $1,800
over the follow-up period. Earnings from self-owned businesses did not make up for this
loss. Hence, Project GATE had a negative overall impact on total earnings.
Unemployment Insurance Benefits and Other Public Assistance – Project GATE had
small positive impacts on the number of UI benefit weeks and the total amount of UI
payments. Specifically, GATE increased the duration of UI benefits by about one week. It
also increased the amount of UI benefits collected by about $300.
Project GATE did not have an impact on other kinds of public assistance benefits, such as Food
Stamps, TANF, Social Security Retirement, Disability, and Survivors benefits, and Veterans’
benefits.
8.2.2 Impacts on Unemployed Subgroups
The following subsections present regression-adjusted impacts of Project GATE on a number of
key outcomes. The impact estimates are presented in graphical form for the following three groups:
Full program and control group;11
Non-working group; and
Recent UI Claimants in Minnesota. 12
11 The impact estimates for the full program and control group were presented earlier. These results are repeated here to simplify the comparison of program impacts across the three groups.
12 Recent UI claimants are defined as applicants whose first UI claim week was during the 90 days prior to random assignment.

Evaluation of Project GATE 127 May 2008
Employment
Business Ownership – For the full sample, the impact of Project GATE on business ownership is
depicted in Figure VIII.1 by a dashed line. As indicated in the figure, program impact peaked in the
third quarter (Q3) when GATE program group members were 6.1 percentage points more likely to
be self-employed than control group members. The impact of Project GATE on business
ownership among those who were not employed at the time of random assignment is higher than
the impact for the full sample in every quarter (as indicated by the solid line). In the first quarter
after random assignment (Q1), for example, program group members were 6.2 percentage points
more likely to be self-employed than members of the control group. This impact peaked during the
third quarter after random assignment at 8.9 percentage points; after Q3, the impact declined to 3.5
percentage points in the sixth quarter (not significant). This pattern of peaking and then declining
closely resembles the trends of the full sample.
Figure VIII.1: Impacts on Business Ownership after Random Assignment
Among the three groups from Project GATE, the recent UI claimants in Minnesota exhibited the
highest program impact (dotted line). Moreover, unlike the two other groups where impacts

Evaluation of Project GATE 128 May 2008
declined in later quarters, the impact on business ownership among recent UI claimants in
Minnesota remained strong and statistically significant. Specifically, this group experienced strong
and persistent impacts throughout the observation period, starting at about 12 percentage points and
increasing to and stabilizing at over 15 percentage points.
It is interesting to note that the magnitude of the effect of Project GATE for this group is
comparable to the impacts found earlier in the UI Self-Employment Demonstration. Thus, the
findings from this evaluation help to corroborate the findings from the evaluation of the UI Self-
Employment Demonstration. In addition, the finding that recent UI claimants in Minnesota
experienced significant impacts on business ownership provides additional indication that SEA type
programs may be effective in assisting people move out of unemployment and into self-
employment.
Wage and Salary Employment – As indicated in Figure VIII.2, GATE reduced the likelihood of
wage and salary employment for the full sample and for the non-working group throughout the
follow-up period. It is interesting to note that for recent UI claimants in Minnesota, the reduction in
early quarters (Q1 - Q3) was even greater. In later quarters (Q4 – Q6), however, Project GATE had
no significant impact on the likelihood of wage and salary employment for this group.
Total Employment – Combining wage and salary employment together with self-employment
yields a measure of total employment. As indicated in Figure VIII.3, the impacts on overall
employment for the full sample and for GATE participants who were not working at random
assignment were similar. Both groups did not experience any overall employment impacts. In
effect, the gains experienced in self-employment (see Figure VIII.1) were offset by declines in wage
and salary employment (see Figure VIII.2).
In strong contrast, however, recent UI claimants in Minnesota registered strong overall employment
gains. Throughout the second half of the follow up period (Q4 – Q6), this group experienced
strong and statistically significant employment gains (7.1 to 8.7 percentage points). Two factors
contributed to the overall employment gains for this group: (1) the impact on the likelihood of self-
employment increased over the observation period, and (2) the negative impact on the likelihood
of wage and salary employment decreased over the observation period. These two forces combined
to yield improved overall employment impacts for recent UI claimants in Minnesota.

Evaluation of Project GATE 129 May 2008
Figure VIII.2: Impacts on Working for Someone Else after Random Assignment
Earnings
Earnings from Businesses – Project GATE did not have any impact on business earnings.
As indicated in Figure VIII.4, all three groups experienced small and insignificant business earnings
impacts. Thus, even though the three groups experienced significant business ownership impacts
(see Figure VIII.1), this did not translate into significant impacts on business earnings. As described
in Chapter V, many of these businesses were in their infancy and therefore unable to generate
significant business earnings.

Evaluation of Project GATE 130 May 2008
Figure VIII.3: Impacts on Working for Self or Someone Else after Random Assignment
Figure VIII.4: Impacts on Earnings from Businesses after Random Assignment
Earnings from Wage and Salary Jobs – As indicated in Figure VIII.5, among all three
groups, Project GATE had a negative and statistically significant impact on earnings from
wage and salary jobs during the first few quarters after random assignment. In the first three
quarters after random assignment, this impact was substantially larger in magnitude for

Evaluation of Project GATE 131 May 2008
recent UI claimants in Minnesota than for the other two groups. In all three groups, the
impact of GATE on wage and salary earnings diminished and was not statistically significant
in later quarters.
Figure VIII.5: Impacts on Earnings from Wage-and-Salary Jobs after Random Assignment
Total Earnings – Combining earnings from wage and salary jobs and earnings from
businesses yields a measure of total earnings. The results presented in Figure VIII.6 indicate
that all three groups experienced a negative impact from Project GATE in total earnings.
The negative impact was similar for the full sample and for the not-working group. In
contrast, the negative impact in total earnings was substantially larger for the recent UI
claimants in Minnesota. This group experienced a large and statistically significant negative
impact during the early quarters (Q1 – Q3). In later quarters (Q4 – Q6), however, the
negative impact in total earnings was substantially smaller and statistically insignificant. The
cumulative negative impact in total earnings by the end of the follow-up period was less than
$2,000 for the full sample and for the not-employed group, and it was about $4,600 for the
recent UI claimants in Minnesota.

Evaluation of Project GATE 132 May 2008
The results on total earnings suggest that even though Project GATE had significant
positive impacts on the likelihood of business ownership, this impact did not lead to
sufficiently increased earnings from businesses to offset the strong negative impacts on
earnings from wage and salary jobs.
Figure VIII.6: Impacts on Total Earnings in Quarter after Random Assignment
Unemployment Insurance Benefits
Project GATE increased the duration and the amount of UI benefits collection for all three groups
(see Table VIII.2). The full sample and the not-working group experienced impacts of similar
magnitudes. Both groups collected about one more week of UI benefits (0.8 week) and the full
sample received $335 more UI benefits than control group members and the not-employed group
received $405 more in UI benefits. In contrast, however, the recent UI claimants in Minnesota
experienced more than three times these impacts. Specifically, this group collected 3.1 weeks and
was paid $1,239 more than the control group in UI benefits.

Evaluation of Project GATE 133 May 2008
Table VIII.2: Impacts on Receipt of Unemployment Insurance Benefits
Full Sample Not
Employed at Application
Recent UI claimants at Application
(All Sites) (All Sites) (Minnesota)
Weeks Paid over 24 Months‡ 0.8** 0.8* 3.1***
Total UI Payments‡ 335*** 405** 1,239***
Number of Observations 4,078 2,232 485 Program 2,034 1,112 284 Control 2,044 1,120 201
Source: Follow-up surveys, Waves 1 and 2. ‡ New claim established either before or after random assignment. */**/*** Estimate significantly different from zero at the 0.10/0.05/0.01 level.
A potential key factor causing this substantially larger impact on UI benefits of UI claimants in
Minnesota is the work search waiver. As previously explained, GATE participants in Minnesota did
not have to search for work while they were working on starting a business. In contrast, control
group members were required to search for work while collecting UI benefits.
Further analysis of the data on UI claims and benefits (not shown) reveals that the impacts reported
in Table VIII.2 are derived exclusively from UI claims that were already established before random
assignment. Project GATE did not have an impact on the number of new UI claims established in
any quarter after random assignment. In other words, Project GATE caused the existing UI claims
to lengthen rather than causing new claims to be initiated.
Other Public Assistance
With a minor exception, Project GATE did not have any impacts on the collection of other public
assistance by the unemployed subgroups, just as it did not have a significant effect on the full
sample. As indicated by Table VIII.3, the exception is the small impact on collection of TANF
benefits by the not-employed subgroup. Through the follow-up period, the program group
members of the not-employed subgroup were 3 percentage points less likely to collect TANF
benefits than the control group. This group also collected 0.4 months less and approximately $170
in TANF benefits than control group members.

Evaluation of Project GATE 134 May 2008
Table VIII.3: Impacts on Receipt of Public Assistance
Public Assistance Benefit Full Sample Not Employed at Application
Recent UI claimants at Application
(All Sites) (All Sites) (Minnesota)
Received: Food Stamps 0 % -1 % -2 % Temporary Assistance for Needy Families (TANF) or cash welfare -1 -3** 1
Social Security Retirement (SSR), Social Security Disability (SSD), or Social Security Survivors (SSS)
-1 0 -1
Veterans’ benefits 0 0 -1 Months Received Benefits:
Food Stamp benefits -0.2 -0.3 0.0 TANF or cash welfare -0.2 -0.4** 0.0 SSR, SSD, or SSS benefits 0.0 0.2 0.2 Veterans’ benefits 0.0 0.0 -0.2
Amounts of Benefits Received: Food stamp benefits -43 -67 51 TANF or cash welfare -78 -168** -9 SSR, SSD, or SSS benefits 201 321 254 Veterans’ benefits 16 -3 26
Number of Observations 2,946 1,598 401
Program 1,516 827 246 Control 1,430 771 155
Source: Follow-up surveys, Waves 1 and 2. */**/*** Estimate significantly different from zero at the 0.10/0.05/0.01 level.
8.3 Implications
Project GATE was designed to test the effectiveness of self-employment services. Almost anyone,
whether employed or unemployed, who was interested in starting or expanding a business was
eligible to participate in Project GATE. More than half of the applicants to Project GATE were not
working when they applied to Project GATE. Thus, the unemployed represent a very important
subgroup of the GATE sample.
The impact results presented in this chapter indicate that Project GATE was more effective for the
unemployed than for the broader population of GATE participants (on a number of outcomes);

Evaluation of Project GATE 135 May 2008
GATE impacts were even greater for recent UI claimants in Minnesota. These findings are
interesting for a number of reasons. First, the results of this chapter suggest that programs such as
Project GATE may be most effective for recent UI claimants, especially if the program is
accompanied by a work search waiver. Second, the results reported in this chapter for the group of
recent UI claimants in Minnesota corroborate the results of the evaluation of the UI Self-
Employment Demonstration, a similar program. Finally, the results reported for recent UI
claimants in Minnesota provide insights on the effectiveness of cash supports and no job search
requirements coupled with training and business counseling.
While the results of this chapter indicate that the increase in the likelihood of starting a business did
not result in an increase in earnings, it is premature to expect such an increase in light of the short
observation period (18 months). That is, many of the businesses have only recently begun to
operate and, therefore, are not likely to generate significant earnings for the business owners. To
investigate this issue, it is necessary to have a longer follow-up period. With a longer follow-up
period, it is possible to assess whether these new businesses eventually result in increased earnings
for GATE participants.

Evaluation of Project GATE Page 136 May 2008
CHAPTER IX. LESSONS LEARNED
The evaluation of Project GATE was designed to address whether Project GATE works, whether it
could be replicated on a broader scale and whether it is cost-effective. The evidence presented in
this report suggests that Project GATE works and that it could be replicated on a wider scale. One
important questions remains: whether it is cost-effective. Given the short follow-up period in this
study (18 months) it is premature to attempt to answer this question.
To answer the cost-effectiveness question definitively, a longer follow-up period is necessary.
Previous studies of entrepreneurship (e.g., Gartner et al. 2004) have found that the median amount
of time between the first organizing activity performed to start a business and the first receipt of
money, income, or fees from the sale of goods and services was 25 months and the median amount
of time between the first organizing activity and the time when monthly revenues exceeded monthly
expenses was 38 months. These findings suggest that the present study should be viewed as
preliminary. To measure the permanent impacts of Project GATE, a longer observation period is
necessary.
The remainder of this chapter discusses ten general lessons learned from the evaluation of Project
GATE.
1. Self-employment service programs could be offered at One-Stop Career Centers. Project
GATE could be replicated on a wider scale. During the demonstration, Project GATE was
implemented successfully across a wide variety of sites. While One-Stop Career Centers are not
traditionally known as places to go for self-employment services, Project GATE was able, with some
marketing, to draw entrepreneurs and prospective entrepreneurs into the centers. As long as local
training and business counseling providers with a reputation for providing good quality services are
willing to participate in the program, Project GATE, or a similar program, could be offered as an
additional service at One-Stop Career Centers.

Evaluation of Project GATE Page 137 May 2008
2. Project GATE increased receipt of self-employment services by an average of 13 hours
per participant. The evaluation was designed to examine the impact of adding Project GATE to
the array of self-employment programs already available in the communities. Hence, control group
members were not prevented from receiving other services in the community. In fact, about 70
percent of control group members received some self-employment services during the follow-up
period, compared with 90 percent of the program group. Project GATE led to an average increase
of 13 more hours of services, which consisted of 8 more hours of classroom training, 2 more hours
of business counseling, and 3 more hours of other self-employment services.
3. The Project GATE service model appears to have several advantages over the existing
self-employment services available within participating communities. As well as receiving
more hours of self-employment services, Project GATE participants reported higher levels of
satisfaction with the services received than did control group members. Offering a one-on-one
assessment with a trained business counselor and a choice of quality local service providers appears
to have added value to the existing service network within these local communities.
4. GATE participants started businesses at a higher rate than control group members.
Over the 18-month follow-up period, participation in Project GATE led to an increase in business
ownership. While the increase in business ownership was statistically significant, the magnitude of
the impact was relatively modest—6 percentage points. It is important to note, however, that an
analysis of the impact of Project GATE on the unemployed found more substantial program
impacts for this subgroup.
5. Increased business ownership did not lead to increased self-employment earnings in
the short run. Reported earnings from businesses for both program and control group members
were small. Over the 18-month observation period, earnings from businesses were on average less
than $6,000 for members of both the program and control groups. Hence, even though program
group members were more likely to own a business, Project GATE had no statistically significant
impact on business earnings. However, because a portion of all businesses started do grow into
successful businesses after a few years, a longer follow-up period would allow an estimate of the
impact of Project GATE on long-term self-employment earnings.

Evaluation of Project GATE Page 138 May 2008
6. Increased earnings from self-employment did not yet offset the cost of Project GATE,
in the short run. DOL spent about $1,300 per program group member to provide Project GATE
services. In addition, while working on their businesses, GATE participants worked less in wage
and salary jobs than control group members, especially in the first few quarters after applying to the
program. Depending on whether the administrative or survey data are used, earnings from wage
and salary jobs fell by between about $300 and $1,800 per program group member throughout the
follow-up period. During the same period, the additional earnings from businesses begun by GATE
participants did not produce enough revenue to offset this loss in earnings.
7. Project GATE had larger impacts on business ownership among UI recipients. Over
the entire follow-up period, the impact of Project GATE on business ownership among UI
recipients was 9 percentage points (statistically significant), compared with no impact on those who
did not receive UI. Project GATE may have had a larger impact on those who were receiving UI
benefits when they applied because they had fewer alternate opportunities in the regular labor
market. Moreover, not having a wage and salary job provided them with more time to work on their
businesses, while the UI benefits provided a regular income.
8. Project GATE had much larger impacts on business ownership among recent UI
recipients in Minnesota, where job search requirements were waived for GATE program
group members. For the recent UI recipients in Minnesota, the impact of Project GATE on
business ownership started at +12 percentage points in the first quarter of follow-up period and
increased to +15 percentage points in the last quarter, all statistically significant. The impact on
business ownership for the full sample, however, started at +6 percentage points in the first quarter
and declined to +3 percentage points by the last quarter. One reason for larger impacts among
recent UI recipients in Minnesota may have been that in the Minnesota sites, job search
requirements that accompany the receipt of UI were waived for GATE participants, allowing them
to continue receiving benefits while concentrating on their businesses, rather than looking for a
wage and salary job. The results for this group may have implications for the effectiveness of the
SEA program that is currently implemented in a number of states.
9. Findings from Project GATE differed from those of the UI Self-Employment
Demonstration. The findings from the evaluation of Project GATE differed quite markedly from

Evaluation of Project GATE Page 139 May 2008
those found from the evaluation of the UI Self-Employment Demonstration (Benus et al. 1995).
Project GATE’s impacts on business ownership were smaller than the impacts found in the UI Self-
Employment Demonstration. Moreover, while Project GATE had no impacts on total earnings
among UI recipients, the UI Self-Employment Demonstration had a positive impact on total
earnings in Massachusetts, although it had no impact in Washington.
Several factors may contribute to the difference in impacts of the two programs. First, Project
GATE targeted the general population whereas the UI Self-Employment Demonstration served
only those individuals on UI. Second, the counterfactual experienced by the control group differed
between the two interventions. Since the time of the UI Self-Employment Demonstration
implementation, there has been tremendous growth in the number of self-employment service
providers across the U.S. Thus, the control group in the Project GATE evaluation could access
many more services than the control group in the UI Self-Employment Demonstration. Third, the
UI Self-Employment Demonstration was implemented in different sites and in a different decade
than Project GATE. Differences in the local economy in the UI Self-Employment Demonstration
sites compared to the Project GATE sites may have affected the relative impacts of the two
programs.
10. Eighteen Months is a Short Follow-Up Period. The GATE evaluation followed the
sample members for 18 months after random assignment—an extremely short period of time to
receive services and build a successful business. It is extremely difficult to predict the success of
businesses after only 18 months. In contrast, the UI Self-Employment Demonstration followed
sample members for approximately three years. For a definitive assessment of the cost-effectiveness
of Project GATE, a longer follow-up period would be needed.

Evaluation of Project GATE Page 140 May 2008
REFERENCES
Akaike, Hirotsugu. “A New Look at the Statistical Model Identification.” IEEE Transactions on
Automatic Control, vol. 19, no. 6, 1974.
Angrist, J., G. Imbens, and D. Rubin. “Identification of Causal Effects Using Instrumental
Variables.” Journal of the American Statistical Association, vol. 91, no. 434, 1996.
Aronson, Robert L. Self-Employment: A Labour Market Perspective. New York: ILR Press, 1991.
Bellotti, Jeanne, Sheena McConnell, and Jacob Benus. “Growing America Through
Entrepreneurship: First Findings from Project GATE.” Columbia, MD: IMPAQ International,
LLC, August 2006.
Benus, Jacob, Terry Johnson, Michelle Wood, Neelima Grover, and Ted Shen. “Self-Employment
Programs: A New Reemployment Strategy: Final Report on the UI Self-Employment
Demonstration.” Unemployment Insurance Occasional Paper no. 95-4. Washington, DC:
U.S. Department of Labor, 1995.
Birch, D.L. The Job Generation Process. Cambridge, MA: MIT Program and Neighborhood and
Regional Change, 1979.
Bloom, Howard. “Accounting for No-Shows in Experimental Evaluation Designs.” Evaluation
Review, vol. 8, 1984.
Bloom, Howard S., Larry L. Orr, George Cave, Stephen H. Bell, Fred Doolittle, and Winston Lin.
“The National JTPA Study.” Bethesda, MD: Abt Associates, Inc., January 1994.
Brandstatter, H. “Becoming an Entrepreneur – A Question of Personality Structure?” Journal of
Economic Psychology, vol. 18, 1997.

Evaluation of Project GATE Page 141 May 2008
Brush, C.G. “Women and Enterprise Creation: Barriers and Opportunities.” In Enterprising Women:
Local Initiatives for Job Creation, edited by Sara K. Gould and Julia Parzen. Paris, France:
Organisation for Economic Co-operation and Development, 1990.
Carlson, B.L., Cox, B.G., and Bandeh, L.S. SAS Macros Useful in Imputing Missing Survey Data.”
Proceedings of the Twentieth Annual SAS Users’ Group International Conference. 1995.
Congressional Budget Office. “Effective Federal Taxes Under Current Law: 2001 to 2014.” August
2004. [http://www.cbo.gov/ftpdoc.cfm?index=5746&type=0&sequence=1].
Evans, D., and L. Leighton. “Some Empirical Aspects of Entrepreneurship.” American Economic
Review, vol. 79, 1989.
Fairlie, Robert W., and Bruce Meyer. “Ethnic and Racial Self-Employment Differences and Possible
Explanations.” Journal of Human Resources, vol. 31, no. 4, 2000.
Gartner, William B. “Some Suggestions for Research on Entrepreneurial Traits and Characteristics.”
Entrepreneurial Theory and Practice, vol. 14, no. 1, 1989.
Gartner, William B., Shaver, Kelly G., Carter, Nancy M., Reynolds, Paul D. Handbook of
Entrepreneurial Dynamics: The Process of Business Creation. Thousand Oaks, CA: Sage Publications,
2004.
Gould, S.K., and J. Parzen. “Recommendations, Conclusions, and Plans for Action.” In Enterprising
Women: Local Initiatives for Job Creation, edited by Sara K. Gould and Julia Parzen. Paris, France:
Organisation for Economic Co-operation and Development, 1990.
Guy, C., F. Doolittle, and B.L. Fink. “Self-Employment for Welfare Recipients: Implementation of
the SEID Program.” New York: Manpower Demonstration Research Corporation, 1991.
Hamilton, Barton. “Does Entrepreneurship Pay? An Empirical Analysis of the Returns to Self-
Employment.” Journal of Political Economy, vol. 108, no. 3, 2000.

Evaluation of Project GATE Page 142 May 2008
Heckman, James, Jeffrey Smith, and Chris Taber. “Accounting for Dropouts in Evaluations of
Social Programs.” Review of Economics and Statistics, vol. 130, 1998.
Hosmer, D.W. Jr. and S. Lemeshow. Applied Logistic Regression. New York, New York: John Wiley
and Sons, Inc., 1989.
Hotz, V. Joseph, and John Scholz. “Measuring Employment and Income for Low-Income
Populations with Administrative and Survey Data.” In Studies of Welfare Populations: Data
Collection and Research Issues, edited by Michele Ver Ploeg, Robert A. Moffitt, and Constance F.
Citro. Washington, DC: National Academies Press, 2001.
Institute on Taxation and Economic Policy. “A Distributional Analysis of the Tax Systems in All 50
States.” 2003.
Keeley, K. “The Role of Intermediaries in Strengthening Women’s Business Expansion Activities.”
In Enterprising Women: Local Initiatives for Job Creation, edited by Sara K. Gould and Julia Parzen.
Paris, France: Organisation for Economic Co-operation and Development, 1990.
Kesselman, Jonathan R. “Income Tax Evasion: An Intersectoral Analysis.” Journal of Public
Economics, vol. 38, 1989.
Kling, Jeffrey. “Incarceration Length, Employment, and Earnings.” American Economic Review, June
2006, vol. 96, no.3.
Knaup, Amy E. “Survival and Longevity in the Business Employment Dynamics Data.” Monthly
Labor Review, May 2005.
Kosanovich, William, and Heather Fleck. “Comprehensive Assessment of Self-Employment
Assistance Programs.” Arlington, VA: DTI Associates, June 2001.
Lerner, Josh. “Boom and Bust in the Venture Capital Industry and the Impact on Innovation.”
Economic Review, Federal Reserve Bank of Atlanta, issue Q4, 2002.

Evaluation of Project GATE Page 143 May 2008
Little, R.J.A. and Rubin, D.B. Statistical Analysis with Missing Data. New York: Wiley. 2002.
McConnell, Sheena, Elizabeth Stuart, Kenneth Fortson, Paul Decker, Irma Perez-Johnson, Barbara
Harris, and Jeffrey Salzman. “Managing Customers’ Training Choices: Findings from the
Individual Training Account Experiment.” Washington, DC: Mathematica Policy Research,
Inc., August 2006.
Meager, N. “Does Unemployment Lead to Self-Employment?” Small Business Economics, vol. 4,
1992.
Moore, Jeffrey C., Linda L. Stinson, and Edward J. Welniak, Jr. “Income Measurement Error in
Surveys: A Review.” U.S. Census Bureau. [http://www.census.gov/srd/www/ abstract/sm97-
05.html].
Raheim, S., and C.F. Alter. “Self-Employment as a Social and Economic Development Intervention
for Recipients of AFDC.” Journal of Community Practice, vol. 5, no. 2, 1998.
Reynolds, Paul. “Business Creation and Public Policy: Implications from the First U.S. Panel Study
of Entrepreneurial Dynamics.” Presentation at the 28th Association for Public Policy Analysis
and Management Research Conference, Madison, WI, November 2, 2006.
Reynolds, Paul and Curtin, Richard. “Panel Study of Entrpreneurial Dynamics Program Rationale
and Description”. [http://www.psed.isr.umich.edu/psed/background]. October 2007.
Rissman, Ellen R. “Self-Employment as an Alternative to Unemployment.” Chicago, IL: Federal
Reserve Bank of Chicago, December 2003.
Robinson, John G. “New Forms of Activity for the Unemployed and Measures to Assist the
Creation of Self-Employment; Experiences and Opportunities in Combating Unemployment.”
Unemployment Insurance Occasional Paper no. 93-2. Washington, DC: U.S. Department of
Labor, 1993.

Evaluation of Project GATE Page 144 May 2008
Schochet, Peter, John Burghardt, and Steven Glazerman. “National Job Corps Study: The Impacts
of Job Corps on Participants’ Employment and Related Outcomes.” Princeton, NJ:
Mathematica Policy Research, Inc., June 2001.
Servon, Lisa J., and Timothy Bates. “Microenterprise as an Exit Route from Poverty:
Recommendations for Programs and Policy Makers.” Journal of Urban Affairs, vol. 20, no. 4,
1998.
Sexton, D.L., and N. Bowman. “Validation of a Personality Index: Comparative Psychological
Characteristics Analysis of Female Entrepreneurs, Managers, Entrepreneurship Students, and
Business Students.” Frontiers of Entrepreneurship Research. Wellesley, MA: Babson College, 1986.
Stewart, W.H., and P.L. Roth. “Risk Propensity Differences Between Entrepreneurs and Managers:
A Meta-Analytic Review.” Journal of Applied Psychology, vol. 686, no. 1, 2001.
Trenholm, Christopher, Barbara Devaney, Kenneth Fortson, Lisa Quay, Justin Wheeler, and Melissa
Clark. “Impacts of Four Title V, Section 510 Abstinence Education Programs.” Princeton, NJ:
Mathematica Policy Research, Inc., April 2007.
U.S. Department of Labor, Bureau of Labor Statistics. National Compensation Survey, 2006.
U.S. House of Representatives, Committee on Ways and Means. Green Book, 2004.
Vroman, Wayne. “Self-Employment Assistance: Revised Report.” Washington, DC: The Urban
Institute, 1997.
Walker, Britton A., and Amy Kays Blair. 2002 Directory of U.S. Microenterprise Programs. Washington,
DC: The Aspen Institute, 2002.

Evaluation of Project GATE Appendix A-145 May 2008
APPENDIX A. DATA COLLECTION FOR IMPACT ANALYSIS
This appendix describes the collection of data used in the analysis of the impacts of Project GATE.
The data come from three sources:
The GATE application packet
Two waves of a follow-up survey
State Unemployment Insurance (UI) agencies.
We discuss each data source in turn.
A.1 GATE Application Packet
All persons who attended a GATE orientation were offered a GATE application packet. To apply
to Project GATE, persons were required to complete the application package and send it to IMPAQ
International. If IMPAQ International found that the applicant was eligible for Project GATE, had
completed most of the package, and had not previously applied to Project GATE, he or she was
randomly assigned to the program or control group.
The application package collected detailed background information. This information included:
Demographic and Socioeconomic Characteristics – The package asked for
information on age, gender, race/ethnicity, highest grade of education completed,
marital status, household size, number of children, country of birth, primary language,
U.S. citizenship, and whether the applicant had a health problem or disability that
limited the type of work he or she could do.
Income – The package asked for information on total household income over the
previous year. It also asked whether the applicant was receiving Temporary Assistance
for Needy Families (TANF), Supplemental Security Income, General Assistance, food
stamps, Social Security benefits, or other benefits. The application package also asked

Evaluation of Project GATE Appendix A-146 May 2008
whether the applicant was receiving UI benefits and the number of weeks the applicant
received UI over the past 12 months.
Previous Self-Employment Experiences – The package asked whether the applicant
had ever been self-employed, whether he or she was currently self-employed, the
number of years the applicant was self-employed, the date the previous business was
begun and ended, the number of employees the business hired, and whether any close
relatives or friends owned a business and whether the applicant worked for that
business.
Wage and Salary Work Experiences – The package asked whether the applicant was
currently working for themselves and/or for someone else, unemployed, or out of the
labor force. It also asked detailed information about the current or last wage and salary
job held by the applicant, such as wage rate.
Business Idea – The application package asked for a short description of the business
that the applicant wanted to start or grow. It also asked whether the applicant was
already operating this business, and if so, how long he or she had been operating it.
The package also asked whether the applicant ever operated a business similar to the
one he or she proposed to start or grow, whether the business would build on skills or
knowledge acquired while working for someone else or pursuing a hobby, whether the
applicant planned to operate the business out of his or her home, whether the applicant
had a location in mind, and whether the applicant had written a formal business plan
for the business.
Factors that May Affect Likelihood of Business Success – The application package
collected information about the financial and emotional support provided by the
applicant’s family, and the applicant’s access to a car, telephone, computer, and bank
account. It also asked about 13 personal character traits that are thought to affect the
likelihood of self-employment success, such as the ability to work independently. The
package also asked about the reasons for the applicant’s interest in self-employment.

Evaluation of Project GATE Appendix A-147 May 2008
Table A.1 compares selected background information across program and control groups.
In addition, the application package collected detailed contact information necessary to perform
random assignment, notify the applicant about their assignment, and locate the applicant for follow-
up surveys. The package also asked the applicant to consent to participate in the study.

Evaluation of Project GATE Appendix A-148 May 2008
Table A.1: Selected Background Characteristics of Program and Control Groups
Program Group Mean
Control Group Mean Difference
Male 0.53 0.54 -0.01
Age (average in years) 42.09 42.75 -0.65**
Race/Ethnicity White and not Hispanic/Latinoa 0.54 0.53 0.00 Black and not Hispanic/Latinoa 0.29 0.30 -0.01 Other 0.17 0.16 0.01
Born in the United States 0.90 0.90 0.00
United States Citizen 0.96 0.96 0.00
Highest Grade Completed (average in years) 14.39 14.51 -0.13*
Household Income Less than $10,000 0.12 0.10 0.02** $10,000 to $24,999 0.24 0.24 -0.01 $25,000 to $49,999 0.33 0.34 -0.01 $50,000 to $74,999 0.18 0.17 0.01 $75,000 to $99,999 0.07 0.07 0.00 $100,000 or more 0.06 0.07 -0.01
Status if Neither Employed Nor Owned a Business Looking for work 0.72 0.75 -0.02 Trying to become self-employed 0.30 0.29 0.01 Attending school or training 0.15 0.13 0.02 Taking care of a family member 0.07 0.06 0.01 Retired 0.03 0.02 0.01 Disabled 0.03 0.03 0.00 Other 0.06 0.05 0.00
Months Since Last Job Endedb (Average) 14.73 16.88 -2.15
Currently Receiving Unemployment Insurance (UI) 0.40 0.38 0.02
Received UI in Past Year 0.48 0.49 -0.01
Number of Weeks Received UI in Past Year 11.93 13.42 -1.49***
Ever Self Employed 0.35 0.38 -0.03**
Total Years of Self Employmentb 5.71 5.64 0.07
Weeks Self-Employed During Past Yearb (Average) 19.20 18.44 0.76
Currently Self Employed 0.18 0.20 -0.01
Years in Current or Most Recent Businessb (Average) 5.14 4.99 0.14
Typical Hours Per Week Worked at Business 34.74 35.21 -0.47
Business Considered a Financial Success 0.54 0.53 0.01

Evaluation of Project GATE Appendix A-149 May 2008
Program Group Mean
Control Group Mean Difference
Largest Number of Employees, Excluding Self 6.08 9.06 -2.99
Family or Close Relatives Ever Self Employed 0.71 0.72 0.00
Ever Work for Self-Employed Relativec 0.46 0.46 0.00
Ever Worked in Wage and Salary Job 0.99 0.99 0.00
Currently Working in Wage and Salary Job 0.30 0.30 0.00
Typical Hours Worked Per Week (Average) 39.49 39.65 -0.16
Hourly Wage (Average) 16.87 17.23 -0.36
Ever Worked in Managerial Capacity 0.63 0.63 -0.01
Years Worked in Managerial Capacityd (Average) 7.25 7.85 -0.60**
Credit Have a credit history 0.96 0.96 0.00 Have had credit problems in the paste 0.48 0.47 0.01
Household Income Someone else will work to support family while applicant works on business 0.45 0.46 -0.01 Average weekly earnings of family memberf 776.38 785.11 -8.73
Health Insurance Coverage Currently have health insurance 0.70 0.69 0.01
Level of Family Support for Self Employment Very supportive 0.76 0.75 0.01 Fairly supportive 0.14 0.15 -0.01 Neither supportive or unsupportive/fairly unsupportive/unsupportive 0.10 0.10 0.00
Applicants’ Assessment of their Personalities I enjoy working independently 1.18 1.20 -0.02 I finish projects even if they involve a great deal of work 1.22 1.20 0.01 I am willing to work long hours for my business 1.28 1.28 0.00 I have innovative ideas 1.36 1.32 0.04** I often take the initiative to start things 1.27 1.27 0.00 If something “can’t be done,” I find a way 1.39 1.43 -0.04* I’m willing to take a risk even if I am sure everything will work outg 2.89 2.89 0.00 I can handle challenges and persist during difficult times 1.26 1.24 0.02 I communicate easily with people who have different types of personalities 1.36 1.36 -0.01 I take advice from others 1.49 1.49 0.00 I’m a good motivator 1.46 1.46 0.00 I have clearly defined long and short term goals 1.76 1.76 0.00 I do not often miss deadlinesg 1.63 1.68 -0.05 I am an organized person 1.64 1.63 0.01 I do not have a difficult time making up my mindg 2.10 2.12 -0.03 I work well under pressure 1.52 1.50 0.02
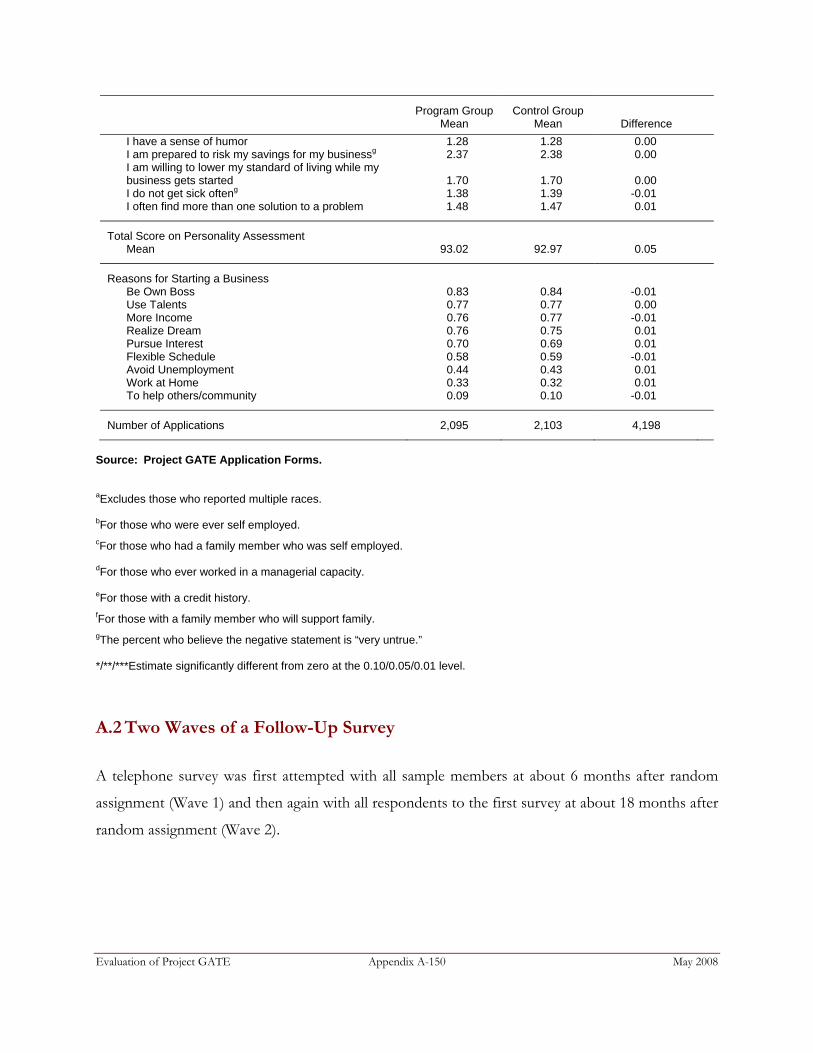
Evaluation of Project GATE Appendix A-150 May 2008
Program Group Mean
Control Group Mean Difference
I have a sense of humor 1.28 1.28 0.00 I am prepared to risk my savings for my businessg 2.37 2.38 0.00 I am willing to lower my standard of living while my business gets started 1.70 1.70 0.00 I do not get sick ofteng 1.38 1.39 -0.01 I often find more than one solution to a problem 1.48 1.47 0.01
Total Score on Personality Assessment Mean 93.02 92.97 0.05
Reasons for Starting a Business
Be Own Boss 0.83 0.84 -0.01 Use Talents 0.77 0.77 0.00 More Income 0.76 0.77 -0.01 Realize Dream 0.76 0.75 0.01 Pursue Interest 0.70 0.69 0.01 Flexible Schedule 0.58 0.59 -0.01 Avoid Unemployment 0.44 0.43 0.01 Work at Home 0.33 0.32 0.01 To help others/community 0.09 0.10 -0.01
Number of Applications 2,095 2,103 4,198
Source: Project GATE Application Forms. aExcludes those who reported multiple races. bFor those who were ever self employed. cFor those who had a family member who was self employed. dFor those who ever worked in a managerial capacity. eFor those with a credit history. fFor those with a family member who will support family. gThe percent who believe the negative statement is “very untrue.” */**/***Estimate significantly different from zero at the 0.10/0.05/0.01 level.
A.2 Two Waves of a Follow-Up Survey
A telephone survey was first attempted with all sample members at about 6 months after random
assignment (Wave 1) and then again with all respondents to the first survey at about 18 months after
random assignment (Wave 2).

Evaluation of Project GATE Appendix A-151 May 2008
A.2.1 Content of Questionnaires
The first and second follow-up surveys collected a similar set of information. However, the first
follow-up survey was used to collect information about the sample members’ experiences over the
first six months after random assignment and the second survey was used to collect information
about the time since the last survey—approximately 12 months.
The information collected by the surveys included:
Receipt of Self-Employment Services from Project GATE and Other Providers –
The surveys provided data on self-employment services that the sample members
received from Project GATE and other programs; this included training classes, one-
on-one counseling, mentoring, and peer support. Comparable data on self-
employment services were collected for both program and control group members.
The surveys also collected information on the intensity and duration of the services,
satisfaction with the services, and the perceived usefulness of different components of
the services.
Completion of Business Plans and Loan Applications – The surveys asked
whether the sample member had completed a business plan. They also asked about
any loan applications and other sources of business financing. The sample member
was also asked whether he or she received assistance in developing the plan or applying
for a loan from a self-employment service provider.
Business Development – The surveys collected detailed information about whether
the sample member was operating a business. They asked about the development or
growth of businesses owned by the sample member since random assignment.
Information collected included the start and end date of the business, earnings from
the business, the product or service produced by the business, how the business was
acquired, how much capital was put into the business, where it was located, amount of
sales and expenses, number of employees, and if a business ended, whether the
business was closed or sold.

Evaluation of Project GATE Appendix A-152 May 2008
Employment – Together, the surveys collected a complete 18-month history of all
employment since random assignment, including both self-employment and working
for someone else. Data collected included earnings, hours worked, and fringe benefits
received. The surveys also asked about satisfaction with employment, be it from
working for oneself or someone else.
Household Income and Receipt of Public Assistance – Each survey collected
household income data for the past 12 months. Information was also collected on the
earnings and fringe benefits of other household members. The surveys collected
information on the receipt of retirement benefits, welfare benefits, and other public
assistance.
The surveys collected some information about the perceived barriers to starting a business. Both
surveys also collected information on some demographic and socio-economic characteristics that
may change over time, such as marital status.
A.2.2 Survey Response Rates
Of the 4,198 GATE applicants, 82 percent responded to Wave 1 of the survey and 72 percent
responded to Wave 2 of the survey. Table A.1 presents the overall response rates and the response
rates by site and by program and control group.
The overall response rate for Wave 2 of the survey was higher for the program group than the
control group (75 percent compared with 70 percent). The response rate for the program group was
higher than the control group in each site except Maine. A similar pattern occurred for the Wave 1
survey.
The response rates differed quite substantially by site. The response rate was highest in Maine (91
percent for Wave 1 and 81 percent for Wave 2) and lowest for Philadelphia (77 percent for Wave 1
and 63 percent for Wave 2).

Evaluation of Project GATE Appendix A-153 May 2008
Table A.2: Response Rates
Site
Program
or Control Group
# of Sample
Members
Wave 1 Survey
Wave 2 Survey
# of Respondents
Response Rate
# of Respondents
Response Rate
All Both 4,198 3,450 82.2% 3,039 72.4%
All Program 2,095 1,759 84.0 1,564 74.7
All Control 2,103 1,691 80.4 1,475 70.1
Philadelphia Both 1,179 905 76.8 747 63.4
Pittsburgh Both 595 482 81.0 428 71.9
Minneapolis/St. Paul Both 1,654 1,383 83.6 1,257 76.0
Northeast Minnesota Both 203 167 82.3 148 72.9
Maine Both 567 513 90.5 459 81.0
Philadelphia Program 601 472 78.5 393 65.4
Philadelphia Control 578 433 74.9 354 61.3
Pittsburgh Program 288 240 83.3 218 75.7
Pittsburgh Control 307 242 78.8 210 68.4
Minneapolis/St. Paul Program 834 722 86.6 661 79.3
Minneapolis/St. Paul Control 820 661 80.6 596 72.7
Northeast Minnesota Program 97 81 83.5 73 75.3
Northeast Minnesota Control 106 86 81.1 75 70.8
Maine Program 275 244 88.7 219 79.6
Maine Control 292 269 92.1 240 82.2

Evaluation of Project GATE Appendix A-154 May 2008
A.3 State Unemployment Insurance Agencies
Data on employment, earnings, and receipt of UI benefits were requested from the state UI agencies
for all 4,198 GATE applicants who were randomly assigned.
A.3.1 Data Collection Strategy
UI wage records and UI benefits data were collected from the state UI agency in the three states—
Pennsylvania, Minnesota, and Maine. A list of the social security numbers of all GATE applicants
was sent to the state UI agency. The state agency matched UI wage and benefit records to each
social security number and returned a dataset with UI wage records and benefits data for each social
security number that was successfully matched. If an applicant’s social security number did not
match records on databases at the state UI agency, we assumed this meant that the customer did not
receive UI-covered earnings (or did not establish a UI claim, depending on the database) during the
time period covered by the evaluation.
A.3.2 UI Wage Records
Employers in most states are required to maintain and submit earnings records to the state’s UI
system for workers in jobs covered by UI. These records, which are maintained in machine-readable
format, are used to determine workers’ eligibility for UI if they are laid off.
The UI wage records include most, but not all, earnings. UI wage records consist of total quarterly
earnings reported by employers to state UI agencies for each employee. By law, most employers are
subject to a state UI tax and must report what is paid to each employee, including regular earnings,
overtime, and tips and bonuses. In most states, the Federal Unemployment Tax Act (FUTA) applies
to employers who (1) paid wages of $1,500 or more during any calendar quarter in the current or
preceding calendar year, or (2) employed at least one worker for at least one day in each of the 20
weeks during the current or preceding calendar year.

Evaluation of Project GATE Appendix A-155 May 2008
Most workers are covered under FUTA, but there are some excluded categories. In particular, UI
wage records do not cover federal workers, military staff, or self-employed people. Other workers
excluded from coverage under the FUTA provisions include railroad employees, workers in service
for relatives, most agricultural labor (except workers on large farms), domestic service workers
whose employers paid less than $1,000 in wages in any calendar quarter, part-time employees of
nonprofit institutions, some students employed by their schools, insurance and real estate agents on
commission, and workers performing “casual labor” not in the course of the employer’s business
(U.S. Department of Labor 2004).
We received quarterly wage records from each state for the third quarter of 2001 to the second
quarter of 2006. As the applicants were randomly assigned between September 2003 and July 2005,
we have at least two years of data prior to random assignment and one year of data after random
assignment for nearly all sample members.
The earnings data received from each state contain quarterly earnings data for each reported job.
For each state and calendar quarter available, we constructed total quarterly earnings for each sample
member by summing reported earnings from each of the customer’s employers.
For the analysis, we needed a measure of earnings for quarters measured in relation to random
assignment rather than calendar quarters. To do this, we defined “the first quarter after random
assignment” as the calendar quarter during which the customer was randomly assigned if he or she
were randomly assigned in the first half of the calendar quarter, and as the calendar quarter after the
customer was randomly assigned if he or she was randomly assigned in the second half of the
calendar quarter. For example, if a sample member was randomly assigned on November 14, 2004,
the fourth quarter in 2004 was designated as the first quarter after random assignment; if the
customer was randomly assigned on November 16, 2004, the first quarter of 2005 was designated as
the first quarter after random assignment. We also experimented with counting the first calendar
quarter that does not include random assignment as the “first quarter after random assignment” and
obtained similar findings.

Evaluation of Project GATE Appendix A-156 May 2008
A.3.3 Benefits
The UI benefits data cover all claims filed between July 2000 and July 2006. Hence, we have
information about all claims established in the three years prior to random assignment and the year
after random assignment. The data provided by the states included the date the benefit year began,
the maximum benefit amount (the total benefits amount awarded to the customer), the remaining
balance (the total amount of the award not yet paid to the customer), the weekly benefit amount (the
maximum amount the customer could receive per week), the claim type, and the first and last
compensable weeks (weeks that the customer could receive benefits).

Evaluation of Project GATE Appendix B-157 May 2008
APPENDIX B. TREATMENT OF SURVEY
NONRESPONSE AND MISSING VALUES
This appendix describes our approach to dealing with missing data. We begin by describing our
approach to dealing with missing data that occurs because a sample member did not respond to a
survey at all. Then we discuss our approach to dealing with missing data that occurs because a
sample member did not respond to a specific question on the survey.
B.1 Treatment of Survey Nonresponse
Each GATE applicant was given the opportunity to complete two follow-up telephone surveys, one
about 6 months after random assignment (Wave 1) and one about 18 months after random
assignment (Wave 2). Of the 4,198 GATE applicants, 3,450 responded to the Wave 1 survey (an 82
percent response rate) and 3,039 responded to the Wave 2 survey (a 72 percent overall response
rate). Response rates by site and research group (program and control) are presented in Table A.1.
Although response rates were fairly high, impact estimates could be biased if survey respondents
differed from nonrespondents in ways that are correlated with outcomes of interest. To adjust for
differences in observed characteristics between respondents and nonrespondents, we created
weights for each respondent for the Wave 1 and Wave 2 surveys.
The first step to creating weights for nonresponse was estimating logistic regression models of the
probability that a sample member responded to the survey. The models were estimated using the
full sample of 4,198 applicants. The dependent variable was whether the sample member had
responded to the survey. Any characteristic of the GATE applicant that may be correlated with
survey response and was reported on the GATE application package was a candidate to be a
covariate in the model.

Evaluation of Project GATE Appendix B-158 May 2008
For each wave of the survey, the best set of covariates for the nonresponse model was chosen by
comparing the following measures of predictive ability and goodness of fit: the R-squared statistic,
Akaike’s Information Criterion (Akaike 1974), the percentage concordant and discordant (Agresti
1996), and the Hosmer-Lemeshow goodness-of-fit test (Hosmer and Lemeshow 1989). It also
involved reviewing the statistical significance of the coefficients of the covariates in the model and
avoiding any unusually large adjustment factors.
For both the Wave 1 and 2 survey nonresponse models, the following characteristics were important
indicators of response propensity: age, gender, race/ethnicity, income level, primary language,
education, and indicators of whether the applicant had a bank account, was currently self employed,
had a relative who was self employed, was disabled, had managerial experience, provided three
alternative names or addresses on the application, had problems with credit history, or had ever
received unemployment benefits. Additional variables associated with response propensity for the
Wave 1 survey were indicators of whether the applicant was ever married or was currently
responsible for care of family members during the day. For Wave 2, additional variables associated
with response propensity included indicators of whether the family was very supportive of the
business endeavor, whether the applicant had ever worked for a relative, and whether the applicant
had health insurance.
The second step in creating nonresponse weights was to use the predicted values from the response
propensity models to create weighting cells. Twenty broad groups were defined by the 20 possible
combinations of three categorical variables: site (five categories), research group (program/control)
(two categories), and whether the sample member was in a business partnership with another sample
member (two categories). Within each of these twenty broad groups, five weighting cells were
created that were determined by the size of the predicted likelihood that the sample member
responded to the survey. This resulted in a total of 100 (5 x 20) weighting cells. The same
nonresponse weight was assigned within each of these 100 cells.
The third step was to create the nonresponse weight for each cell. The nonresponse weight was
calculated by dividing the total number of sample members in each cell by the total number of
survey respondents in each cell. For example, consider an applicant in Maine who was assigned to
the control group and was part of a business partnership with another GATE applicant. Suppose
that this applicant had a response propensity based on the logistic model of 0.75. This would put

Evaluation of Project GATE Appendix B-159 May 2008
her in the lowest of the five ranked cells within her broad group. There were only five applicants
within this cell (including the applicant described above). Of those five applicants, three responded
to the Wave 1 survey. Hence, if the applicant responded to the Wave 1 survey, her Wave 1
nonresponse weight would be 5/3 = 1.67.
As described in Chapter II, some GATE applicants were business partners with other GATE
applicants. If GATE applicants in the same business partnership were assigned to different research
groups (one to the program group and one to the control group, for example), there was potential
for contamination of the control group member(s). To remove this potential source of
contamination, sample members in business partnerships with members in both research groups
were given a weight of zero. This effectively removed these business partnerships from the analysis
sample. To ensure that business partnerships were not, however, underrepresented in the analysis
file, the weights of other business partnerships in the same site and research group were adjusted
upwards.
As a final step, because the outcomes for applicants in business partnerships are not independent,
the weights for applicants within business partnerships were adjusted so that the sum of the weights
for members in each business partnership was equal to the weight for one non-partnered applicant.
For example, three business partners applied to Project GATE in Minneapolis/St. Paul, were all
assigned to the program group, and all responded to the Wave 1 survey. The nonresponse weight
for each of these applicants was 1.08. The weight was adjusted to 2.38 because other business
partners in Minneapolis/St. Paul who were assigned a weight of zero because of the concerns about
contamination described earlier. To account for the fact that the outcomes for applicants in
business partnerships are not independent, the weight for each of these three sample members were
divided by three (2.38/3 =0.79). The sum of all the nonresponse weights is equal to 4,071, which is
the number of applicants who did not apply to Project GATE with a business partner (3,953) plus
the number of businesses represented by the applicants who applied with a business partner (118).
B.2 Treatment of Item Nonresponse
Some respondents responded to most of a survey but refused to answer particular questions or
responded to questions by saying “I don’t know.” This is referred to as item nonresponse and can

Evaluation of Project GATE Appendix B-160 May 2008
lead to a bias in impact estimates. To alleviate this source of bias, we imputed values for most
variables that had missing values.
Table B.1 presents the variables for which we imputed values when they were missing and the
percentage of nonresponse for the variable. The level of nonresponse to the question is calculated
only over sample members who were eligible to answer the question. For example, the percent of
nonresponse to the question in the survey about the number of businesses owned since random
assignment (question C6) was calculated only over those respondents who answered that they had
been self-employed since random assignment (question C4).
Table B.1: Rate of Nonresponse for Variables for Which Missing Values Were Imputed
Levels of Item Nonresponse
Among Eligible Cases (in %)
Description Wave 1 Survey Wave 2 Survey
Self-employed since random assignment (RA) 0.09 0.14
Number of businesses owned since RA 0.14 0.29
Month of start of first business 5.66 11.28
Year of start of first business 0.64 1.10
Month of start of 2nd business 8.33 16.37
Year of start of 2nd business 1.38 3.00
Monthly receipts/sales for first business 17.27 18.80
Monthly expenses for first business 15.84 16.44
Hours per week worked at first business 2.51 2.65
Hours per week worked at 2nd business 4.86 10.18
Percent of household income from first business 2.62 6.71
Percent of household income from 2nd business 4.96 7.19
Salary to self from first business 1.07 1.62
Salary to self from 2nd business 0.71 1.80

Evaluation of Project GATE Appendix B-161 May 2008
Levels of Item Nonresponse
Among Eligible Cases (in %)
Description Wave 1 Survey Wave 2 Survey
Weekly earnings from first business 21.45 27.30
Weekly earnings from 2nd business 30.00 17.86
Other income payments from first business 2.22 2.28
Other income payments from 2nd business 0.71 2.40
Amount other income payments, first business 27.40 31.57
Amount other income payments, 2nd business 21.88 25.00
Spouse/relative gets regular salary from first business 0.43 1.18
Spouse/relative gets regular salary from 2nd business 0.71 1.80 Weekly regular salary earnings received by spouse/relative from first business 18.33 25.00
Weekly regular salary earnings received by spouse/relative from 2nd business 25.00 25.00
Spouse/relative gets other income payments from first business 0.71
1.18
Spouse/relative gets other income payments from 2nd business 0.71 1.80
Weekly other income earnings received by spouse/relative from first business 33.33 35.00
Weekly other income earnings received by spouse/relative from 2nd business 33.33 28.57
Invested own money in business since RA 0.71 0.96
Amount of own money invested in business 10.85 15.76
Borrowed money for business since RA 0.71 0.74
Amount of money borrowed for business 7.62 9.40
Currently working for someone else 0.00 0.00
Had a job that lasted at least 2 weeks since RA 0.06 0.15
Gave employer name, first job lasting 2 wks + 2.85 4.15
Gave employer name, second job lasting 2 wks+ 4.50 6.05
Month of start of first job 6.81 9.31
Year of start of first job 4.90 6.56
Month of start of 2nd job 5.88 9.74

Evaluation of Project GATE Appendix B-162 May 2008
Levels of Item Nonresponse
Among Eligible Cases (in %)
Description Wave 1 Survey Wave 2 Survey
Year of start of 2nd job 4.08 5.98
Month of stop of first job 4.77 6.46
Year of stop of first job 4.59 6.13
Month of stop of 2nd job 4.41 6.49
Year of stop of 2nd job 3.92 5.98
Hours worked per week at first job 5.36 7.04
Hours worked per week at 2nd job 6.70 9.74
Weekly regular salary earnings from first job 11.27 13.98
Weekly regular salary earnings from 2nd job 12.90 14.53
Total household income past 12 months 9.80 13.52
Household member received unemployment assistance 1.83 1.48 Respondent indicates still receiving unemployment compensation or will provide the amount of time he/she received unemployment in either weeks or months
7.03 17.96
Number of weeks or months received unemployment compensation, if not still receiving it 7.02 17.30
Respondent answers amount of unemployment compensation in weeks (1) or months (2) 9.65 19.89
Amount of unemployment compensation 9.65 19.89
Received income from Social Security 1.36 1.09
Number of months received Social Security 4.11 4.44
Amount of money received from Social Security 23.08 19.77
Received income from food stamps 1.01 1.05
Number of months received food stamps 4.58 9.60
Amount of money received from food stamps 7.50 7.63
Received income from pensions 1.59 1.51
Number of months received pensions 4.26 11.22
Amount of money received from pensions 17.58 23.96
Received income from welfare 1.54 1.22
Number of months received welfare 5.26 5.36

Evaluation of Project GATE Appendix B-163 May 2008
Levels of Item Nonresponse
Among Eligible Cases (in %)
Description Wave 1 Survey Wave 2 Survey
Amount of money received from welfare 9.88 3.88
Received income from veterans’ benefits 1.04 1.05
Number of months received veterans’ benefits 3.08 7.82
Amount of money received from veterans’ benefits 20.00 20.32 Attended any classes, workshops, or seminars on topics related to your business since RA 2 0.12 0.59
Number of individual sessions of these classes, workshops, or seminars attended. 1.05 4.10
Length of individual sessions, workshops, or seminars, on average 0.00 0.10
Received any one-on-one counseling or technical assistance on starting or expanding your business since RA
0.06 0.30
Number of counseling or technical assistance sessions attended 0.96 6.40
Length of counseling/technical assistance sessions, on average 0.96 7.02
Attended peer support group for self-employed persons or persons interested in self-employment since RA 0.06 0.10
Number of support group sessions attended 1.53 8.08
Length of support group sessions, on average 2.63 8.75 Worked with an experienced business-owner or someone else who could act as your mentor since RA 0.14 0.30
Number of meetings with mentor 8.02 18.01
Length of sessions with mentor 5.02 16.54 Received any other types of self-employment services since RA 0.20 0.20
Constructed variable: B3=1 or B6=1 or B9=1 or B12=1 or B15=1 0.17 0.53
Amount paid in total for self-employment services 0.76 1.81
In some cases, a response was missing to a “feeder” question—a question that acts as a gateway to
other questions. For example, the question about whether the respondent has been self-employed
since random assignment is a feeder question. Questions about business ownership since random
assignment were asked only if they respond “yes” to this question. For most feeder questions, we
imputed a response to the feeder question if it was missing.

Evaluation of Project GATE Appendix B-164 May 2008
We imputed the missing values using a hot-deck procedure. We chose this approach because it
enables imputation of values given a set of constraints. This is important when imputing dates; we
can ensure, for example, that the end date for a job must be after the start date. These constraints
would be difficult to implement using other imputation approaches, such as a model-based or mean-
imputation procedure (Little and Rubin 2002).
The hot-deck procedure randomly selects a “donor” with the same values on a set of classing
variables for each respondent with a missing value (the “recipient”). The donor’s observed value on
the variable of interest is then used to replace the missing value for the recipient. A sequential (with-
replacement) nearest-neighbor hot-deck procedure was used, implemented using a SAS macro
described in Carlson et al. (1995). The number of recipients per donor was generally limited to two;
in a few cases there were three recipients per donor if the pool of donors eligible for the match was
small.
Classing variables were selected that were highly correlated with the variable requiring imputation.
They were always categorical; continuous variables were converted to categorical variables before
they could be used as classing variables. Each level of the classing variables is referred to as an
“imputation class.” When an imputation class had a recipient but no potential donors, we collapsed
levels of the classing variables so that a donor could be made available to the recipient.
Within each imputation class, donors and recipients had to have similar values for “sorting”
variables. Sorting variables could either be variables that were less closely related to the variable
requiring imputation than the classing variables, or they could be the continuous form of variables
that were used as classing variables. For example, the variable “Monthly receipts/sales for first
business” (C12) was highly correlated with “Monthly expenses for first business” (C13). Both are
continuous. Hence, when imputing C12, a categorical form of C13 was used as a classing variable,
and the continuous form was used as a sorting variable.
Research group was one classing variables used. To ensure no contamination occurred across
research groups, donors and recipients were nearly always both in the program group or both in the
control group. The other classing variables were selected by: (1) reviewing cross-tabulations of the

Evaluation of Project GATE Appendix B-165 May 2008
variable requiring imputations with all possible covariates, and (2) reviewing a series of forward and
backward stepwise regressions among eligible cases, with the variable requiring imputation as the
response variable. If the variable requiring imputation was a categorical variable, logistic models
were used for the forward and backward stepwise procedures. If the variable requiring imputation
was continuous, a categorical version of the continuous variable was used as the response in
stepwise multinomial logistic procedures, as well as the continuous form in ordinary least squares
(OLS) stepwise procedures. The variables were ordered in terms of the relationship to the variable
requiring imputation. Variables chosen as classing variables, but lower in this order, were the first to
be collapsed when it was necessary to collapse imputation classes. Research group was always the
first variable in this hierarchy, and was collapsed only once across all variables, for both surveys.
Because the variables requiring imputation were sometimes closely related to each other, the best
imputation often required including other variables with missing values. Variables were imputed
sequentially, so that for variables early in the sequence, some classing variables had missing values.
If a value of a classing variable was missing for only a few sample members, we tried to match
donors and recipients so both had missing values on that classing variable. If that was not possible,
a cross-classification of classing variables was implemented, and classing variables collapsed to allow
an imputation class with sufficient donors for the recipient. If many recipients had missing values
for the covariate in question, the hot-deck procedure was implemented separately for sample
members who were not missing this classing variable. For sample members who were missing a
classing variable, separate logistic models were run without the missing classing variable, and
separate imputations were implemented using nonmissing classing variables.
Because of the complexities in imputing dates and maintaining consistency, dates were not imputed
directly. Rather, a supplemental variable was created: a continuous variable with the year, with a
decimal that represented the proportion of the year given by the month. When the imputation
procedure on this variable was complete, the newly imputed variable was converted back to months
and years.
We implemented a series of checks to ensure that the imputations were reasonable. These checks
involved examining the individual imputations as well as examining their relationship to other
variables. They included:

Evaluation of Project GATE Appendix B-166 May 2008
Comparing the distribution of (1) raw data, excluding ineligible and missing cases; (2)
imputed data only, excluding ineligible and nonimputed data; and (3) imputed and raw data,
excluding only ineligible cases. Any unusual differences in these distributions had to be
explainable.
Comparing dates (both imputed and raw) to ensure no inconsistencies were apparent.
Comparing variables (both imputed and raw) with preexisting nonmissing data to ensure no
inconsistencies were apparent.
Variance estimates obtained using imputed data will be underestimates of the true variance. As the
findings with and without the imputations are similar (see Appendix D) and the methods necessary
to correct the variance estimates are complex and time-consuming, we did not adjust the standard
errors. Readers should bear this in mind when examining estimates based on imputed values that
differ from those based on nonimputed values.

Evaluation of Project GATE Appendix C-167 May 2008
APPENDIX C. ESTIMATION OF IMPACTS AND STANDARD
ERRORS
This appendix describes how we estimated the impacts of Project GATE. Because GATE
applicants were randomly assigned to the program and control groups, a simple difference in the
mean outcome measures for individuals in the two groups provides an unbiased estimate of the
impact of Project GATE. However, estimating impacts using a regression model increases statistical
precision and can adjust for chance differences in the baseline characteristics of applicants assigned
to the program and control groups. (Appendix D presents results from a sensitivity analysis that
estimates impacts using differences-in-means rather a regression model). The model used is
described in detail below.
C.1 Regression Model for Estimating Overall Impacts of Project Gate
Our estimates of the impacts of Project GATE are based on a comparison of applicants randomly
assigned to the program group with applicants randomly assigned to the control group. To compute
impacts, we estimated a statistical model that predicts the outcome of interest as a function of
program/control status, site, and a set of background characteristics detailed below. The basic form
of the model is:
(C.1)
where
yi is the outcome of interest
Si equals 1 if applicant i was in site S and 0 if not
Pi equals 1 if applicant i was in the program group, 0 if the applicant was in the control group
Xi is a vector of baseline characteristics of customer i
εi is a random, mean-zero error term that captures the impacts of unobserved factors that influence the outcome
5 5
1 1
,i ii S i S i iS S
y = S + S P +Xλ β δ ε= =
+ ′∑ ∑

Evaluation of Project GATE Appendix C-168 May 2008
λ, β, and δ are parameters (or vectors of parameters) to be estimated.
The regression models were estimated using weights to account for survey nonresponse business
partnerships that were necessarily excluded (Appendix B).
C.1.1 Estimation of Impacts
The parameters of greatest interest are the βS for each site, because they represent the impact on
applicants of being assigned to the program group rather than the control group in site S. To obtain
the average impact across all sites, we computed a weighted average of the impacts in each site, βPool,
where the weight is denoted by WS: 5
1Pool S S
SWβ β
== ∑
The site weight, WS, used in the above formulas is the proportion of all respondents that are from
site S. As a sensitivity check, Appendix D compares the results from our main specification to an
alternative where the five sites are each given equal weight in the regression, that is, WS = 1/5.
C.1.2 Choice of Linear Regression
For all outcomes we estimated the parameters in Equation C.1 using ordinary least squares, which
models the outcome as a linear function of the predictors. An alternative would have been to use
logistic regression (or probit models) for binary outcomes such as employment status. Logistic
regression models the “log odds of success” as a linear function of the predictors:
( ) log( )1
ii i i
i
g X eππ βπ
= = +−
, where ( )i iE yπ = .
We chose to use linear regression rather than a logistic regression for all outcomes for a few reasons.
The first reason was simplicity, both of analysis and presentation. There is not a standard way of
estimating or presenting standard error estimates for pooled impacts estimated using logistic
regression, whereas the calculation and presentation is very straightforward using linear regression.

Evaluation of Project GATE Appendix C-169 May 2008
Second, in previous research conducted by two of the authors of this study (McConnell et al. 2006),
a series of sensitivity analyses indicated that the linear and logistic regressions led to very similar
results for this analysis. In particular, results from linear regression were compared with a bootstrap
approach for estimating standard errors in logistic regression. The bootstrap approach yields correct
standard errors, but is computationally intensive and was not feasible for this study because of its
very large number of outcome measures. They generated impact estimates for a set of key binary
outcomes (with a range of mean values, from 0.1 to 0.9) using both approaches and compared the
results. The bootstrap and linear regression led to remarkably similar results; the impact estimates
were generally identical and the standard errors (and associated p-values) were very similar as well.
There were very few instances where the methods would lead to different conclusions regarding the
significance of an estimated impact. We thus chose to use linear regression for all outcomes, as was
done in several other large-scale evaluations, including Kling (2006), McConnell et al. (2006), and
Trenholm et al. (2007).
C.1.3 Regression Predictors
The predictors included in the regression model (the X variables in Equation C.1) were: age, sex,
race/ethnicity, whether disabled, marital status, household size, education level, born in the United
States, whether receiving UI benefits at application, weeks of UI benefits received over the previous
year, employment at the time of random assignment, prior self-employment experience (either
oneself or a relative), prior managerial experience, family support for pursuing self-employment,
another family member employed, household income, credit problems, relevant skills developed in a
job or hobby, and outside health insurance coverage. Data to define these predictors were obtained
from the GATE application package.
C.1.4 Estimating Subgroup Impacts
A slight simplification to the model was used when estimating impacts for subgroups of applicants.
In particular, to allow efficient estimation of the parameters of key interest for subgroups—the
overall impact across all sites for each subgroup—we do not include separate program indicators for
each site when estimating subgroup impacts. Including the site interactions with the subgroup
indicator would greatly increase the number of parameters in the model and may result in less
precise estimation of the overall subgroup impacts. The model used for subgroups is thus:

Evaluation of Project GATE Appendix C-170 May 2008
(C.2)
where the variables are defined as above, and 1iG = if applicant i is in group G and equals 0
otherwise. So, for example, for the subgroup of UI recipients at application, Gi=1 would equal 1 if
the sample member received UI at application and 0 otherwise; and Gi=0 would equal 1 if the
sample member had not received UI at application and 0 otherwise. The impact for subgroup G is
simply γG=1. Similarly, the impact for applicants not in subgroup G (Gi = 0) is γG=0. The variable
defining the group G is also included as a predictor in X. Tests of whether the impacts differ by
subgroup were conducted.
The subgroups for which we estimate the impacts of Project GATE are based on:
Education: applicants with college degrees/applicants with less than a college degree
Age: applicants over age 40/applicants under age 40
Gender: female/male customers
Race/ethnicity: nonminority applicants (white and non-Hispanic) and minority (black,
Hispanic, Asian, or other) applicants
Whether self-employed at some point before random assignment
Whether self-employed at the time of completing the GATE application package
Whether receiving UI benefits at the time of random assignment
Whether employed at the time of random assignment
C.2 Calculation of Standard Errors
To determine whether impact estimates were statistically significant, we computed standard errors
that account for the nonresponse weights (described in Appendix B) and the correlation of the
outcomes of business partners. Models were estimated in Stata 9.2, incorporating weights as
probability weights and clustering standard errors by business partnerships. For outcomes based on
the full sample—such as from the UI wage records—we used the same procedures, but the weights
were not adjusted for survey nonresponse because the full sample was included in the analysis.
5
1 01
( 1) ( 0) ,i S i G i i G i i i iS
y = S P G P G Xλ γ γ δ ε= ==
′+ × = + × = + +∑

Evaluation of Project GATE Appendix D-171 May 2008
APPENDIX D. SENSITIVITY ANALYSES
To assess the sensitivity of our impact estimates to different estimation procedures or assumptions,
we conducted a series of sensitivity analyses. This appendix describes these analyses and presents a
summary of the results. The sensitivity analyses included:
Estimating impacts with sites weighted equally
Including all business partners in the analysis
Excluding imputed outcome values from the analysis
Conducting an unweighted analysis
Estimating impacts without using regression adjustment
We examined the impact estimates for the key outcome measures under each of these five
alternative specifications and compared the results to the benchmark results presented in the
text. As reported in Table D.1, the results are fairly robust across all specifications. The
following sections describe the alternative specification in more detail.
D.1 Weighting Sites Equally
The first sensitivity analysis we conducted was to weight sites equally in computing the overall
impacts, rather than weighting by the number of GATE applicants in each site. The
Minneapolis/St. Paul and Philadelphia sites are large, while Northeast Minnesota has only a small
fraction of the sample; consequently, the site weights change substantially depending on whether
sites are equally or unequally weighted (see Table D.2).

Evaluation of Project GATE Appendix D-172 May 2008
Table D.1: Impacts on Key Outcomes Under Different Specifications
Outcome Benchmark
Results (1)
Sites Weighted Equally
(2)
All Business Partners
(3)
No Imputations
(4)
No Sample Weights
(5)
No Regression Adjustment
(6) Received any Services 20%*** 18%*** 19%*** 20%*** 19%*** 19%***Attended Classes 24%*** 25%*** 24%*** 24%*** 24%*** 24%***Attended Counseling 31%*** 31%*** 32%*** 31%*** 32%*** 31%***
Owned a Business
Quarter 1 5%*** 6%*** 5%*** 5%*** 5%*** 4%**Quarter 2 5%*** 5%** 6%*** 6%*** 6%*** 5%**Quarter 3 6%*** 6%*** 6%*** 6%*** 6%*** 5%***Quarter 4 4%*** 3% 4%** 4%*** 4%** 3%* Quarter 5 4%*** 4%* 4%*** 4%** 4%** 4%* Quarter 6 3%* 3% 3%* 3%* 3%* 2%
Any quarter 1-6 6%*** 5%** 5%*** 6%*** 5%*** 5%**
Employed in Wage and Salary Job
Quarter 6 -2% -2% -2% -3% -2% -2% Any quarter 1-6 -3%** -2% -2%* -3%* -3%* -2%
Employed for Self or Someone Else
Quarter 6 1% 0% 2% 0% 2% 1% Any quarter 1-6 1% 0% 1% 1% 0% 1%
Earnings from Businesses
in Q1-Q6 -$170 -$112 -$378 -$6 -$350 -$231
Earnings from Jobs in Q1-
Q6 -$1,798* -$678 -$1,086 -$1,369 -$1,440 -$1,777
Earnings from Businesses
or Jobs in Q1-Q6 -$1,960* -$771 -$1,458 -$1,182 -$1,784 -$2,012
Source: Follow-up surveys, waves 1 and 2. Notes: See Appendix C for a discussion of the regression model used for the main results. Each column of this
table uses the same specification as the main results, changing only the aspect labeling each column. The exception is column (3), which includes all business partners but does not include sample weights.
*/**/*** Estimate significantly different from zero at the 0.10/0.05/0.01 level.
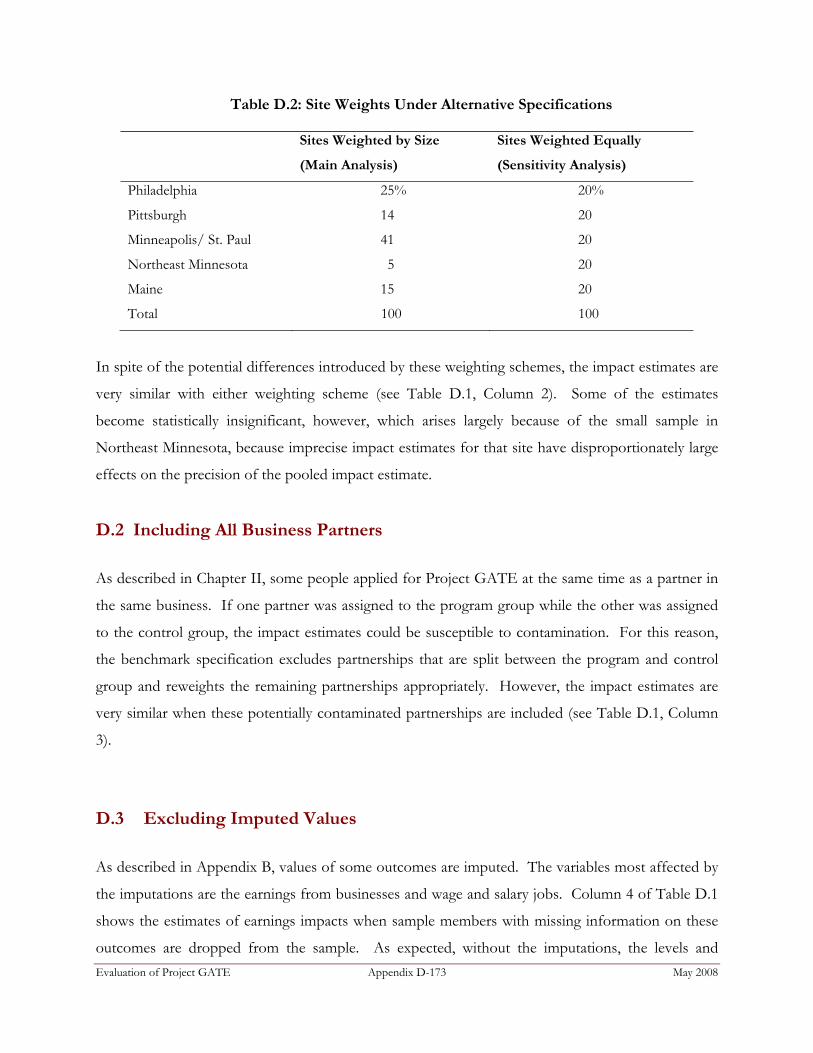
Evaluation of Project GATE Appendix D-173 May 2008
Table D.2: Site Weights Under Alternative Specifications
Sites Weighted by Size
(Main Analysis)
Sites Weighted Equally
(Sensitivity Analysis)
Philadelphia 25% 20%
Pittsburgh 14 20
Minneapolis/ St. Paul 41 20
Northeast Minnesota 5 20
Maine 15 20
Total 100 100
In spite of the potential differences introduced by these weighting schemes, the impact estimates are
very similar with either weighting scheme (see Table D.1, Column 2). Some of the estimates
become statistically insignificant, however, which arises largely because of the small sample in
Northeast Minnesota, because imprecise impact estimates for that site have disproportionately large
effects on the precision of the pooled impact estimate.
D.2 Including All Business Partners
As described in Chapter II, some people applied for Project GATE at the same time as a partner in
the same business. If one partner was assigned to the program group while the other was assigned
to the control group, the impact estimates could be susceptible to contamination. For this reason,
the benchmark specification excludes partnerships that are split between the program and control
group and reweights the remaining partnerships appropriately. However, the impact estimates are
very similar when these potentially contaminated partnerships are included (see Table D.1, Column
3).
D.3 Excluding Imputed Values
As described in Appendix B, values of some outcomes are imputed. The variables most affected by
the imputations are the earnings from businesses and wage and salary jobs. Column 4 of Table D.1
shows the estimates of earnings impacts when sample members with missing information on these
outcomes are dropped from the sample. As expected, without the imputations, the levels and

Evaluation of Project GATE Appendix D-174 May 2008
impact estimates of earnings are smaller. The impact on earnings from wage and salary jobs over
the whole follow-up period is -$1,369 when observations with missing earnings data are dropped,
compared with -$1,798 when earnings are imputed when the data are missing. This is because when
an observation is dropped, it is equivalent to assuming that the sample member will effectively be
assigned the average value of the outcome. Yet because we know the sample member does have a
job/business, while the average is taken over sample members who may or may not have a
job/business, the average value is likely to be an underestimate of their earnings from the job or
business. This is especially an issue for the control group because a higher proportion of the control
group was employed, especially in the first quarters of the follow-up period.
D.4 Unweighted Analyses
For all outcomes constructed using the survey data, the main impacts presented in the text are
estimated using weights that adjust for survey nonresponse as described in Appendix B. To assess
the effect of this weighting, we also estimated impacts for the survey-based outcomes without any
weights. Those results are presented for key outcomes in Column 5 of Table D.1. Again, the
results are nearly identical to the benchmark specification.
D.5 Difference-in-Means Analyses
Lastly, we estimated impacts without any covariates in the regression models. This is equivalent
to calculating simple differences-in-means of the outcomes between the approaches, with no
adjustments for covariates. The results from this analysis are presented for key outcomes in
Column 6 of Table D.1. The results again are very similar to those in the main analyses,
indicating that the regression adjustment did not dramatically affect the estimates. The primary
exception is for business ownership in quarters 4, 5, and 6 after random assignment; these are
very precisely estimated under the benchmark specification, but less so without regression
adjustment, as would be expected. The magnitude of the impact estimates are similar with both
approaches.