finding new markets for vietnamese seafood
TRANSCRIPT

P.O. Box 1390, Skulagata 4 120 Reykjavik, Iceland Final Project 2003
ESTIMATING CONSUMPTION OF SHRIMP AND WHITEFISH IN EUROPEAN MARKETS: FINDING NEW MARKETS FOR
VIETNAMESE SEAFOOD
Nguyen Tien Thom University of Fisheries,
Nha Trang Vietnam
Supervisor Dr Eyjolfur Gudmundsson,
Akureyri University Iceland
ABSTRACT This project is a field study that deals with seafood consumption in Europe, focused on shrimp and whitefish products. This includes seafood consumption, seafood trade, market tendencies and market analysis. The project has identified opportunities and potential markets in Europe to support Vietnamese seafood products. The target markets, potential markets and competitors were also identified. The shrimp and tra, basa catfish markets were analysed. The project also includes a SWOT analysis for the Vietnamese seafood industry and gives suggestions for exporters and policy makers in the Vietnamese fisheries sector.

Nguyen
TABLE OF CONTENTS
1 INTRODUCTION .................................................................................................7
2 METHODOLOGY ................................................................................................7
2.1 Marketing research and market research ...........................................................7
2.2 International business research ..........................................................................8
2.3 SWOT analysis ..................................................................................................9
3 INTRODUCTION OF THE VIETNAMESE SEAFOOD SECTOR ..................12
3.1 Natural conditions............................................................................................12
3.2 Fishery production ...........................................................................................12
3.3 Export markets .................................................................................................15
3.4 Export items .....................................................................................................15
3.5 Raw material resources ....................................................................................16
3.6 Summary ..........................................................................................................17
4 OVERVIEW OF THE EUROPEAN SEAFOOD MARKET..............................18
4.1 European demographic and societal study.......................................................18
4.2 Fisheries production in Europe ........................................................................20
4.3 Trade and consumption of fish and fish products in Europe ...........................23 4.3.1 Export fishery commodities.........................................................................23 4.3.2 Import of fishery commodities.....................................................................26 4.3.3 The supply and consumption of fish products in Europe ............................28
4.3.3.1 The supply of fish products for Europe ...............................................28 4.3.3.2 Utilisation of fish products...................................................................30
4.4 Lifestyle and demographic trends in Europe ...................................................31
4.5 Target markets for exporters............................................................................32 4.5.1 Target and potential markets........................................................................32 4.5.2 Competitors inside Europe...........................................................................36
4.6 Summary ..........................................................................................................37
5 EUROPEAN SHRIMP MARKET ......................................................................38
5.1 European shrimp production............................................................................39
5.2 European shrimp imports .................................................................................41
5.3 Importing price.................................................................................................46
5.4 Shrimp supply ..................................................................................................50
5.5 Target market ...................................................................................................53
UNU – Fisheries Training Programme 2

Nguyen
5.6 Summary ..........................................................................................................56
6 EUROPEAN MARKETS FOR WHITEFISH PRODUCTS...............................56
6.1 European whitefish production ........................................................................57
6.2 European whitefish commodities import and export .......................................61 6.2.1 Whitefish commodities export .....................................................................61 6.2.2 Whitefish commodities import ....................................................................64
6.3 Catfish markets ................................................................................................69
6.4 Summary ..........................................................................................................70
7 SWOT ANALYSIS AND SUGGESTIONS .......................................................72
7.1 SWOT Analysis ...............................................................................................72 7.1.1 Strengths ......................................................................................................72 7.1.2 Weaknesses ..................................................................................................73 7.1.3 Opportunities................................................................................................73 7.1.4 Threats..........................................................................................................74
7.2 Suggestions ......................................................................................................76
7.3 Summary ..........................................................................................................78
8 CONCLUSION....................................................................................................79
ACKNOWLEDGEMENTS.........................................................................................82
LIST OF REFERENCES.............................................................................................83
UNU – Fisheries Training Programme 3

Nguyen
LIST OF FIGURES Figure 1: A sequential process of research of foreign market potentials applicable in
the seafood sector (Tamer 1989)............................................................................9 Figure 3: SWOT/TOWS matrix (www.Quickmba.com). ...........................................11 Figure 4: Map of Vietnam showing the long coastline and South China Sea. Website:
http://wwp.greenwichmeantime.com...................................................................12 Figure 5 : Map of the Mekong Delta, southern Vietnam
(http://cantho.cool.ne.jp/mekong/mangrove/map.jpg).........................................16 Figure 6: Map of Europe (http://www.graphicmaps.com/aatlas/world.htm)/............18 Figure 7: Population of the top 10 European countries (UN Population Division
2000). ...................................................................................................................19 Figure 8: Historical fisheries production of Europe in the period 1950-2001 (FAO
2001). ...................................................................................................................21 Figure 9: Fisheries volume production share of European countries in 2001, by
country. ................................................................................................................21 Figure 10: Increasing freshwater fish production by years (FAO 2001). ...................22 Figure 11: Export value of fishery commodities in Europe from 1976-2001 (FAO
2001). ...................................................................................................................23 Figure 12: Change in CPI, export volume and export value of the 15 EU states in %,
1991-2001. ...........................................................................................................24 Figure 13: Historical import value of fishery commodities into Europe, 1976-2001.26Figure 14: Change in CPI, import value, and import volume of the 15 EU states in %,
1991-2001. ...........................................................................................................27 Figure 15 : Historical shrimp production in Europe in the period 1950-2001 (FAO
2001). ...................................................................................................................39 Figure 16: Historical shrimp import volume into Europe, 1976-2001 (FAO 2001)...41Figure 17 : Import value share of shrimp in Europe in 2001 (FAO 2001). ................43 Figure 18: Fluctuating unit value in the period 1976-2001. .......................................46 Figure 19: Historical whitefish production of Europe, 1950-2001 (FAO 2001). .......57 Figure 20. Change of production share of each species in 1992 and 2001.................58 Figure 21: Main cod products in European markets: fresh, fillets, and steaks (photo
by Globelfish). .....................................................................................................59 Figure 22: Export quantity share of fresh/frozen/prepared cod in 2001 by country
(FAO 2001). .........................................................................................................63 Figure 23: Import volume share of fresh/frozen/prepared cod in 2001 by country
(FAO 2001). .........................................................................................................67
UNU – Fisheries Training Programme 4

Nguyen
LIST OF TABLES Table 1: Fisheries production of Vietnam, selected years, MT (Ministry Fisheries of
Vietnam). .............................................................................................................12 Table 2: Capacity of Vietnamese fisheries production, selected years (Fisheries
Ministry of Vietnam, 2002). ................................................................................13 Table 3: Vietnamese seafood exports, volume and value for selected years (Fisheries
Ministry of Vietnam, 2002). ................................................................................14 Table 4: Vietnamese seafood export share, by import country, period 1997-2003
(Fisheries Ministry of Vietnam)...........................................................................15 Table 5: Fisheries exports in 2001 classified by products (Fisheries Ministry of
Vietnam 2001). ....................................................................................................16 Table 6: Population of the European continent (UN Population Division 2000). ......18 Table 7: European countries with more than 10,000 US$ in GNI per capita (World
Bank data Atlas method)......................................................................................20 Table 8 : Fisheries volume production share of Europe, by species, in 2001 and 1950-
2001......................................................................................................................22 Table 9: Export volume by main groups from Europe, 1995-2001, 1,000 MT (FAO
2001). ...................................................................................................................25 Table 10: Fish products export value from Europe, by country, 1995-2001, in million
S$ (FAO 2001).....................................................................................................25 Table 11: Import volume by main group, 1995-2001, 1,000 MT (FAO 2001). .........27 Table 12: Top 10 importers of fishery commodities in Europe, 1995-2001 in US$
million (FAO 2001). ............................................................................................28 Table 13: Apparent European seafood consumption, in 1,000 MT (FAO 2001). ......29 Table 14: Top 10 suppliers of fish products to Europe, period 1997-2001, 1,000 MT
(FAO 2001). .........................................................................................................29 Table 15: Domestic utilisation of fish products in top 10 European countries, 1997-
2001, 1,000 MT (FAO 2001). ..............................................................................30 Table 16: Average utilisation of fish products per capita in top 20 European
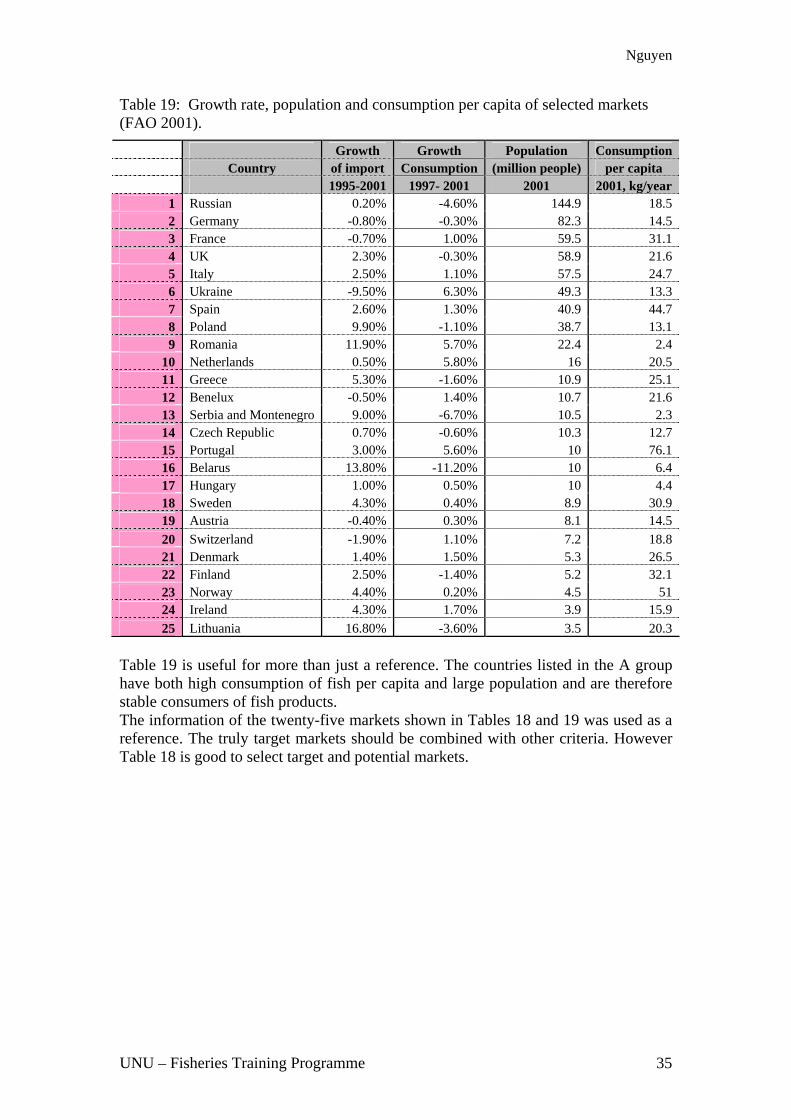
countries, 1997-2001, kg/person/year (FAO 2001). ............................................31 Table 17: Main criteria for choosing target markets sorted by country (FAO 2001). 33Table 18: Target markets and priority level by countries. .........................................34 Table 19: Growth rate, population and consumption per capita of selected markets
(FAO 2001). .........................................................................................................35 Table 20: European big exporters, selected by country (FAO 2001). ........................36 Table 21: Fishery production of competitors, by selected years, 1,000 MT (FAO
2001). ...................................................................................................................37 Table 22: European shrimp production by species, 1,000 MT (FAO 2001). .............39 Table 23: European shrimp production by country, 1,000 MT (FAO 2001)..............40 Table 24: Total European imports of fresh/frozen/chilled and prepared shrimp by
country, 1,000 MT (FAO 2001)...........................................................................42 Table 25 : European import volume of shrimp by product, 1992-2001, 1,000 MT
(FAO 2001). .........................................................................................................43 Table 26: Import of fresh/frozen shrimp to Europe by country, in MT (FAO 2001). 44Table 27: European imports of prepared shrimp by importing country, MT (FAO
2001). ...................................................................................................................45 Table 28: The unit value of certain commodities 1995-2001, US$/kg.......................46 Table 29: The average import unit value of frozen/fresh/prepared shrimp by country,
1995-2001, US$/kg. .............................................................................................47
UNU – Fisheries Training Programme 5
Nguyen
Table 30: Import unit value of fresh or chilled shrimp by country, 1995-2001, US$/kg. ................................................................................................................48
Table 31: Import unit value of frozen shrimp by country, 1995-2001, US$/kg. ........49 Table 32: Import unit value of prepared or preserved shrimp by country, 1995-2001,
US$/kg. ................................................................................................................50 Table 33: Shrimp supply of Europe in MT (FAO 2001). ..........................................51 Table 34: Total supply of frozen shrimp, by country in MT (FAO 2001)..................52 Table 35: Net import of fresh or chilled shrimp by country, in MT (FAO 2001). .....53 Table 36: Net import of frozen shrimp by country, in MT (FAO 2001). ...................53 Table 37: Net import of prepared or preserved shrimp by country, in MT (FAO
2001). ...................................................................................................................54 Table 38: Export shrimp in Europe by country, 1992-2001, 1,000 MT (FAO 2001).55Table 39: Whitefish production in Europe by country, 1992-2001, 1,000 MT (FAO
2001). ...................................................................................................................59 Table 40: Export quantity of whitefish by products, 1992-2001, 1,000 MT (FAO
2001). ...................................................................................................................61 Table 41: Export volume of whitefish by species, 1992-2001, 1,000 MT (FAO 2001).
..............................................................................................................................61Table 42: Export value of whitefish by country, 1992-2001, million US$ (FAO
2001). ...................................................................................................................62 Table 43: Cod commodities export by products, 1992-2001, 1,000 MT (FAO 2001).
..............................................................................................................................62Table 44: Import volume of whitefish by product, 1992-2001, 1,000 MT (FAO
2001). ...................................................................................................................64 Table 45: Import volume of whitefish by species, 1992-2001, 1,000 MT (FAO 2001).
..............................................................................................................................64Table 46: Import value of whitefish by country, 1992-2001, million US$ (FAO
2001). ...................................................................................................................65 Table 47: Cod commodities exports by products, 1992-2001, 1,000 MT (FAO 2001).
..............................................................................................................................66Table 48: Net imports of fresh/frozen whitefish, average of 1997-2002, MT (FAO
2001). ...................................................................................................................68 Table 49: Aquaculture catfish volume in the world, 1992-2001, 1,000 MT (FAO
2001). ..................................................................................................................69 Table 50: Capture catfish volume in the world, 1992-2001, 1,000 MT (FAO 2001). 69Table 51: Summary of the SWOT analysis of the Vietnamese seafood industry.......75
UNU – Fisheries Training Programme 6

Nguyen
1 INTRODUCTION Fisheries are one of the key sectors in the Vietnamese economy. The fisheries sector is in third position amongst exporters of Vietnamese products. Most Vietnamese seafood products are exported to Japan, United States, and Asian markets. The heavy dependent on a few markets such as Japan and US has caused many disadvantages for Vietnamese exporters. Vietnamese seafood exporters need to diversify their markets as well as diversify product category. The aim of this project is to single out opportunities and potential markets in Europe to support the entrance of Vietnamese seafood products. Methodology for this project will be explained in chapter 2. Vietnamese seafood industry is introduced in chapter 3. Chapter 4 will analyse and evaluate fish and fish products in European countries as well as their fish consumption. Chapter 5 and chapter 6 focus on shrimp and whitefish markets analysing and evaluating European production and trade in shrimp and whitefish products. Then the chapters will show the potential markets for Vietnamese export of these products. Based on the results of chapters 3 through 6 strengths, weaknesses, opportunities and threats Vietnamese seafood in European markets will be analysed. Suggestions for Vietnamese exporters and policy makers are finally given in chapter 8. 2 METHODOLOGY 2.1 Marketing research and market research Both marketing research and market research is a branch of social science, which uses scientific methods to collect information about markets for goods and services. But there is a difference in role and nature between marketing research and market research. According to American Marketing Association the definition of marketing research is: "The process of planning and executing the conception, pricing, promotion and distribution of ideas, goods, and services to create exchanges that satisfy individual and organisational objectives" (American Marketing Association, Dictionary of Marketing Terms). According to US Small Business Administration, market research is “a systematic, objective collection and analysis of data about your target market, competition, and/or environment with the goal being increased understanding of them. Market research is the study of markets (or groups of people) you would like to sell your product to. In other words, it is learning about your customers. Who are they? What do they want or need? What are their lifestyles?” (US Small Business Administration, Glossary) Marketing research focuses on certain products or certain services, but market research concentrates on a certain market, competition and environment. Marketing research refers to customer behaviour, especially behaviour about purchase and consumption of product. Market research emphasise on factors of a market such as quantity of consumption, social environment, tendency and analysis the other macro-factors.
UNU – Fisheries Training Programme 7

Nguyen
Most market research is done using desk research involving the sourcing of published information. Both primary and secondary data are used. Primary data is the information collected specifically for the purpose of the investigation at hand. The secondary data is the statistics not gathered for the immediate study at hand but for some other purpose, often collected by government agencies. 2.2 International business research Entrance to foreign markets is not the only way to gain more benefits but also a way to diversify the risk of firms. The first step to enter a foreign market is market research. In progressive market research, the most important work is to determine the objectives of the research before undertaking research. A frequent objective of international research is that of foreign market opportunity analysis (Czinkota et al. 1999). The researchers find out the chances to enter the market by using analytical tools. The work should begin with a general analysis of macro-variables of a country or of an area. This analysis can be undertaken through criteria such as GNI (Gross National Income) per capita, population, consumption of goods and services, economic growth, inflation, and even the status of corruption of a country or an area. Even though these factors in themselves will not provide any detailed information, they will enable the researcher to determine whether corporate objectives might be met in the market (Czinkota et al.1999). In this project, the following criteria were used in the step of general analysis: population, GNI per capita, production and trade of seafood commodities, and trends of seafood markets in European countries. In the next step, the researcher should collect information on each individual country or territory from preliminary evaluation. Most information collected may highlight the fastest growing markets, the largest markets, potential markets for a particular product or service, demand trends, and business restrictions. Although precise and detailed information may not be obtainable, information is available for general product categories or service industries. This overview will serve to evaluate markets quickly and further reduce their numbers (Czinkota et al.1999). At this stage, the researcher must select appropriate markets for in-depth evaluation. The focus will be on opportunities for specific type of service, product, brand or particular markets and will include an assessment as to whether demand already exists or can be stimulated. Finally, a competitive assessment needs to be made, matching market to corporate strengths and providing an analysis of best potential for specific offering (Czinkota et al.1999). For this project, after the general analysis of European market the target market was determined and the competitive producers identified. Then the shrimp and whitefish markets were researched in detail. Shrimp and whitefish are main export items of Vietnam. Vietnamese enterprises have faced trade barriers from foreign markets, especially American markets. To diversify the risk Vietnamese seafood producers must reduce the dependency on unique markets like United States markets. European markets were targeted to conduct a study of market diversification.
UNU – Fisheries Training Programme 8

Nguyen
Stage One
Preliminary screening for attractive country seafood markets Key question to be answered: Which foreign markets warrant detailed investigation?
Stage Two Assessment of seafood market potential
Key question to be answered: What is the aggregate demand in each of the selected markets?
Stage Three Seafood sector sales potential analysis
Key question to be answered: How attractive is the potential demand for seafood products?
Figure 1: A sequential process of research of foreign market potentials applicable in the seafood sector (Tamer 1989). As Figure 1 shows, the first step of seafood market research is to discover the attractive country markets that warrant detailed investigation. The first step begins with a cursory analysis of European countries. The aspects are analysed including total GNI, GNI per capita, population figures, consumption of fish products, budgets for consumption, production and trade of seafood commodities. Based on the country markets chosen from step one, assessment of seafood market potential is undertaken in step two. The second step will reveal the total demand in each selected market. Quantity research as well as qualitative research is used in this step. In the last step the seafood industry sales potential will be analysed. The step will figure out the level of demand from the selected markets. The step also analyses the advantages of the seafood industry to meet that demand. 2.3 SWOT analysis After international market research for seafood sector in Europe has been undertaken the project continues to environmental analysis for Vietnamese seafood export by SWOT analysis. SWOT analysis is a tool for evaluating organisation or sector and its business environment, economy, society, politics, culture, and even nature. It is the first stage of planning or policy-making and helps marketers or policy makers to focus on key issues (website: QuickMBA, SWOT analysis). SWOT analysis stands for strengths, weaknesses, opportunities, and threats. Strengths and weaknesses are internal factors. Opportunities and threats are external factors.
UNU – Fisheries Training Programme 9

Nguyen
The SWOT scans the environment and provides information that is helpful in matching the organisation’s ´ resources and capabilities to the competitive environment in which it operates. As such, it is instrumental in strategy formulation and selection. Environment Scan
Internal Analysis External Analysis
Strengths Weaknesses Opportunities Threats
SWOT Matrix
Figure 2: SWOT analysis framework. www.quickmba.com
The strengths are resources and capacities that can be used as a basis for developing a certain objective and a competitive advantage. The strengths of a sector could be: - Specialist marketing expertise - A new, innovative product - Location of business - Quality processes and procedures - Price and quantity of product or service, prestige of business - Any other aspect of the business that adds value to the product or service The weakness may be the absence of certain strengths. So if a firm lacks the strengths above, they are weaknesses for the firm. The weaknesses could be: - Lack of marketing expertise - Undifferentiated products - Location of business making the disadvantage of delivering and conserving of products - Poor quality goods or service - Damaged reputation - Other aspects those are not more advantage than competitors. The opportunities are things that originate from external environment and businesses maybe obtain profit and growth from. The opportunities could be: - A developing market - Mergers, join ventures or strategic alliances
UNU – Fisheries Training Programme 10
Nguyen
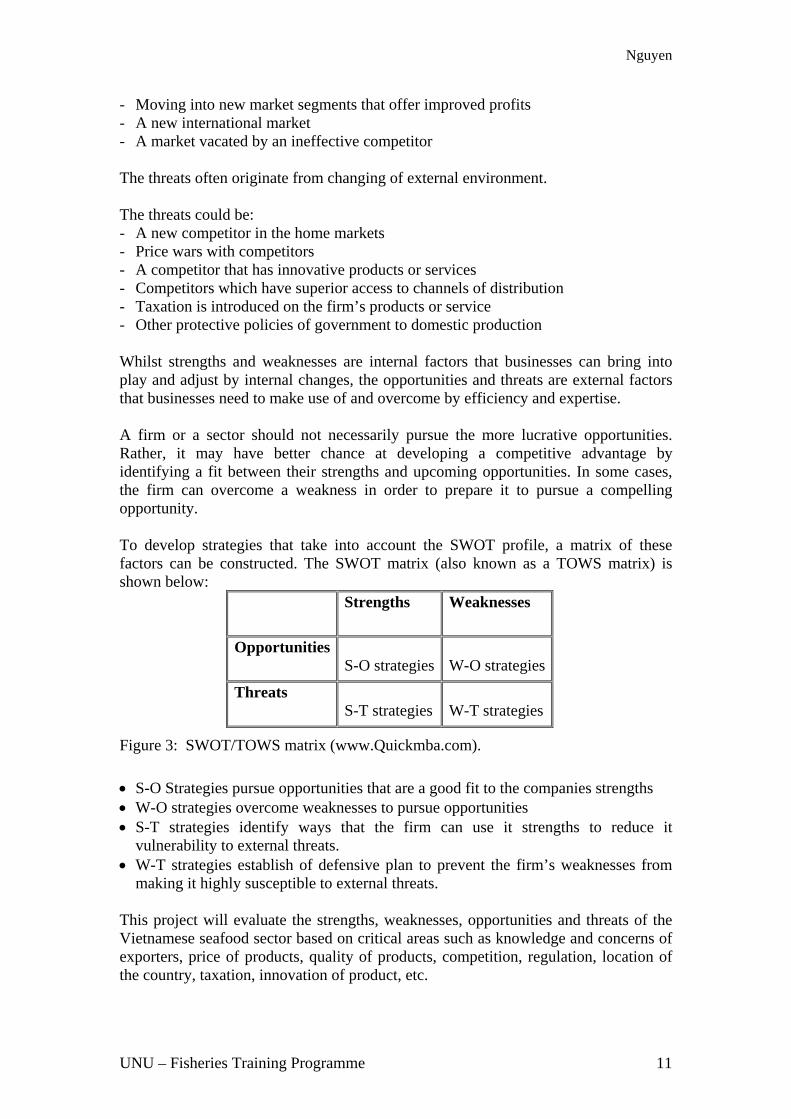
- Moving into new market segments that offer improved profits - A new international market - A market vacated by an ineffective competitor The threats often originate from changing of external environment. The threats could be: - A new competitor in the home markets - Price wars with competitors - A competitor that has innovative products or services - Competitors which have superior access to channels of distribution - Taxation is introduced on the firm’s products or service - Other protective policies of government to domestic production Whilst strengths and weaknesses are internal factors that businesses can bring into play and adjust by internal changes, the opportunities and threats are external factors that businesses need to make use of and overcome by efficiency and expertise. A firm or a sector should not necessarily pursue the more lucrative opportunities. Rather, it may have better chance at developing a competitive advantage by identifying a fit between their strengths and upcoming opportunities. In some cases, the firm can overcome a weakness in order to prepare it to pursue a compelling opportunity. To develop strategies that take into account the SWOT profile, a matrix of these factors can be constructed. The SWOT matrix (also known as a TOWS matrix) is shown below:
Strengths Weaknesses
Opportunities S-O strategies
W-O strategies
Threats S-T strategies
W-T strategies
Figure 3: SWOT/TOWS matrix (www.Quickmba.com).
• S-O Strategies pursue opportunities that are a good fit to the companies strengths • W-O strategies overcome weaknesses to pursue opportunities • S-T strategies identify ways that the firm can use it strengths to reduce it
vulnerability to external threats. • W-T strategies establish of defensive plan to prevent the firm’s weaknesses from
making it highly susceptible to external threats. This project will evaluate the strengths, weaknesses, opportunities and threats of the Vietnamese seafood sector based on critical areas such as knowledge and concerns of exporters, price of products, quality of products, competition, regulation, location of the country, taxation, innovation of product, etc.
UNU – Fisheries Training Programme 11

Nguyen
3 INTRODUCTION OF THE VIETNAMESE SEAFOOD SECTOR 3.1 Natural conditions Vietnam is located in the tropical monsoon area of South East Asia. It has a coastline of more than 3,260 km, crossing 13 latitudes, from 80 23´ north to 21039’ north. The total area of the territorial water is 226,000 km2. The Exclusive Economic Zone (EEZ) is about 1 million km2.
Figure 4: Map of Vietnam showing the long coastline and South China Sea. Website: http://wwp.greenwichmeantime.com
Vietnam has advantage for developing aquaculture with total area of fresh water and brackish water around 1.7 million hectares. It includes paddy fields, river systems, ponds, lakes and reservoirs. 3.2 Fishery production Since opening of the economy, the fishery sector has developed fast, becoming a key sector in the Vietnam economy. Production volume has increased constantly throughout the years. In 2002, the total production volume reached 2.4 million MT, in which marine capture accounted for 60%, the rest came from aquaculture. The average growth rate of fisheries production is about 30% annually in the period 1990-2002. Table 1 shows in more detail the growth of fisheries production.
Table 1: Fisheries production of Vietnam, selected years, MT (Ministry Fisheries of Vietnam).
Target 1990 1995 2000 2001 2002 Marine capture 709,000 928,860 1,280,590 1,347,800 1,434,800 Aquaculture 310,000 415,280 723,110 879,100 976,100 Total 1,019,000 1,344,140 2,003,700 2,226,900 2,410,900
UNU – Fisheries Training Programme 12

Nguyen
Table 1 shows that marine capture increased from 709 thousand MT in 1990 to 1.4 million MT in 2002 (a twofold increase) and aquaculture production increased from 310 thousand MT in 1990 to almost 1 million MT in 2002 (more than threefold increase). The average growth of fisheries production in the period 1990-2002 was 28%, in which the growth of marine capture was 26% and 30% aquaculture. There are over 2,000 species of fish in Vietnamese water, among which around 130 species with economic value are: 1,600 crustacean, 2,500 molluscs and many other types of seaweed and seabirds. The total potential of fisheries resources is estimated at 4.2 million tons; the annual sustainable production is assessed at about 1.7 million tons (Vietnam Fisheries 2001). However, scientists say that inshore fisheries resources have been over exploited.. Volume of fish exploitation in Vietnam should peak at 1.2-1.3 million MT per year, according to fisheries scientists (Plan of Vietnam Fishery 2000-2010). Vietnam has huge potential to develop aquaculture. The Government of Vietnam puts much attention to aquaculture development aimed to create a sustainable fisheries structure of marine resources, to contribute to the food safety assurance, poverty alleviation, and job creation for people, especially to improving women’s role in rural and mountainous areas. Aquaculture development also helps to increase products for export. The target in production is that 40% comes from capture fisheries and 60% from aquacultures in 2010 (Plan of Vietnam Fishery 2000-2010). In 2002, Vietnam had about 81,800 motorised fishing boats of all types. This was increase from 72,000thousand boats in 1990 (see Table 2 for details) but a decrease compared to 95,700 boats in 1995. Among the motorised boats, there were more than 6,000 units with engine capacity of over 90 hp, which are capable of performing offshore fishing (Fisheries Ministry of Vietnam).
Table 2: Capacity of Vietnamese fisheries production, selected years (Fisheries Ministry of Vietnam, 2002).
Target 1990 1995 2000 2001 2002 Number of boats 72,328 95,700 79,017 78,978 81,800 Total capacity (hp) 727,585 1,500,000 3,204,998 3,722,577 4,038,365 Aquaculture area (ha) 491,723 581,000 652,711 900,109 955,000
In 2002, the total water surface used nationwide for aquaculture purposes was 955,000 ha, an increase by 94% since 1990. Total aquaculture production reached 976,100 tons, 15% among which was black tiger shrimp. It is expected by the year 2005, under the policy of transferring structure of land for agriculture, the water surface area used for aquaculture will be 1.4 million ha, including 500,000 ha of fresh water surface and 900,000 ha of brackish and marine water. The production in year 2005 is expected to reach 1.15 MT (Plan of Vietnam Fishery 2000-2010). In 1997 fisheries ministry implemented offshore capture strategy. The plan was to increase capacity of fishing sector by building large vessels but reducing number of
UNU – Fisheries Training Programme 13

Nguyen
small boats. This explains the numbers of boats have gone down but total capacity has gone up during the period from 1995 to 2000. Since the beginning of the 1990s, the fisheries processing industry of Vietnam has had remarkable growth. In the year 2003, there were 332 freezing seafood-processing enterprises nationwide and thousand of traditional processing units. In which there are 152 processing plant qualified for food safety and sanitary regulation under HACCP, ISO or region standard (Vietnam Finance Newspaper, 2004).
Table 3: Vietnamese seafood exports, volume and value for selected years (Fisheries Ministry of Vietnam, 2002).
Target 1990 1995 2000 2001 2002 - Value (million US$) 205 550.1 1,478 1,777 2,023 - Export amount (MT) 49,332 127,700 291,922 358,833 458,658 By 2002 the total quantity export of seafood industry reached 459 thousand MT, valued at more than US$ 2 billion US$. The average growth rate of export value in the period from 1990 to 2002 is 21% annually. Vietnam plans to reach US$ 3 billion US$ of seafood export value in 2005 (Vietnam Finance Newspaper, 2004). The seafood products consist of both traditional items and new items. Traditional products are live, salted, iced, fermented, fish sauce and dried. Almost all these products are used to meet domestic demand. Meanwhile new products such as frozen, canned, value-added and ready to eat are mostly used for exporting. The seafood industry in Vietnam is today the third largest exporting industry in the country. It is followed by petroleum and textile and clothing exporting industries. But it has been one of the highest growth sectors and created many jobs, especially in rural areas.
UNU – Fisheries Training Programme 14

Nguyen
3.3 Export markets In the 1990s, the Japanese market was the dominating market for Vietnamese seafood exports. But in recent years the structure has changed profoundly. Vietnamese seafood exports are less dependent on a single market today than before. United States market share for Vietnamese seafood has increased rapidly, especially in the years since the implementation of the Bilateral Trade Agreement (BTA) between Vietnam and United States in 2001. Table 4 below shows the changes in the structure of the seafood export share of Vietnam.
Table 4: Vietnamese seafood export share, by import country, period 1997-2003 (Fisheries Ministry of Vietnam).
Market 1997 1998 1999 2000 2001 Dec.2003
Asia (ex. Japan) 31% 29% 29% 28% 27% 25% Europe 10% 11% 10% 5% 5% 4% USA 5% 10% 14% 20% 28% 32% Japan 50% 44% 41% 32% 26% 27% Others 4% 6% 7% 15% 14% 13% Total value, million US$ 761.5 818.0 938.9 1.478.6 1,777.5 2,022.8 The US market has the highest export share, which has increased constantly since 1997, after the establishment of diplomatic relations in 1995 and following the exchange of Ambassadors in May 1997. The United States market has become the most important for Vietnam replacing the Japanese market. However, Japan is still a target market for Vietnamese fish products. In contrast the export share into European market has fallen, which does not correlate with the increasing seafood export capacity of Vietnam. Although the total value has increased constantly year-by-year it has done so more slowly than other markets such United States and some Asian markets. As a result the export share into European markets has fallen. The Vietnamese government has set a target of export share into European countries as 10% of the total export value by 2010. The export share in value terms in the markets such as China, Taiwan and South Korea has also fallen in recent years. Two reasons for this are the increasing number of exports into the US market and the SARS disease. 3.4 Export items Frozen and fresh products are the main seafood export categories of Vietnam. There is only about 20%-30% value added products such as canned and ready to eat in the total export value as well as the export volume. Shrimp is the dominant commodity of seafood in single export items. Shrimp export value has accounted for approximately 50% of the total export value. Shrimp has a high price but it has also a risk in aquaculture. The share of each product category is shown in Table 5.
UNU – Fisheries Training Programme 15

Nguyen
Table 5: Fisheries exports in 2001 classified by products (Fisheries Ministry of Vietnam 2001).
Volume Value Items Tons Percent Million US$ Percent
Frozen shrimp/prawn 87,151.2 23% 777.8 44% Frozen finfish 74,093.1 20% 221.9 12% Dried squid 18,109.8 5% 153.8 9% Frozen Squids/Cuttlefish 21,069.7 6% 80.7 5% Tuna 14,475.7 4% 58.6 3% Molluscs/Crustacean 18,465.2 5% 49.5 3% Dried fish 12,906.8 3% 36.8 2% Others 129,219.3 34% 398.3 22% Total 375,490.7 100% 1,777.50 100%
From Table 5 we can see that by the year 2001 total export value of seafood reached US$ 1,778 million US$, in which frozen shrimp accounted for 44%, frozen finfish 12%, dried squid 9% and other fish accounted for 37%. Frozen finfish includes fresh water fish and marine fish. Catfish has a high percentage of the total export value and is included in the frozen finfish category. Other species include frozen octopus, crab, dried krill, lobster (slipper) and dried shrimp. 3.5 Raw material resources Historically, the Vietnamese seafood industry has been based on offshore fishing and catching in the mangrove areas of the Mekong Delta. Since the 1990s, the total area transferred from rice production to aquaculture production has increased year by year. The total area under aquaculture farming in the period 1996-2001 rose by almost 300% to 1.1 million ha in 2001. Today, 80% of raw material input of shrimp production in the south of the country comes from aquaculture shrimp farming. The Vietnamese government is expecting the total area for aquaculture farming to increase to more than 3 million ha by 2005 (Plan of Vietnam Fishery 2000-2010). Aquaculture farming and seafood processing are decisive sectors for the developing economy in the Mekong Delta.
Figure 5 : Map of the Mekong Delta, southern Vietnam (http://cantho.cool.ne.jp/mekong/mangrove/map.jpg).
UNU – Fisheries Training Programme 16
Nguyen
The Vietnamese fisheries sector is expected to increase its total landing volume up to 3.5 million tons by 2010 of which, the landing volume from aquaculture will account for about 60%. The average growth rate of export value is set to increase by 15-20% during period 2000-2010. It is estimated that the number of people in direct employment in the fisheries sector will be about 4.4 million in 2010 (Plan of Vietnam Fishery 2000-2010). 3.6 Summary Vietnam has huge potential to develop its fisheries sector in both marine capture and aquaculture. The fisheries sector has become a key industry in the Vietnamese economy. Seafood export value is in third position among export products of Vietnam. Aimed to create a sustainable fisheries structure of marine resources, promoting aquaculture is a priority in the development strategy of the fisheries sector. Shrimp products are the dominant export items, accounting for nearly 50% of total export value annually. Vietnamese export depends heavily on few markets such as United States, and Japan, especially in shrimp and tra and basa catfish. It is therefore necessary to diversify the export markets. Value added products account for a modest portion, about 20-30%, of the total export value annually. To gain high profits and meet the taste trends of consumers Vietnamese seafood exports need to improve the portion of value added products in total export items.
UNU – Fisheries Training Programme 17

Nguyen
4 OVERVIEW OF THE EUROPEAN SEAFOOD MARKET 4.1 European demographic and societal study
The European continent is bordered by the Atlantic Ocean, Mediterranean Sea, and Barents Sea. Fishing is a traditional form of work within many European countries. Seafood is a favourite product of many European people, especially people of the western part of the continent.
Figure 6: Map of Europe (http://www.graphicmaps.com/aatlas/world.htm)/
The European continent includes industrialised countries with good health and hygiene infrastructures, with universal primary education. People tend to have fewer children at a later stage in life and they tend to live longer (Maas 2004). The European continent consists of 45 countries with an approximate population of 860 million people in 2000and accounts for 14% of the world’s total population (World Bank). The population is expected to be stable over the next 10years.
Table 6: Population of the European continent (UN Population Division 2000).
2000 Est. 2010 Est. 2015 Countries Million Percent Million Percent Million Percent
EU members (15 countries) 377.3 44% 382.9 43% 383.7 43% New EU members (10 countries) 74.7 9% 73.6 8% 72.9 8% None - EU members 408.3 47% 424.7 48% 434.0 49% Total European continent 860.4 100% 881.3 100% 890.6 100% The European Union (EU) is made up of 15 countries. The current member states are Austria, Belgium, Denmark, Finland, France, Germany, Ireland, Italy, Luxembourg, The Netherlands, Portugal, Spain, Sweden and The United Kingdom. Ten other countries will be become official members of the EU in 2004. They are Cyprus, Czech Republic, Estonia, Hungary, Latvia, Lithuania, Malta, Poland, Slovakia, and Slovenia. These candidates include several Eastern European countries having a
UNU – Fisheries Training Programme 18

Nguyen
traditional trade relationship with Vietnam. Three applicant countries are Bulgaria, Romania and Turkey. These countries are negotiating to join the Union in the near future The population of Europe is very distinguished among countries. There are 9 countries with over 40 million people and there are some countries with only some thousand people such as Andorra, Faeroe Islands, Monaco, Liechtenstein and San Marino. Figure 7 shows the top 10 populated countries in Europe.
145,6
82,368,3 65,6 59,3 58,7 57,5
49,7 40,838,7
194,0
40
160
Millions people
180
200
60
80
100
120
140
0
20
Rus
sian
man
y
Turk
ey
hiop
ia
Fran
ce UK
Italy
rain
e
Spa
in
Pol
and
ther
s
Ger Et Uk O
Country
Figure 7: Population of the top 10 European countries (UN Population Division 2000).
The top 10 largest countries account for 80% of European population. The largest country is Russian with 145. 6 million, then Germany with 82 million, Turkey with 68 million, France with 59 million, United Kingdom with 58 million, Italy with 57 million, Ukraine with 49 million, Spain with 40 million, Poland with 38 million and
es more an the world average.
listed in Figure 7 have high income per capita and high quality standard of life. Countries such as United Kingdom, France, Italy, Spain and
nds have not onl h GNI p pita but also high tota ss Dom(GDP). Thes ssuran igh de or sea cause iene and safe ern in ped co . How untrie
nd, Norway, Ire Cypr high e inco well aonsumption per capita but these countries target s for se
rs.
Romania with 22 million (numbers in 2000). Europe is a prosperous and developed continent. Most European countries have Gross National Income (GNI) per capita higher than the average level of the world. The average GNI per capita of Europe is nearly 14,000 US$ per year, three timth Most of all the countries
Netherla y hig er ca l Gro estic Production e are a ces of h mand f food be of the raising hyg ty conc develo untries ever, co s such as Icela land or us have averag me as s high seafood c are not market afood exporte
UNU – Fisheries Training Programme 19
Nguyen
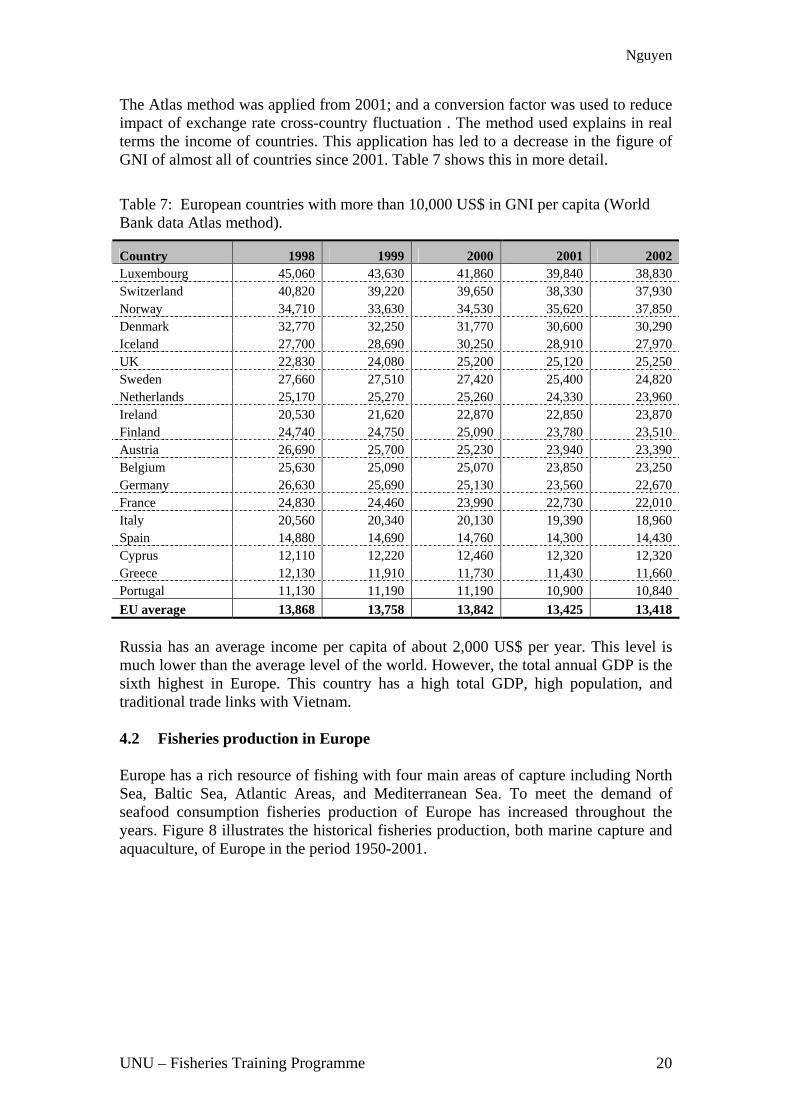
The Atlas method was a rom 20 d a con factor ed to r of exchange rate ountry ation . thod u lains
e income of countries. This application has led to a decre the fig almost all of countries since 2001. Table 7 shows this in m ail.
European coun th mor 0,000 GNI p ta (Woata Atlas method)
pplied f 01; an version was us educe impact cross-c fluctu The me sed exp in real terms th ase in ure of GNI of ore det
Table 7 d
: tries wi e than 1 US$ in er capi rld Bank .
Country 1998 1999 2000 2001 2002 Luxembourg 45,060 43,630 41,860 39,840 38,830 Switzerland 40,820 39,220 39,650 38,330 37,930 Norway 34,710 33,630 34,530 35,620 37,850 Denmark 32,770 32,250 31,770 30,600 30,290 Iceland 27,700 28,690 30,250 28,910 27,970 UK 22,830 24,080 25,200 25,120 25,250 Sweden 27,660 27,510 27,420 25,400 24,820 Netherlands 25,170 25,270 25,260 24,330 23,960 Ireland 20,530 21,620 22,870 22,850 23,870 Finland 24,740 24,750 25,090 23,780 23,510 Austr 26,690 25ia ,700 25,230 23,940 23,390 Belgium 25,630 25,090 25,070 23,850 23,250 Germany 26,630 25,690 25,130 23,560 22,670 France 24,830 24,460 23,990 22,730 22,010 Italy 20,560 20,340 20,130 19,390 18,960 Spain 14,880 14,690 14,760 14,300 14,430 Cyprus 12,110 12,220 12,460 12,320 12,320 Greece 12,130 11,910 11,730 11,430 11,660 Portugal 11,130 11,190 11,190 10,900 10,840 EU average 13,868 13,758 13,842 13,425 13,418 Russia has an average income per capita of about 2,000 US$ per year. This level is much lower than the average level of the world. However, the total annual GDP is the sixth highest in Europe. This country has a high total GDP, high population, and traditional trade links with Vietnam. 4.2 Fisheries production in Europe Europe has a rich resource of fishing with four main areas of capture including North Sea, Baltic Sea, Atlantic Areas, and Mediterranean Sea. To meet the demand of
nd ture, of Europe in the period 1950-2001.
seafood consumption fisheries production of Europe has increased throughout the years. Figure 8 illustrates the historical fisheries production, both marine capture aaquacul
UNU – Fisheries Training Programme 20

Nguyen
01948 1953 1958 1963 1968 1973 1978 1983 1988 1993 1998 2003
Year3
18
30
21
24
27
Millions
MT
15
6
9
12
Figure 8: Historical fisheries production of Europe in the period 1950-2001 (FAO 2001).
Total fisheries production of the European continent increased continuously between 1950 and 1975. Peak years of production were 1986, 1987, and 1988 with a total volume of about 24.5 million metric tons. However, the European portion of fisheries production when compared to the total world volume has decreased continuously from more than 30% in 1950s, 1960s, and 1970s to less than 20% in 1990s and 13% in 2001. The countries with rich marine resource have the highest volume of fishery production in Europe. These countries are Russia, Norway, Iceland, Denmark, Spain, France, UK, Faroe Islands.
Russian 20%
Norw ay 18%
Iceland 11%
20%13%
18%
11%
5%
3%
2%
Denmark 8%
Spain 8%
3%
3%France 5%
UK 5%
Faeroe 3%
Netherlands 3%
8%
8%
5%Italy 3%
Ireland 2%
Others 13%
volume production share of European countries in 2001, by
ountry.
s about 18 million tons. The countries
Figure 9: Fisheries c
In 2001, total fisheries production of Europe wawith highest quantity of marine capture are Russia with 3.6 million MT, Norway with 2.8 million MT, Iceland with 2 million MT, Denmark with 1.5 million MT, Spain with 1.1 million MT; and the UK, France, Faeroe Island, and Netherlands with over half a million MT each in 2001. These countries accounted for more than 80% of total capture in Europe.
UNU – Fisheries Training Programme 21

Nguyen
The aquaculture production of European countries has increased considerably since the late 1990s. The volume of aquaculture reached 2 million metric tons in 1999. However, the average growth rate for European aquaculture is 6.5%, which is much lower than average growth of 11.4% for the world in the period 1950-2001. European fisheries production still depends approximately 90% on natural resources, whilst the average of capture volume from total production is 66% for the world. The main countries in aquaculture are Norway with 512,000 MT, Spain with 312,000 MT, France with 252,000 MT, Italy with 221,000 MT, the UK with 170,000 MT, Greece with 97,000 MT, and Russia with 90,000 MT in 2001. These countries accounted for 80% of aquaculture production in Europe. Marine fish is the main type of fish in Europe and explains the importance of marine recourse for European countries. Table 8 shows the percentage of production by species.
able 8 : Fisheries volume production share of Europe, by species, in 2001 and 1950-
T2001.
Species 2001 Total 1950-2001 Demersal marine fish 39.8% 42.2% Pelagic marine fish 36.6% 38.3% Freshwater and diadromous fish 9.8% 4.9% Molluscs (excl.cephalopods) 6.3% 5.1% Crustaceans 2.4% 2.0% Others 5.1% 7.5% TOTAL, million MT 18.4 700.7 Ave ge percentage landing of marine fish accounts for more than 80% in the period 1950-2001. This percentage was 76% in 2001.
ra
t common species in Europe as they have direct Freshwater fish and molluscs are nocompetition with finfish and shrimp from tropical countries. Figure 10 shows the increase of freshwater fish production, including capture and aquaculture, of European countries in the period 1950-2001.
0
200
400
600
1948 1953 1958 1963 1968 1973 1978 1983 1988 1993 1998 2003
Year
80
1.000
1.200
0
Tne
s 2.000
1.400
1.600
1.800
hous
ands
to
igure 10: Increasing freshwater fish production by years (FAO 2001). F
UNU – Fisheries Training Programme 22

Nguyen
Freshwater fish production was stable in the 1950s with production less than one million MT, 1960s with 1-1.3 million MT, 1970s and 1980s with 1.3-1.8 million MT. The peak of 1.85 million MT in 1987 dropped to 1.59 million MT in 1988. In the last three years between 1999-2002 the landing volume has stabilised around 1.8 million per year. The dropping of the landing volume between 1989-1994 from 1.7 million MT to 1.3 million is probably a result of the changing political situation of Former Soviet Union (USSR area). The increase of freshwater fish production has led to increase competition of this species in markets and reflects the acceptance of this species from consumers. 4.3 Trade and consumption of fish and fish products in Europe
rt fishery commodities 4.3.1 Expo In the period 1992-2001, European countries exported fishery commodities valued from 15 to 19 billion US$ annually. In volume terms, the total quantity of exporting commodities amounts to between 8 and 11 million MT. The peak volume reached 11.1 million MT in 2001. Export value has increased rapidly since the 1990s, but almost all fisheries products are traded within European continent.
15
18
21Billions $US
0
3
6
9
12
1975 1978 1981 1984 1987 1990 1993 1996 1999 2002
Year
Figure 11: Export value of fishery commodities in Europe from 1976-2001 (FAO 2001). Figure 11 illustrates that the export value of fish commodities has increased strongly n the period 1i 976-1996. This increase can be explained by the increase of quantity
and price. Between 1976-2001 the export quantity increased by more than 3 times; and average growth was 4.5% annually. Meanwhile the export value has increased nearly 7 times; the average growth is 7.5% annually in the same period.
UNU – Fisheries Training Programme 23

Nguyen
50%
60% % change in CPI
% change in export value
-10%
0%
1990 1992
10%
20%
30%
40%
1994 6 19 0 20199 98 200 02
% change in export quantity
Figure 12: Change in CPI, expor um d exp valu the 1 U sta in %
creasing price is an important factor affecting the increasing export value. The
antity export increased constantly, export value as increased at a lower rate and has fluctuated more. Export value has increased by
recent years the increase in export volume has been a major factor in the increase in
. Yet the export value increased only by a factor of 1.1 times and the average annual growth was 1.5%. The lowe ease tal v compared to
shows tha peti fie the et an incre deman Europe ntin t is le t clud irectly the e
as decrease ing erio entry of products from counChina, Ind aila d so mer oun uch U State
o a po exp ry . Th lt is expor coun as Norway, Denmark, Russia, Spain, Icel re fa ith
tion.
ort items e co itie ood on-f he fo mmoor more th 0% o total ort vo . Fish products are main exp
dities. Cru ns a ollu odu coun just a perceort comm .
t vol e an ort e of 5 E tes , 1991-2001.
Inincrease in price can be explained by increasing demand and inflation. The change in price was measured by the Consumer Price Index (CPI). Figure 12 shows the change in CPI, export value and export quantity of fish commodities of the 15 members of the EU.. As Figure 12 shows, although quh2.9% yearly while export quantity has increased annually by 3.9% yearly between 1991-2001. The average increase of the CPI in the period 1991-2001 is 2.2%. Export value increased annually by 0.7% more than inflation, showing a real increase in price. Inexport value. Table 9 illustrates clearly this influence. In the period between 1995-2001, the export volume increased by a factor of 1.2 times and the average annual growth was 2.7%
r incr in to alue quantity t com tion is rcer in mark d the asing nd of seafood i an co ent. I possib o con e ind that xport price h d dur the p d. The Asian tries such as ia, Th nd an me A ican c tries s nited s and Chile is als ssible lanato factor e resu that ters in tries such and and a ced w more competi The exp includ mmod s for f and n ood. T od co dities account f an 8 f the exp lume ort commo stacea nd m scs pr cts ac t for few nt in total exp odities
UNU – Fisheries Training Programme 24

Nguyen
Table 9: Export volume by main groups from Europe, 1995-2001, 1,000 MT (FAO 2001).
Commodity 1995 1996 1997 1998 1999 2000 2001 Fish, fresh, chilled or frozen 5,649 6,133 6,448 6,145 6,326 6,536 6,930 Meals 1,075 1,096 1,034 1,077 1,151 1,102 1,101 Crustaceans and molluscs 537 672 690 686 740 792 771 Fish, canned 542 599 689 718 665 726 761 Inedible 299 377 447 445 310 475 492 Fish, dried, salted, or smoked 453 472 500 477 460 445 448 Oils 430 404 367 263 296 308 300 Crustaceans molluscs, canned 144 153 159 159 170 175 196 Sponges, corals, etc. 39 44 60 35 30 26 37 Aquatic plants 11 14 14 15 15 16 20 Total 9,180 9,966 10,408 10,020 10,163 10,603 11,055
mackerel, salmon, capelin and cod. The value added products such canned, ready to
having surplus trade from fisheries. Table 10 shows the 10 countries having highest export value.
Table 10: Fish products export value from Europe, by country, 1995-2001, in million S$ (FAO 2001).
Country 1995 1996 1997 1998 1999 2000 2001
Fresh and frozen fish dominates export commodities, accounting for more than 60%of total export volume. The species with highest export value in total are herring,
eat fish account for a modest portion. The countries that have high production also have high export value. However some countries export essential raw material and then import high processed products. There are some countries such as Norway, Denmark, and Iceland mainly
Norway 3,140 3,434 3,422 3,683 3,781 3,550 3,385 Denmark 2,471 2,715 2,670 2,915 2,891 2,766 2,677 Spain 1,208 1,472 1,494 1,552 1,619 1,617 1,863 Russian 1,635 1,686 1,356 1,147 1,218 1,390 1,530 Netherlands 1,464 1,489 1,435 1,374 1,755 1,352 1,430 UK 1,209 1,316 1,280 1,564 1,439 1,270 1,319 Iceland 1,343 1,426 1,361 1,437 1,383 1,237 1,280 Germany 907 1,065 987 1,063 975 1,111 1,047 France 1,002 1,016 1,109 1,112 1,120 1,109 1,034 Belgium 371 393 442 485 455 479 527 Others 2,533 2,807 2,701 2,828 2,876 2,828 3,091 Subtotal 17,284 18,819 18,256 19,158 19,513 18,709 19,184
UNU – Fisheries Training Programme 25

Nguyen
Norway is one of the largest fishing countries in the world with annual export value of more than 3 billion US$. Following, this are Denmark with an export value of more than 2 billion US$ and Spain, Russia, Netherlands, United Kingdom, Iceland, Germany and France with export value worth more than 1 billion US$ annually each. 4.3.2 Import of fishery commodities United States, Japan and the European Union are the biggest importers of seafood in the world. These countries import fish commodities for about 45 billion US$ annually, accounting for nearly 80% of the total import value in the world. Total import value of fishery commodities in European continent has increased year by year. In 1998 the total import value reached its peak point with more than 23 billion $ worth of fish being imported in the EU.
01975 1978 1981 1984 1987 1990 1993 1996 1999 2002
3
6
9
12
Billions $US
Year
27
15
18
21
24
Figure 13: Historical import value of fishery commodities into Europe, 1976-2001.
import value in 2 than 6.5 t hi tha 19 d t era nu
hile the import quantity has increased 2.7 times the growth is 3.9% during th . T ore y cl tha
the period is a or nc port value.
The import value of fish products increased between 1976-2001. The total
001 is more imes gher n in 76 an he av ge an al growth is 7.5%. Meanw and e averag e same period heref it ma be con uded t the increasing price in the m in fact influe ing im
UNU – Fisheries Training Programme 26

Nguyen
% change in CPI% change in import value% change in import quantity
25%
30%
35%
-15%
-10%
20%
990 1991 1992 199 5 199 8 19 00 200-5%10%
5%
10%
15%
1993 4 199 1996 7 199 99 20 2001 2
Figure 14: Change in mport value, a por e of 5 E s i
4 shows the c e in C imp alue imp antit fishities of the 15 ember states 1-2 oth tity import fluc in this period. This reveals the fluctuation in demahe increase as th n f im lu
ort every type of fishery commodities including food and non- into Europe was used uropean import.
1
CPI, i nd im t volum the 1 U state n %, 1991-2001.
Figure 1 hang PI, ort v and ort qu y of ery commod
uated EU m in the period 199 001. B quan
d of and
value ofgoods. T
tin CPI w
ngreater an the i crease o port va e.
In the period between 1991-2001 the average increase of CPI is 2.2%, 1.8% of the import value, and 2.5% of import quantity of the EU. The import price of fishery commodities decreased by 0.4% because of increasing supply. European countries impfood items. About 80% volume import of fishery commoditiesor food consumption. Fresh and frozen fish are dominating in Ef
Table 11: Import volume by main group, 1995-2001, 1,000 MT (FAO 2001).
Commodity 1995 1996 1997 1998 1999 2000 200Fish, fresh, chilled or frozen 3,993 4,393 4,710 4,995 4,918 5,049 5,477 Meals 1,601 1,458 1,562 1,303 1,482 1,656 1,578 Crustaceans and molluscs 1,069 1,123 1,175 1,299 1,365 1,393 1,520 Fish, canned 828 939 1,102 1,183 1,084 1,189 1,228 Inedible 428 493 665 840 675 837 851 Oils 784 554 563 360 497 518 531 Fish, dried, salted, or smoked 355 391 381 362 350 341 349 Crustaceans and molluscs, canned 188 195 194 201 204 226 234 Aquatic plants 79 68 70 69 73 72 69 Sponges, corals, etc. 48 55 56 49 47 47 45 TOTAL 9,373 9,669 10,476 10,662 10,695 11,328 11,882 In 2001, European countries imported 11.8 million MT of fishery commodities of which fresh, chilled or frozen fish accounted for 46% and fresh and frozen crustacean and molluscs accounted for only 13%. Value added products only had a modest share of European import.
UNU – Fisheries Training Programme 27

Nguyen
The most developed and biggest countries in Europe usually have the highest iof fishery products. They are Spain, France, Italy, the UK, Denmark, Belgium
mport , and
ands. Table 12 shows the 10 countr ving the h t import value in
op 10 importers of fishery comm in Europ -2001 in001).
ately 23.4 billion US$ with Spain, France
ver red meat
4.3.3.1 The supply of fish products for Eur
ces of supply of seafo clude stic production and imports.nt supply in Table 13 ( ) _wa ulated esourc produc
s and adjusting st ange.
1995 1996 199 998 1 2000
Netherl ies ha ighesEurope.
Table 12: T odities e, 1995 US$ million (FAO 2
Country 7 1 999 2001Spain 3,119 3,152 3, 3,560 3,372 42 083 3,306 3,7France 3,256 3,228 3,09 3,538 3,018 95 1 3,318 3,0Italy 2,309 2,620 2,59 2,834 2,555 39 8 2,749 2,7Germany 2,504 2,567 2,385 2,649 2,309 2,282 2,375
he import value in 2001 reached approxim
United Kingdom 1,934 2,076 2,169 2,410 2,306 2,210 2,268 Denmark 1,622 1,668 1,586 1,775 1,832 1,860 1,791 Netherlands 1,200 1,148 1,114 1,239 1,314 1,172 1,242 Belgium 1,041 973 985 1,068 1,075 1,039 1,008 Portugal 764 785 752 930 1,020 863 939 Sweden 546 590 595 639 718 712 735 Others 2,687 3,072 3,126 3,349 2,952 2,989 3,418 TOTAL 20,983 21,877 21,485 23,990 22,900 22,073 23,352
Tand Italy being the largest importers. European Union countries are the biggest importers of fishery commodities in Europe. This group imports fishery products of a value of about 20 billion US$ annually, accounting for 90% of European imports and 34% of world imports. 4.3.3 The supply and consumption of fish products in Europe Seafood is acknowledged as a healthy product. The most developed countries have the highest consumption utilisation of seafood. In all major European countries, the consumption of seafood is increasing. The reason for this increase is the raised oncern in healthy eating and lifestyle patterns, the recent scares oc
consumption and the increased added value opportunities for fish products due to demographic and societal changes (Hardy 2001).
ope
Resour od in dome The appare below s calc by r e of tion, imports, export ock ch
UNU – Fisheries Training Programme 28

Nguyen
Table 13: Apparent European seafood consumption, in 1,000 MT (FAO 2001).
Target 1992 1997 2001 Production 19,085 17,555 17,215 Imports 15,168 19,482 19,944 Exports 11,747 16,332 16,411 Stock change 63 202 231 Apparent supply 22,569 20,907 20,979 Non food consumption 9,104 6,000 6,269 Food consumption 13,465 14,907 14,681 Per capita (kg) 18.6 20.5 20.2 % net import in supply 15% 15% 17% Total domestic supply of fish products in European countries is more than 20 milliometric tons annually. In which there are approximately 17 million metric tons frodomestic production, 19 millio
n m
n metric tons from import and 16 million metric tons for export. The total supply of fish and se on and non-food con such as feed , wast other In the ears t al
of fish and fish products has slightly sed du reduc n nonption. The net import of d in t pply grow ith 17
The percentage of food-co tion i supp 65% 97 anased to more than 70% in 20
ndence of the 15 EU m r stat ported seafood is still growing. now account for almost 60% of all se d cons in the The m
is the difficulty of the sup of raw materials that the processing industry n term of price, volume, regulation and presen n. This has led t
increase in export non-EU countries. The EU ntries er markets for seafo porter orldw
products to Europe, period 1997-2001, 1,000 MT
afood is used for food consumptisumption , seed e and uses. later y he tot
supply decrea e to a tion i -food consum seafoo otal su is still ing w % in 2001. nsump n total ly was in 19 d has incre 01. The depe embe es on imImports afoo umed EU. ain reason ply faces i tatio o a progressive from cou are becoming larg od ex s in w ide. The countries that have a high supply of fisheries products also have high seafood consumption and high import or high production of fisheries products. Table 14 shows 10 countries that have the highest fish and fish products supply.
able 14: Top 10 suppliers of fish T(FAO 2001).
Total supply of fish, seafood Country 1997 1998 1999 2000 2001
Russia 4,363 3,895 4,018 3,693 3,668 Spain 2,324 2,469 2,364 2,364 2,364 United Kingdom 2,611 2,309 2,254 2,254 2,254 France 2,243 2,371 2,151 2,151 2,151 Italy 1,745 1,701 1,746 1,746 1,746 Germany 1,303 1,419 1,289 1,289 1,289 Norway 1,593 1,401 1,176 1,176 1,176 Portugal 689 694 855 855 855 Denmark 754 585 479 479 479 Ukraine 480 694 550 345 699 Other countries 4,447 4,521 4,226 4,238 4,280 Total Europe 22,552 22,059 21,108 20,590 20,961
UNU – Fisheries Training Programme 29

Nguyen
The countries leading the supply of fish products are Russia, Spain, the UKItaly, Germany, and Norway. The total supply of fish and seafood in thcountries accounted for approximately 80% of the s
, France, e top 10
upply in Europe. Obviously, these countries have led in food-utilisation of fish and seafood as well. The countries with a fish consumption of more than 1 million m tons ear are Russia, F ,
Italy, the UK, and Germany. The annual and s d cons tion inountries in Europe is84% wi ntries accou for 16
Utilisation of fish products
n countries use nearly 14 m metri s of fi d seaf or huption annually, including fres and v s fish ucts.
5: Domestic utilisation of fis ducts i 10 Eu an cou , 1997, 1,000 MT (FAO 2001).
etric per y ranceSpain, fish eafoo ump the top 10 c th the rest of cou only nting %. 4.3.3.2 Europea illion c ton sh an ood f man consum h fish ariou prod
Table 1 h pro n top rope ntries -2001
Domestic Utilisation produ of fish cts Country 1997 1998 1999 2000 200 1
Russia 3,39 3,2 2, 2 21 57 876 ,827 ,675 France 1,75 1,9 1, 1 16 13 850 ,850 ,850 Spain 1,67 1,8 1, 1 12 50 783 ,783 ,783 Italy 1,34 1,4 1, 1 14 10 418 ,418 ,418 United Kingdom 1,31 1,2 1, 1 12 78 290 ,290 ,290 Germany 1,21 1,2 1, 10 62 193 ,193 1193 Portugal 58 62 19 763 763 763 Ukraine 48 60 93 550 647 652 Poland 534 479 472 506 506 Netherlands 247 354 327 327 327 Other countries 2,307 2,356 2,279 2,300 2,223 Total Europe 14,835 15,471 14,801 14,904 14,680 Except Russia, the top 10 countries in Table 15 always have a deficit in fish and seafood trade. It means these countries usually import more seafood than they export. The deficit in fish and seafood trade of Europe is more than 3 million metric tons of various fish products annually.
UNU – Fisheries Training Programme 30

Nguyen
Table 16: Average utilisation of fish products per capita in top 20 European countries, 1997-2001, kg/person/year (FAO 2001).
Utilisation fish. seafood per capita Country 1997 1998 1999 2000 2001
Iceland 93.5 94.5 91.4 90.7 90.1 Portugal 58.5 62.1 76.4 76.2 76.1 Norway 51.4 53.7 51.5 51.2 51.0 Spain 42.0 46.4 44.7 44.7 44.7 Malta 39.8 36.9 38.7 37.8 37.6 Finland 34.7 33.6 32.4 32.1 32.1 France 30.0 32.5 31.3 31.2 31.1 Sweden 30.2 30.1 30.9 30.9 30.9 Denmark 24.8 26.6 26.7 26.6 26.5 Greece 27.3 25.5 25.1 25.1 25.1 Italy 23.4 24.5 24.6 24.6 24.7 United Kingdom 22.2 21.5 21.7 21.6 21.6 Belgium-Luxembourg 20.4 21.5 21.6 21.6 21.6 Lithuania 24.3 21.5 20.2 20.3 20.3 Estonia 19.3 18.2 21.6 21.8 22.1 Russian Federation 23.0 22.2 19.7 19.4 18.5 Netherlands 15.8 22.5 20.7 20.6 20.5 Switzerl nd a 17.9 18.3 18.8 18.8 18.8 Latvia 13.8 12.7 17.2 19.5 19.5 Ireland 15.1 16.6 16.2 16.0 15.9 Average Europe 20.2 20.7 20.8 21.0 21.0 Average consumption of fish and seafood per capita of European people is more than 20 kg/year (FAO 2001). This number is much higher than the average of15kg for the world as a whole. In general Western European countries prefer seafood to Eastern European countries. Table 16 illustrates the top twenty countries with highest average onsumption of fish and seafood per capita in Europe. But this does not mean that
these countries are big markets for exporters. For example, Iceland and Norway has a very high average consumption per capita but these countries are also big exporters of fish and seafood. Moreover, these countries have a small population making them less lucrative as export markets for other countries. 4.4 Lifestyle and demographic trends in Europe Europe is a developed continent, especially EU member countries. Healthy eating is a top concern for citizens of developed countries. Seafood and fish are acknowledged to offer many health benefits. It provides a major source of protein, does not make heart disease like red meat. This has led to a decline in the consumption of red meat in many key markets and seafood and fish have stepped into the gap. Red meat consumption continues to fall and the interest as healthy lifestyles increases. In addition, the population in Europe is aging constantly. The average life expectancy is now substantially longer than previously. One of the most fundamental requirements of older consumers is a healthy diet, for this reason, fish has much to offer as a natural food with substantial nutritional benefits (Hardy 2001).
c
UNU – Fisheries Training Programme 31
Nguyen
Though fresh fish at one time dominated European market, this is now changinThere are many changes of demography and society in developed countrie
g. s.
onsumers are spending less time in the kitchen preparing food; there are mmaller households and individual tastes; hectic lifestyles are g aumbers f wo are gro ing. Th an incr sed sup
prepared meals. These also require the offering of more flexible snack units (Hardy 2 T gnifican many Euro k owards increased c fish rea lsprepared products. The result being that there is greater penetration of part or secondary processed fresh fish, such as fillets, steaks and other portions in the market t t ditionall he consump .
t markets o
s study potential targe t er to do this rkets by countries were analysed and sorted. The criteria used to do this are total
n, import v s, deficit e, and growth f fish com such as popul on per capita of consum r analysis poten k
. et and pote
hile consumption, import value and deficits in trade of seafood are the most clear
n per capita are closely related.. The rowth of import and consumption do not explain by themselves the size of markets. able 17 shows main criteria for choosing target markets.
C any s increasin nd the n o rking women w is has led to ea ply of
001).
here is a si t drive throughout pean mar ets tonsumption of added-value products such as dy mea and fish delicatessen
ha have tra y been dominated by t tion of whole fish 4.5 Targe for exp rters The aim of thi is to discover t marke s. In ordmaconsumptio alue of fish commoditie s of seafood tradin import o modities. Criteria ation, consumptiand growth ption we e used to tial mar ets. 4.5 1 Targ ntial markets Wsigns of potential target markets; population, growth of import, growth of consumption and consumption per capita are criteria for reference. The total consumption, total population and consumptiogT
UNU – Fisheries Training Programme 32

Nguyen
Table 17: Main criteria for choosing target markets sorted by country (FAO 2001).
To tal import Deficit of trade, Total Co t Value Country un ry Import-Export, Country consumption 2001,1,000US$ 2001, 1,000US$ 2001,1000 MT 1 Spain 3,741,775 Italy 2,351,505 Russian 2,675 2 France 3,094,568 France 2,060,247 France 1,850 3 Italy 2,738,876 Spain 1,878,508 Spain 1,783 4 Germany 2,375,324 Germany 1,328,740 Italy 1,418 5 UK 2,268,430 UK 949,227 UK 1,290 6 Den rma k 1,791,200 Portugal 662,540 Germany 1,193 7 Neth aerl nds 1,241,580 Benelux 526,026 Portugal 763 8 Be x nelu 1,070,942 Switzerland 367,042 Ukraine 652 9 Po lrtuga 939,410 Sweden 219,955 Poland 506
10 Sw 735,259 Austria 173,975 Netherlandseden 327 11 Norway 667,882 Poland 123,154 Sweden 273 12 Poland 369,919 Finland 122,258 Greece 266 13 Sw litzer and 369,606 Greece 100,539 Benelux 231 14 Russian 350,043 Belarus 82,436 Norway 229 15 Greece 313,100 Czech Republic 56,974 Finland 166 16 Au stria 182,533 Ukraine 50,096 Denmark 141 17 Fin 136,838 Hungary 43,927 Switzerlandland 135 18 Ire land 128,062 Serbia&Mont 35,907 Czech Republic 130 19 Belarus 98,049 Romania 34,534 Austria 117 20 Lithuania 92,244 Lithuania 31,097 Lithuania 75 In Tab 7 he total consumption colum the total quantity of fish products for fo u , import value and deficit of trade are the total values of ommodities used for both food and non-food.
he total import value explains the size of the market so it is the most important
the countries that have high import; high deficit of trade and high total onsumption should be targeted as potential markets for exporters. According to
are different.
le 1 , while t n isod tilisation
c Tcriteria to determine the target market. Following this are deficit of trade and total consumption. Deficit of trade, export value minus import value, should be given a higher priority in level than the total consumption. Some countries such as Russia and Norway have high total consumption but they are not only self-sufficient but also big export countries. In general cTable 17, target markets are Spain, France, Italy, Germany, United Kingdom, Belgium and Luxembourg, Portugal, Sweden and Switzerland. The priority levels of these markets Based on the results in Table 17 and the population of each country, the target market and level of priority were calculated and the results are shown in Table 18. Pointed method by different level of priority was used to calculate score column in Table 18.
UNU – Fisheries Training Programme 33

Nguyen
Table 18: Target markets and priority level by countries.
Country Score Level 1 France 206 A 2 Spain 202 A 3 Italy 198 A 4 Germany 183 A 5 UK 175 A 6 Portugal 137 A 7 Benelux 130 A 8 Sweden 112 B 9 Poland 110 B
10 Netherlands 102 B 11 Russian 94 B 12 Switzerland 85 B 13 Denmark 84 B 14 Greece 80 B 15 Norway 63 C 16 Austria 62 C 17 Finland 57 C 18 Ukraine 40 C 19 Belarus 35 C 20 Czech Republic 29 C 21 Romania 17 C 22 Serbia & Montenegro 16 C 23 Ireland 15 C 24 Hungary 15 C 25 Lithuania 8 C
The sc as calculated on Table 17 and the population colum
able b ry criterion wa ed depending on the level of priority.
e. Vietnamese exporters need arkets such as France, Spain, Germany, United Kingdom
and Italy. The markets at level B are not as interesting as markets at level A. These markets, on the other hand, can be exploited in future, especially Russia, Poland, Sweden and Switzerland. Some markets at level C such as Ukraine, Belarus, Czech Republic, Hungary and Romania are traditional markets of Vietnam. They had a close relationship with Vietnam before the collapse of the Soviet Union. Vietnamese exporters have a good knowledge of these markets. It is necessary to think and prepare right now for entrance into other markets.
ore19
column welow. Eve
based s point
n of T As shown by Table 18 the top eight countries are France, Spain, Italy, Germany, the UK, Portugal, Belgium and Luxembourg with the biggest potential for the entrance of seafood exporters. Vietnamese seafood exporters have been present in these markets but with a low market share. Belgium and Luxembourg markets have are the biggest
arkets presently for Vietnamese exporters into Europmsupport to enter the big m
UNU – Fisheries Training Programme 34
Nguyen
Table 19: Growth rate, population and consumption per capita of selected markets AO 2001).
(F
Growth Growth Population Consumption Country of import Consumption (million people) per capita 1995-2001 2001 2001 1997- 2001 , kg/year
1 Russian %0.20 -4.60% 144.9 18.5 2 Germany %-0.80 -0.30% 82.3 14.5 3 France .70% .5 -0 1.00% 59 31.1 4 KU .30% - 8.9 22 0.30% 5 1.6 5 Italy .50% 57.5 22 1.10% 4.7 6 Ukraine 0% 49.3 1-9.5 6.30% 3.3 7 Spain % 1 40.9 42.60 .30% 4.7 8 Poland -1 .7 19.90% .10% 38 3.1 9 Romania 5. 22.4 11.90% 70% 2.4
10 Netherlan 50% 5.8 16 20ds 0. 0% .5 11 Greece -1.6 255.30% 0% 10.9 .1 12 Benelux -0.50% 1.4 .7 210% 10 .6 13 Serbia and r 00% -6.7 .5 2. Monteneg o 9. 0% 10 3 14 Czech Rep 70% -0.6 0.3 12ublic 0. 0% 1 .7 15 Portugal 00% 5.6 10 763. 0% .1 16 Belarus .80% -11.2 10 6.13 0% 4 17 Hungary 00% 0. 10 4.1. 50% 4 18 Sweden 30% 0. 8.9 304. 40% .9 19 Austria 0% 0. 8.1 14-0.4 30% .5 20 Switzerlan 0% 1. 18d -1.9 10% 7.2 .8 21 Denmark 40% 1. 261. 50% 5.3 .5 22 Finland 50% -1. 5.2 322. 40% .1 23 Norway 40% 0. 4.5 54. 20% 1 24 Ireland 4.30% 1.70% 3.9 15.9 25 Lithuania 16.80% -3.60% 3.5 20.3
Table 19 is useful for more than just a reference. The countries listed in the A group have both high consumption of fish per capita and large population and are therefore stable consumers of fish products. The information of the twenty-five markets shown in Tables 18 and 19 was used as a eference. The truly target markets should be combined with other criterir a. However
Table 18 is good to select target and potential markets.
UNU – Fisheries Training Programme 35

Nguyen
4.5.2 Competitors inside Europe
Table 20: European big exporters, selected by country (FAO 2001).
Exp Surp ade Gr ort lus of tr owth of Country Val Countr Export-Import Eue y Country xport 1,00 1, (00$ 000US$ 1-95) 1 Norway 3,385 Norway ,263 2,717,381 Romania 58% 2 Denmark 2,676,6 Iceland 74 1,215,228 Belarus 39% 3 Spain 1,863 Russian ,267 1,180,198 Malta 20% 4 Russian 1,53 Denmark 885,474 Greece 15%0,241 5 Netherlands 1,430,415 Ireland 293,904 Albania 10% 6 UK 1,319,203 Netherlands 188,835 Spain 10% 7 Iceland 1,280,499 Estonia 83,558 Latvia 9% 8 Germany 1,046,584 Latvia 60,611 Benelux 7% 9 France 1,034,321 Albania 1,660 Estonia 6%
10 Benelux 544,916 Croatia -1,268 Lithuania 6% 11 Sweden 515,304 Moldova -8,497 Slovenia 5% 12 Ireland 421,966 Bulgaria -8,621 Finland 5% 13 Italy 387,371 Malta -9,776 Croatia 4% 14 Portugal 276,870 Bosnia -15,579 Iceland 4% 15 Poland 246,765 Slovenia -22,573 Norway 3% 16 Greece 212,561 Slovakia -31,025 Sweden 3% 17 Estonia 128,278 Lithuania -31,097 Germany 2%
L18 atvia 106,535 Romania -34,534 United Kingdom 2% C19 roatia 64,138 Serbia -35,907 Hungary 2%
20 Lithuania 61,147 Hungary -43,927 Italy 2%
he export cT olumn explains the market share of the exporting country. The surplus of
which could become strong competitors in the future, are Romania,
able 21 shows the production of fish products in these countries.
trade column shows the strength of the seafood exporter, this emphasises whether the fishery export is important of the country or not. The growth column is calculated by export quantity. This column reveals which countries are potential competitors for Vietnam. However, countries with high export growth are not strong and potential competitors because this depends on the quantity that the country is available to xport. Based on Table 20 the competitors may be determined as follows: e
Norway, Iceland, Russia, Denmark, Ireland, Spain, Netherlands and Estonia.
he countries, TBelarus, Malta, Faroe Islands, Greece and Albania. However the strongest competitors to Vietnamese exporters are countries out of Europe. They are China, Thailand, Chile, Mexico, India, Bangladesh, and United
tates. TS
UNU – Fisheries Training Programme 36

Nguyen
Ta le 21: Fishery production of competitb ors, by selected years, 1,000 MT (FAO 2001).
Country 1980 1985 1990 1995 2000 2001 China 5,807 8,789 14,667 32,731 49,636 51,006 India 2,445 2,839 3,880 5,017 5,785 6,065 United States 3,872 5,043 5,936 5,712 5,216 5,443 Chile 2,893 4,987 5,424 7,890 4,973 4,663 Thailand 1,800 2,233 2,790 3,591 3,643 3,606 Bangladesh 647 766 846 1,109 1,661 1,687 Mexico 1,285 1,256 1,447 1,405 1,404 1,522 Total 18,749 25,915 34,990 57,455 72,317 73,992 China has been the biggest country in fishery production in recent years. Total
roduction of fisheries reached top 51 billion MT in 2001, accounting for 36 % of
0% for European Union countries. European countries
ce, Spain, Italy, Germany, the UK, Portugal, , and Luxembourg. The markets such as Sweden, Poland, Netherlands,
Switzerland, Denmark, Greece, and Russia have potential to be penetrated in the future. The strong export countries into European are Thailand, India, Bangladesh, the US, China, Mexico, and Chile.
worldwide production. The average growth rate of production of this country is 10. 5% in the period 1980-2001. Annual fishery production volume of United States is more than 5 billion MT, more than 4 billion MT for Chile, and more than 1 billion MT for Mexico. India, Bangladesh, and Thailand are developing countries with impressive growth in recent years. The growth rate is around 4% in the period 1980-2001 in these countries. These are strong competitors of Vietnam, especially in shrimp products. See Table 21 for
ore detail. m 4.6 Summary Norway, Denmark, Iceland, the Faroe Islands and Russia are big countries in fishery production. European markets consume a huge amount of seafood products, about 14 million MT of fish and fish products annually. Consumption of seafood per capita of European people is more 20 kg per year. Import supply accounts for 17% total seafood supply in
e whole of Europe, with 6thimport seafood worth more than 20 billion US$ annually. Fresh and frozen seafood products are the most items imported into Europe both in volume and value terms. Value added products are a new trend in seafood consumption.
he target markets for exporters are FranTBelgium
UNU – Fisheries Training Programme 37

Nguyen
5 UROPEAN SHRIMP MARKEE T
This chapter examines current market trends in European shrimp markets to discover p
nd ing Japanese markets in value terms in recent years. In 2001, import value in
S% of shrimp in US markets was 3.7 billion US$, 3.6 billion US$ in Europe, and
here are two forms of shrimp commodities imported into European countries: fresh oked and
cons of se s in Eur Jo t ) n r hntries mo ha 0. re su tia tra op traorts f Iceland and N ay he ian d n erican ropic hrim a sup er o uro n m ets rece
especially Thailand, China, India, and Ecuador.
hern
gium, and Germany.
the potential markets for exporters. Europe accounts for about one third of shrimimport in value terms, almost equalling in importance the US shrimp markets aovercomU2.7 billion US$ in Japan. The term ‘shrimp’ and ‘prawn’ have different meanings depending on the markets. Frequently these two terms are used interchangeably. In many markets ‘prawn’ refers to large marine shrimp. In most cases, freshwater shrimp (or prawns) are normally sold as ‘prawns’. In some cases, the Norway lobster Nephrops norveginus is referred to as a ‘prawns’ (Anderson 2003). Tand frozen shrimp, and cooked and peeled shrimp. Traditionally the copeeled form is mainly for consumption, but in recent years there have been increased
umption lf-on hrimp ope ( supei 1999 . The umbe of s rimp supplying cou is re t n 10 The is bstan l in -Eur ean de, especially imp rom orw . T As an Lati Amcountries with t al s p are the m jor pli f E pea ark in nt years, European countries are more heterogeneous in their imports. Europe can be separated into north and south when it comes to shrimp. Northern countries usually consume small, coldwater shrimp. Southern or Mediterranean markets prefer larger, warm water prawns (Anderson 2003). Germany, the Netherlands, and Belgium purchase native brown common shrimp of Cragon Cragon, while the UK and France tend to purchase northern prawn of Pandalus borealis. Colder water shrimp are largely captured for domestic demand, Greenland and Faroe Islands export to nortEurope, and Argentina to southern Europe. Ecuador is one of the main suppliers to northern European countries. The countries with highest production and export shrimp in Europe are Norway, Iceland, the Faroe Islands, and Russia. The markets with high demand in shrimp are Spain, Denmark, the UK, France, Italy, the Netherlands, BelThese countries imported 477,000 MT in 2001, accounting for 71% of the total import quantity of Europe. Equivalently 3.1 billion US$ on 87% of the total import shrimp to Europe in value terms.
UNU – Fisheries Training Programme 38

Nguyen
5.1 European shrimp production
0
30
60
90
120
150
180
210
240
270
300
1950 1955 1960 1965 1970 1975 1980 1985 1990 1995 2000 2005
1000
MT
year
Figure 15 : Historical shrimp production in Europe in the period 1950-2001 (FAO
001).
catches is 2.7% in the period between 1980-2001.
1980-2001 is 2.7% which is also lower than the worldwide average of 4.2%.
2
European shrimp production has expanded very impressively during the past few decades. In 2001 total catches reached 239,000 MT, nearly two times the catches in 1980. The growth rate of shrimp Despite the strong expansion, European shrimp production continues to be a small fraction of world shrimp production. In the past decade the share of European shrimp production in total production was between 6 to 7 %. In 2001, the fraction is 6%. Moreover, the average growth rate of shrimp production of Europe in the period between
Table 22: European shrimp production by species, 1,000 MT (FAO 2001).
Species 1992 1993 1994 1995 1996 1997 1998 1999 2000 2001 Northern prawn 138 148 140 156 175 161 165 171 182 164 Common shrimp 26 27 32 31 32 38 31 37 33 32 Deepwater shrimp 26 19 20 14 13 13 14 13 15 18 Other 15 17 19 21 31 32 56 26 31 25 TOTAL 205 211 210 222 251 243 266 248 261 239 The main species is the Northern prawn Pandalus borealis, a coldwater shrimp. This is also the main species responsible for the increase experienced by European shrimp production during the past decades. The volume catch of this shrimp expanded from 138 MT in 1992 to 164 MT in 2001. The top countries with the highest Pandalus borealis catches are Norway with 66,000 MT, Iceland with 30,000 MT, Russia with 20,000 MT, Faroe Island with 16,000 MT, and Estonia with 11,000 MT in 2001. The second major important species is common shrimp Crangon crangon, another coldwater species. The quantity of catches of Crangon crangon is from 26.000 MT in 1992 to 32.00 MT in 2001. The major countries catching this species are Netherlands with 14,000 MT, Germany with 12,000 MT, United Kingdom with 2,000 MT, Denmark with 2,000 MT, and Belgium with 1,000 MT in 2001. Parapenaeus longirostris, deepwater rose shrimp, is unique warm water species caught in Europe. This species has third quantity of caches in European with nearly
UNU – Fisheries Training Programme 39

Nguyen
18.0 0 MT in 2001. The species0 Parapenaeus longirostris is very fluctuating in roduction during the past decades. The countries having high volume in this species p
are Spain with 9.000 MT, Italy with 7,000 MT, and Portugal 1,500 MT in 2001.
Table 23: European shrimp production by country, 1,000 MT (FAO 2001). Country 1992 1993 1994 19
ay 49 49 3895 1996 1997 1998 1999 2000 200139 42 42 57 64 66 66
9 11 11 13 15 13 164 12 13 12 14 11 14
20 14 14 11 10 10 6 7 12 10enmark 11 7 7 11 11 12 11 8 8 7
L uania 0 NA 1 1 2 2 3 4 6 5P tugal 0 0 1 1 2 2 3 4 3 3
3Latvia NA NA 0 1 1 1 1 3 3 3
reece 4 4 3 3 4 4 3 3 3 3
NorwIceland 47 56 75 84 90 83 63 43 34 31Spain 14 15 17 17 25 28 55 25 22 27Russia 23 25 10 9 13 5 10 18 37 21Faeroe 10 12 9
etherlands 10 10 10 1NGermany 12 13 17 12 16 20 15 19 17 13Estonia NA NA 1 2 3 5 7 12 13 11ItalyD
ithor
UK 1 2 1 3 3 1 3 3 2
GSweden 2 2 3 3 2 3 2 2 2 2Others 2 2 3 3 4 3 2 3 8 3Total 205 211 210 222 251 243 266 248 261 239 The two countries, which play a major role in shrimp catches, are Norway and celand. The total catches of the two coI untries accounted for over 40% of European
Iceland reached is nearly 90,000 T in 1996. In 2001, the catch was only 30,000 MT, a reduction of two-thirds in five
years. Spain is has the third largest shrimp production in Europe. The peak quantity of 55,000 MT was reached in 1998. In recent years the volume of shrimp catches is just over 20,000 MT per year. The main species caught by Spain are Parapenaeus longirostris accounting for 9,000 MT and Pandalus borealis accounting for 1,700 MT in 2001. In general, shrimp production in Europe is fluctuating. The total quantity caught in the past 10 years ranges from 200,000 MT to 250,000 MT per year.
production in 2001. In recent years Norway is the top country in shrimp catches in Europe with 66,000 MT in 2001. In contrast, from 1998 Iceland has experienced a drop in shrimp production. In the period 1993-1997, Iceland experienced a rapid expansion in shrimp production and eft Norway in second place. The peak quantity that l
M
UNU – Fisheries Training Programme 40

Nguyen
5.2 European shrimp imports United States, Japan and the European Union are countries that utilise a big portion of
’s s . T im u o e rie u or o’s produc in 1. I 01, l im t of ldw shri wa ut
S$, in ich Eur an U n i rt s %, was % an 17% of t orld e p uctio
total impo g co odities of shrimp i e E pean ntin acco ed f wo ide duc in 1. N ly 9 of shri port
ope we 15 ntrie n EU
show e im ssiv crea f sh p im rtati nto pe e pades.
the world hrimp otal port q antity f thes count s acco nted f 76% f the world tion 200 n 20 tota por wor ide mp s abo 1.7 million U wh the ope nio mpo hare was 35 US 24 nd Japa he w wid rod n. The rtin mm n th uro co ent unt or 40% of the rldw pro tion 200 ear 0% the mp was im ed into Eur
nt to cou s i .
Figure 16 s th pre e in se o rim po on i Euro in th ast few dec
600
700 MT
1000
0
100
200
300
400
Year
500
1975 1980 1985 1990 1995 2000 2005
han 1992. The average growth of imports in period between 995-2001 is about 4.2%. This growth is very high compared to 3.7% for the whole
rs.
Figure 16: Historical shrimp import volume into Europe, 1976-2001 (FAO 2001).
In 2001, the total quantity of shrimp import into Europe was 667 thousand MT, more than 1.5 times higher t1the world, 4% in the US, and only 0.1% in Japan. The European market is an important market for shrimp exporters. The 15 countries in the European Union always have the biggest demand of shrimp import. European Union members have imported nearly 90% of the total volume of shrimp imported into the European continent. Table 24 shows the biggest importers of shrimp, most of them are European Union membe
UNU – Fisheries Training Programme 41

Nguyen
Table 24: Total European imports of fresh/frozen/chilled and prepared shrimp by country, 1,000 MT (FAO 2001).
Country 1992 1993 1994 1995 1996 1997 1998 1999 2000 2001 Spain 83 92 109 82 85 79 103 94 115 128 Denmark 71 65 77 65 77 77 72 76 95 93 UK 54 52 58 57 61 60 73 69 78 82 France 66 75 61 65 68 66 74 74 68 74 Italy 37 31 34 33 39 34 46 45 50 57 Netherlands 20 20 32 32 31 33 41 37 40 43 Iceland 4 4 2 4 3 5 13 28 35 38 Belgium 21 22 28 31 30 31 30 34 32 33 Germany 24 22 26 23 23 24 26 24 28 29 Sweden 19 20 22 17 21 21 20 21 21 22 Norway 20 28 14 19 19 14 15 18 28 19 Portugal 11 11 11 10 11 12 12 13 12 13 Russia NA NA 1 2 NA 7 7 NA 8 13 Others 11 14 20 21 21 22 22 22 24 24 TOTAL 441 456 495 463 488 485 554 556 632 667 The countries with the highest shrimp imports are Spain with 19%, Denmark with 14%, the UK with 12%, France 11% and Italy with 9% of the total import of shrimp into Europe in 2001. Spain is the main shrimp importer among European countries importing between 80,000 and 130,000 MT of all shrimp commodities per year. Fresh nd frozen area major product terms imported into Spain with nearly 90% of total
se countries ranges between 55,000 MT and 90,000 MT each
is the second largest shrimp importer, most of this import is just assing through the country for re-export. The items imported into Denmark are
rter uantity with 930 MT but the fifth largest importer in terms of value m U n . a p w e Ic n rm qu y 3 M ut u th io
value sp g illion US$ 00
r European cou s r ted itiv end im tin rim er92-2001, etim o an doubling their im
shrimp import quantity. Spanish importers had to pay between 550 million US$ and 770 million US$ per year for importing shrimp. France, Denmark and the UK are the next major shrimp importers. The amount of hrimp imported into thes
per year. Frozen shrimp is the main product imported into these countries. In terms of value, these countries spent between 300 million US$ to 500 million US$ each per year to import shrimp.
lthough Denmark Apmostly raw materials. This is the reason why Denmark is the second largest impoin terms of qspending 275
positioillion
S$ i 2001 This
lso ha pens ith Ic
land. r
eland is in nseventh in te s of antit with 8,000 T b in fo teen posit in
terms of endin 42 m in 2 1. All othe
ears 19ntrie
es meporre th
pos e tr s inports.
por g sh p ov 10 y som
UNU – Fisheries Training Programme 42

Nguyen
S p a in ; 2 1 %
U
O t h e r s ; 1 3 %
K ; 1 4 %
F r a0 %
D e n m
N e t h e r la n d7 %
B e lg iu m ; 7 %
G e r m a n y ; 7 %
n c e ; 1 4 %It a ly ; 1
a r k ; 8 %
s ;
Figure 17 : Import valu o i e ( 0
0 years betwee -2 e f i int pe from 2.8 billion n 3 n 2 e geriod is about 2.7 ual
value the country with the large ort of is wie total European s p im wit UK ran llow ith taly with 10%; rk % e B a he
each.
able 25 : European import volume of shrimp by product, 1992-2001, 1,000 MT
e share f shrimp n Europ in 2001 FAO 20 1).
In the 1 n 1992 001, th value o shrimp mport o Euro grew strongly US$ i 1992 to .6 billio US$ in 001. Th average rowth of the p % ann ly.
s ofIn term st imph
share
shrimpc
Spaini
th 21 1% of th hrim port, the and F e fo ng w 4%
each; I Denma with 8 ; and G rmany, elgium, nd Net rlands with 7% There are two types of shrimp imported into Europe: fresh and frozen shrimp, and cooked and peeled shrimp. Traditionally consumption is mainly of cooked and peeled shrimp, but in recent years the consumption of shell-on shrimp has expanded in Europe (Josupeit 1999). According to the classification of the FAO, shrimp commodities imported into Europe consist of three types(frozen, prepare or preserved, and fresh or chilled). Table 25 shows the impressive increase in volume of import of these commodities in Europe in the past few years.
T(FAO 2001).
Shrimp/prawns 1992 1993 1994 1995 1996 1997 1998 1999 2000 2001 Frozen 306 337 357 332 348 337 398 395 461 497 Prepared 116 101 112 106 114 118 124 127 140 141 Fresh 19 18 26 25 26 29 32 34 31 30 TOTAL 441 456 495 463 488 485 554 556 632 667 Frozen shrimp has always has the largest share in total shrimp commodities imported into Europe. In 2001, the total of these three commodities imported into Europe reached 667 thousand MT, in which frozen shrimp accounted for 74%, prepared or preserved 21% and fresh or chilled 4%.
UNU – Fisheries Training Programme 43

Nguyen
Fresh, frozen, and chilled shrimp are whole-shrimp products. These products aremain imports of countries. Table 26 shows the biggest importers of whole-shrimEurope.
the p in
: Impor sh/f hrim uro oun MT 200
Table 26 t of fre rozen s p to E pe by c try, in (FAO 1).
Country 19 19995 6 1997 1998 1999 2000 2001 Spain 80,99 3,576 ,956 46 5 18 8 77 102,0 93,36 113,693 26,755 Denmark 41,61 3,711 ,691 19 1 9 5 54 48,3 50,14 63,859 66,192 France 56,35 8,514 ,019 95 2 63 5 56 63,0 61,79 56,143 1,804 Italy 29,14 4,604 ,966 16 3 50 3 29 40,7 39,42 43,969 1,315 UK 27,52 5,830 ,216 4 33 2 26 37,038 31,83 36,590 8,122 Netherlands 25,88 3,905 ,627 99 1 33 2 24 33,1 30,29 31,258 3,638 Belgium 24,22 3,292 ,585 93 9 25 2 23 22,0 25,94 24,779 6,693 Germany 11,22 0,632 ,198 94 4 16 1 10 11,9 11,96 14,731 5,974 Norway 17,29 6,801 ,458 98 4 16 1 12 12,2 16,09 24,943 5,758 Portugal 10,307 0,652 ,125 53 4 1 12 1 11 12,0 12,59 1,377 ,926 Sweden 9,935 3,582 11,705 04 3 1 11 1 11,4 11,97 1,183 ,150 Poland 6,985 5,480 ,565 9 8 3,4 4,51 3,87 4,198 606 Greece 1,322 2,401 ,111 83 3 3 2 1,9 2,01 2,312 ,181 Switzerland 1,919 2,008 ,898 9 8 2,1 2,48 2,12 2,635 875 Ireland 903 984 1,016 1 5 1,1,01 1,67 1,431 622 Austria 530 6 60 2 719 49 1 64 629 717 Others 10,435 7,161 17,513 25,141 33,254 48,436 54,277 TOTAL 356,599 373,782 366,250 430,040 429,087 492,166 526,605 Whole-shrimp products imported into Europe increased from 356,599 MT in 1995 to 526,605 MT in 2001. The growth rate is 5.3% in this period.
pain, Denmark, France, Italy, Belgium and Netherlands are the main markets for
n exporters supply more than 50% of the total import quantity of this product nnually. The rest of the supply was from countries such as Thailand, India, China,
the near future due to changing demographics and societal nvironments. European countries spent nearly 1 billion $US importing prepared
Sfresh and frozen shrimp. Denmark is the main exporter of fresh and frozen shrimp, almost exporting 64,000 MT in 2001, accounting for 12% of the European imports of this product. EuropeaaBangladesh, Ecuador, and Mexico. In 2001, Europe imported 259,000 MT of this product from outside the continent, accounting for 49%. Although prepared or preserved shrimp products do not have an important position like frozen products in the European markets, the trend of the markets will be towards these products in eshrimp, accounting for 21% of the total import value. Table 27 shows the biggest importer of prepared shrimp in Europe, by quantity.
UNU – Fisheries Training Programme 44

Nguyen
Table 27: European imports of prepared shrimp by importing country, MT (FAO 2001).
Country 1995 1996 1997 1998 1999 2000 2001 UK 29,528 34,854 34,090 36,115 37,481 41,279 44,211 Denmark 23,618 22,921 22,632 23,322 26,034 30,987 26,955 G many 11,994 12,753 14,158 14,173 11,910 12,895 12,530 erFrance 8,896 9,150 9,675 11,284 11,942 11,575 12,130 Sweden 7,280 7,425 9,102 8,629 8,961 10,108 11,304 Netherlands 6,478 6,845 7,943 7,946 6,861 9,064 8,873 Belgium 7,210 7,045 7,733 8,017 7,852 7,313 6,064 Italy 3,641 3,925 4,257 5,030 5,681 5,571 5,972 Norway 1,622 1,951 1,935 2,379 2,355 3,099 3,491 Switzerland 2,142 2,354 2,249 2,134 2,364 2,468 2,580 Finland 1,651 2,032 1,975 2,002 2,055 1,941 2,414 Spain 868 1,207 914 884 856 1,016 1,053 Ireland 139 150 177 240 291 400 630 Austria 441 694 572 512 471 633 605 Portugal 170 194 391 330 352 401 523 Greece 258 251 169 223 304 202 307 Poland 202 136 167 274 397 338 297 Others 237 384 221 44 44 89 705 794 TOTAL 106,375 71 360 3,938 126,656 139, 140114,2 118, 12 995 ,733
of prepareImportsecade.
d shrim ainly cooked pee have wn the However prepared sh p has a lowe imports of fres
peit
ost 24,00
second importing 27,000 MT, and Germany and France 12,000
.
p, mrim
andr share of import than
led, gro over past h d
and frozen shrimp. The prepared shrimp import share is between 20% and 24% in total quantity imported. Cooked and peeled shrimp are a rather traditional product, especially in the northern part of the continent. In Germany, the UK, and Sweden imports of fresh and frozen re usually in parallel with prepared shrimp in terms of import quantity (Josua
1999).
eland is the main exporter of prepared shrimp to Europe, importing almIcMT in 2001, accounting for 17% of Europe imports of this product. Other countries supplying Europe with the bulk of prepared items are Norway, Greenland and Netherlands. These four countries usually export to other European countries between 65,000 to 73,000 MT annually, accounting for more than 50% of European import of
is type of shrimp. th The UK is by far the main importer of prepare shrimp accounting for 44,000 MT in2001. Denmark is in MT each
UNU – Fisheries Training Programme 45

Nguyen
5.3 Importing price
price depends on t ded v accu ted i hrimp products. This mrepared products have a higher price per unit than h or n ite
ucts have the est p Figu exp the d nt a ctuang price of shrim duc
The he ad alue mula nto s eans that p must fres froze ms. Fresh prod low rice. re 18 lains iffere nd flu ting importi p pro ts.
0,0
1,0
2,0
3,0
4,0
1970 197
year
5,0
9,0
5 1980 1985 1990 1995 2000 2005
/kg10,0
$USFresh or chilledFrozenPrepared or preservedAverage
6,0
7,0
8,0
Figure 18: Fluctuating unit value in the period 1976-2001.
The importing price is different among shrimp commodities. The highest per-unit value is prepared or persevered shrimp. The frozen price is usually slightly higher than the fresh one. The shrimp price fluctuates annually. Prepared products have the highest as well as the most fluctuated importing price. The importing price unit was calculated by dividing the total import value with total import quantity. Table 28 compares in detail three shrimp products in recent years.
Table 28: The unit value of certain commodities 1995-2001, US$/kg.
Shrimp and prawn 1995 1996 1997 1998 1999 2000 2001 Fresh or chilled 5.42 5.70 4.78 5.32 5.83 5.04 6.07 Frozen 6.90 6.45 6.08 6.34 5.83 5.75 5.26 Prepared or preserved 9.03 8.66 7.43 7.49 7.15 6.50 5.92 Average 7.31 6.93 6.33 6.54 6.13 5.88 5.44 In recent years the price of shrimp has decreased marginally , especially the price of prepared shrimp. In 2001 the fresh or chilled shrimp had the highest value per unit at 6 US$/kg, second was prepared shrimp at 5.9US$/kg and third was frozen shrimp at 5.3 USUS$/kg. The fall in shrimp price is the result of the booming shrimp aquaculture industry, especially shrimp aquaculture in Thailand, Ecuador, India, and Bangladesh. The average shrimp price is very different between countries on the European continent. The difference is due to demand, weight of items consumed, and delivery
UNU – Fisheries Training Programme 46

Nguyen
condition. Table 29 illustrates the varying price among countries. The numbaverage price of three shrimp commodities: frozen, fresh, and prepared items.
ers are
he average rt u lue o en/f repa rim oun, US$/kg.
Table 29: T001
impo nit va f froz resh/p red sh p by c try, 1995-2
Country 1995 1996 1997 1998 1999 2000 2001 Austria 11.30 14.92 12.88 11.88 1 1 13.46 2.05 1.07 Switzerland 1 1 1 1 11 101.71 13.35 2.53 1.41 2.32 .25 .74 Germany 9.63 10.92 10.32 8.99 9.65 8.99 8.63 Belgium 8.37 8.81 8.52 7.90 8 8 8.79 .43 .34 Portugal 7 7 77.17 8.16 7.74 7.17 .92 .37 .98 Greece 7.63 7.97 8.13 6.47 8.28 7.60 7.56 France 6.89 7.69 7.29 6.97 7 6 7.44 .92 .31 Ireland 5.05 7.96 8.43 6.92 7 6 7.53 .92 .04 Italy 7 6 67.63 8.00 7.53 7.54 .36 .89 .95 UK 6.97 8.02 7.57 7.58 6.95 6 6.99 .93 Spain 4.72 7.56 7.12 6.76 6 6 6.70 .32 .69 Netherlands 6 6 65.80 6.97 6.81 5.93 .96 .38 .41 Finland 6.26 9.02 7.64 5.75 5 5 5.98 .96 .51 Sweden 5.42 6.79 6.45 5.37 5.63 5 5.53 .08 Denmark 4.34 5.58 5.09 4.10 4 3 3.08 .99 .51 Table 29 reveals the weight-consumption of shrimp. The countries having high
o re-export. So Denmark is a big country for importing hrimp as raw material. Tables 30 and 31 show the import unit price of fresh and
frozen shrimp in typical markets. The unit price explains the demand of each product in these markets.
average prices such as Austria, Switzerland, Germany, and Belgium usually imported high amounts of prepared or preserved shrimp in comparison with other countries. These countries have a trend of consuming commodities with high added value. In contrast, some other countries such as Denmark, Sweden, and Finland fresh and frozen were imported much more than prepared shrimp. Most of the shrimp imported into Denmark was used ts
UNU – Fisheries Training Programme 47

Nguyen
Table 30: Import unit value of fresh or chilled shrimp by country, 1995-2001, US$/kg.
Country 1995 1996 1997 1998 1999 2000 2001 Switzerland 16.4 15.9 13.5 13.9 13.1 11.6 11.5 Austria 16.1 117.4 15.1 17.2 13.3 12.6 1.1 Czech Republic 7.8 10.8 8.0 10.2 9.7 12.0 10.6 Spain 14.7 111.8 10.4 11.5 10.5 10.0 0.6 Belgium 9.9 10.7 9.1 9.6 10.1 8.0 9.9 Germany 12.4 12.1 11.8 12.5 11.1 10.1 9.6 Hungary 0.0 0.0 6.8 15.0 5.0 9.0 9.3 Italy 12.3 12.0 10.8 11.2 9.9 9.0 8.5 France 7.6 8.1 5.8 6.5 7.2 6.7 8.0 Slovenia 6.5 6.2 5.5 5.8 6.0 6.1 7.8 Greece 12.6 10.7 8.4 10.3 5.8 9.3 7.5 UK 4.7 5.5 12.0 5.2 4.4 7.8 7.5 Finland 49.7 16.3 13.1 8.5 16.3 9.0 7.1 Norway 2.4 3.2 7.0 3.3 4.2 1.7 6.8 Ireland 2.5 2.9 3.7 8.5 5.8 5.1 6.6 Sweden 4.8 5.6 4.1 4.3 5.1 4.5 4.7 Portugal 6.9 10.9 11.2 8.6 10.1 7.8 4.2 Denmark 4.0 3.8 2.2 2.7 4.6 2.9 4.2 Netherlands 4.2 3.7 2.3 2.9 3.9 3.0 3.6 In the recent years, the price of fresh shrimp has declined slightly in every market. Switzerland, Austria, the Czech Republic, and Span have the highest price of fresh shrimp, more than 10 US$ per kg. The fresh shrimp price in Belgium, Germany, Hungary, Italy, and France markets is about 8 and 9 US$ per kg. The markets of the Netherlands, Denmark, Portugal, and Sweden the have lowest price of fresh shrimp.
he reason could be that these countries have their own supply or have a low demand Tfor fresh shrimp products.
UNU – Fisheries Training Programme 48

Nguyen
Table 31: Import unit value of frozen shrimp by country, 1995-2001, US$/kg.
Country 1995 1996 1997 1998 1999 2000 2001 Austria 15.6 14.3 13.2 14.9 12.2 12.3 11.3 Switzerland 13.6 12.6 11.8 12.7 11.6 1 11.6 1.3 Germany 112.0 11.0 0.2 10.8 9.5 9.1 8.9 Portugal 8.2 7.7 7.3 8.0 7.4 8.1 7.4 Belgium 8.0 7.4 7.4 8.3 7.5 8.0 7.3 Netherlands 7.7 7.6 7.3 8.3 7.6 7.9 7.2 UK 7.4 6.9 7.7 6.7 7.4 8.0 7.0 France 7.7 7.3 7.2 7.6 7.1 7.8 6.9 Ireland 8.0 8.3 6.7 7.4 7.0 7.1 6.7 Bulgaria 3.2 3.4 2.4 2.6 3.6 3.3 6.4 Greece 8.0 8.3 6.5 8.5 8.1 7.7 6.4 Spain 7.5 7.1 6.7 6.7 6.3 6.7 6.0 Italy 7.6 7.0 7.1 6.9 6.5 6.7 5.9 Finland 7.3 6.8 6.1 6.7 5.7 5.7 5.1 Sweden 5.4 5.3 4.6 4.7 4.3 4.1 3.8 Hungary 7.6 4.4 4.8 4.7 5.1 4.1 3.8 Belarus 3.1 3.5 2.6 2.8 4.3 3.1 3.7 Poland 2.1 2.4 2.4 3.0 3.2 2.9 3.0 Denmark 3.8 3.7 3.1 2.9 2.8 2.4 2.1 Norway 2.9 2.7 2.7 3.0 2.6 1.8 2.0 Austria and Switzerland have the highest importing price of frozen shrimp, about 11 US$ per kg. Following them are Germany, Portugal, Belgium, Netherlands, and the UK with prices between 7-9 US$ per kg. The markets with the lowest importing price of these products are Norway, Denmark, Poland, Belarus, Hungary, and Sweden, at about 2 and 3 US$ /kg. From both tables (30 and 31) it is evident that the price of fresh or chilled shrimp and price of frozen shrimp are roughly equivalent. The countries with high unit value of import of these products are Switzerland, Austria, Germany, Spain, France, Belgium, nd Czech Republic.
y contrast, Denmark, Poland, Netherlands, and Portugal have a very low price for
a Bthese products. It is understandable that these countries mainly import raw materials to domestic processing plants. The price of raw material is obviously lower than the price of finish product.
UNU – Fisheries Training Programme 49

Nguyen
Table 32: Import unit value of prepared or preserved shrimp by country, 1995-2001, US$/kg.
Country 1995 996 1997 1998 1999 2000 20011 Switzerland 13.1 4 .1 11.9 .9 9.8 9.912. 11 10 Iceland 10.7 0 .4 11.8 5 3.1 9.712. 8 6. 1 Belgium 11.2 11.2 8.9 9.6 10.5 9.4 9.3 Poland 3.5 7 .3 7.7 .5 8. 9.0 4. 4 10 7 Austria 13.9 7 .6 10.4 .3 9.8 8.7 10. 9 11Slovenia 7.7 4 .8 9.7 .8 8. 8.7. 8 11 1 3 Germany 9.9 9.7 .1 8.6 4 8. 7.8 8. 0 9 Italy 10.1 4 .0 1 4 7. 7.10. 9 9. 8. 9 2 Norway 8.5 5 .2 7.5 6 6. 6.8. 8 7. 8 3 Greece 7.0 1 .1 5.6 6.1 6. 6 5.6 5.2 Netherlands 8.8 9.5 .8 7.7 4 6.9 6.0 7 7.Czech Republic 6.3 4 .8 .9 0 5.6 5.8 5. 5 5 5.Ireland 8.3 5 .4 1 7 7. 5.10. 9 8. 6. 1 7 France 7.5 7.0 .6 6.8 9 5. 5.6 5. 5 6 Spain 7.3 3 .9 6.3 1 5. 5.6. 6 6. 4 6 United Kingdom 8.7 1 .5 7.2 .7 6.0 5.4 8. 7 6Sweden 8.8 8.4 6.5 7.0 6.9 6.1 5.0 Denmark 8.7 8.3 6.5 6.5 6.2 5.7 5.0 Finland 9.2 7.7 5.7 5.8 5.9 5.5 4.6 The range of changing price of prepared shrimp is not as widely as it is for fresh and
general the price of every shrimp products in all European markets has decreased in
he shrimp supply of Europe depends heavily on import upply. Export of shrimp takes place between European countries. Table 33 shows the
frozen shrimp. The countries with the highest price are Switzerland, Iceland, Belgium and Poland with over 9US$/kg; following them are Austria, Slovenia and Germany. The price in the main markets for this product such as France, Spain and the UK is lower than in other markets. Inrecent years. This is the result of shrimp aquaculture products from Asian, Northern American, and Latin American countries. 5.4 Shrimp supply There are interesting trends in shrimp consumption. The total supply of shrimp has constantly increased in the past decades. European people are more satisfied in shrimp products. The total supply of shrimp in Europe is from two resources: domestic production and import. Tssupply of shrimp in Europe in the period between 1995-2001. Because there are different forms of shrimp products, the calculation of supply for all shrimp items is not logical. Apparent supply was calculated by: production + import – export. Net import reflects the surplus import from export.
UNU – Fisheries Training Programme 50

Nguyen
Table 33: Shrimp supply of Europe in MT (FAO 2001).
Fresh or chilled 1995 1996 1997 1998 1999 2000 2001 Production na na na na na na na Import 25,049 25,639 29,121 31,542 33,589 30,960 29,506 Export 23,257 27,371 35,561 37,519 34,281 50,145 33,418 Apparent supply na Na na na na na na net imports 1,792 -1,732 -6,440 -5,977 -692 -19,185 -3,912 Frozen 1995 1996 1997 1998 1999 2000 2001 Production 11 133 102, 124,2 30,80 7,785 4,622 2,789 ,180 570 78 1 2 14 14Import 3 3 39 95, 1, 7,106 331,875 48,637 37,309 8,500 3 504 46 238 49Export 147,307 1 0 18 186, 05,0 7,1 4,391 77,26 2,825 267 2 45 25 41 23Apparent supply 3 41 460, 69,7 0,5 6,875 366,393 92,717 7,564 489 4 47 57 94 58% net imports in su 4 36 45% pply 50% 44% 37% 46% 1% % Prepared or preserved 1995 1996 1997 1 19 20998 99 00 2001 Production 6 73 76,2 79,6 0,2 4,869 57,305 1,847 ,623 51 91 8 25 8Import 1 11 123, 26,6 0,0 0,754 106,381 14,282 8,366 954 1 72 14 14 14Export 89,997 9 103, 104,4 08,24 6,0 9,814 7,367 769 47 1 6 11 69 11Apparent supply 1 14 14 152,1 55,22 5,85 5,699 39,073 9,802 8,512 50 1 7 17 8 17% net imports in su % 1 12 14% 12% pply 12 11% 10% 3% % * na - not available
years t illed shrimp gative. The may be that fresh shrimp is transferr froz pre for
sing plants. pply en a pare p in ed in riod en 1
he average wth o zen product is 7 nd 3 or p prohe years rev d. Th rease p tog
of net-import in fresh product has proclaimed the trends of market. alue-added products have been preferred to shrimp in their original form.
the total supply of frozen shrimp in Europe is approximately 587,000 MT, in hich 45% of the total supply is supplied by non-European countries. European
r preserved shrimp has increased slightly in past years. owever, the total supply is still small in comparison to the whole shrimp
The fifteen countries of the EU have the highest demand in shrimp consumption. Total supply of these countries has ranged from 400 thousand MT to 500 thousand MT of shrimp in live-weight annually, in which over 75% is supplied though imports. The dependence of EU on imports for its shrimp supply has grown impressively during the period between 1981-1997 going from 55% to 76%. The per capita supply tripled from a mere 400g to 1200g (Josupeit 1999). The distribution of European Union imports of shrimps are Asia with 29%, Europe with 20%, North America with 17%, Latin America with 17%, Africa with 16%, and other countries accounting for 1% in 1997. The biggest exporters of shrimp into EU
In recent he net-import quantity of fresh or ch is nereason ed to en or pared m in procesThe total su of froz nd pre d shrim creas the pe betwe 995-2001. T gro f fro % a .4% f repared duct under t iewe e inc of frozen and prepared shrim supply ether with the decrease V In 2001,wcountries depend very much on the supply of this product from outside countries approximately between 40%-50 % of total demand. The demand of prepared oHcommodities. European countries consumed between 150,000 to 175,000 MT of prepared shrimp per year.
UNU – Fisheries Training Programme 51

Nguyen
are Thailand, India, Ecuador, Iceland, Greenland, Norway, and Bangladesh. In recent ears Asian countries have constantly expanded their market share in EU on the basis
able 34: Total supply of frozen shrimp, by country in MT (FAO 2001).
yof promoting shrimp aquaculture. Frozen shrimp is utilized most in Europe. Table 34 shows the countries with the highest consumption of this product.
T
Country 1995 1996 1997 1998 1999 2000 2001 Spain 93,41 95,7 95,2 115, 109 125 139 86 07 771 ,431 ,293 2,785 Iceland 29,8 27, NA 35 48 5 652 455 ,474 ,153 5,399 1,841 France 47,249 49, 43 49 48 4 4 913 ,606 ,686 ,102 2,500 9,411 Italy 28,1 32, 28 38 36 4 411 769 ,227 ,716 ,935 1,667 8,659 Norway 29,1 30, 22 21 18 2 109 151 ,411 ,672 ,443 0,172 9,556 Russian NA 2, 8, 8, 3 1 1225 916 178 ,007 2,988 5,818 UK 12,482 10,28 10,94 18,1 11,5 16, 15 9 1 43 79 265 ,242 Germany 8, 7, 6 8,333 890 ,217 141 7,749 9,112 11,910 Portugal 9,15 8, 9 10 438 ,060 0,135 9,902 7,708 9,966 Sweden NA NA 7 ,782 7,652 8,631 6,929 8,446 Belgium 11, 8, 6709 039 ,281 6,129 7,264 7,502 7,229 Netherlands 6,83 3, N NA N1 104 A 5,807 A 6,471 Denmark 6,518 6,971 5,166 1,825 8,500 NA 5,085 Greece 2,115 2,823 2,924 2,912 2,914 3,255 4,135 Latvia 54 NA 1,021 1,279 3,198 3,223 3,320 Switzerland 1,858 1,941 1,830 2,460 2,066 2,605 2,834 Ireland 883 957 772 790 1,494 1,276 1,382 Poland 983 915 1,288 1,380 1,173 1,574 1,086 *
NA: Not Available
The total supply in Table 34 was calculated by: domestic production + import –
ading country w h o ion ze ai00 MT in 2001, i d and with 62,000 MT w 00
with 19,000 M s 1 T UK 1 Tany with 12,000 M
t years, Iceland h en in terms o ly en p an bend highest count ply zen p.
export. The le ith the ighest c nsumpt of fro n shrimp is Sp n with 133,0 n secon is Icel , Italy ith 48,0 MT, Norway T, Ru sia with 6,000 M , the with 5,000 M , and Germ T. In recen as ris f supp ing froz shrim d has come the seco ry sup ing fro shrim
UNU – Fisheries Training Programme 52

Nguyen
5.5 Target market
35, 36 and 37 show the net import of shrimp ommodities. If the net import is positive, it means that the country imported shrimp
ountry 1995 1996 1997 1998 1999 2000 2001
Based on the analysis above and the data in the table below, target markets ware determined. The numbers in Tablesccommodity more than exported; if the result is vice versa then the country exported more than imported.
Table 35: Net import of fresh or chilled shrimp by country, in MT (FAO 2001).
CFrance 2,908 2,808 3,310 2,984 2,775 3,490 2,640 Italy 771 1,286 1,703 1,963 2,411 2,196 2,624 Belgium 1,694 1,548 2,179 2,254 1,826 2,040 2,454 Poland 5,1 3,5 2, 2 1 151 90 038 ,042 ,419 ,919 2,046 Sweden 1, 1554 ,771 3,318 3,077 2,715 2,333 1,818 Spain 380 639 748 818 837 754 907 UK -1 -1 - -1,242 ,501 1,031 -827 ,411 -1,782 -1,453 Norway -7 -1, -1 -2 -2 -20 060 ,431 ,247 ,091 2,055 -1,717 Denmark -2,2 -3, -5 -7 -3 -14 164 ,530 ,884 ,099 4,567 -2,980 Germany -5,0 -6, -9 -6 -8 -141 465 ,314 ,559 ,627 0,954 -5,004 Netherlands -7 -1, -2 -2 1 -88 222 ,406 ,854 ,108 8,073 -5,602 France, Italy, Belgium, countries with a high demand for imported
shrimp. These countries have a net-im of 2, T o h sh eachsatisfy domestic consumption. In contra he Netherland ermany,
rk, Norway, an UK ountr ith a net rt o h shrT, 5,000 ,00 1,7 T, 00 n 2
6: Net impor en b ry (F 1
and Poland are fresh port 000 M f fres rimp per year to st, t s, GDenma d the are c ies w high expo f fres imp with 5,000 M MT, 2 0 MT, 000 M and 1,4 0 MT i 001.
Table 3 t of froz shrimp y count , in MT AO 200 ).
Country 1995 1996 1997 1998 1999 2000 2001 Spain 74,466 73,878 69,925 91,965 84,439 102,167 109,871 France 47,249 49,913 43,606 49,686 48,102 42,500 49,411 Italy 27,178 31,714 26,646 36,924 34,550 37,973 45,216 Iceland -5,289 -11,200 -10,791 4,195 22,600 31,573 34,741 UK 12,482 10,289 10,941 18,143 11,579 16,265 15,242 Germany 8,333 7,890 6,217 8,141 7,749 9,112 11,910 Portugal 9,150 8,438 9,060 10,135 9,902 7,708 9,966 Sweden 7,167 11,159 7,713 7,504 8,547 6,829 8,366 Belgium 11,709 8,039 6,281 6,129 7,264 7,502 7,229 Netherlands 6,831 3,104 -4,552 5,807 -9,835 -1,794 6,471 Denmark 6,392 6,413 4,871 1,109 8,169 -4,373 4,346 Norway 12,981 12,351 7,174 6,122 2,321 4,873 4,324 Greece 1,101 1,776 1,551 1,584 1,682 2,115 2,863 Switzerland 1,858 1,941 1,830 2,460 2,066 2,605 2,834 Ireland -407 -640 253 434 1,194 876 1,096 Poland 983 915 1,288 1,380 1,173 1,574 1,086 Estonia 213 193 246 -2,184 221 -4,428 -869 Russian -2,460 -6,095 5,366 -552 -12,846 -17,717 -1,399 Faroe Islands -5,519 -7,297 -6,492 -7,378 -7,171 -7,516 -13,806
UNU – Fisheries Training Programme 53

Nguyen
Spain has the highest net import of frozen shrimp. The net import is between 75,000
T and 110,000 MT per year. This net import was used to meet more than 80% total
ut 48,000 MT of frozen shrimp. Italy has a net port, which has increased in recent years. The peak of net import was 45,000 MT in
imp around 10,000 MT each per year.
Mof demand of this product in Spain. France has a net annual import of aboim2001. Iceland used to have a surplus of trade in frozen shrimp. But in recent years, the consumption of frozen shrimp has increased significantly. The UK, Germany, and Portugal had a net import of frozen shr
Table 37: Net import of prepared or preserved shrimp by country, in MT (FAO 2001).
Country 1995 1996 1997 1998 1999 2000 2001 UK 26,599 30,864 29,652 32,022 32,921 36,117 39,834 France 7,810 8,384 8,917 10,694 11,221 10,738 11,274 Germany 11,191 11,728 13,203 12,701 9,619 10,872 10,270 Sweden 6,549 6,784 7,082 7,086 7,663 9,118 9,661 Italy 3,609 3,910 4,229 5,003 5,653 5,510 5,913 Switzerland 2,125 2,346 2,232 2,107 2,344 2,446 2,577 Finland 1,624 2,023 1,891 1,964 2,030 1,921 2,407 Denmark 8,199 4 3, 1 5,34,64 327 3,249 6,03 97 613 Austria 438 682 5 7 63 71 510 46 0 602 Spain 704 903 6 1 35 00 561 51 9 519 Portugal 167 3 1 39NA 86 323 33 4 512 Poland 50 -4 5 -99-1,565 -1,0 51 -730 -55 4 -847 Faroe Islands 41 1,5 - 9 ,29 -3-1,124 -1,5 - 35 2,124 -2,27 -2 8 ,105 Netherlands 15 5,1 - 0 ,50 -6-5,723 -7,5 - 67 4,872 -8,88 -6 5 ,066 Norway -9 82 -13,541 -16, 5 720 -17,140 -10,7 502 -17,25 -17, ,384 Iceland -22 40 -25,716 -23, - 8 695 -24,382 -24,1 264 20,76 -20, ,345 The UK has the hes re o nsu tio re s rt
7,000 M er y Fo ing m a ran e y, w w a net imp f a d 1 0 M of are rim ch yea he
rs of this product are Iceland w 24 M or with ,00 T,therlan M n r is c 0
ozen, 800 MT of fresh or chilled and 500 MT of prepared or preserved shrimp to
und 10,000 MT of repared and 3,000 MT of fresh or chilled shrimp per year. This market has a high
demand for tropical shrimp. The United Kingdom has the highest demand for prepared shrimp. Annually this market needs to import about 35,000 MT of prepared shrimp to meet domestic
hig t sha f co mp n of p pared hrimp. The net impo was about 3 T p ear. llow the re F ce, G rman and S eden hich have ort o roun 0,00 T prep d sh p ea per r. T big exporte ith ,000 T, N way 17 0 M and the Ne ds with 6,000 T of et expo t of th produ t in 20 1. In summary the markets below have potential for shrimp exporters: The Spanish market has the highest demand for frozen shrimp, followed by fresh and prepared. Annually, the Spanish market needs to import around 100,000 MT of frmeet domestic demand.. The French market needs to import nearly 50,000 MT of frozen, arop
UNU – Fisheries Training Programme 54

Nguyen
dem nd. Frozen sa hrimp deficit of the market is about 15,000 MT. This country can roduce enough fresh shrimp to satisfy consumption.
T nd 2,200 MT per year, respectively.
of Belgium and Sweden is about ,000 MT. Prepared shrimp was consumed a lot in Sweden which needed to import
urope are Denmark, Netherlands, Norway, Iceland, nd the Faroe Islands. These countries are competitors for shrimp exporters. Table 38
able 38: Export shrimp in Europe by country, 1992-2001, 1,000 MT (FAO 2001).
p Germany needs to import about 10,000 MT frozen and more than 10,000 MT of prepared shrimp annually. This country has a surplus export of fresh shrimp of 5,000-10,000 MT of fresh shrimp per year. Italy has a very high frozen shrimp demand and needs to import annually about 37,000 MT. Import demand of prepared and fresh shrimp in this market is 5,500 Ma Portugal, Sweden, and Belgium need to import annually about 7-9 thousand MT of frozen shrimp. The fresh shrimp import demand2about 8-9 thousand MT per year. The biggest shrimp exporters in Eashows the import quantity of shrimp in recent years.
T
Country 1992 1993 1994 1995 1996 1997 1998 1999 2000 2001 Denmark 64.9 63.6 66.5 52.9 68.7 74.7 75.2 65.1 98.4 91.2 Netherlands 29.4 30.0 34.2 32.0 36.4 44.7 43.1 54.8 56.7 47.7 Norway 21.4 22.5 24.0 15.8 18.2 22.2 27.3 35.5 42.9 34.0 UK 21.7 18.2 21.0 19.2 21.0 20.7 23.8 26.2 27.3 28.7 Iceland 20.2 22.4 32.4 31.8 38.8 41.3 32.0 25.8 23.9 27.2 Belgium 9.0 12.4 16.2 16.2 18.6 22.2 20.1 24.5 21.1 23.0 Faroe Islands 5.0 7.1 10.2 7.5 9.1 8.8 10.1 9.8 10.8 17.1 Spain 3.9 9.6 5.9 6.3 9.4 7.6 9.6 8.4 11.4 16.5 Russia 9.1 10.2 7.0 4.9 6.2 1.5 7.3 12.9 25.4 14.1 Germany 6.6 6.7 9.6 8.7 10.2 14.3 11.9 15.1 18.6 11.3 France 5.0 5.9 5.7 7.3 6.6 9.9 11.0 11.6 11.0 10.6 Italy 2.1 1.6 1.6 1.2 1.6 1.6 1.9 2.5 3.9 3.5 Others 5.7 4.2 5.9 9.4 9.3 9.9 12.0 9.6 21.0 10.9 Total 204.0 214.4 240.3 213.4 254.3 279.3 285.2 301.8 372.3 335.8 Annually, Europe exports more than 300 thousand MT of shrimp products, mostly in fresh form. Some countries in Table 38 have a high export volume of shrimp but this does not mean that these countries have potential shrimp to export. The countries such as the UK, Denmark, Spain, Germany, France, and Italy carry out re-export activities. The countries which have a surplus of shrimp to export are Iceland with 16,000 MT, he Faroe Islands with 8,700 MT, the Netherlands with 8,000 MT, Norway with 7,000t
MT, Russia with 6,000 MT, and Estonia with 1,000 MT annually.
UNU – Fisheries Training Programme 55

Nguyen
5.6 Summary Europe accounts for about one third of shrimp imports in value terms, almost equalling the importance the US shrimp markets and overcoming Japanese markets in
alue terms in recent years. Although shrimp production has expanded very
ally, Europe imports more than 600 thousand T of shrimp in various forms. In which frozen product accounts for more than 70%,
n countries. The average import rice of shrimp is about 5.44 US$ per kg in 2001.
red shrimp.. Shrimp consumption per capita of U is about 1.2 kg/year in 1997.
pain, France, the UK, Germany, Italy, Belgium, and Portugal have a high demand of
asa and tra catfish are important species of seafood exports of Vietnam. Aquaculture of catfish for export is vital for jobs of thousands of farmers in South Vietnam. Tra and basa catfish are exported mainly to the United States as fillets. The dependence on a single market has led to disadvantages for Vietnamese exporters. On July 23 2003, the US International Trade Committee voted to apply anti-dumping tax on frozen catfish fillet imported from Vietnam. To spread the risks, Vietnamese exporters need to target European markets to export their products. Catfish products are not common in European markets. To find out the demand of these products it is necessary to analyse competitive products against catfish products. In United States, the whitefish market is complex; it includes many species that compete with one another, and also competes with imports of similar products from other nations. Pollock and Pacific cod are the dominant species sold in U.S. whitefish
arket of co-
tegration of price among species of the US whitefish market. She concludes “even
vimpressively during the past decades European markets have potential for exporters, especially the European Union. AnnuMpreserved or prepared accounts for 20%, and the rest for accounts for fresh product. In recent years shrimp price of various forms has fallen because of the development of shrimp aquaculture in the world, especially in Asiap Total consumption of shrimp in Europe annually is about 550 thousand MT of frozen, 170 thousand MT of preserved or prepaE Sshrimp import. Frozen shrimp is the most common among shrimp products imported. 6 EUROPEAN MARKETS FOR WHITEFISH PRODUCTS B
markets. Other ground fish and even farmed catfish are a part of the whitefish m(Roheim et al. 2003). Roheim and her colleagues built a model for the testing inwith the relatively weak results of this analysis, we can say that groundfish prices are influenced by the prices of cod. There is some co-integration among the other groundfish species, except for yellowtail and widow flounder” (Roheim et al. 2003). According to the FAO, the term “whitefish” is defined as a “general term for fishes which have fat concentrated in the liver, not the flesh; lean fish with less than 2% of fat in the flesh” (FAO Glossary). Whitefish is a category belonging to ground fish.
UNU – Fisheries Training Programme 56

Nguyen
In European markets whitefish is known as cod, haddock, pollock, whiting, hake, and some others. According to FAO statistics, these species are classified into groups such as Cod, Hake, Haddock, Pollock, Whiting, and Others by ISSCAAP group ((FAO 2001). Based on the reasons above, whitefish is chosen as a competitive species with catfish in European markets, especially cod.
recent years a lot of cod stocks have been over-fished. Worldwide, total cod catch as fallen by two thirds in only three decades. Cod, once one of the most important ass fish species, is over-fished. Pollock and haddock are in the same situation. This an opportunity for catfish products to fill the gap.
his chapter will mainly analyse the situation of production, exports, and imports of roducts of cod, hake, haddock, pollock, whiting, and other whitefish. The chapter
will also analyse in detail cod species.
.1 European whitefish production
quantity of roduction in Europe is around 5 million MT, accounting for 25% of total fish
Inhmis Tp
6 Whitefish is a popular category in European countries. Annual whitefish pproduction of Europe. Whitefish production in Europe accounts for more than half of whitefish production in the world. Figure 19 (below) shows the historical production of whitefish in Europe.
4
5
6
7
8
9
Mill
ions
MT
0
1
2
3
1948 1953 1958 1963 1968 1973 1978 1983 198
Year
8 1993 1998 2003
he increase of whitefish production has not been as fast as the production of other
illion MT in 2000 and 5 million T in 2001. The whitefish production in Europe has decreased by 40% from 1986 to
Figure 19: Historical whitefish production of Europe, 1950-2001 (FAO 2001). Tspecies. The production share of whitefish decreased from more than 30% to less than 30% in 1997. According to FAO statistics, the peak production of whitefish was 8.5 million MT in 1986 which dropped down to 4.8 mM2001. The probable reasons are over fishing of some important species such as pollock and cod, and the changing politics of the Soviet Union affecting the fisheries sector.
UNU – Fisheries Training Programme 57

Nguyen
In 2001, whitefish production in Europe was 5 million MT, in which 1.8 million MT consisted of whiting, 1.5 million pollock and 1 million cod. In the past 10 years 1992-
001, pollock has dominated production in Europe with 43% of total whitefish .
0 nd 2001) show the change of production share of each species in 1992 and
Figure 20. Change of production share of each species in 1992 and 2001.
Whiting has the biggest increase in production with the increase of landing quantity rising from 626 thousand MT in 1992 to 1,858 thousand MT in 2001, which represents a growth of nearly 200%. The production share jumped from 11% to 37% of total whitefish production in Europe. Pollock landing volume reached its peak of 4 million MT in 1988, and has decreased year by year. Pollock landing volume has decreased by more than half in the period 1992-2001; production share fell down from 51% to 29% of total whitefish production in Europe in the same period. Although the decrease has occurred most in recent years, pollock is still the most important specie with the highest single landing volume of about 1.5-1.8 million MT annually. In the period between 1992-2001 cod is the second highest species in production in Europe with volume ranging from 1 to 1.4 million MT. Production share is stable with 20% of total whitefish production annually in Europe. However there is an alarm of over fishing of this species. The landing volume stated decreased from 1.44 million MT in 1996 to 1.02 million MT in 2001, a decrease of 30%. Haddock and hake are in the lowest position in production with volume around 200 thousand MT for haddock and 100 thousand MT for hake annually. Other species such as pollack, ling, Norway pout, tusk etc. have considerably less production of about 450 thousand MT annually, accounting for 12% in 1992 and 7% in 2001 of the total whitefish production in Europe. Whitefish production in the world is around 10 million MT per year. The biggest countries of whitefish production are United States and Russia, each accounting for 20%, Norway with 12%, Iceland with 7%, and Argentina with 5% total of the world
2production, following this are hake with 25%, cod with 23% and whiting with 18%There are big changes in production of species in the period 1992-2001, Figures 2(1992 a2001.
2001
Pollock
C %
g; ek; e
; 29%
od; 20
Whitin37%
Oth r; 7%Haddoc
4% Hak ; 2%
1992
5
; akeHad3
1%
12%
Whiting11%
Cod; 20%
Hdock; ; 3%%
UNU – Fisheries Training Programme 58

Nguyen
UNU – Fisheries Training Programme 59
production. The biggest European countries of whitefish production are shown in Table 39.
Table 39: Whitefish production in Europe by country, 1992-2001, 1,000 MT (FAO 2001).
Country 1992 1993 1994 1995 1996 1997 1998 1999 2000 2001 Russia 3,015 2,774 2,382 2,822 3,055 2,854 2,487 2,139 1,848 1,864 Norway 810 883 1,012 1,092 1,186 1,125 1,246 1,141 1,087 1,070 Iceland 405 392 348 322 311 310 393 510 583 685 Faroe Islands 116 127 147 133 134 152 176 207 248 372 Spain 180 167 161 190 183 174 175 186 174 228 Denmark 397 327 262 402 321 282 218 220 280 187 UK 208 243 248 254 261 269 327 296 196 177 France 120 134 129 115 115 125 109 109 125 126 Others 588 523 551 582 455 445 415 358 308 303 Total 5,840 5,570 5,239 5,913 6,020 5,735 5,546 5,166 4,848 5,012 Russia and Norway have the largest production share of whitefish in Europe. These two countries account for nearly 60% of total European production. Production volume of Russia decreased from 4 million MT in 1988 to 1.8 million MT in 2001. Since 1994, Norway has had sustainable production volume with 1-1.2 million MT annually. Iceland has had production volume from 300 to 600 thousand MT per year. The Faroe Islands, Spain, Denmark, the UK, and France have captured more than 100 thousand MT annually. Cod (Gadus morhua) is a whitefish with taste similar to catfish. This fish has succulent, white flesh that flakes easily. Cod is usually sold as steaks or fillets with a price around 4 US$ per kg of fillet. Tra and basa catfish products of Vietnam with high quality and low price can compete against cod products.
Figure 21: Main cod products in European markets: fresh, fillets, and steaks (photo by Globelfish).
In this project, cod species include: Atlantic cod, Pacific cod, polar cod, saffron cod, wachna cod (Navaga), poor cod, and Greenland cod, classified by ISSAACP group (FAO 2001).

Nguyen
Volume of cod production in the world has fallen down from 1.8 million MT in 1992 to 1.3 million MT in 2001. In which the volume from European production accounted for more than 70%. The decrease of European production is the reason for the decrease of the world production in recent years. The largest European countries in cod production are Russia with 300-400 thousand MT, Iceland with 210-270 thousand MT, and Norway with 200-270 thousand MT annually. The three countries account for nearly 70% of total European production of cod. Cod is one of the most important species in the fisheries industry of these countries, especially Iceland. Tra and basa catfish of Vietnam is landed from aquaculture but cod is landed from marine resource. Cod is captured from two main areas: Northeast Atlantic (especially Barents Sea) with 90% and Northwest Pacific with 9% of total cod production in Europe. In recent years a lot of cod stocks have been over-fished. Worldwide, total cod catch has fallen by two thirds in only three decades. Cod, once one of the most important mass fish species, is over-fished. The number of cod capable of reproduction in the North Sea has fallen by 90% (Globefish 2003). There are some areas, which have been closed to rebuild cod stock such as Baltic and north European waters, and Newfoundland of Canada. Norway has planned to produce cod in aquaculture with volume twice as much as the country’ current fishing quota in the period 2015-2020 (Globefish 2003).
UNU – Fisheries Training Programme 60

Nguyen
6.2 European whitefish commodities import and export Commodities of whitefish include: frozen, fresh or chilled, salted, dried, smoked, canned, and prepared. Fresh and frozen are dominating commodities in trade. In this project, whitefish commodities will be classified into three groups such as fresh or chilled, frozen, and prepared products. Prepared products include salted, dried, smoked, canned and other forms. 6.2.1 Whitefish commodities export In recent years, the quantity export of whitefish commodities is around 800 thousand MT. The peak quantity of export is 923 thousand MT, which occurred in 2001 as shown in. table 40 below:
Table 40: Export quantity of whitefish by products, 1992-2001, 1,000 MT (FAO 2001).
Commodities 1992 1993 1994 1995 1996 1997 1998 1999 2000 2001 Frozen 231 256 307 308 347 375 365 354 362 409 Fresh or chilled 168 206 259 288 320 340 333 312 253 243 Prepared 142 139 181 180 212 208 205 188 166 172 Total 541 601 747 776 879 923 902 855 782 824 Frozen products have the biggest export share with more than 300 thousand MT annually, accounting for 40-50% of total export volume. Following this are fresh or chilled products with export share between 30-37% and prepared with a market share between 20-26% of total export quantity annually. Cod is the third largest in volume of production but this species leads in export quantity. See Table 41 below for more information:
Table 41: Export volume of whitefish by species, 1992-2001, 1,000 MT (FAO 2001).
Commodities 1992 1993 1994 1995 1996 1997 1998 1999 2000 2001 Cod 423 464 581 580 646 655 579 569 524 489 Whiting 19 24 27 35 42 67 144 121 95 183 Haddock 47 50 73 80 103 114 98 82 75 77 Hake 49 61 65 79 86 85 80 82 86 73 Export volume annually of cod is between 400-650 thousand MT, accounting for more than 60% of total export volume of whitefish. Haddock and hake have the same export volume share with around 10% for each. In recent years whiting export volume has increased considerably, from 19 thousand MT in 1992 to 198 thousand MT in 2001. In Europe, whitefish was exploited mainly in the North Atlantic Sea, especially the Baltic Sea. Countries around this area seem to have the highest production and export of whitefish, except Russia.
UNU – Fisheries Training Programme 61

Nguyen
Whitefish products accounted for 15% of total export value of the seafood industry in Europe. But in some countries such as Iceland, Norway, and Denmark whitefish is one of most important species of the fisheries industry. This species has made up 40%, 25%, and 18% of the total export value from fisheries industries of Iceland, Norway, and Denmark, respectively. Annual revenue from export of whitefish in European countries is around 2.5 billion US$, the peak value reached 3 billion US$ in 1999. The three top countries are Norway, Iceland, and Denmark accounting for 65%-70% of total export value of whitefish in Europe. Table 42 shows top 10 countries with highest export value of whitefish products.
Table 42: Export value of whitefish by country, 1992-2001, million US$ (FAO 2001).
Country 1992 1993 1994 1995 1996 1997 1998 1999 2000 2001 Norway 628 609 744 822 849 883 997 915 756 707 Iceland 544 428 416 410 406 414 536 613 543 543 Denmark 471 331 480 448 532 493 485 526 444 438 Spain 63 81 101 139 157 143 156 162 155 151 Sweden 26 14 31 47 59 68 82 104 110 145 Germany 144 57 75 87 107 82 100 109 164 141 Netherlands 40 41 53 50 59 103 150 159 101 92 Faroe Islands 38 18 25 34 55 106 122 117 104 89 Poland 16 11 25 21 15 6 58 73 72 75 UK 88 96 85 74 72 69 84 79 60 60 Others 120 166 188 259 218 208 200 211 195 173 Total 2,178 1,852 2,222 2,391 2,529 2,574 2,970 3,067 2,705 2,614 In the period between 1992-2003, Norway earned from export of whitefish products between 600 million and one billion US$ annually, accounting for 30% of the total export value in Europe. The export value for Iceland is around half of billion, accounting for 20% total of export value of Europe; Denmark is around 400 million US$, accounting for 17%. Spain, Sweden, and Germany have an export value of about more than one hundred million US$ in total in recent years. Table 43 shows the export share of cod products between 1992 and 2001. The three categories of products have the same quantity export share by year.
Table 43: Cod commodities export by products, 1992-2001, 1,000 MT (FAO 2001).
Country 1992 1993 1994 1995 1996 1997 1998 1999 2000 2001 Fresh 120 156 201 224 236 235 170 174 159 130 Frozen 169 172 202 179 202 216 209 212 205 194 Prepared 133 136 178 177 208 204 200 183 160 165 Total 423 464 581 580 646 655 579 569 524 489 Fresh or chilled cod exports have fluctuated between 120-230 thousand MT annually. Fresh or chilled form includes two kinds: whole cod and fillets. Fresh whole cod accounts for 80% of the total fresh cod exports..
UNU – Fisheries Training Programme 62

Nguyen
UNU – Fisheries Training Programme 63
Frozen export quantity is between 170-220 thousand MT per year. Frozen products include fillet, roes, minced, and other forms. Fillet forms account for nearly 80% of total export quantity. Atlantic cod has dominated in frozen products with more than 90% total of export quantity. Export volume of prepared or preserved products is from 130 to 200 thousand MT per year. Prepared or preserved products include salted, dried, canned, roes, and others. Salted products are dominating in export with more than 90% of the total export volume of cod in prepared or preserved forms. There are two main salted products; salted or in brine with more than 60% export share, and salted and dried with more than 20% export share of preserved cod products. Three countries have a dominating export share of cod products: Norway, Iceland, and Denmark. Norway exports more than 120 thousand MT annually of cod products, accounting for one-quarter of total European seafood export volume. Iceland and Demark export annually nearly 100 thousand MT each, accounting for one-fifth of total export volume of cod products in Europe. Figure 22 shows the export share of cod products in its varied forms in 2001.
Figure 22: Export quantity share of fresh/frozen/prepared cod in 2001 by country (FAO 2001).
In 2001, Denmark led in exporting fresh or chilled cod product with 29% of total cod export quantity in Europe. Following Denmark are Norway with 14%, Iceland and
Prepared ot preserved
Iceland 22%
Denmark 13% Sweden
7%Faeroe
5%
Others 14%
Norway 39%
Frozen
Denmark 16%
Germany 9% Poland 9%
Netherland 7%
Others 13%
Iceland 24%
Norw ay 23%
Fresh or chillied
Denmark 29%
Norway 14%
Sweden 11%
Iceland 11%
Russia 10%
Others 25%
Figure 6.4: export quantity share of fresh/frozen/prepared Cod, by country, 2001, FAO

Nguyen
Sweden with 11% each, and Russia with 10%. Iceland and Norway led in exporting frozen with almost the same share in total export volume about 24% for Iceland and 23% for Norway. Following them are Denmark with 16% and Germany and Poland with 9% each. Norway dominated in prepared or preserved products with a 39% export share; Iceland with 22% and Denmark with 13%. Salted cod product has the biggest portion in prepared or preserved cod products of Norway, Denmark, and Iceland. It accounts for more than 90% of the total export volume of this product form. 6.2.2 Whitefish commodities import European countries import more than one million MT of whitefish annually, accounting for around 10% of total import volume of all fisheries commodities. There are three kinds of whitefish products imported for food consumption: frozen, fresh, and prepared. The import volume of whitefish commodities exceeds export volume by 300 thousand MT annually, mainly exceeding by frozen product. Table 44 shows the import quantity of whitefish commodities by products in the period 1992-2001.
Table 44: Import volume of whitefish by product, 1992-2001, 1,000 MT (FAO 2001).
Products 1992 1993 1994 1995 1996 1997 1998 1999 2000 2001 Frozen 521 551 612 586 651 628 656 636 620 682 Fresh 232 234 317 315 344 334 282 289 268 256 Prepared 145 158 180 190 215 211 201 187 165 171 Total 898 942 1,109 1,091 1,210 1,173 1,139 1112 1,054 1,110 In the period 1992-2001, European countries imported whitefish commodities with an average volume of 600 thousand MT of frozen, 290 thousand MT of fresh, and 180 thousand MT of prepared or preserved products per year. The frozen products accounted for more than 50%, fresh product nearly 30%, and prepared products nearly 20% of the total import volume. Cod is dominant, accounting for 60% of the total import volume, followed by hake with 30% and haddock and whiting with only 10%. Table 45 shows more details about the import volume of whitefish by species.
Table 45: Import volume of whitefish by species, 1992-2001, 1,000 MT (FAO 2001).
Species 1992 1993 1994 1995 1996 1997 1998 1999 2000 2001 Cod 592 598 694 679 746 725 675 674 625 651 Hake 249 287 337 328 364 349 370 350 330 346 Haddock 47 46 58 67 86 82 77 70 69 79 Whiting 10 10 20 17 15 17 17 19 29 33 Total 898 942 1,109 1,091 1,210 1,173 1,139 1,112 1,054 1,110 Cod imports ranged from 600-780 thousand MT per year in the period 1992-2001, of which 50% is frozen and the rest is fresh or prepared with 25% each.
UNU – Fisheries Training Programme 64

Nguyen
Hake imports were about 330 thousand MT per year of which 80% is frozen and 20% fresh or chilled. Prepared hake is not considered. The haddock import volume is about 80 thousand MT annually, in which fresh and frozen account for 50% each. Whiting had the smallest import portion, about 10-30 thousand MT, mainly in the frozen form. In the period 1992-2001, European countries spent about 3-3.5 billion US$ to import whitefish products for food consumption. This figure seems to have been stable over the years. The markets with the biggest import share are the UK, Spain, Portugal, and France. Table 46 shows in more detail, the import value of the biggest markets in Europe.
Table 46: Import value of whitefish by country, 1992-2001, million US$ (FAO 2001).
Country 1992 1993 1994 1995 1996 1997 1998 1999 2000 2001 UK 540 414 398 408 461 459 582 596 591 590 Spain 537 497 519 580 577 531 610 605 536 589 Portugal 490 387 403 457 460 409 505 597 444 486 Denmark 271 191 328 330 336 299 321 344 312 317 France 266 215 238 256 282 249 287 280 246 250 Italy 249 217 235 220 259 226 259 254 211 246 Norway 149 113 124 173 157 173 218 235 205 204 Germany 188 144 181 192 206 216 254 205 198 197 Netherlands 57 56 76 121 127 143 167 189 149 164 Sweden 39 32 43 62 64 81 104 121 123 161 Others 137 124 161 185 212 200 270 246 218 215 Total 2,924 2,390 2,708 2,983 3,142 2,986 3,577 3,673 3,232 3,419 In the period 1992-2001, Spain imported whitefish products with the highest value about 550 million US$ per year, following are the UK with 500 million US$, Portugal with 450 million US$, Denmark with 300 million US$, France and Italy with 250 million US$ each, and Germany with nearly 200 million US$. Spain also leads in import of whitefish in quantity with about 200 thousand MT per year, of which more than 50% is frozen, 35% is fresh and the rest is prepared. The UK market imported about 160 thousand MT of whitefish products, in which frozen products accounted for more than 70%, fresh accounted for 25%, and the rest was prepared. Prepared or preserved products are imported in the highest volume to the Portuguese market with more than 50% of the total 145 thousand MT of whitefish per year. The frozen import share of this market is about 45% of the total import volume. Fresh products seem not to be attractive in Portugal. Prepared or preserved products imported into Portugal are mainly in the salted form.
UNU – Fisheries Training Programme 65

Nguyen
France imported about 80 thousand MT of whitefish products, half of which were frozen, and nearly 40% fresh. The import volume of these products in Germany and Italy is about 60 thousand MT per year. Cod was imported with the greatest share, about 60% of total volume and 70% of total value of whitefish imports in European markets; see Table 47 for cod volume imports. Annually the markets import around 300 thousand MT fresh, 200 thousand MT frozen, and 140 thousand MT prepared or preserved cod.
Table 47: Cod commodities exports by products, 1992-2001, 1,000 MT (FAO 2001). Commodities 1992 1993 1994 1995 19 96 1997 1998 1999 2000 2001
Fresh 279 276 288 264 295 292 313 319 313 350 Frozen 145 157 179 189 214 209 199 185 163 168 Prepared 169 165 226 226 237 223 163 169 150 133 Total 592 598 694 679 746 725 675 674 625 651
Fresh products are dominant among imported cod products, accounting for 44% of the total import quantity. Frozen and prepared have the same import shares with 28% each. Figure 23 below shows the import share of each cod product in the European markets.
UNU – Fisheries Training Programme 66

Nguyen
UNU – Fisheries Training Programme 67
Figure 23: Import volume share of fresh/frozen/prepared cod in 2001 by country (FAO 2001).
In 2001, fresh or chilled cod products were imported into Denmark with the highest share (about 27%) of the total import volume in Europe. It is probable that this volume was used for re-export because Denmark also exports this product with the highest share followed by France with 17%, the UK with 14%, Norway with 12%, the Netherlands with 8%, and the remaining 23% for other markets. Portugal is the market leader in import of prepared or preserved cod with 35% of the total import volume in 2001. Almost all of the prepared or preserved cod products are in the salted form. Denmark and Spain have the same import share of the products with 12% of total volume. The import share of Italy, the Netherlands, Sweden, and France were similar, from 9% to 7% each. Frozen cod was imported into the UK with 27% of the total import volume in Europe in 2001 followed by Norway with 18%, Portugal and Denmark with 10% each, Germany with 7%, and Russia, France, and Spain with 5% each. Table 48 shows the net imports of frozen and fresh whitefish annually to the European countries. The table reveals the potential markets and competitors for whitefish
Fresh or chilled
France; 17%
UK; 14%
Netherlands; 8%
Others; 23%
Denmark; 25%
Norw ay; 12%
Frozen
Norw ay; 18%
Portugal; 10%
France; 5% Spain; 5%
Others; 14%
Denmark; 10%
UK; 27%
Russia; 5%
Germany; 7%
Frepared or preserved
Spain; 12%
France; 6%
Others; 10%
Netherland ; 8% Sw eden;
7%
Portugal; 35%
Italy; 9%
Denmark; 12%

Nguyen
exporters in general and catfish exporters in particular. Prepared whitefish with a low volume in trade is excluded in the table.
Table 48: Net imports of fresh/frozen whitefish, average of 1997-2002, MT (FAO 2001).
Country Import Export Net import Spain 194,493 53,588 140,905 UK 161,727 64,085 97,642 Portugal 70,479 6,547 63,932 France 69,605 7,051 62,554 Italy 45,974 2,512 43,463 Germany 53,385 41,538 11,847 Belgium 16,491 7,335 9,156 Greece 6,377 219 6,158 Czech Republic 2,553 184 2,368 Austria 1,858 0 1,858 Romania 1,666 0 1,666 Hungary 1,558 0 1,558 Estonia 1,432 269 1,163 Latvia 0 2,438 -2,438 Sweden 16,940 22,573 -5,633 Ireland 5,054 13,025 -7,971 Denmark 84,485 97,249 -12,765 Netherlands 44,624 60,694 -16,071 Faroe Islands 2,808 22,053 -19,245 Russia 4,714 34,256 -29,542 Norway 101,384 134,011 -32,627 Iceland 6,599 77,490 -70,891 Total Europe 1,117,541 669,382 448,159 The net import of fresh and frozen whitefish in Europe is about 448 thousand MT on average. Spain is the biggest market with a net import of 141 thousand MT, followed by the UK with 98 thousand MT, Portugal with 64 thousand MT, France with 63 thousand MT, Italy with 43 thousand MT, Germany with 12 thousand MT, and Belgium with 9 thousand MT. These are probably target markets for whitefish exporters. Besides these markets, Greece, the Czech Republic, Austria, Romania, Hungary, and Estonia also have positive net imports of whitefish with an average of 15 thousand MT per year. Iceland has the highest net export with 71 thousand MT per year on average followed by Norway with 33 thousand MT, Russia with 30 thousand MT, the Faroe Islands with 19 thousand MT, the Netherlands with 16 thousand MT, and Denmark with 13 thousand MT. These are the main competitors of whitefish exporters. Ireland, Sweden, and Latvia also have positive net exports with a total of 16 thousand MT per year on average.
UNU – Fisheries Training Programme 68

Nguyen
6.3 Catfish markets Catfish products are not popular in the world in general and Europe in particular. There are some countries that produce catfish in both capture and aquaculture such as the United States, Thailand, Indonesia, Malaysia, Nigeria, Mali, Russia and Vietnam. The species with the highest production are channel catfish, catfish hybrid, torpedo-shaped catfish, striped catfish, North African catfish, pangas catfish, upside-down catfish, glass catfish, and bagrid catfish. Total catfish production in 2001 was 535 thousands MT, 3% greater than in 2000 and 40% above the 1990 level. Aquaculture accounted for more than 80% of the total catfish production in the period 1992-2001.
Table 49: Aquaculture catfish volume in the world, 1992-2001, 1,000 MT (FAO 2001). 1
Country 1992 1993 1994 1995 1996 1997 1998 1999 2000 2001 US 207 208 199 203 214 238 256 271 269 271 Thailand 38 43 47 56 58 68 69 84 89 87 Indonesia 6 8 10 13 16 24 20 27 32 37 Malaysia 1 1 1 2 2 5 7 11 12 14 Others 62 63 65 64 98 104 45 53 17 18 Total 314 323 322 337 387 438 396 446 419 427 Total catfish aquaculture in the world was 427 thousand MT in 2001, more than 36% higher than in 1992. The United States dominated catfish aquaculture with 200-300 thousand MT per year, accounting for more than 60% of the total aquaculture volume in the world in the period 1992-2001. Thailand is second in catfish aquaculture, but the volume was only between 40-80 thousand MT per year. Malaysia and Indonesia have a small volume of catfish aquaculture with some thousand MT each per year. The biggest species in aquaculture are channel catfish with more than 60%, torpedo-shaped catfishes with nearly 20%, and catfish hybrid with 14% of the total catfish aquaculture in the period 1992-2001. Catfish capture makes up a very small portion of the total fisheries capture in the world with around 100 thousand MT per year. Nigeria, Mali, Indonesia, and Russia are the countries with the highest volume of catfish capture in the world. This volume is used for domestic consumption. See Table 50 for more details.
Table 50: Capture catfish volume in the world, 1992-2001, 1,000 MT (FAO 2001).
Country 1992 1993 1994 1995 1996 1997 1998 1999 2000 2001 Nigeria 10 13 19 20 19 24 35 34 22 34 Mali 22 21 20 43 26 25 23 23 35 32 Indonesia 16 16 16 15 18 16 14 16 12 13 Russia 6 4 4 5 6 7 9 7 7 7 Others 14 19 13 16 14 15 17 19 22 22 Total 69 73 72 99 82 87 98 99 99 108
1 Data on Vietnamese catfish production is not available in FAO, the total does not include Vietnam.
UNU – Fisheries Training Programme 69

Nguyen
Three main species of catfish are traded in European markets; European catfish (Silurus glanis), African catfish (Clarias gariepinus), and channel catfish black bullhead –(Ictalurus melas) (Rudiger 1998). European catfish is caught in rivers and lakes in small, often unrecorded amounts. There are also farming activities, with a production of 350 MT in both Germany and Poland, 300 MT in France, and 25 MT in the Czech Republic in 1997. The fish are of high value in Central and Eastern Europe, but mainly sold regionally in the areas where they are caught and are very popular around the Danube River (Rudiger 1998). European catfish is usually sold chilled, whole or in cuts, retail and wholesale, and is found regionally in restaurants (Rudiger 1998). African catfish is farmed in warm water plants in the Netherlands and Belgium. In 1997 Dutch production was 1,000 MT and Belgium produced 150 MT. These figures have been stable over recent years. This fish is sold whole and in boneless fillets of various sizes, more often chilled than frozen. It is also smoked. France and Germany are good markets for the product (Rudiger 1998). Channel catfish is farmed and sold in Italy where production reached the peak of 2,000 MT in 1994, dropping to 400 MT in 1995 and becoming stable at 500 MT in 1996 and 1997 (Rudiger 1998). The United States is the biggest catfish exporter. The total export volume of US catfish products reached a peak of 295 MT in 1996, dropping to 132 MT in 1997, and only 80 MT in 2001 (FAO statistics). The main markets for US catfish are some European countries with channel catfish. As of 1993, the US catfish industry focused on the German market for introduction of channel catfish. Considerable amounts of money were spent on a marketing campaign to establish the white catfish fillets in catering, restaurant and retail markets. Catfish exports to Germany were 38 MT in 1994 but rose to 238 MT in 1995 and 363 MT in 1996. In 1997, US catfish export declined to 214 MT; the Catfish Institute in Germany put this down to the rising US$ exchange rate and the end of the American boom which reached its zenith with the Olympic Games in Atlanta in 1996 (Rudiger 1998). 6.4 Summary Whitefish is a popular species in Europe. Annually the quantity of whitefish production in Europe is around 5 million MT, accounting for 25% of the total fish production of Europe, and more than half of the whitefish production in the world. Pollock is dominant in production, followed by hake, cod, and whiting. Russia and Norway have the largest production shares of whitefish in Europe. These two countries account for nearly 60% of the total production of Europe. Whitefish commodities are traded in three kinds of products: frozen, fresh or chilled, and prepared or preserved. In recent years, the quantity of exports of whitefish commodities has been around 800 thousand of MT. In which frozen products have been dominant with nearly 50% of the total export volume of whitefish products. Fresh or chilled lightly have a greater share of export quality compared to prepared or preserved products. Annual revenues from the export of whitefish products in Europe
UNU – Fisheries Training Programme 70
Nguyen
are around 2.5 billion US$. The three top countries are Norway, Iceland, and Denmark accounting for 65%-70% of the total export value of whitefish in Europe. European countries import more than one million MT or more than 3 billion US$ in value in terms of whitefish annually. The import volume of whitefish commodities exceeds export volume by about 300 thousand MT annually, mainly because of frozen product. Spain imports the highest volume of whitefish products with about 200 thousand MT per year; frozen products constitute more than 50% of the total import volume. The UK market imports about 160 thousand MT; frozen products are dominant with more than 70% of the total import volume. Prepared or preserved products are imported at the highest volume to Portugal with more than 50% of the total 145 thousand MT of import volume of whitefish into this market per year. France imports about 80 thousand MT of whitefish products, half of which are frozen. Cod (Gadus morhua) is a kind of whitefish that tastes similar to catfish. This fish has succulent, white flesh that flakes easily. The volume of cod production in the world has dropped from 1.8 million MT in 1992 to 1.3 million MT in 2001. In which the volume from European production accounted for more than 70%. In recent years a lot of cod stocks have been over-fished. This presents a good opportunity for catfish to fill the gap. Cod is one of the most important species of the Icelandic, Russian and Norwegian fishery industries. Cod products are exported in Europe at around 500 thousand MT per year. Frozen, fresh and prepared products have similar shares. Cod dominates imports among whitefish commodities with 600-780 thousand MT per year, accounting for 60% of the total import volume. Fresh cod dominates the import quantity of cod products. The countries with the highest volume of cod imports are Denmark, France, the UK, Germany, Spain, Italy, Portugal and Sweden. Catfish products are not popular in the world in general and Europe in particular. Total catfish production in 2001 was 535 thousand MT, in which aquaculture accounted for 80%. The United States are dominant in catfish production with more than 60% of the total production in the world. Channel catfish was landed with highest volume. As of 1993, the US catfish industry focused on the German market for the introduction of channel catfish. In Europe small quantities of catfish are captured and farmed in rivers and lakes. Almost all of catfish production is used in regional consumption. In conclusion, there is great potential for Vietnamese catfish exports into European markets if it can substitute and compete with other whitefish. The popular consumption of whitefish, especially cod, is similar to catfish, high demand for whitefish coupled with the decrease in whitefish production because of exhausted resources provide a good opportunity for catfish to enter into these markets.
UNU – Fisheries Training Programme 71

Nguyen
7 SWOT ANALYSIS AND SUGGESTIONS Vietnamese seafood products are exported to 77 countries and territories. The US and Japan are the largest markets (Vietnam Economy newspaper, Dec.18.2003). It is important that efforts be made to diversify markets so that exporters do not become too reliant on one market, like the US. The US won a lawsuit last year against Vietnamese seafood exporters dumping catfish on the US market, an allegation Vietnam continues to denounce. This year, 2004, in another anti-dumping case, the US Southern Shrimp Alliance has filed a petition against six countries, including Vietnam, seeking to impose a 30% to 200% tariff on shrimp exports. European markets have huge potential for Vietnamese seafood but the market share is still modest. Vietnamese enterprises and function-agencies will target European markets in the near future. It is necessary to improve exporting commodities in those markets and aim conduct exporting programmes in the beginning of the developing period as well as avoiding the risk of depending on one unique market. This chapter will explore the strengths, weaknesses, opportunities and threats for Vietnamese seafood products exported to the European market in order to give suggestions and ideas for seafood enterprises’ entrance into this. 7.1 SWOT Analysis 7.1.1 Strengths Vietnam has great potential resources to develop its fishery sector. Vietnam has a relatively large water surface area, including 653,000 ha of rivers and canals, 394,000 ha of reservoirs, 85,000 ha of marshes and swamps, 1 million ha of coastal saline land, and 580,000 ha of wet rice fields (Fisheries Ministry of Vietnam). Favourable environment, hard work of farmers, high technology in processing plants, and abundant labours are important factors for the development of the Vietnamese seafood industry to produce high quality and low price of seafood products. Vietnamese fish products have made a good impression in local business circles. “Vietnam has already made good progress in breaking into the European market. This makes sense for a developing country, which has low cost, rich agriculture fishery resources and a lot of potential” (Vietnam Economy Newspaper, 2004). Farmers, fishermen, and producers can satisfy requirements from markets regarding quality, diversification, and sanity of products. Tropical seafood products that have a good palate and are high in protein have attached importance in European countries. Vietnamese seafood products have abundant categories of all types of products such as fresh, frozen, canned, value-added, and ready to eat. Being supported by state agencies, Vietnamese producers have understood and corrected quickly when they meet claims from importers and state agencies of importing countries, especially in sanitary issues. The fisheries sector has directed to update and improve quality standard in order to gain HACCP and ISO certificates. Presently there are 100 seafood enterprises, which qualify to enter European markets (Ministry of Fisheries of Vietnam).
UNU – Fisheries Training Programme 72

Nguyen
The Ministry of Fisheries plans to set up 12 no-anti-bio residue aqua-product areas in Thanh Hoa, Binh Dinh, Khanh Hoa, Ben Tre, Tien Giang, Dong Thap, An Giang, Bac Lieu and Kien Giang provinces (Ministry of Fisheries of Vietnam). These provinces will produce fresh and high quality products to export into efficient markets such the EU. This is a strong aspect in Vietnamese aquaculture in the near future. 7.1.2 Weaknesses Vietnamese seafood exports to the EU have faced technical barriers such as strict control of chloramphenical and nitrofuran residues. Satisfying standards of European sanitary is most important to penetrate European markets. Many processing plants of Vietnam are still small in scale. Almost all of them are producing in households. Controls on the aquaculture of farmers are still not strict in some regions. The raw material resources from aquaculture and capture sometimes do not meet the demand of processing plants. These lead to inconsistencies in the quality of raw materials and output products. However, in recent years Vietnamese enterprises have tried to solve this weakness by cooperating closely with farmers and small plants to advance the technology level of the farmer and control contamination as well as chemical residues The raw material is usually lower quality due to poor and primitive fishing gears and handling equipment. In addition, the raw material transportation has to transit through many intermediate steps, which also decreases the quality. The raw material from fishing and from aquaculture does not ensure high quality products. The quality of products is not stable in some firms. Some types of Vietnamese seafood have not whetted European palates. The traditional products in eastern countries with rich protein such as fish sauce (fermented products), and stockfish have not been accepted and are interesting in western countries only due to their odours or habits of consumption. “Vietnamese seafood exporters have long complained that they lack necessary information about the foreign markets. Without help from trade commissions abroad, it will continue to be difficult for them to promote their products” (Vietnam News Jun 24 p 15). Vietnam has just opened its economy 10 years ago so almost all Vietnamese enterprises have limited experience in foreign markets. The capacity for picking up the latest market information and taste of consumers is a weakness of Vietnamese enterprises. Vietnamese enterprises lack the latest information and necessary business skills even with traditional partners in the EU market. 7.1.3 Opportunities Fishery products have been acknowledged to offer many healthy benefits. The trend of healthy eating in developed countries has underpinned rising demand for seafood and fish. In addition, heart health has become a major issue among modern consumers. Consumption of red meat has declined in many key markets; seafood has stepped into the gap. Over the next five years, the sale of fish and seafood in five countries including France, Germany, Italy, Spain, and the UK will most likely
UNU – Fisheries Training Programme 73

Nguyen
increase by only around 4%, reaching an estimated volume of 3.2-3.3 million tons in 2004 (Hardy 2001). Vietnam has an advantage from its geographic position. The EU sees Vietnam as a valuable partner in its approach towards the Asian region. Many European countries such as France, Germany, Spain, and the UK have granted Vietnam priority during its development. The EU is an important market with great potential for Vietnam to promote exports of seafood. Vietnam-EU relations were officially established in 1990, but the relationship of Vietnam with each EU country had taken shape a long time ago. Vietnam and the EU have been in the process of implementing the cooperative strategy for 2000-2005. The EU has announced that Vietnam will be an important partner in the 21st century. EU expansion will bring about opportunities for Vietnam to boost trade cooperation with EU countries. Ten new members of the EU as of May 2004 are former socialist countries and are traditional partners of Vietnam for many years. The large population of countries such Poland and Hungary make for good potential markets not only of seafood but also of other agricultural and soft industrial products. Tariffs on Vietnamese exports to the EU will be unchangeable when the EU expands its members from 15 to 25. The agreements signed between the EU and Vietnam will lay a foundation for enterprises of the new members to establish trade relations with Vietnam. The EU is one of the world’s most open markets to imports of farm products from third countries and especially from developing countries (Directorate General Trade, European Commission) and these markets have a high demand for seafood, especially shrimp. Tra and basa catfish will have potential markets in Europe. Germany, with a population of 82 million, many of whom are overseas Vietnamese community, is a large market with a huge demand for tra and basa catfish products. Spain is a new market, but some Vietnamese businesses have exported to this country a volume of tra and basa catfish fillets similar to the US market in the past. Other countries such as Belgium, the Netherlands and Switzerland have a huge demand for Vietnamese tra and basa catfish and other seafood (Vietnam Economy Newspapers 2003). Increasingly hectic lifestyles, smaller households and individual states, and growing numbers of working women are resulting in a greater demand for convenience foods such as processed and prepared fish products. “There is a significant drive throughout many European markets towards increased consumption of added-value products such as fish ready meals and fish delicatessen prepared products” (Hardy 2001). Hand-products have huge potential in seafood processing. 7.1.4 Threats The EU is a lucrative market with many technical obstructions. The EU imposes strict requirements on countries and companies that wish to export seafood to its markets, and must maintain their condition to remain on the list. The chloriamphenocal and
UNU – Fisheries Training Programme 74

Nguyen
nitrofuran residues exceeding EU requirements is a potential threat for Vietnamese exporters. The methods to control and ensure safety are not conducted thoroughly, still having a risk of toxic chemical residues in products. The efforts on producing biological drugs to replace banned chemical substances have not been successful as successful as expected. Chemical substances and feed for cultured items with banned components have been sold in many localities (Vietnam Economy Newspaper, 2003). These do not ensure fresh and safe inputs. The risk of unsatisfied requirements of EU sanitary regulations for importing products is still high. The second threat to Vietnamese enterprises is the capacity for keeping existing markets. Most seafood enterprises do not have their own trademark for their products. This leads to difficulties in expanding, promoting and protecting the markets (Vietnam Economy Newspaper, 2003). The strong development in aquaculture of countries such Thailand, India, China, Bangladesh, Ecuador also threatens Vietnamese seafood exporters in the international market. Table 51 below summarises the SWOT analysis.
Table 51: Summary of the SWOT analysis of the Vietnamese seafood industry.
Strengths - Low cost, good palate, and high quality
products - Diversifying products, satisfying quickly
requirements of customers - Potential to develop the no-anti-bio aqua-
product areas with high quality raw material
Opportunities - Rising demand for seafood in developed
countries - EU countries consider Vietnam an
important partner - EU expanding in 2004 - Shrimp is most important seafood
product, and catfish has been introduced in European markets
Weaknesses - Many small processing plants have
difficulties in satisfying sanitary requirements
- Less value added products - Poor handling of raw material post-
harvesting both in capture and aquaculture
- Europeans are not used to the taste of some traditional products
- Lack of market information and business skills of Vietnamese enterprises.
- Lack of trademarks for Vietnamese seafood.
Threats - Risk of withdrawn licenses of importing
rights of enterprises due to unsatisfied sanitary requirements
- Loss of existing markets and faith because of limited product trademarks.
- Strong competitors such as Thailand, China, India, Bangladesh and Ecuador
UNU – Fisheries Training Programme 75

Nguyen
7.2 Suggestions • Control and monitor strictly food sanitary regulations. The Vietnamese agencies and seafood enterprises have done well in implementing the requirements of the EU on food safety in the past. At the end of 2003 there were 100 seafood enterprises that had qualified to export their products to European markets. But the risk of withdrawn licenses is still high if Vietnamese enterprises do not perceive sanitary regulations as a vital issue. The Fisheries Ministry should make a plan for transferring some rice-cultivated areas to experimenting with non-chemical aquaculture. The fresh inputs will assure safe output. Moreover fisheries aquaculture with higher effects than rice cultivating is a true forward step to reduce poverty in rural region. Seafood exporters and producers must meet strict hygiene and safety standards to gain admission to European markets. All fish supplied to processing factories must be accompanied by a certificate of origin. This requires cooperation between processors, farmers, and state agencies. Vietnamese enterprises should keep good relations with traditional partners to widen their trade relations with newcomers in the EU market. If one domestic enterprise cannot afford to meet requirements of market expansion, it should coordinate with others to complete its goals. Vietnam should develop early a good regulatory framework for consumer protection. An objective and credible system of risk assessment must be based on independent science. • Promote trade, expand existing markets, and penetrate new markets Markets such as France, Spain, Germany, Belgium, Italy, the Netherlands and the UK need to be protected and expanded. These markets are vital for Vietnamese seafood exports. The high quality products are targeted to these markets. These markets have high and stable demand but Vietnamese enterprises have not yet exploited in full their potential. Vietnam should promote export to traditional markets such as Russia, Poland, the Ukraine, and Hungary. The Russian economy is growing and has been stable in recent years. There is increasing demand for imports, especially food commodities. In recent years these markets have not been penetrated as much as possible. To diversify risk form different markets, it is necessary to promote exports into these markets. Moreover Russia, the Ukraine and Romania have a long history of trade with Vietnam. These traditional markets do not require high quality products or have strict sanitary regulations like others such as the EU. It is necessary to support finance for Vietnamese exporters through the Vietnam Association of Seafood Exporters and Producers (VASEP). Many enterprises face financial difficulties in looking for new markets, especially small firms. These firms cannot afford to advertise, exhibit, and research markets abroad.
UNU – Fisheries Training Programme 76
Nguyen
• Construct trademarks for Vietnamese seafood products Until now, most seafood enterprises have not built their own trademarks. The main reason for this is that Vietnamese seafood enterprises have to export through intermediate countries or through importer-owned distributing channels. Vietnamese exporters have to pack their products using these intermediate trademarks. These intermediates already have experience and positioning in the world markets (Vietnam Economy Newspapers, Dec.12.2003). Lack of trademarks of products is one of the main barriers that almost all Vietnamese enterprises are confronting. The Vietnamese products cannot compete with other competitors if they do not have their own trademark. Constructing trademarks for the products should be a long-term strategy development. This work must be synchronous with all stages from breeding collection, culturing, harvesting to the post-harvesting handling stage. Moreover, to appear in the markets it is necessary to build wide distributing channels to give consumers products with careful collection and interesting wrappings. Cooperation between scientists, farmers, distributors, advertisers, and state agencies is necessary in order to promote the trademark for products in local markets and regional markets. • Promote the production of value added products Value added products still account for a small portion of the total export category. Frozen or chilled products are the main export items accounting for more than 80% of the total. The frozen products fetch a low price but have high transportation costs. In order to protect the market and expand into new markets, it is necessary to diversify the products. Value added products with convenience usage and good packaging are new trends for seafood producers and exporters. These products have advantages of transportation and storage as well as a high price. Moreover, Vietnamese exporters should target the markets for older consumers and children. The quality of life is higher; people live healthier and active lives until a much later age. Seafood is known as a healthy product with substantial nutritional benefits. To meet the demands of the childrens market, seafood products should promote a safe, such as boneless and skinless, easy to eat, as well as a user-friendly image.
UNU – Fisheries Training Programme 77

Nguyen
7.3 Summary Vietnam has great potential to enter the European seafood market but also has a strong threat of losing this market. In order to keep and expand their market share, enterprises and agencies must take great care to meet food sanitary regulations. The vital markets are France, Spain, Germany, Belgium, Italy, and the UK. Markets such Russia, Poland, the Ukraine and Hungary also need a penetrating strategy. Constructing the trademark for Vietnamese seafood products must be done as soon as possible. This issue needs the support of the government and the awareness and effort of enterprises. Diversifying products and changing the portion of export products towards increasing value added items are a main trend in the near future.
UNU – Fisheries Training Programme 78

Nguyen
8 CONCLUSION Vietnam has huge potential in fisheries development both marine capture and aquaculture. The fisheries sector has created one million jobs each year and earned more than 2 billion US$ from export. Seafood has the third highest export value in the economy of Vietnam. Looking for new markets to diversify risks from depending on a single market is necessary for Vietnam. The European continent includes 45 countries with nearly nine hundred million people and is a huge potential market for seafood exports. In addition almost of all countries in Europe have high incomes. These markets demanded high quality products. Fisheries production in Europe has increased constantly in the past decades but it has not been able to supply the increasing demand for seafood products in the continent. In recent years, the fisheries landing volume of Europe has been about 18 million MT per year. In which 90% is exploited from natural resources and only 10% from aquaculture. Most of the landing volume was produced from countries such as Russia, Norway, Iceland, and Denmark. Freshwater fish is a small portion of the landing volume. European countries export fishery commodities from 15 to 19 billion US$ in value and from 8 to 10 million MT in volume annually. Most of them were exported into other European countries. Iceland, Norway, Denmark, and Russia are the largest seafood exporters. European countries import fisheries products for 22-23 billion US$ in value and around 11 million MT in volume annually. Most of them were used for food consumption. The annual net import value of seafood imports in Europe are about 4 billion US$. Net import per total supply is about 17%. The biggest importers are Spain, France, the UK, Germany, Belgium, Italy, and Portugal. Average seafood consumption of European people is around 20 kg per year. This number is much higher than the average 15 kg of the world as a whole. The countries with highest consumption per capita are Iceland (90), Portugal (76), Norway (51), Spain (45), Malta (40), Finland (35), France (31) and Sweden (31). European shrimp production expanded very impressively during the past decades. In 2001 the total catches reached 239thousand MT, nearly two times the catches in 1980. The three main species landed are northern prawn (Pandalus borealis), common shrimp (Crangon crangon), and deepwater rose shrimp (Parapenaeus longirostris). In which Pandalus borealis species accounts for 70% of the total landing volume. The highest landing countries are Norway, Iceland, Spain, Russia, and Faroe Islands. In 10 years from 1992-2001 imports of shrimp to Europe increased by 50% and reached peak of 667 thousand MT in 2001. Frozen products account for more than 70% of the total import volume of various shrimp species. France, Spain, Demark, the UK, Belgium, Italy, and Germany are the biggest shrimp importers in Europe.
UNU – Fisheries Training Programme 79
Nguyen
The price of fisheries products in general and shrimp products in particular have decreased in recent years. The main reason is the advantage of aquaculture in developing countries. In the past 10 years 1992-2001 whitefish production had a stable production volume with 5-6 million MT per year. The production has dropped slightly in recent years with a volume of 4.8 million MT. Russia and Norway have the largest production share of whitefish in Europe. These two countries account for nearly 60% of the total European production. Pollock and cod are the dominating species in production. But these two fisheries have been over-exploited in recent years. Whiting now has the highest share of whitefish production. The decrease in cod landings due to exhausted resources presents opportunities for catfish entering the European markets because these two species have similar tastes, succulent and white flesh. Annually European countries have a net import of frozen whitefish of nearly 300 thousand MT. Fresh and prepared products are equal in import and export. The export value of whitefish is about 2.6 billion US$ and the value of whitefish imports is about 3.3 billion US$ per year. Norway, Iceland, and Denmark are the biggest export countries; the UK, Portugal, Spain, Italy, France, and Germany are the biggest import countries. Catfish products are not popular in the world in general and Europe in particular. Catfish production in the world is more than 500 thousand MT per year. More than half of the quantity was produced from aquaculture in the United States with the channel catfish species. Catfish is captured in some European countries but is used in the region of landing. As of 1993, the US catfish industry focused on the German market for the introduction of channel catfish. They had a marketing campaign to establish the white catfish fillets in catering, restaurants and retail. But until now the campaign seems not to have been successful. There is huge potential for Vietnamese catfish exports into the European market if it can substitute and compete with other whitefish, especially cod. Demand for seafood has increased in Europe because of increasing concern for healthy eating. The changing demographic and societal trends lead to an increase in the demand for value added products in developed countries. To expand its share in the European market, the seafood industry of Vietnam needs to exploit its advantages and overcome the disadvantages. Low cost, high quality and diversifying products, rising demand for seafood in developed countries and friendly partners in the European countries are the primary strengths and opportunities of the Vietnamese seafood industry. On the other hand, issues of high sanitary standards, handling of raw material, lack of information on export markets, weak skills in foreign markets of businessmen, and lack of product trademarks are the main weaknesses and threats of the Vietnamese seafood industry. Based on studying the European seafood market and the SWOT analysis, the project offers the following suggestions for Vietnamese seafood:
- Control and monitor strictly food sanitary regulations - Promote trade, expand existing markets, and penetrate new markets - Construct the trademark for Vietnamese seafood products
UNU – Fisheries Training Programme 80

Nguyen
- Promote to produce value added products. There are still great opportunities for Vietnamese seafood exporters expanding their share in the existing markets such as France, Spain, Italy, Germany, the UK, Portugal, Belgium, and Luxembourg. The markets such as Sweden, Poland, the Netherlands, Switzerland, Denmark, Greece, and Russia also have potential to penetrate in the future.
UNU – Fisheries Training Programme 81

Nguyen
ACKNOWLEDGEMENTS This project would not have been possible without the support, supervision and influence of many people to whom I owe great thanks. First of all I would like to give many thanks to United Nation University (UNU) for granting me the opportunity to attend the Fisheries Training Programme. I gratefully thank my supervisor Dr Eyjolfur Gudmundsson, Assistant Professor, Faculty of Natural Resource Sciences of Akureyri University for his great advice and encouragement. My special thanks go to Dr. Tumi Tomasson and Mr Thor Asgeirsson, for their assistance during my stay in Iceland. I would also like to thank Mr Arnljótur Bjarki Bergsson (ABB), of Akureyri University, for his assistance during my stay in Akureyri. I would also thank all of the staff at the University Akureyri, Icelandic Marine Research Institute and the UA Company for allowing me to collect data and documents. Finally, thanks to all of the fellows in the 2003-2004 course, especially thanks to the Policy and Planning group and the Akureyri group.
UNU – Fisheries Training Programme 82

Nguyen
LIST OF REFERENCES Anderson,J.L.2003. Aquaculture, Competition, and the Global Seafood Market. Proceedings of a conference held in Akureyri, Iceland, on April 6-7th 2000. University of Akureyri, 2003. Anderson,J.L.2003 The international Seafood Trade. Woodhead Publishing Limited and CRC Press. North America. www.wood-publishing.com Czinkota M.A, Ronkainen, I.K and Moffett, M.H 1999, International business, 5th, Harcout Brace & Company Food and Agriculture Organisation (FAO). Fisheries. Database and Statistics. Fishstat plus 2001. FAO, Rome. Website: http://www.fao.org.fi.statist Food and Argriculture (FAO). Cod May 2003, Cod December 2003. Monthly Market Reports, Globefish. www.globelfish.org/marketreports/ Gudmundson,V and Palsson,T. 1992. The Market for Fish-Base Ready Meals-UK. FAO/GLOBEFISH Research Programme, Vol. 21, Rome, FAO. Hardy,N.H.2001 European Fish and Seafood Market. Market Intelligence Section, LFRA Limited Randalls Road, Leatherhead Surrey KT22 7RY. Jennifer L. Ferrero, Karen Z. Ackerman and John P. Nicholas, Eds. 1996, Agricultural Commodity Promotion Policies and Programs in Global Agri-Food System, proceeding from the NEC-63 Conference, Fiesta Americana, Cancum, Mexico. Josupeit,H.1999. European shrimp markets. FAO/GLOBEFISH Research Programme, Vol. 60, Rome, FAO. Maas,J and Resch,C.2004 Population and reproductive health issues in the ECE region: the political scene. European Population Forum 2004: Population Challenges and Policy Responses. Website: http://www.unece.org/ead/pau/epf/maas.pdf Ministry of Fisheries of Vietnam, Annually Reports, 1998, 1999, 2000, 2001, 2002. Monfort,M.C 2001. The French Market for Seafood. Vol I. www.marketing-seafood.com Ministry of Fisheries of Vietnam, Draft of General Plan for economic-social development of Fishery Sector period 2000-2010). Du Thao Quy Hoach Tong The Phat Trien Kinh Te - Xa Hoi Nganh Thuy San Vietnam, Thoi Ky 2000-2010. Ministry of Fisheries of Vietnam, Vietnam Fisheries, 2001, Communist Magazine Publish Company.
UNU – Fisheries Training Programme 83

Nguyen
UNU – Fisheries Training Programme 84
QuickMBA, the Internet Center for Management and Business Administration, SWOT analysis. Website: HTUhttp://www.quickmba.comUTH
Rudiger,J.R.1998. The Markets for Freshwater Fish in Europe, Globefish Research Programme, Volume 49, Rome FAO. US Small Business Administration, Glossary, website: HTUhttp://www.sba.govUTH
US Small Business Administration, Dictionary of Marketing Term, Website, HTUhttp://www.marketingpower.comUTH, Vietnam Finance Newspapers. 31.1.2004. Thoi Bao Tai Chinh Viet Nam