finding a match: how successful complex care programs ......california h ealth care foundation 1...
TRANSCRIPT
CALIFORNIA HEALTHCARE FOUNDATION
1
Finding a Match: How Successful Complex Care Programs Identify Patients
Meet Mr. D, age 40. Over the past year, he saw his primary care physician 23 times and missed 10 other appointments. He phoned his primary care clinic 22 times. He made 21 emergency department vis-its and was admitted to the hospital three times for issues that could have been treated by his primary care physician. Affected by fetal alcohol syndrome, developmental delay, and obesity, Mr. D has a his-tory of high blood pressure, diabetes, asthma, and chronic low-back pain. He is a victim of childhood abuse, and suffers from post-traumatic stress disor-der, anxiety, and bipolar disorder. He lives in a public housing development, is unemployed, and is insured by Medicaid.
The challenges of caring for high-need, high-cost patients such as Mr. D. have led increasingly to the use of specially trained complex care management (CCM) teams that identify and engage high-risk patients, assess their needs, and intervene rapidly to changes in their health status. These programs use a variety of approaches, but their common goal is to improve coordination of care and quality of life and reduce unnecessary use of services.1- 6
A critical step for CCM programs is to select and prioritize high-risk individuals for whom care man-agement interventions might improve care and reduce costs. This report provides practical guidance on selecting such patients, based on approaches identified during in-depth interviews of leaders at 20 leading CCM programs. (See Appendix B.) The research focuses on programs in which CCM teams work closely with primary care teams — such pro-grams are sometimes referred to as “primary-care integrated.”
The details of Mr. D’s profile illustrate the complexity of patient selection. The obvious reasons to select him for complex care management are his high uti-lization of services and high risk for poor outcomes. On the other hand, if a particular CCM program is not equipped to address his behavioral health issues sufficiently to reduce utilization, Mr. D might not be an appropriate candidate. The approach that a pro-gram takes to select patients for their program can mean the difference between its success and failure.
Issue Brief
March 2015

2California HealthCare Foundation
Successful CCM programs align the selected popu-lation, the planned interventions, and the outcomes of interest by performing three tasks:
1. Specify, prioritize, and agree on the outcomes of interest and the time frame in which outcomes should be achieved. For example, a high-priority outcome might be to achieve savings and/or a return on investment at three years.
2. Identify a sufficiently high-risk and care-sensitive target population in which the outcomes can be achieved.
3. Match the planned staffing/resources and inter-ventions to the target population to achieve the desired outcomes, building on existing services to fill care gaps.
There are two key aspects to patient identifica-tion: (1) predicting risk in specific patients along the dimensions or outcomes of interest, such as reduc-ing inpatient admission or recurrent, unnecessary ED visits; and (2) predicting care sensitivity — the likeli-hood that a particular high-risk patient will respond to the care management intervention. A number of patient identification approaches are available to CCM programs,7 including quantitative, qualita-tive, and hybrid models. The reported advantages and disadvantages to the different approaches are summarized in Table 1. Appendix C provides an overview of approaches used at each of the 20 pro-grams interviewed for this report.
Selecting Patients for CCM Programs
Before selecting patients, successful CCM programs think carefully about what they are trying to achieve (the desired outcomes)
as well as the program design (what resources the organization or its partners can bring to bear). The desired outcomes and program design determine the optimal target population and patient selection approach. For example, a predictor for total costs at three years may be less relevant if the outcome of interest is return on investment at six months. Similarly, a precise selection algorithm for patients with risk for admissions from behavioral health problems is suboptimal if the intervention cannot leverage behavioral health resources to successfully engage and manage patients with such issues.
Table 1. Patient Selection in CCM Programs: Advantages/Disadvantages of Different Approaches, continued
Description ADvAntAge(s) DisADvAntAges
Quantitative risk-prediction tools
Use claims data (or sometimes billing data) to predict differ-ent future outcomes (e.g., total medical expenditures, acute care utilization events, etc.)
Some provide risk scores within clinical groups (e.g., condition categories) and others provide a cumula-tive risk score that takes into account multiple risk factors
$$ Well-validated for identifying a subset of high-risk patients (particularly patients at high risk for future costs)
$$ Is not thorough – it accounts for a low percentage of the variability in costs, utiliza-tion, and other outcomes
$$ Does not account for some factors that are important for risk-stratifying patients (e.g., recent admissions that are not in claims, or identifying poorly activated patients)
$$ May not adequately identify psychosocially complex patients
$$ Depends on completeness of data (e.g., claims data)
$$ Lack of continuous claims data because of frequent disenrollment may reduce utility and precision of predictive modeling
$$ Cumulative risk scores for medical expenditures do not guide specific interventions
$$ Dependence on recent acute care utilization leads to over-identification of some low- or moderate-cost individuals with recent episodic high-cost events
$$ The highest-risk individuals may not always be the most responsive to care management interventions (e.g., patients with metastatic cancer)

3Finding a Match: How Successful Complex Care Programs Identify Patients
Table 1. Patient Selection in CCM Programs: Advantages/Disadvantages of Different Approaches, continued
Description ADvAntAge(s) DisADvAntAges
Acute-care-utilization focused
Use prior acute care utilization to identify high-risk patients
$$ When real-time data are available, identifies a high-risk population at a time of significant need and opportunity for impact
$$ Misses high-risk patients who do not have prior use of acute care services
$$ Prior utilization/cost is not the cause of future utilization/cost — and it does not help identify mutable factors that drive it
High-risk-condition- or medication-focused
Use claims/billing data (ICD-9 codes), internal data warehouse data (problem lists, medication data), or pharmacy data to identify patients by high-risk conditions or medications
$$ Widely available
$$ May be more easily received by health care providers because it gives them obvious targets for intervention
$$ May not adequately identify patients at high risk for utilization/costs
$$ Not all patients with high-risk conditions are at high risk — requires risk stratification within condition categories
Quantitative multifactorial risk assessment
Uses a weighted instrument (often developed internally) that may draw from any of the above sources to assign risk scores for patient selection
$$ Takes advantage of the strengths of different approaches
$$ Brings data together from multiple sources
$$ Allows inclusion and weighting of qualitative measures
$$ Complex and time-consuming to create
$$ Final risk assessment can be hard to interpret
$$ Poor data quality or conceptualization can lead to an inaccurate risk assignment
Referral by clinician or CCM team, or patient self-referral
Uses clinician or CCM team clinical assessment skills to identify high-risk patients
$$ Clinicians prefer to have the ability to refer their patients into CCM programs
$$ Clinicians may have the most complete picture of the patient, including clinical, behavioral health, and environmental and socioeconomic risk factors
$$ Patient self-referral identifies motivated patients with higher self-efficacy, who demonstrate readiness for CCM
$$ Clinician referral identifies patients who are challenging to manage, but not necessarily those at high risk for future utilization/costs or those who might be responsive to care management interventions
$$ Patients who are less activated and more vulnerable (and often the highest risk) may not self-refer
Hybrid: quantitative and qualitative
Sequentially uses combinations of quantitative and qualitative approaches
Can have a qualitative gate (e.g., clinicians decide final selection) or a quantitative gate (e.g., a quantitative threshold is used to decide final selection)
$$ May be most reliable approach for selecting high-risk patients who are also responsive to care management interventions
$$ Takes advantage of the strengths of different approaches
$$ More complex to implement — clinician review is particularly time-consuming
$$ Hybrid approaches with qualitative gates depend on the clinicians’ understanding of the program goals and interventions and their ability to select the right patients — which may not always be easy to achieve

4California HealthCare Foundation
Quantitative Approaches
Most quantitative risk-prediction approaches used by CCM programs are borne out of the science of claims-based risk adjust-
ment, employing a combination of age, diagnoses (gleaned through coded diagnoses or medications),
and prior cost or utilization. These models most often predict total cost of care, partial costs (e.g., inpatient vs. outpatient expenditures), and health care utiliza-tion (e.g., hospital admissions, readmissions, and ED visits). Table 2 provides a summary of the data sources as well as some reported advantages and disadvantages.
Quantitative protocols include:
$A Commercial claims-based risk-prediction tools (e.g., Hierarchical Conditions Categories [HCC],8 Clinical Risk Groups [CRGs],9 Impact Pro®,10 Milliman Advanced Risk Adjuster [MARA],11 MEDai12)
Table 2. Data Sources Used by CCM Programs: Advantages/Disadvantages
exAMples ADvAntAges DisADvAntAges
Claims All bills submitted by physicians and health care systems, and payments made by payers
$$ Provides a complete picture of patients’ billed interactions with the health care system when available including expendi-ture data, medication fill data on prescribed medications, and services, procedures, and tests provided
$$ Data gaps exist when patients are previously insured by another payer, move between payers, or lose insurance coverage
$$ Can take months for claims data to become complete (“claims lag”)
$$ Diagnosis data are dependent on coding and are incomplete (significantly, at times), inconsistent, and unstable
$$ Limited clinical information and socio-demographic information
Internal warehouses
Billing, clinical (e.g., electronic medical record data, vital signs, laboratory, imaging medication/prescription data), appointment/ registration data, and disease registries and care management databases
$$ Data are available more quickly, in real time
$$ Diagnosis data are more complete and stable in electronic medical records
$$ “Problem list” data allow identification of prior procedures/problems
$$ Clinical data (e.g., laboratory data) may allow screening for non-billed, non-problem list diagnoses and provide more richness regarding severity of illness or control of conditions
$$ Clinical data may be more complete – include non-prescription medications, detailed information on clinical encounters that are amenable to chart review and natural language processing
$$ Medical records data also increasingly include both coded and non-coded qualitative data (see next row)
$$ Does not capture patient interactions with the health care system outside of the network available in the data warehouse
$$ Data structure is more complex, and data come from numerous sources, requiring reconciliation and validation
$$ Data linkage (e.g., making sure data from multiple sources belong to the same patient) can be challenging
Qualitative/ survey
Surveys delivered by payers or delivery systems (e.g., health risk assessments)
$$ Provides data not available in quantitative datasets that may be strong risk predictors, such as screening for medical and psychosocial risk factors
$$ May be useful for risk stratification within high-risk populations
$$ Not widely available at the population level
$$ Expensive and time-consuming to collect
$$ Patient responses are often unstable
$$ Survey response rates may be low, reducing utility
Pharmacy Prescription fill data from pharmacies
$$ When complete, may be the most accurate source of medication fill data
$$ Does not capture medication refills outside of the pharmacy system

5Finding a Match: How Successful Complex Care Programs Identify Patients
patient factors that drive future utilization and cost within their population and incorporate them in their selection approach. When patient selection is focused on high-risk diagnoses, programs often stratify within conditions to find higher-risk subsets.
Programs frequently develop their own quantita-tive tools using multi-factorial risk assessments (see box), which combine different quantitative approaches into one measure or risk score. For
AA Acute care utilization thresholds based on prior utilization
AA Chronic disease count thresholds, or inclusion based on specific high-risk chronic diseases pulled from electronic data warehouses or registries
AA Internally developed risk-prediction tools (e.g., Aetna,13 Network Health,14 Veterans Affairs Care Assessment Need [CAN] score15)
In general, published risk-prediction models make predictions on total medical expenditures after accounting for only a quarter to a third of the fac-tors that lead to future expenditure16,17 and do not perform well within the highest-risk subgroups that are the targets of CCM. Thus, even the best available tools frequently fail to identify many future highest-cost patients. Additional data, such as clinical and survey data, when added to traditional claims-based risk predictors, may improve predictive models.18,19 However, clinical status often changes quickly, and survey data are expensive and time-consuming to collect.
Furthermore, many programs reported that the claims-based risk prediction models they used too often identified patients who were not going to be high risk moving forward (e.g., time-limited, episodic high-cost episodes such as high-risk pregnancy), so they developed processes for removing such patients. A few programs prefer risk-prediction prod-ucts that present risk within categories (e.g., Clinical Risk Groups risk-stratify patients within clinical condi-tion categories) because these give CCM teams a clearer clinical target for intervention compared to tools that simply provide an overall risk score.
Due to these and other limitations, half of CCM programs in this study do not use claims-based risk-prediction models at all. Instead, many programs use criteria and set thresholds based on prior acute care utilization or specific high-risk conditions. Most programs find prior acute care utilization to be a particularly useful proxy for future risk. However, David Labby, chief medical officer of Health Share of Oregon, cautioned that “utilization is an effect, not a cause.” Therefore CCM programs strive to identify
AtlantiCare Special Care Center — Patient Referral Form
CirCle Column A CirCle Column B
6 Congestive heart failure (heart pump failed to function with excessive fluid retention)
1 Smoking
4 Coronary artery disease/stroke 1 Hypertension
2 Cardiovascular disease — other heart disease (abnormal rhythm)
1 High cholesterol
2 Hypertension (uncontrolled/resistant) 1 Chronic anti-coagulant (coumadin therapy)
4 Diabetes mellitus (high blood sugar) 1 Obesity (height and weight)
4 Kidney disease or current serum creatinine >2 (estimated glomular filtration rate <60); placed on meds for kidneys or on dialysis
1 Mental illness (depression, anxiety, etc.)
4 Chronic obstructive pulmonary disease 2 ≥2 Hospitalizations/ED visits in past 12 months
2 Asthma/on maintenance meds (chronic/daily meds)
2 Taking ≥5 chronic prescription meds (other than pain meds)
1 Language barrier
2 No primary doctor
To qualify, patient must have at least one from Column A and total of 6 points: Columns A + B = •

6California HealthCare Foundation
example, programs might combine some of the following: claims-based risk scores, prior utilization, high-risk diagnosis or medication groups, laboratory data and other indicators of disease severity, socio-economic indicators, and other risk factors. Some multi-factorial risk assessments also incorporate data from focused or comprehensive qualitative assess-ments such as depression screening, self-rated health or functional status, measures of health lit-eracy, patient activation or engagement, or clinician assessments. Combining multiple approaches allows programs to take a more comprehensive approach and use all available data resources, leveraging their strengths to select the best population for their program.
Qualitative Approaches
As with quantitative approaches, best prac-tices in applying the various qualitative methods have not been systematically
described in the literature. Clinician input may help identify high-risk and care-sensitive patients, but the data are inconsistent.20-22 Qualitative approaches include patient self-referral and clinician assessment and referral.
Because many of the highest-risk patients do not proactively seek support, it is rare for CCM programs to depend on patient self-referral. On the other hand, clinicians frequently request the ability to refer patients to the programs. Interviewees felt that cli-nician referral was a good way to engage primary care clinicians in the program. Primary care teams can be particularly effective at identifying aggra-vating factors such as subtle gaps in care, social isolation, psychosocial issues, or recent changes in clinical status not yet captured in available data. A primary care clinician’s rich knowledge of the patient also enables identification of mitigating factors such as the presence of an active caregiver in the home or comprehensive care team already in place (e.g., comprehensive cancer center). Such aggravating and mitigating factors are not easily gleaned from other data sources.
However, interviewees noted that, because referral decisions are frequently based on subjective clinical assessment, clinicians tend to select patients who require the most effort to manage — a group that is not always the highest risk or likely to respond to the planned care management interventions. For example, a primary care clinician might select a
relatively low-risk, anxious patient who is perceived to be complex because of frequent phone calls and office visits. Other physician referrals might identify patients with intractable heroin addiction that they are unable to manage when the program does not have sufficient resources to address addiction issues. Programs worked to improve the quality of the refer-rals by providing clinicians and teams with clear criteria for referral and educating and re-educating them on the program goals and interventions.
Hybrid Approaches
The majority of programs in this study use hybrid approaches that take advantage of both quantitative and qualitative strategies to
select patients.
Most often, CCM programs use a quantitative approach to generate a list of high-risk patients for clinical review and assessment by primary care teams, alone or working together with the CCM teams. Joint clinical reviews occur on a one-on-one basis or in regular meetings or “huddles” specifically designated to select patients for the program.
Quantitative approaches are easier to apply to broad populations and allow programs to narrow the list for qualitative clinical review to a high-risk subgroup. During the clinical assessment, reviewers work to both exclude patients who are not high-risk over time and select ones likely to be care-sensitive. Typical exclusions might be:
$A Patients who are not sufficiently high-risk, including those who have a time-limited, high-cost episode that has resolved — such
7Finding a Match: How Successful Complex Care Programs Identify Patients
as cancer treatment, a high-risk pregnancy, surgery, or trauma event.
$A Patients who have their care needs met, such as those with a strong network of family care-givers, those in assisted living, or those who
have a comprehensive care team (e.g., com-prehensive cancer center or diabetes center).
Because these assessments are subjective, clinical reviewers must clearly understand the program goals and what the CCM program does and does not offer
in order to select the right patients and optimize this approach. Many programs provide clinical reviewers with criteria to guide selection and frequently edu-cate and re-educate them on program goals and interventions.
Finally, because clinical review is time-consuming, a few programs train team members (e.g., program leader, nurse, or medical assistant) to select patients, or to narrow the list for clinical review by using chart review to obtain a richer clinical picture of the patient.
Some programs flip the hybrid model and apply “quantitative gates” to self-referred patients or those referred by primary care or other care teams. Patients are selected for the program only if they meet specific quantitative inclusion criteria. See box for examples of different hybrid approaches.
Care Sensitivity Identifying care-sensitive patients is a major selec-tion challenge because it is not always clear who will respond to care management interventions and there is no generalizable approach; care-sensitiv-ity depends on the clinical focus of the particular CCM program. Most interviewees felt that qualita-tive assessment is necessary to select care-sensitive patients.
Approaches to identifying care-sensitive patients include the following:
$A Excluding patients with needs that the program is not sufficiently resourced to address. For example, reviewers might exclude a patient with a significant personality disorder or serious
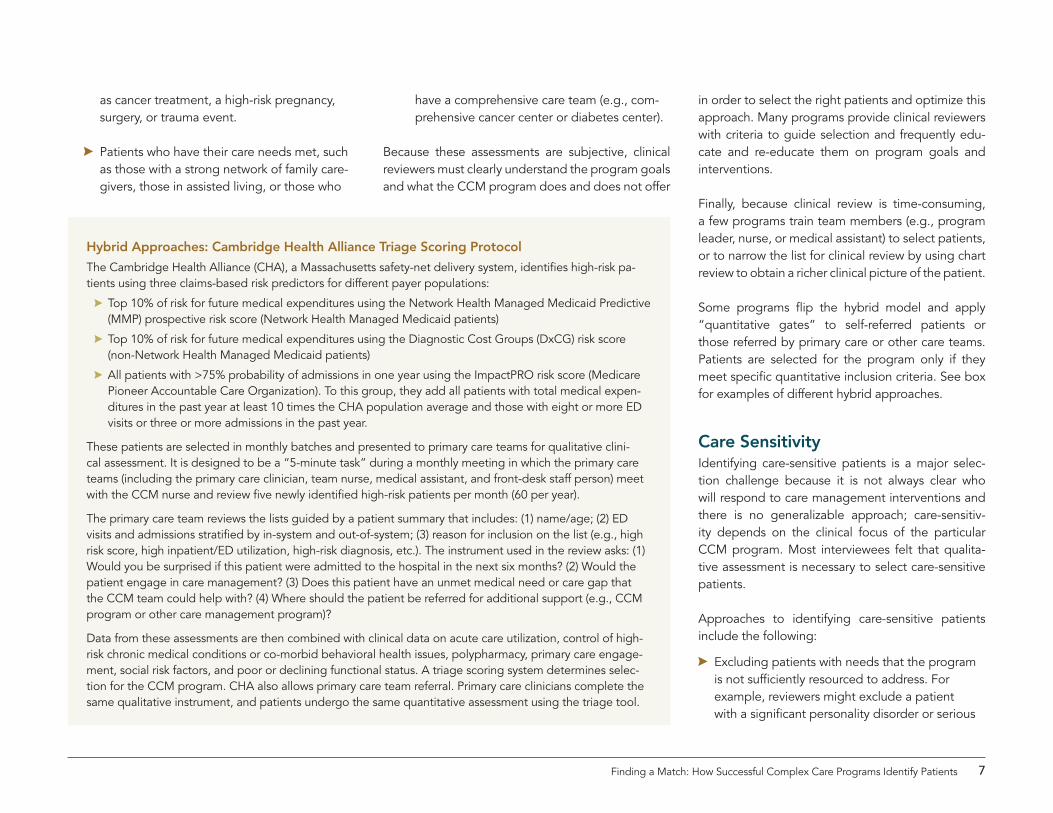
Hybrid Approaches: Cambridge Health Alliance Triage Scoring Protocol
The Cambridge Health Alliance (CHA), a Massachusetts safety-net delivery system, identifies high-risk pa-tients using three claims-based risk predictors for different payer populations:
$$ Top 10% of risk for future medical expenditures using the Network Health Managed Medicaid Predictive (MMP) prospective risk score (Network Health Managed Medicaid patients)
$$ Top 10% of risk for future medical expenditures using the Diagnostic Cost Groups (DxCG) risk score (non-Network Health Managed Medicaid patients)
$$ All patients with >75% probability of admissions in one year using the ImpactPRO risk score (Medicare Pioneer Accountable Care Organization). To this group, they add all patients with total medical expen-ditures in the past year at least 10 times the CHA population average and those with eight or more ED visits or three or more admissions in the past year.
These patients are selected in monthly batches and presented to primary care teams for qualitative clini-cal assessment. It is designed to be a “5-minute task” during a monthly meeting in which the primary care teams (including the primary care clinician, team nurse, medical assistant, and front-desk staff person) meet with the CCM nurse and review five newly identified high-risk patients per month (60 per year).
The primary care team reviews the lists guided by a patient summary that includes: (1) name/age; (2) ED visits and admissions stratified by in-system and out-of-system; (3) reason for inclusion on the list (e.g., high risk score, high inpatient/ED utilization, high-risk diagnosis, etc.). The instrument used in the review asks: (1) Would you be surprised if this patient were admitted to the hospital in the next six months? (2) Would the patient engage in care management? (3) Does this patient have an unmet medical need or care gap that the CCM team could help with? (4) Where should the patient be referred for additional support (e.g., CCM program or other care management program)?
Data from these assessments are then combined with clinical data on acute care utilization, control of high-risk chronic medical conditions or co-morbid behavioral health issues, polypharmacy, primary care engage-ment, social risk factors, and poor or declining functional status. A triage scoring system determines selec-tion for the CCM program. CHA also allows primary care team referral. Primary care clinicians complete the same qualitative instrument, and patients undergo the same quantitative assessment using the triage tool.

8California HealthCare Foundation
mental illness if the program does not have suf-ficient behavioral health expertise.
$A Identifying patients with specific care gaps or barriers to care that the CCM team can address. Some programs focus on patients for whom gaps in care are most likely, looking for individu-als with multiple chronic conditions or specific high-risk conditions that the team has had suc-cess addressing. Or they identify patients with poverty or addressable barriers to access. What a specific program deems addressable varies. For example, many programs exclude patients with conditions that are cared for by specialty-based comprehensive care teams, such as dialysis patients and those undergoing chemotherapy, because they feel the CCM team is unlikely to significantly augment the care provided by specialty-based comprehensive care teams already in place. However, one program noted that their dialysis patients were frequently admit-ted for volume overload or dehydration and cancer patients for side effects of chemotherapy that were not addressed by their specialty care teams. They felt they could address these gaps with the right team, anticipatory guidance, and management and worked with specialty teams to address them.
$A Identifying patients who are at risk for or have experienced care coordination issues. For example, some programs include patients with multiple specialist interactions, poor engage-ment with primary care manifested by frequent missed visits or absence of visits, or frequent ED visits or hospitalizations for ambulatory care sensitive conditions.
$A Identifying “windows of opportunities” or patients at high-risk times, such as hospital-to-home or ED-to-home care transitions. Interviewees noted that during such high-risk time periods, patients may also be more recep-tive to help from CCM team members. Real-time data on hospital or ED utilization must be avail-able to apply this approach. A few programs also track changes in patient risk status over time and attempt to identify those with rising risk scores.
Another aspect of care sensitivity is delivering the right intervention with the right intensity at the right time for the patient. Almost all programs depend on ongoing informal reassessments of the patients’ health status by CCM team members to dial up or down the intervention and outreach intensity to match changing patient needs. For example, a CCM intervention might be triggered by a hospital dis-charge, worsening shortness of breath, or a patient who is newly homeless. Programs often discuss patients in routine case conferences or huddles to re-assess and re-stratify them.
A Hybrid Approach: Iora Health Adds “Worry Score” to the Mix
Iora Health, a primary care delivery organization, runs two different CCM models at its sites. The first is an ambulatory intensive care unit model (AICU),* in which the entire practice cares for only high-risk patients. It uses a health risk assessment consisting of 10 weighted questions, with patients scoring 3 or higher ac-cepted into the AICU.
At other Iora sites, all patients are risk stratified to identify a subset for more intensive management by their multidisciplinary primary care team. The protocol starts with a risk predictor, the Milliman Adjusted Risk Score, focusing on the top decile of risk for future cost. The results are paired with an internally developed risk assessment, called the “Worry Score,” to identify the highest-risk patients.
The Worry Score has a scale from 0 to 10 that is generated by adding and subtracting points based on risk factors. The score takes into account diagnoses and control of chronic conditions, recent acute care utiliza-tion, and a list of modifiers including smoking status, age, and socioeconomic risk factors.
For example, a diabetic man might start with a score of 5, then go to a 7 because his most recent hemoglo-bin A1c is greater than 9; then to a 9 because he was admitted to the hospital in the past six months; and finally to a 10 because he is a smoker. Patients with a score of 10 would be discussed daily in team meetings or huddles; those with lower scores are discussed at specified less-frequent intervals.
The Worry Score uses data from claims, EMRs, data warehouses, and surveys. Because they can run continu-ously, the scores reflect changes in clinical status in real time, enabling primary care teams to continuously risk-stratify patients.
*Redesigning primary care for breakthrough in health insurance affordability. Mercer Human Resource Consulting. August, 2005.

9Finding a Match: How Successful Complex Care Programs Identify Patients
One critical ongoing assessment that programs employ is patient readiness to engage with CCM teams. Successful teams use motivational interview-ing approaches to assess readiness and reduce intervention intensity when patients demonstrate low readiness. Only a few programs use formal or automated risk-stratification approaches to scale up and down the intensity of care and outreach. See box about the Iora Health Worry Score, page 8.
Developing and Applying Strategies
Interviewees stressed that the process used to develop the patient selection algorithm and achieve alignment between population, inter-
vention, and outcome can be as important as the final algorithm itself. Engaging clinicians and other stakeholders early and frequently was a key recom-mendation from many interviewees.
Programs generally start with the best possible approach from their available data and use continu-ous quality improvement to refine their strategy over time. For example, Denver Health (see box) follows patients who are included and excluded by clinicians to hone the clinical review criteria, and use this infor-mation to provide decision support to clinicians as they select patients for the program.
Some programs select and prioritize their targeted outcomes, then engage stakeholders in discus-sions about drivers for poor outcomes and review data to identify a target population. For example, if a program’s primary goal is to reduce health care expenditures, they may have discussions with
stakeholders about cost drivers and look at data to identify both cost drivers and issues they could address through interventions. From this information they develop a quantitative identification approach.
Some programs favor simpler quantitative inclusion criteria, while others use multiple factors to triangu-late and get the most comprehensive view of risk within their population. In either case, interviewees recommended choosing an algorithm that is well received by the primary care teams, as their ongo-ing engagement in the process is critical to program success.
The studied programs vary in the frequency with which they select populations. Some do this at fixed intervals such as annually or monthly, while others take a continuous approach. Programs that use fixed intervals face the challenge of performing clinical review and program enrollment in batches; review-ing a large list of patients requires a concentrated time commitment that takes away from care manage-ment activities during the review. On the other hand, the continuous approach requires dedicated analytic support and access to continuous data streams.
A few interviewees raised concerns that overly proto-colized selection or risk-stratification activities could
Multi-Stakeholder Process at Denver Health
Denver Health, an integrated safety-net system, designed their selection approach as part of a CMS Health Care Innovation Award grant. Their purpose was to create complex care management goals based on achieving the triple aim of improved health and health care at reduced costs. The grant’s charge included developing an innovative patient selection and risk-stratification approach, then studying and improving it.
Denver Health’s process was transparent and inclusive. They brought together stakeholders including clini-cians, health service researchers and analysts, administrators (e.g., finance people), and CCM team leaders to develop the risk-stratification algorithm.
They use Clinical Risk Groups (CRGs) to divide their population into four risk tiers, then apply patient-specific risk factors (e.g., recent acute care utilization, high-risk diagnosis) to move people into higher tiers. Identifi-cation of the highest-risk patients typically considers tier status, intervention-specific criteria (e.g., substance use disorder for focused intervention), as well as clinical review by primary care clinicians. Automatically generated lists of high-risk patients are reviewed by clinicians to remove patients who are not a good fit for the program.
The analytic team created a tool by which CRG categories and other data can be manipulated in real time during meetings to re-tier patient populations based on suggestions from the group. Patients can be grouped and re-grouped until consensus is reached. The quantitative algorithm is reviewed approximately every six months. Patients who were “misclassified” in lower tiers or those excluded by providers that ended up in high-spending tiers are assessed to identify opportunities to improve the approach.

10California HealthCare Foundation
distract teams from the clinical assessments and care provision that is critical to successful CCM. For example, the time required for a nurse care manager to routinely and formally re-stratify their population into risk tiers would decrease the time they have to deliver care management interventions. CCM pro-grams try to balance the need for rigor and protocols with the need to develop patient relationships and do the work of care management.
Looking Ahead
The rise of big data 23,24 and improved qual-ity and access to electronic data repositories (e.g., health information exchanges) that
combine data from numerous sources bring great opportunities to improve the identification of high-risk patients. Data sources that provide psychosocial predictors, patient-reported outcomes, functional assessment, and survey data will expand variables available for use in predictive modeling. Examples include: integrating data from government and com-munity organizations, payer- and purchaser-collected health risk assessments, patient reported outcomes collected through patient portals or mobile phones, and continuous data from remote monitoring tools.25 Implementation of ICD-10 also brings potential advantages with more granular data on the sever-ity of conditions, but it will require programs to adapt current risk-prediction approaches and will be subject to issues (e.g., coding) faced during the tran-sition from ICD-9 to ICD-10.
Researchers and implementers will need to work together to identify strong predictors within this growing dataset and improve quantitative risk-stratification approaches while also studying hybrid
patient selection approaches and care-sensitivity factors. Improving approaches to risk stratify and classify high-risk patients is also critical. This process, which some call “segmentation,” organizes patients into groups for which programs can design effec-tive interventions. In particular, it will be important to move beyond chronic condition-based groupings and identify high-risk patient subgroups that may be defined by utilization patterns and specific care gaps or barriers.
Clearly there are opportunities to greatly improve the value of health care delivery by improving our ability to identify high-risk patients, risk stratify them, and define subgroups that are amenable to intervention. This issue brief provides guidance, but patient selection and risk-stratification approaches are evolving rapidly, so we will need to continue to share learning and evaluate different approaches.
Seven Take-Aways from Successful CCM Programs
1. The patient selection approach should align with desired outcomes and planned care management interventions. Know what the CCM program does and does not do.
2. Quantitative approaches to risk prediction can be applied to large populations, but are subject to data quality issues, too often identify patients with time-limited increases in risk, and may not provide specific information required to guide interventions.
3. Using large clinical and non-health-care related datasets may enhance a program’s predictive capabili-ties. This could enable use of multiple data sources to triangulate risk and multiple algorithms to get at different risk populations.
4. Asking clinicians to select patients may better identify care-sensitive patients, but this approach may be hard to administer and may not identify the highest-risk patients.
5. Hybrid approaches take advantage of the strengths of both the quantitative and qualitative approach-es, but may be complex to administer.
6. High-risk populations can be stratified into subgroups likely to benefit from specific interventions. How-ever, this remains largely an individualized, clinical review process rather than an automated one.
7. The process used to develop the patient selection approach is as important as the algorithm itself. Engage multidisciplinary stakeholders and use continuous quality improvement to refine the approach.

11Finding a Match: How Successful Complex Care Programs Identify Patients
AcknowledgmentsThe authors would like to thank the Commonwealth Fund (especially Melinda Abrams) for funding a report on complex care management, “Treating High-Need, High-Cost Patients: What Makes for a Successful Care Management Program,” which laid the foundation for this report. Also, the authors are deeply grateful to the program leaders and interviewees who shared their time and expertise (Appendix A).
About the FoundationThe California HealthCare Foundation works as a catalyst to fulfill the promise of better health care for all Californians. We support ideas and innova-tions that improve quality, increase efficiency, and lower the costs of care. For more information, visit www.chcf.org.
©2015 California HealthCare Foundation
About the AuthorsClemens S. Hong, MD, MPH, is a practicing primary care general internist and health services researcher at Massachusetts General Hospital (MGH), and co-founder of Anansi Health. His research focuses broadly on improving primary care delivery to vul-nerable populations, with a focus on the integration of community health workers into primary care teams, risk stratification and identification of com-plex, high-risk patients in primary care, and primary care-integrated complex care management of high-cost Medicaid and dual-eligible patients.
Andrew S. Hwang is a student at Tufts University School of Medicine. He will graduate in 2015 with MD and MPH degrees. He is currently applying for residency programs in internal medicine. His research focuses on the characteristics of persistent, frequent users of the emergency department and the asso-ciation between outpatient visit no-shows and risk for poor preventive screening, chronic disease, and acute care utilization outcomes.
Timothy G. Ferris, MD, MPH, is a general internist and pediatrician and senior vice president of popula-tion health management at Massachusetts General Hospital and Partners HealthCare. He is also an asso-ciate professor of medicine and pediatrics at Harvard Medical School. As the principal investigator for a six-year Medicare demonstration program and as the leader of the Partners Pioneer Accountable Care Organization in Boston, he leads programs designed to systematically improve patient care.

12California HealthCare Foundation
1. Hong CS, Siegel AL, Ferris TG. Caring for High-need, High-cost Patients: What Makes for a Successful Care Management Program? The Commonwealth Fund. August 2014.
2. Bodenheimer T, Berry-Millet R. Care Management of Patients with Complex Health Needs. Robert Wood Johnson Foundation Research Synthesis Report No. 19. December 2009.
3. Bodenheimer T. “Coordinating Care — A Perilous Journey through the Health Care System.” N Engl J Med. 2008;358(10):1064-1071.
4. Ayanian JZ. “The Elusive Quest for Quality and Cost Savings in the Medicare Program.” JAMA. 2009; 301(6):668-670.
5. Brown R, Peikes D, Chen A, Ng J, Schore J, Soh C. The Evaluation of the Medicare Coordinated Care Demonstration: Findings for the First Two Years. Princeton, NJ: Mathematic Policy Research Inc. March 2007.
6. Goodwin N, Sonola L, Thiel V, Kodner D (2013). Co-ordinated Care for People with Complex Chronic Conditions. The King’s Fund. October 2013.
7. Levine SH, Adams J, Attaway K, Dorr DA, Leung M, Popescu B, Rich J. Predicting the Financial Risks of Seriously Ill Patients. California HealthCare Foundation. December 2011.
8. Pope G, Ellis R, Ash A, et al. Diagnostic Cost Group Hierarchical Condition Category Models for Medicare Risk Adjustment. Health Care Financing Administration. December 2000.
9. Hughes JS, Averill RF, Eisenhandler J, et al. “Clinical Risk Groups (CRGs): A Classification System for Risk-adjusted Capitation Based Payment and Health Care Management.” Med Care. 2004;42(1):81-90.
10. Impact Pro® Health Care Analytics for Care Management. Optum, Inc. Accessed September 29, 2014, www.optum.com.
11. Milliman Advanced Risk Adjusters. Milliman. Accessed September 29, 2014, us.milliman.com.
12. How MEDai Can Help Predictive Modeling. MEDai. Inc. Accessed September 29, 2014, www.medai.com.
13. Aetna Integrated Health and Disability. Aetna, Inc. 2004. Accessed September 29, 2014, www.aetna.com.
14. Yeracaris P. Community Engagement: Targeting High-risk Members to Enhance Care Management Effectiveness [PDF]. Retrieved January 14, 2015 from: www.healthintegrated.com.
15. Fihn S, Box T. Care Assessment Need (CAN) Score and the Patient Care Assessment System (PCAS): Tools for Care Management. Veterans Health Administration. June 2013. Accessed September 29, 2014, www.hsrd.research.va.gov.
16. Winkelman R, Mehmud S. A Comparative Analysis of Claims-based Tools for Health Risk Assessment. Society of Actuaries. April 2007.
17. Cumming RB, Cameron BA. A Comparative Analysis of Claims-based Methods of Health Risk Assessment for Commercial Populations. Society of Actuaries. May 2002.
18. Stam PJ, van Vilet RC, van de Ven WP. “Diagnostic, Pharmacy-based, and Self-reported Health Measures in Risk Equalization Models.” Med Care. 2010;48(5):448-57.
19. Perrin NA, Stiefel M, Mosen DM, Bauck A, Shuster E, Eirks EM. “Self-reported Health and Functional Status Information Improves Prediction of Inpatient Admissions and Costs.” Am J Manag Care. 2011;17(12):e472-478.
20. Lynn J, Schall MW, Milne C, Nolan KM, Kabcenell A. “Quality Improvements in End of Life Care: Insights from Two Collaboratives.” Jt Comm J Qual Improv. 2000;26(5):254-267.
21. Hasan O, Meltzer DO, Shaykevich SA, et al. “Hospital Readmission in General Medicine Patients: A Prediction Model.” J Gen Intern Med. 2010;25(3):211-219.
22. Freund T, Mahler C, Erler A, et al. “Identification of Patients Likely to Benefit from Care Management Programs.” Am J Manag Care. 2011;17(5):345-352.
23. Roski J, Bo-Linn GW, Andrews TA. “Creating Value in Health Care through Big Data: Opportunities and Policy Implications.” Health Affairs. 2014;33(7):1115-1122.
24. Bates DW, Saria S, Ohno-Machado L, Shah A, Escobar G. “Big Data in Health Care: Using Analytics to Identify and Manage High-risk and High-cost Patients. Health Affairs. 2014;33(7):1123-1131.
25. Nguyen OK, Chan CV, Makam A, Stieglitz H, Amarasingham R. “Envisioning a Social-Health Information Exchange as a Platform to Support a Patient-Centered Medical Neighborhood: A Feasibility Study.” J Gen Intern Med. 2015;30(1):60-67.
Endnotes
13Finding a Match: How Successful Complex Care Programs Identify Patients
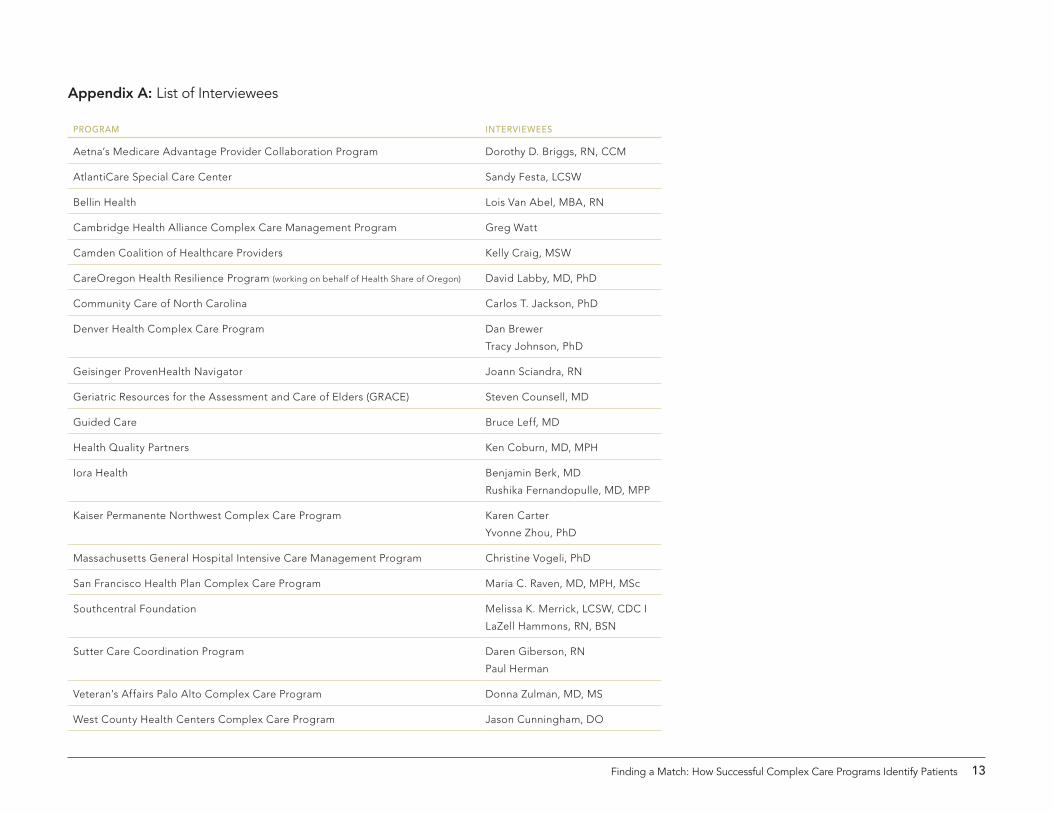
progrAM interviewees
Aetna’s Medicare Advantage Provider Collaboration Program Dorothy D. Briggs, RN, CCM
AtlantiCare Special Care Center Sandy Festa, LCSW
Bellin Health Lois Van Abel, MBA, RN
Cambridge Health Alliance Complex Care Management Program Greg Watt
Camden Coalition of Healthcare Providers Kelly Craig, MSW
CareOregon Health Resilience Program (working on behalf of Health Share of Oregon) David Labby, MD, PhD
Community Care of North Carolina Carlos T. Jackson, PhD
Denver Health Complex Care Program Dan Brewer
Tracy Johnson, PhD
Geisinger ProvenHealth Navigator Joann Sciandra, RN
Geriatric Resources for the Assessment and Care of Elders (GRACE) Steven Counsell, MD
Guided Care Bruce Leff, MD
Health Quality Partners Ken Coburn, MD, MPH
Iora Health Benjamin Berk, MD
Rushika Fernandopulle, MD, MPP
Kaiser Permanente Northwest Complex Care Program Karen Carter
Yvonne Zhou, PhD
Massachusetts General Hospital Intensive Care Management Program Christine Vogeli, PhD
San Francisco Health Plan Complex Care Program Maria C. Raven, MD, MPH, MSc
Southcentral Foundation Melissa K. Merrick, LCSW, CDC I
LaZell Hammons, RN, BSN
Sutter Care Coordination Program Daren Giberson, RN
Paul Herman
Veteran’s Affairs Palo Alto Complex Care Program Donna Zulman, MD, MS
West County Health Centers Complex Care Program Jason Cunningham, DO
Appendix A: List of Interviewees

14California HealthCare Foundation
The aim of this study was to identify best practices in patient selection and risk stratification from successful primary care-integrated complex care management programs. It followed a Commonwealth Fund-supported study of 18 primary care-integrated complex care management programs,* starting with 11 programs from the original 18 that had the most developed approaches to patient selection. Snowball sampling was then used to identify another nine programs for interview. Each site received at least two email invitations to participate in the study.
Participants chose a key informant with knowledge of their patient selection and risk-stratification approach. The authors assessed each program using semi-structured key-informant interviews and review of published manuscripts and program materials obtained from each of the sites. At least one 45- to 60-minute, semi-struc-tured interview was conducted with each key informant. Additional interviews were performed, as necessary, to obtain further clarification and detail. Four broad study domains were assessed during the interviews:
1. Patient identification and selection approach
2. Approaches to identifying care-sensitive patients
3. Patient risk-stratification approach
4. Lessons learned and recommendations for other programs
*Hong CS, Siegel AL, Ferris TG. Caring for High-need, High-cost Patients: What Makes for a Successful Care Management Program? The Commonwealth Fund. August 2014.
Appendix B. About This Study

15California HealthCare Foundation
orgAnizAtion type(s)
tArget populAtion
pAtient selection ApproAch(es) QuAntitAtive ApproAch(es)
QuAlitAtive ApproAch(es)
DAtA sources useD For pAtient selection
Aetna's Medicare Advantage Provider Collaboration Program
Payer Aetna Medicare Advantage
1) Quantitative
2) Referrals
1) Risk predictor – internal Aetna algorithm
2) Multifactorial risk assessment – based on health risk assessment at enrollment (Medicare)
3) Other – system-generated triggers
1) Clinician referral
2) Patient self-referral
3) Referral from other Aetna care manage-ment programs
1) Claims
2) Health risk assess-ment (Medicare)
AtlantiCare Special Care Center
Primary care practice for patients with chronic condi-tions
Purchasers/self-insured entities, Medicare, Medicaid, uninsured
1) Quantitative
2) Referrals
Multifactorial risk assessment – weighted scoring system with points for aggravating/mitigating factors
1) CCM team chart review using a risk assessment tool
2) Clinician referral
3) Patient self-referral
1) Claims
2) Electronic medical records
Bellin Health Systems
Integrated delivery system
Medicare, Medicare Advantage and fee-for-service, Medicaid, commercial, self-insured
Hybrid – quantitative with qualitative gate
Utilization – LACE* tool/readmissions 1) CCM team chart review
2) Clinician referral
1) Claims
2) Electronic medical records
3) Health risk assess-ment
Cambridge Health Alliance Complex Care Management Program
Integrated delivery system
All payers Hybrid – quantitative with qualitative gate OR qualitative with quantitative gate†
1) Risk predictors – Network Health Managed Medicaid Predictive (MMP)‡ prospective risk score (top 5% of Network Health patients), Diagnostic Cost Groups (DxCG)§ risk score (Medicaid), ImpactPRO15 risk score (>75% probability of admis-sion in 1 year in Medicare Pioneer Accountable Care Organization patients)
2) Cost – total medical expenditure 10x average for population
3) Utilization – 8+ emergency department (ED) visits OR 3+ admissions in past year
4) Multifactorial risk assessment based on mixed quantitative and qualitative measures – applied to patients identified by criteria 1-3 or through referral
1) Clinician clinical assessment
2) Referral from PCPs and inpatient CM
1) Claims
2) Electronic medical records
*LACE – an evidence-based risk score calculated from Length of stay, Acute admission, Comorbidity (Charlson score), Emergency room visits – van Walraven C, Dhalla IA, Bell C, et al. “Derivation and Validation of an Index to Predict Early Death or Unplanned Readmission after Discharge from Hospital to the Community.” CMAJ. 2010;182(6):551-557.
†Quantitative gate – patient undergoes a final quantitative screening for entry into the program.
‡Yeracaris P. Community Engagement: Targeting High-risk Members to Enhance Care Management Effectiveness [PDF]. Retrieved January 14, 2015 from: www.healthintegrated.com.
§Ellis RP, Pope GC, Iezzoni LI, et al. “Diagnosis-Based Risk Adjustment for Medicare Capitation Payments.” Health Care Financing Review 1996;17(3):101-128.
Appendix C. Program Overview

16California HealthCare Foundation
orgAnizAtion type(s)
tArget populAtion
pAtient selection ApproAch(es) QuAntitAtive ApproAch(es)
QuAlitAtive ApproAch(es)
DAtA sources useD For pAtient selection
Camden Coalition of Healthcare Providers
Regional care management organization
Medicaid, dual eligible, Medicare only, commercial
Hybrid – quantitative with qualitative gate
1) Utilization – 2+ admissions in past 6 months
2) Chronic disease – 2+ conditions
3) Other – 3+ criteria from checklist
CCM team chart review using a risk assessment tool
1) Electronic medical records
2) Hospital data
CareOregon Health Resilience Program (working on behalf of Health Share of Oregon)
Payer/Regional care management organization
Medicaid, dual eligible
Hybrid – quantitative with qualitative gate
Utilization – 6+ ED visits AND/OR 1 non-obstetrics (OB) hospitalizations in the last year
1) Clinician/CCM team clinical assessment
2) Clinician referral
1) Claims
2) Acute care utiliza-tion data
Community Care of North Carolina
Regional care management organization
Medicaid, dual eligible, and Medicare and Commercial (in a rural, multi-payer demonstration)
Hybrid – quantitative with qualitative gate
1) Risk Predictor – Care Management Impactability Score# – top 2% based on impactability
2) Risk Predictor – Clinical Risk Groups** – top 2% of highest-yield hospitalized patients for transi-tional care
CCM team clinical assessment – care manager review for appropriateness
1) Claims
2) Retail pharmacy data
3) Statewide, hospital admission feeds
Denver Health 21st Century Care – Intensive Outpatient Clinic & High-risk Care Coordination Program††
Integrated delivery system
Medicare, Medicaid Managed Care, CHIP (CHP Plus program), Medicare and Medicaid Fee-for-Service, uninsured
Hybrid – quantitative with qualitative gate
1) Mutifactorial risk assessment – combines Risk Predictor (Clinical Risk Groups**), utilization, and diagnoses – CRG places population into 4 tiers, then patient-specific triggers (e.g., recent hospitalization, ED visits) promote patients into higher-risk tiers
Clinician clinical assessment
1) Claims (managed care patients)
2) Internal data warehouse – Internal billing, registries
Geisinger ProvenHealth Navigator
Integrated delivery system
Medicare, commercial
Hybrid – quantitative with qualitative gate
1) Risk Predictor – MedAI‡‡ (highest-risk groups and patients moving up 2+ risk groups), Predicted Risk
2) Utilization – 3+ ED visits or 1+ admissions in 6 months
3) Cost – >$50K/year annual spend
4) Diagnoses – heart failure, chronic obstructive pulmonary disease, and end-stage kidney disease (Medicare)
5) All hospital discharges in Medicare patients or those meeting the following criteria: 55+ years old, hospital length of stay 5+ days, diagnoses of high-risk cancer, heart failure, chronic obstructive pulmonary disease, end-stage kidney disease.
1) Clinician/CCM team clinical review
2) Clinician referral
3) Referral from care management inter-vention, inpatient case management, home health, and the medical neigh-borhood (e.g., local pharmacy, aging resource centers)
1) Claims
2) Internal data warehouse – disease registry, pharmacy data
3) Electronic medical records
4) Health risk assess-ments – self-insured and purchaser groups
#Personal communication with Carlos T. Jackson, PhD, on January 15, 2015.
**Hughes JS, Averill RF, Eisenhandler J, et al. “Clinical Risk Groups (CRGs): A Classification System for Risk-Adjusted Capitation-Based Payment and Health Care Management.” Med Care. 2004;42(1):81-90.
††Denver Health’s 21st Century Care project is supported by the Department of Health and Human Services, Centers for Medicare & Medicaid Services, Contract Number 1C1CMS331064. The contents of this publication are solely the responsibility of the authors and do not necessarily represent the official views of the U.S. Department of Health and Human Services or any of its agencies.
‡‡How MEDai Can Help Predictive Modeling. MEDai, Inc. Web. Retrieved September 29, 2014.

17California HealthCare Foundation
orgAnizAtion type(s)
tArget populAtion
pAtient selection ApproAch(es) QuAntitAtive ApproAch(es)
QuAlitAtive ApproAch(es)
DAtA sources useD For pAtient selection
Geriatric Resources for Assessment and Care of Elders (GRACE)
Integrated delivery system, primary care practice
Medicare, dual eligible
1) Quantitative
2) Clinician referral
1) Age/Utilization
2) Dual eligible
3) High-risk diagnoses
4) Multifactorial risk assessment
Clinician referral (including referral from primary care physician, nurse care manager, and inpatient geriatric consult team)
1) Claims
2) Electronic medical record
Guided Care Integrated delivery system
Medicare, Medicare Advantage
Quantitative Risk Predictor - Hierarchical Condition Categories score§§ (top 25%)
None Claims
Health Quality Partners
Regional care management organization
Medicare, Medicare Advantage
1) Quantitative
2) Hybrid – quantitative with qualitative gate
1) Risk Predictors – Aetna proprietary risk predictor (for Aetna Medicare Advantage)##
2) Diagnoses – heart failure, coronary artery disease, chronic obstructive pulmonary disease, and diabetes
3) Utilization – 1+ admissions in one year (Medicare only)
Clinician/CCM team clinical assessment – some practices
1) Claims
2) Hospital billing data
Intensive manage-ment Patient Aligned Care Team (ImPACT), Veterans Affairs Palo Alto
Integrated delivery system
Veterans Health Administration – Medicare, Medicaid, commercial, secondary insur-ance
Quantitative 1) Cost – Ranked in Top 5% by total medical expen-ditures
2) Risk Predictor – Care Assessment Need (CAN) Risk Score*** – Top 5% based on 1-year risk of hospitalization
None 1) Veteran’s Affairs Decision Support System (DSS)†††
2) Regional data warehouse (RDW)‡‡‡
Kaiser Permanente Northwest Team Based Care
Integrated delivery system
Medicare, dual eligible
1) Hybrid – quantitative with qualitative gate
2) Referral
Multifactorial risk assessment – 4-tiers – combines risk predictor (Hierarchical Condition Categories§§ 6 month likelihood of hospitalization, major chronic disease indicators, and selected clinical data and other triggers)
1) Clinician/CCM team clinical assessment of highest-risk (tier 4) patients
2) Clinician referral from tier 2 and 3 accepted
1) Claims
2) Internal data warehouse – disease registries, hospital acute care utilization data
3) Electronic medical record
§§Pope G, Ellis R, Ash A, et al. Diagnostic Cost Group Hierarchical Condition Category Models for Medicare Risk Adjustment. Health Care Financing Administration. December 2000.
##Preston S. Aetna PhilaSUG Meeting PULSE AIM [PDF]. Retrieved January 14, 2015 from www.philasug.org.
***Wang L, Porter B, Maynard C, et al. “Predicting Risk of Hospitalization or Death Among Patients Receiving Primary Care in the Veterans Health Administration.” Med Care. 2013;51(4):368-373.
†††Kraft MR, Hynes DM. “Decision Support within the Veterans Health Administration.” Stud Health Technol Inform. 2006;122:100-104.
‡‡‡ VA Informatics and Computing Infrastructure. Accessed January 16, 2015 from www.hsrd.research.va.gov.

18California HealthCare Foundation
orgAnizAtion type(s)
tArget populAtion
pAtient selection ApproAch(es) QuAntitAtive ApproAch(es)
QuAlitAtive ApproAch(es)
DAtA sources useD For pAtient selection
Massachusetts General Hospital Integrated Care Management Program
Integrated delivery system
Medicare, Medicaid, commercial
Hybrid – quantitative with qualitative gate
Risk Predictor – ImpactPRO§§§ risk score (for total medical expenditures – 10+ automatic inclu-sion, risk score 2-10 included if they have specific combinations of chronic conditions and utilization – lower-risk conditions require higher-risk utilization criteria for inclusion)
Clinician/CCM team clinical assessment
1) Claims for quantitative
2) Electronic medical record for qualitative
San Francisco Health Plan CareSupport Program
Payer Medicaid Managed Care
Hybrid – quantitative with qualitative gate
Utilization – 1 non-OB admission plus 5+ ED visits OR 2+ admissions OR 6+ ED visits in prior 12 months
1) CCM team chart review
2) Referrals from health plan utilization management nurse or pharmacist
1) Claims
2) Electronic medical record
3) Department of Public Health Care Coordination Database feeds
Southcentral Foundation
Integrated delivery system
Alaskan Native/American Indian – Medicare, Medicaid, commercial
1) Hybrid – quantitative with qualitative gate
2) Referral
Utilization – 2+ admissions OR 1+ admission plus 2+ ED visits OR 4+ ED visits OR 2+ specialty visits OR 12+ ambulatory care visits in one year
1) Clinician clinical assessment
2) Clinician referral
3) Patient self-referral
1) Electronic medical record
2) Enterprise data warehouse
Sutter Care Coordination Program
Integrated delivery system
Medicare, Medicare Advantage, self-insured
1) Hybrid – quantitative with qualitative gate###
2) Clinician referral
Multifactorial risk assessment – based on 25 items 1) Clinical assess-ment by clinician or complex care management team
2) Clinician referral
1) Electronic medical record
2) Hospital data system – for acute care utilization data
West County Health Center Complex Care Program
Primary care practice
Medicare, dual eligible, Medicaid
1) Hybrid – quantitative with qualitative gate
2) Clinician referral
1) Cost – total medical expenditures (top 100 patients)
2) Modified LACE**** (transitions of care)
1) Clinician clinical assessment
2) Clinician referral
1) Claims
2) Electronic medical records
§§§Optum. Impact Pro® health care analytics for care management. Web. Retrieved January 14, 2015 from www.optum.com.
###Qualitative gate – patient undergoes a final qualitative screening for entry into the program.
****Modified LACE – Kreilkamp, R. Application of the LACE Risk Assessment Tool at Chinese Hospital [PDF]. Retrieved January 14, 2015 from: www.avoidreadmissions.com. Published 2011. Accessed September 25, 2012.