financing transit-oriented development with land values - hiroaki suzuki - lecturer, university of...
TRANSCRIPT

www.TransformingTransportation.org
Financing Transit-Oriented
Development with Land Values
Hiroaki Suzuki, Lecturer, University of TokyoPresented at Transforming Transportation 2015
Transforming Transport 2015 Washington DC, January 16, 2014
Hiroaki Suzuki, Urban Development Specialist2
Financing Transit-Oriented Development with Land Values-Adapting Land Value Capture in Developing Countries-

Outline
Introduction: TOD, Urban Sustainability and Finance
Concept and Theory of Land Value Capture and Its Instruments
Hong Kong R(Rail)+P (Property) Program
Tokyo Inclusive Multiple Integration Model
Conclusion
3
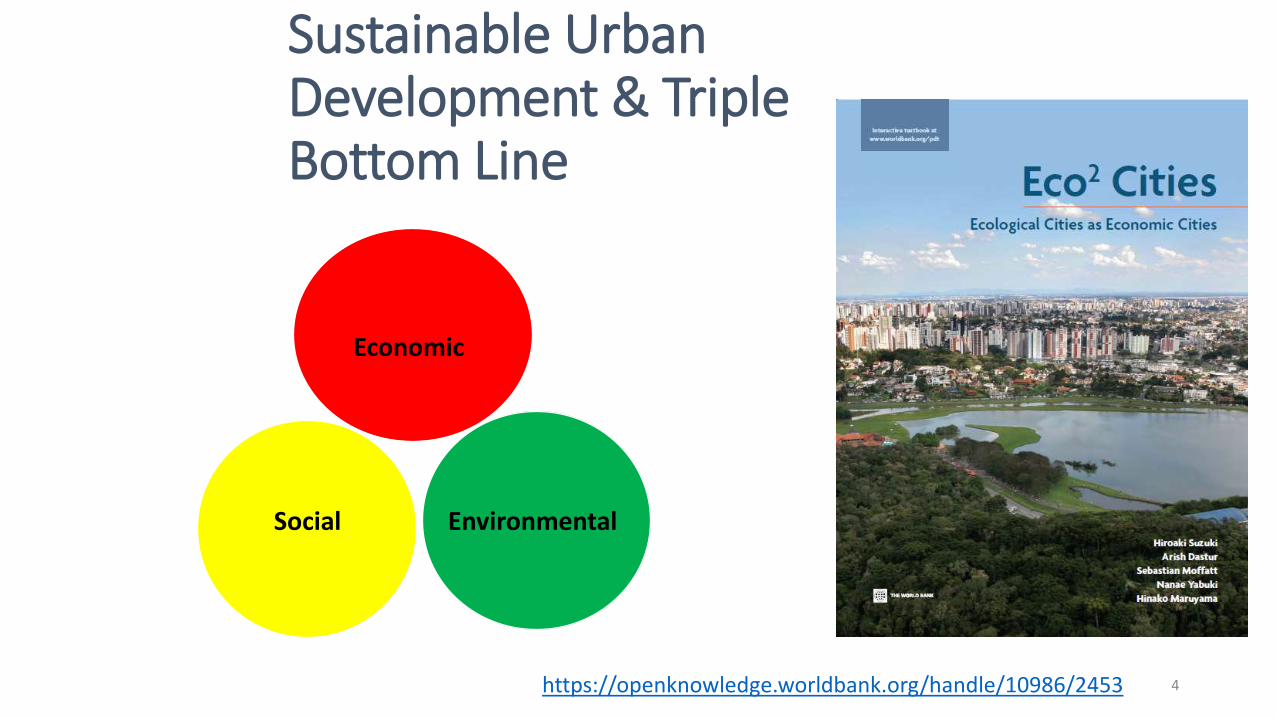
Sustainable Urban Development & Triple Bottom Line
Economic
Social Environmental
4https://openknowledge.worldbank.org/handle/10986/2453

TOD Promoting Urban Sustainability
Source: GIZ/World Bank
5https://openknowledge.worldbank.org/handle/10986/12233
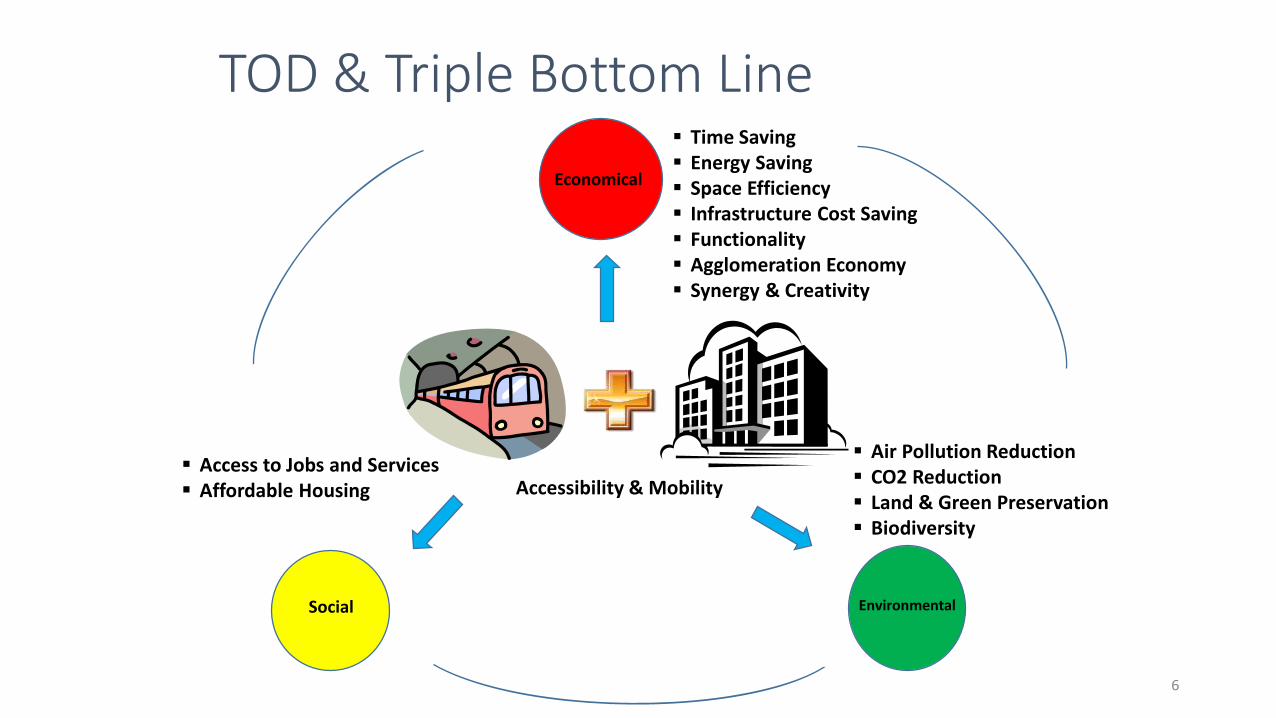
TOD & Triple Bottom Line
Economical
EnvironmentalSocial
Time Saving Energy Saving Space Efficiency Infrastructure Cost Saving Functionality Agglomeration Economy Synergy & Creativity
Air Pollution Reduction CO2 Reduction Land & Green Preservation Biodiversity
Accessibility & Mobility Access to Jobs and Services Affordable Housing
6

How to Finance High Transit Construction Cost?
Tokyo Metro Construction Costs
Source: Hitoshi Ieda
Source: World Bank LVC Case
Studies
$100MRMB 0.6 B
$200MRMB 1.2 B
$300MRMB 1.8 B
7
Cities CostBillion
LengthKm
Nanchang Line 2 $2.6 24Km
Hyderabad $2.6 72 Km
Delhi $11.7 120Km
Sao Paulo $30 .0 100Km
Metro in Developing Countries

Fare-box Recovery Ratio
Source: Murakami, Jin. 2012. Transit Value Capture
Fare Revenues/Operation Expenses (%) – 60 Global Cities
0
20
40
60
80
100
120
140
160
Hon
g K
on
g
Delh
i
Tok
yo
Sin
gap
ore
Lon
don
Bu
dap
est
Barc
elo
na
Cop
enh
agen
Ath
en
s
Osl
o
Mad
rid
Hel
sin
ki
Ham
bu
rg
Mosc
ow
Sto
ckh
olm
New
York
Pari
s
Ber
lin
Bolo
gn
a
Ch
icago
Wash
ingto
n, D
C
Lyon
s
Rott
erd
am
Bost
on
San
Fran
cis
co
Am
ster
da
m
Atl
an
ta
Los
An
gele
s
Port
lan
d
Ho
ust
on
Mia
mi
Dall
as
Cross-
subsidies
8
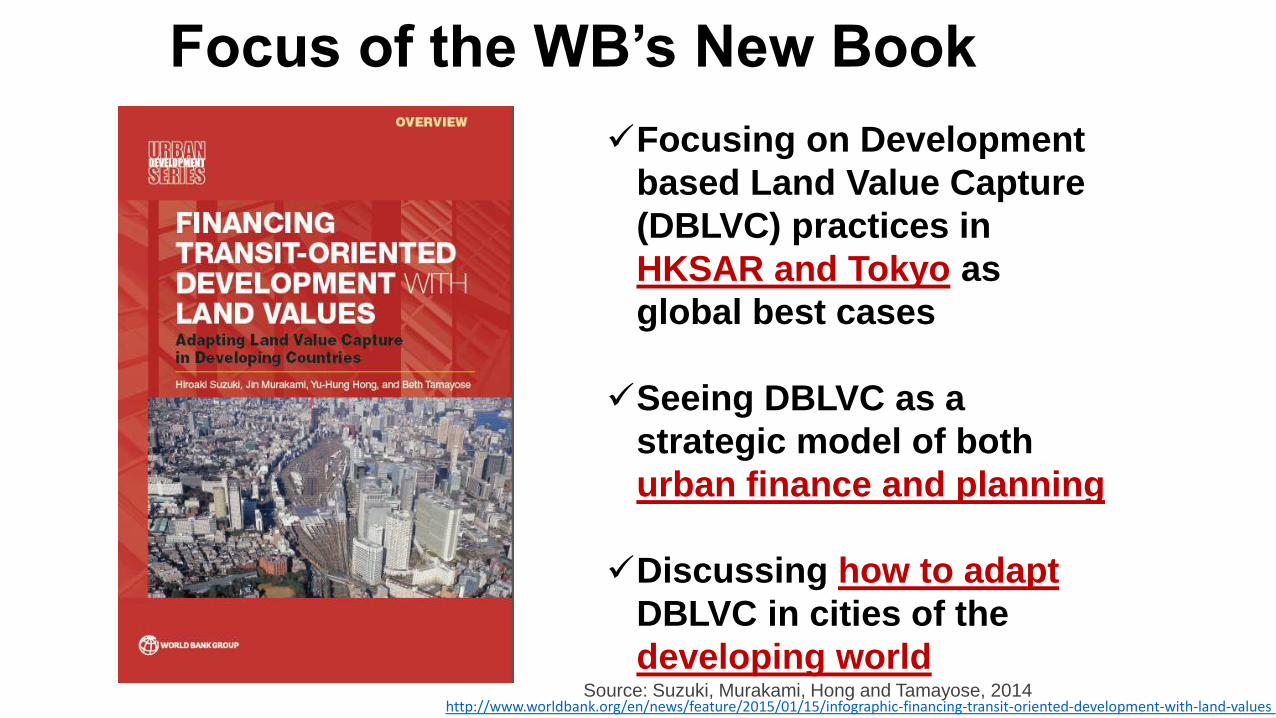
Focus of the WB’s New Book
Source: Suzuki, Murakami, Hong and Tamayose, 2014
Focusing on Development
based Land Value Capture
(DBLVC) practices in
HKSAR and Tokyo as
global best cases
Seeing DBLVC as a
strategic model of both
urban finance and planning
Discussing how to adapt
DBLVC in cities of the
developing world
http://www.worldbank.org/en/news/feature/2015/01/15/infographic-financing-transit-oriented-development-with-land-values
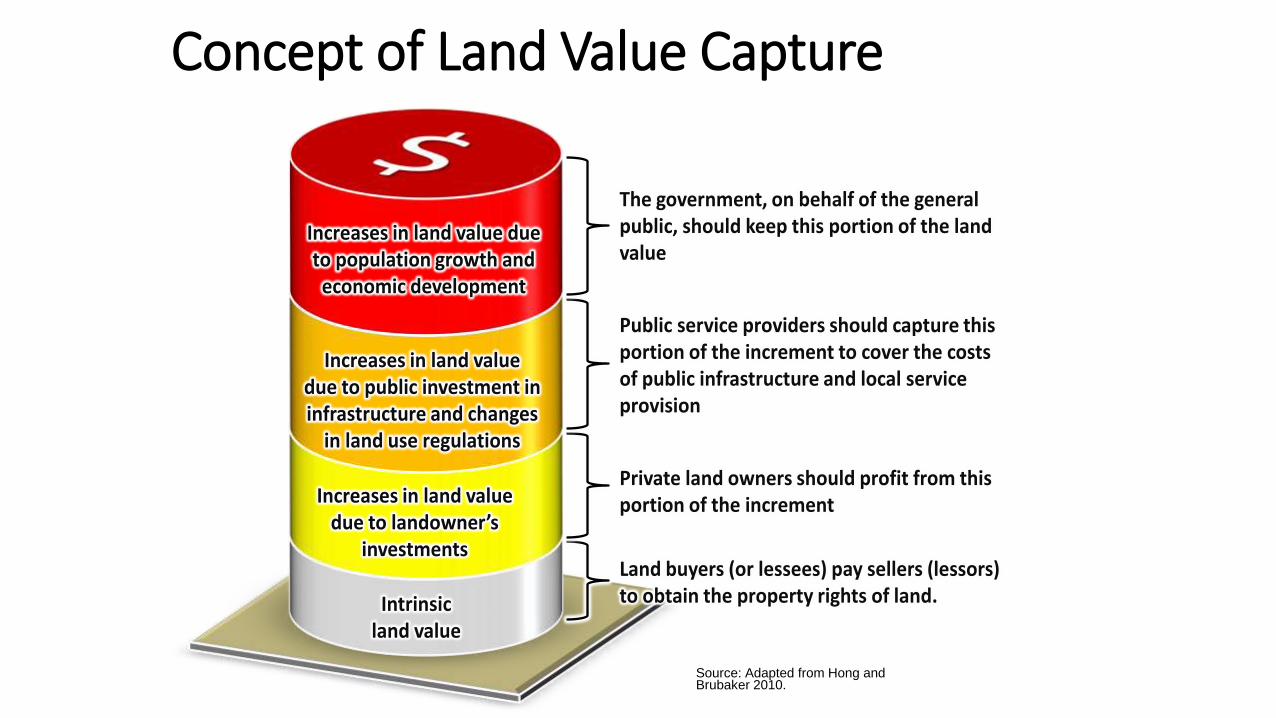
Concept of Land Value Capture
Intrinsic land value
Increases in land value due to landowner’s
investments
Increases in land value due to public investment in infrastructure and changes
in land use regulations
Increases in land value due to population growth and economic development
Land buyers (or lessees) pay sellers (lessors) to obtain the property rights of land.
Private land owners should profit from this portion of the increment
Public service providers should capture this portion of the increment to cover the costs of public infrastructure and local service provision
The government, on behalf of the general public, should keep this portion of the land value
Source: Adapted from Hong and Brubaker 2010.

How to Maximize Revenues from Transit-Oriented Development (TOD)?
Transit
Business As Usual Vertical & Horizontal TOD
Quantity - Density
Quantity - CatchmentVC1
VC2
OV
VC2
OV
VC1
Tools• FAR Increase• Transfer of
Development Right• Land Adjustment• Urban Re-development,
etc.
Tools• Transit Feeder• Bus Terminal• Bicycle Lanes, etc. 11
Value Capture (VC1)
Original Value (OV)

GROW HIGH: Increasing Densities

EXPANDING:Rail & Bus Catchment Area
Source: Toyama City
RailBus
Catchment
Rail enjoys Economies of ScaleBus enjoys Economies of Scope
Toyama LRT & Bus Catchment Area
13

How to Create Land Value Increments in TOD Areas? Quality Matters.
Transit
Quality Urban Design Enhancing TOD
Efficient
Functional VC1
VC2
OV
Pleasant
Vibrant
VC3 Quality
Quantity
B as Usual
Original V
14
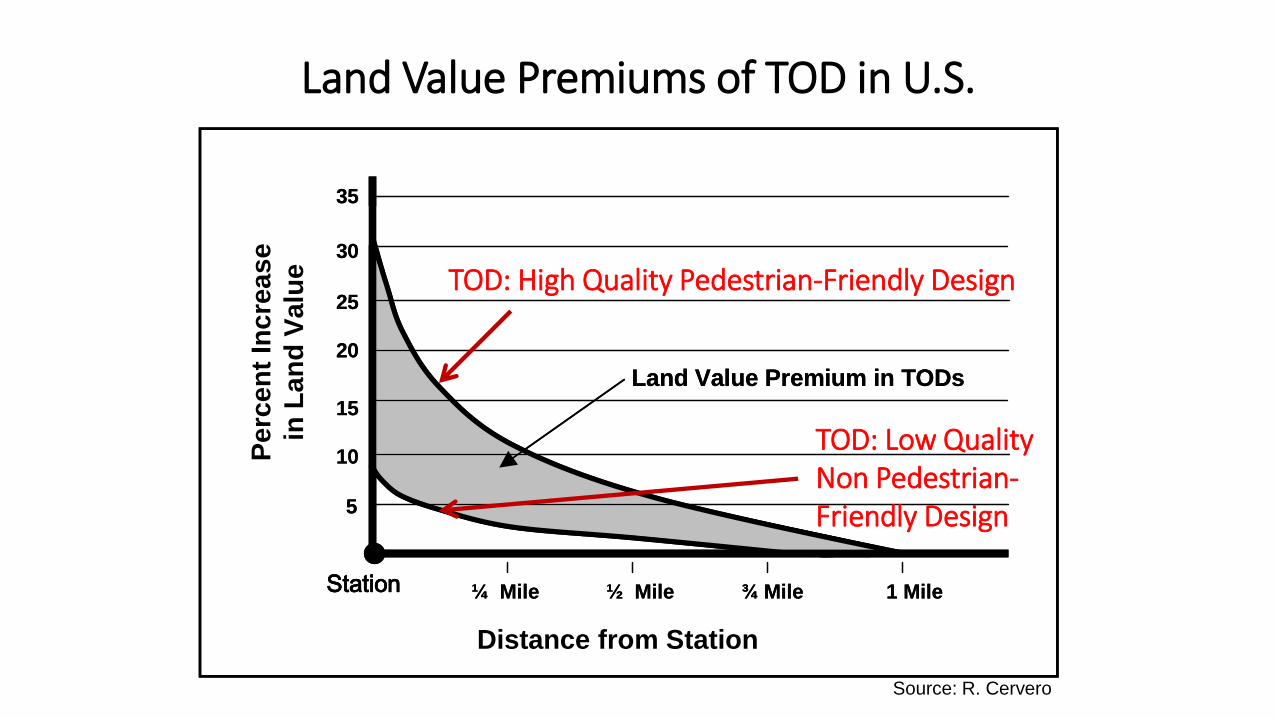
Land Value Premiums of TOD in U.S.
Station
Pe
rce
nt
Inc
rea
se
in L
an
d V
alu
e
Distance from Station
5
10
15
20
25
30
35
½ Mile 1 Mile¾ Mile¼ Mile
Land Value Premium in TODs
Station
Pe
rce
nt
Inc
rea
se
in L
an
d V
alu
e
Distance from Station
5
10
15
20
25
30
35
½ Mile 1 Mile¾ Mile¼ Mile
Land Value Premium in TODs
TOD: High Quality Pedestrian-Friendly Design
TOD: Low Quality Non Pedestrian-Friendly Design
Source: R. Cervero
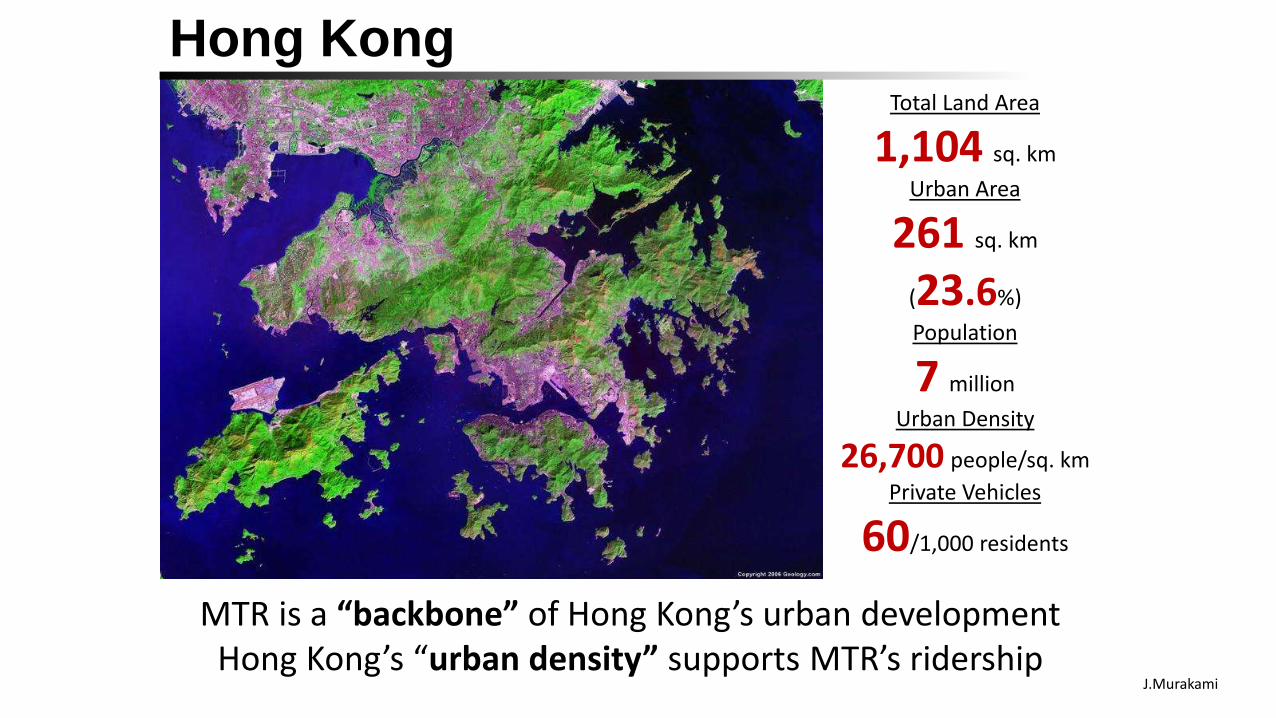
Total Land Area
1,104 sq. km
Urban Area
261 sq. km
(23.6%)
Population
7 million
Urban Density
26,700 people/sq. km
Private Vehicles
60/1,000 residents
Hong Kong
MTR is a “backbone” of Hong Kong’s urban developmentHong Kong’s “urban density” supports MTR’s ridership
J.Murakami

HKSAR: R+P Program (1)
Sources: Based on Cervero and Murakami 2009.Note: MTR = mass transit railway.

HKSAR: R+P Mechanism (2)
Source: Based on Hong Kong SAR, China, Mass Transit Railway (MTR) route maps and other maps.Note: R+P = Rail Plus Property.
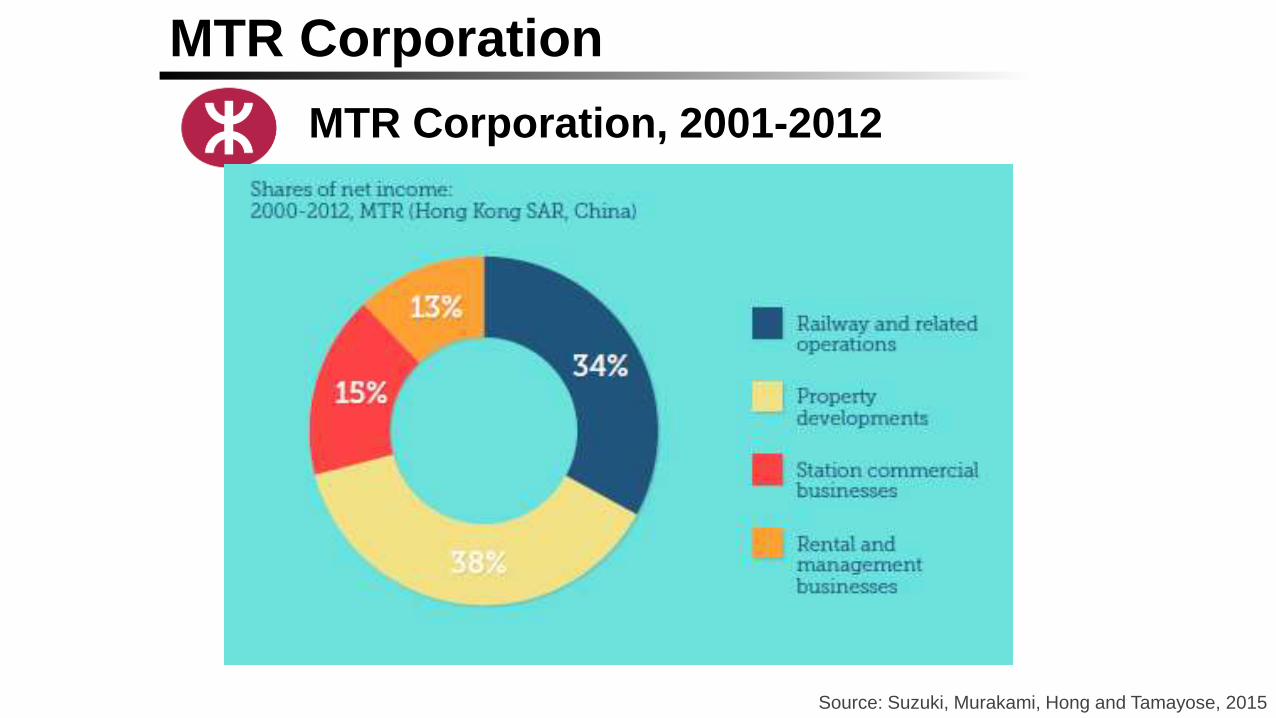
MTR Corporation
http://eoimages.gsfc.nasa.gov/images/imagerecords/0/896/earth_lights_lrg.jpg
MTR Corporation, 2001-2012
Source: Suzuki, Murakami, Hong and Tamayose, 2015

Early GenerationTin Hau Station (1989)
Site Area…0.58 ha
Residential… 61,000 sqm(72.9%)
Commercial… 3,700 sqm(4.4%)
Others… 19,000 sqm(22.7%)
Parking… 650 lots
F.A.R… 14.43
J.Murakami

Integrated Development Package
Source: AL Stephan (2013)
Kowloon Station (1998-2010): 13.5 ha
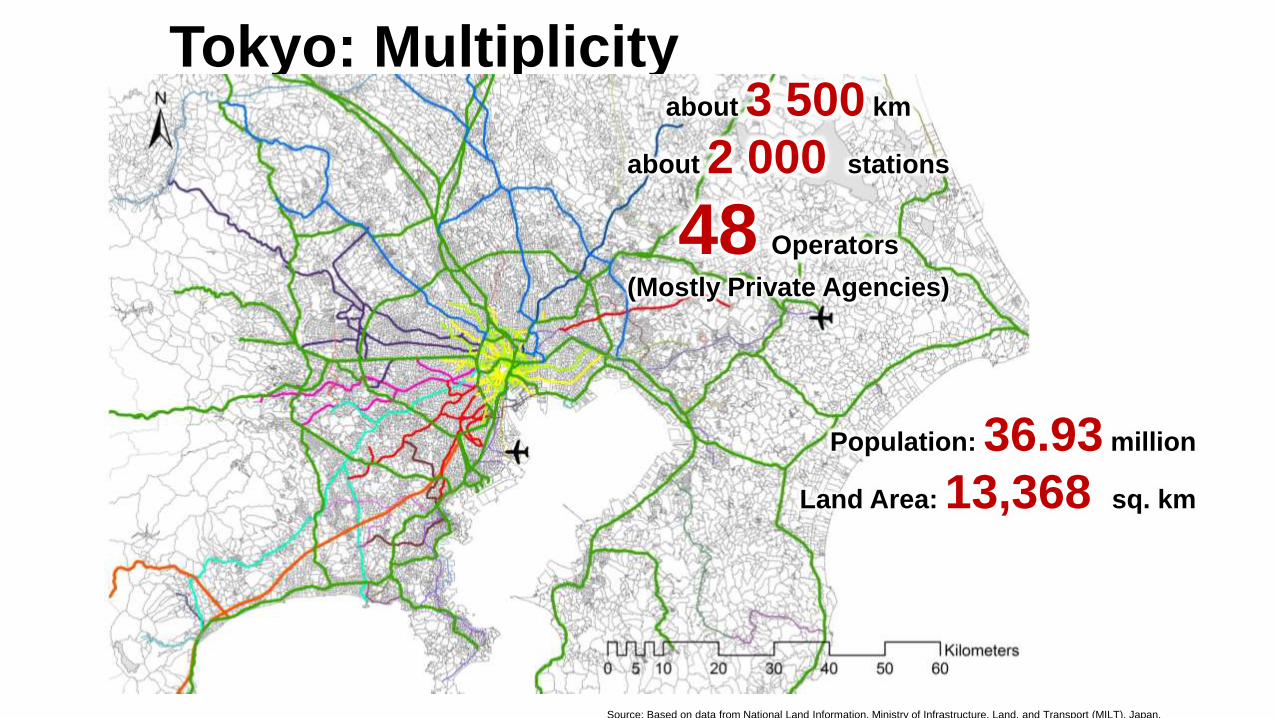
Tokyo: Multiplicityabout 3 500 km
about 2 000 stations
48 Operators
(Mostly Private Agencies)
Source: Based on data from National Land Information, Ministry of Infrastructure, Land, and Transport (MILT), Japan.
Population: 36.93 million
Land Area: 13,368 sq. km

Example 1: Tokyu Corporation (1)
Tokyu Corporation, 2003-2012
Source: Suzuki, Murakami, Hong and Tamayose, 2015

Example 1: Tokyu Corporation (2)
Privately Develop & Operate
Total 105 km Rail Network
Garden City
Shibuya
J.Murakami
Tama-Plaza Station Area (5.1 ha)
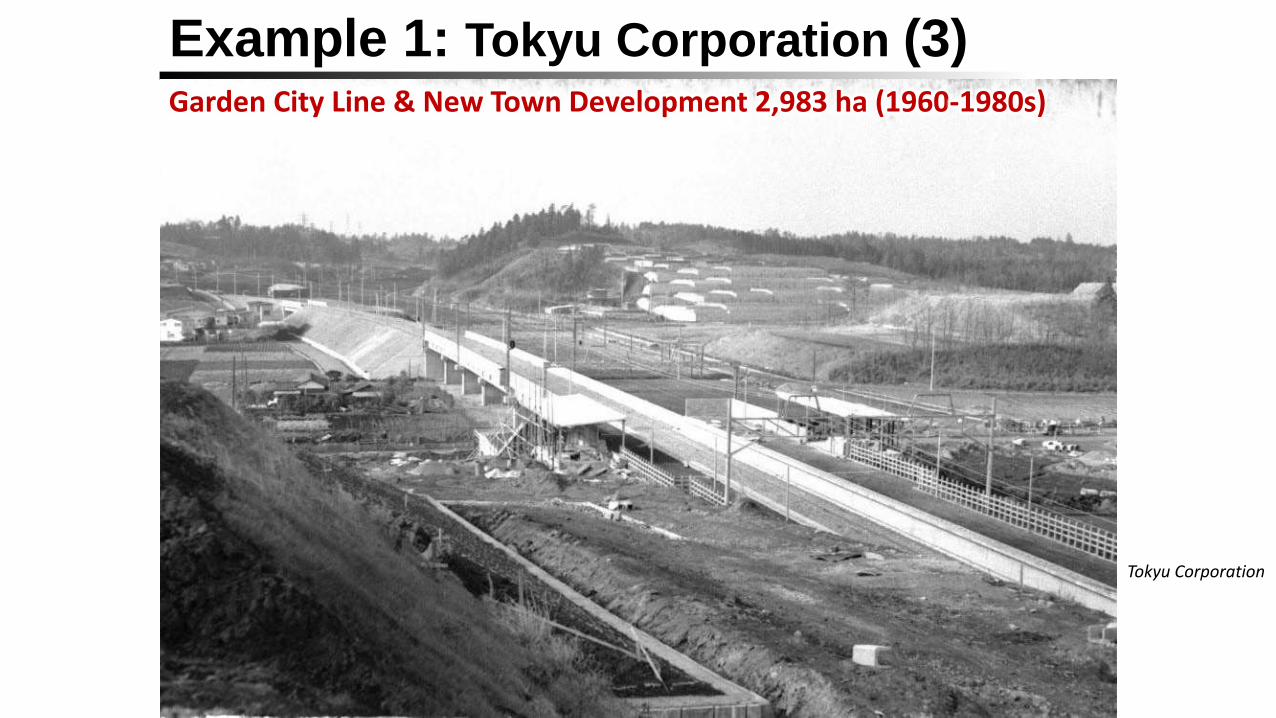
Example 1: Tokyu Corporation (3)
Source: Nikken Sekkei Corporation
Garden City Line & New Town Development 2,983 ha (1960-1980s)
Tokyu Corporation
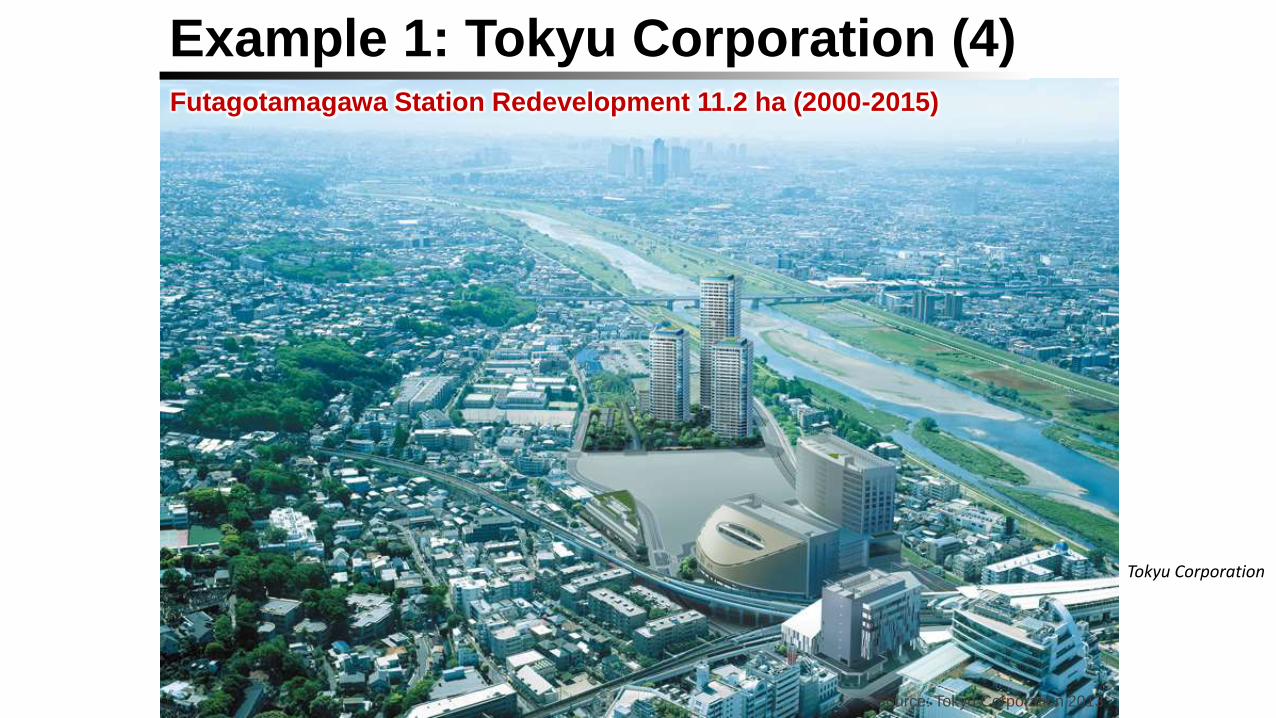
Futagotamagawa Station Redevelopment 11.2 ha (2000-2015)
Source: Tokyu Corporation 2013
Example 1: Tokyu Corporation (4)
Tokyu Corporation

Shop
Corporate Ownership & Stewardship Model
Group’s Intergenerational Resource Allocation
Very-Low
Ridership
Farm LandLand Readjustment
Univ. house house house houseMall
High percentage of the key station areas are
owned by Tokyu Corporation
Tokyu’s
Railway BusinessTokyu’s
Property Business
High
Ridership
Land Readjustment/Redevelopment
Condo.
Office/Hotel
Very High
Ridership
Example 1: Tokyu Corporation (5)
J.Murakami

Example 2: H-R Integration (1)
Source: Chiba Prefecture 2012
Tsukuba Express (1998-2006)
Chiba
Ibaragi
Saitama
TokyoYamanoteLoop
TX
Tsukuba
AkihabaraPlanning Area
Intensive Area
Chiba
Ibaragi
Saitama
TokyoYamanoteLoop
TX
Tsukuba
AkihabaraPlanning Area
Intensive Area
58 km
20 Stations
Rail Construction Costs
US$ 9.4 billion
Integrated Housing-Rail
Development Act of 1989
Land Readjustment Projects
19 Districts
Total 2,908 ha
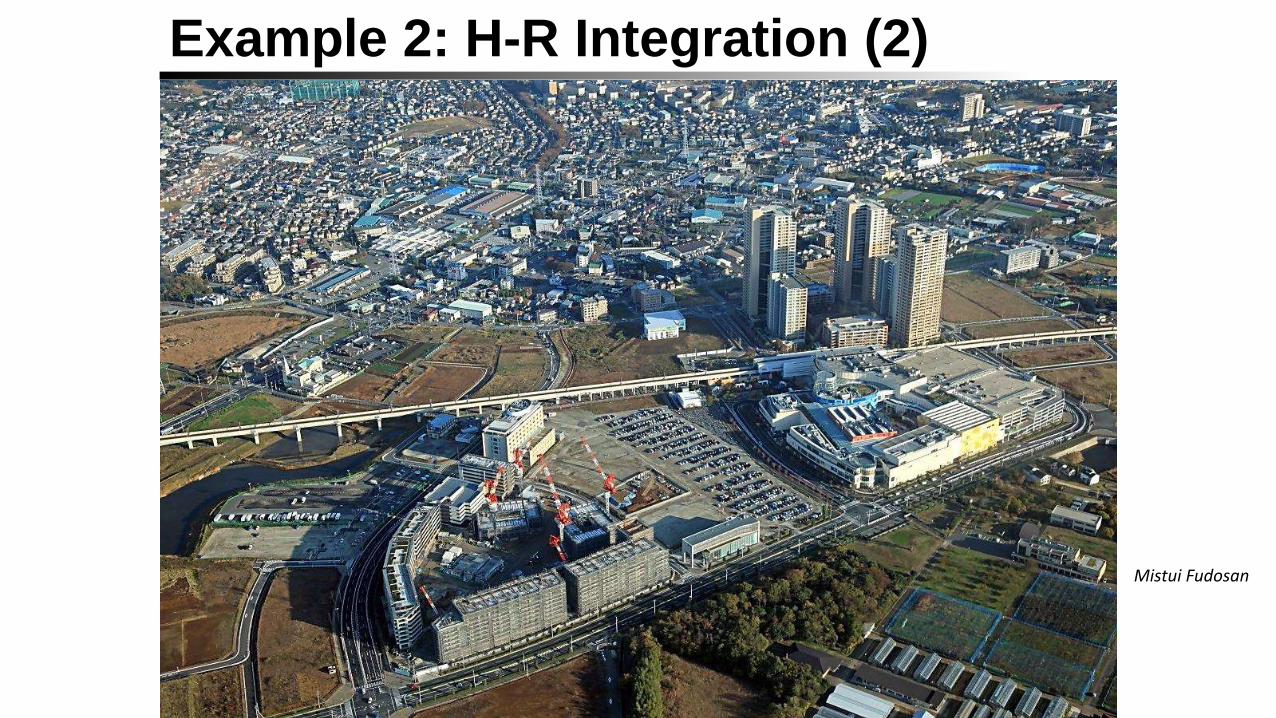
Example 2: H-R Integration (2)
Source: Chiba Prefecture 2012
Mistui Fudosan
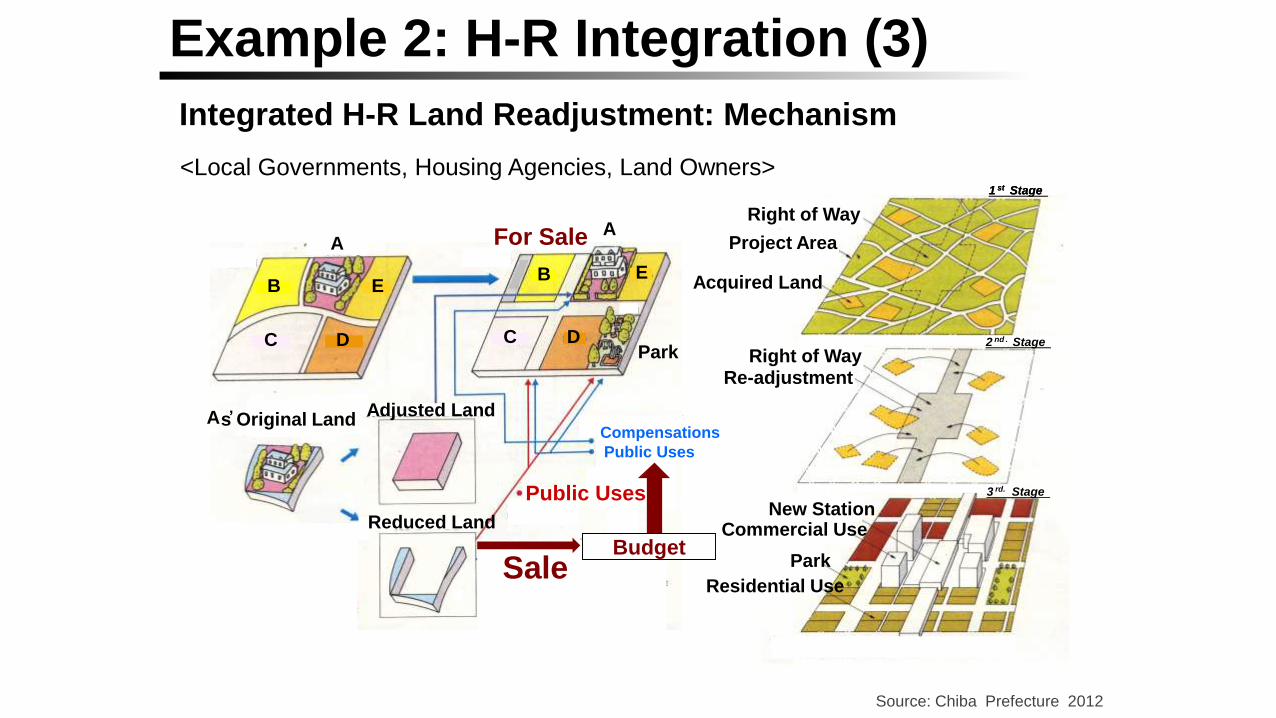
Example 2: H-R Integration (3)
Source: Chiba Prefecture 2012
AA
BB E
E
DDC C
Park
A’s Original LandAdjusted Land
Reduced Land
Public Uses
Investment
Public Budget
Public UsesCompensations
Sale
For SaleAA
BB E
E
DDC CPark
A ’s Original LandAdjusted Land
Reduced Land
Budget
Compensations
Sale
For Sale
Public Uses
Public Uses
1 st Stage
Right of Way
Land Re-adjustment
Project Area
Acquired Land
Readjustment
2 nd . Stage
3 rd. Stage
New Station
Right of Way
Commercial Use
Park
Residential Use
1 st Stage
Right of Way
-Project Area
Acquired Land
Re-adjustment
2 nd . Stage
3 rd. Stage
New Station
Right of Way
Commercial Use
Park
Residential Use
Integrated H-R Land Readjustment: Mechanism
<Local Governments, Housing Agencies, Land Owners>

Example 3: Depot Redevelopment (1)
Source: JNR Settlement Corporation 2008
Urban Regeneration
Jin Murakami

JNR Yard: National Land Sales
Shinagawa Station 16.2 ha (1992-2008)
Example 3: Depot Redevelopment (2)
Source: JNR Settlement Corporation 2008

Civic Space Provision & FAR Bonus
(e.g., Case of Shinagawa Station Area)
4.0
FAR AssessmentBefore
(Industrial Site)
4.0
7.0
BaseFAR
After(Office Site)
Green Space, Underground Access Road & Pedestrian Network18,167 sq.m. Civic Open Space12,480 sq.m
+1.9
Joint Housing Provision35,433 sq.m.
+0.6
9.5
Example 3: Depot Redevelopment (3)
J.Murakami
34
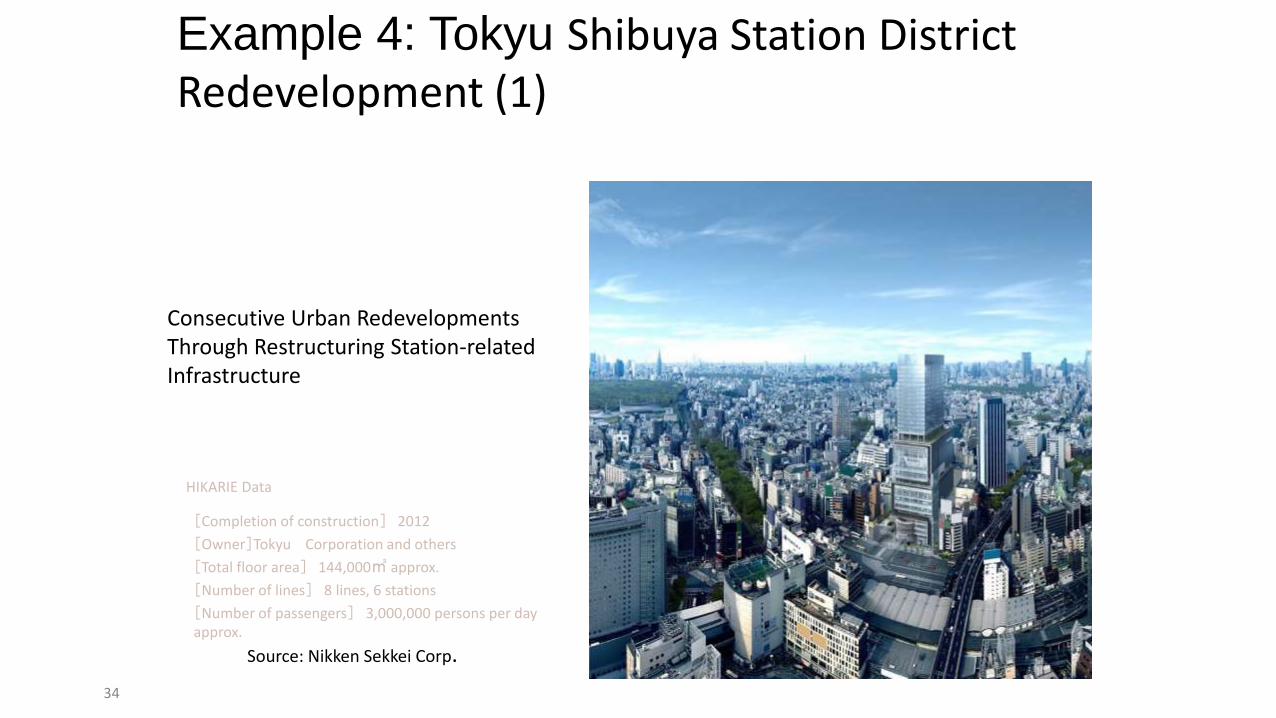
HIKARIE Data
Consecutive Urban Redevelopments Through Restructuring Station-related Infrastructure
[Completion of construction] 2012
[Owner]Tokyu Corporation and others
[Total floor area] 144,000㎡ approx.
[Number of lines] 8 lines, 6 stations
[Number of passengers] 3,000,000 persons per day approx.
Source: Nikken Sekkei Corp.
Example 4: Tokyu Shibuya Station District Redevelopment (1)
35
涩谷新文化街区
计划开发街区
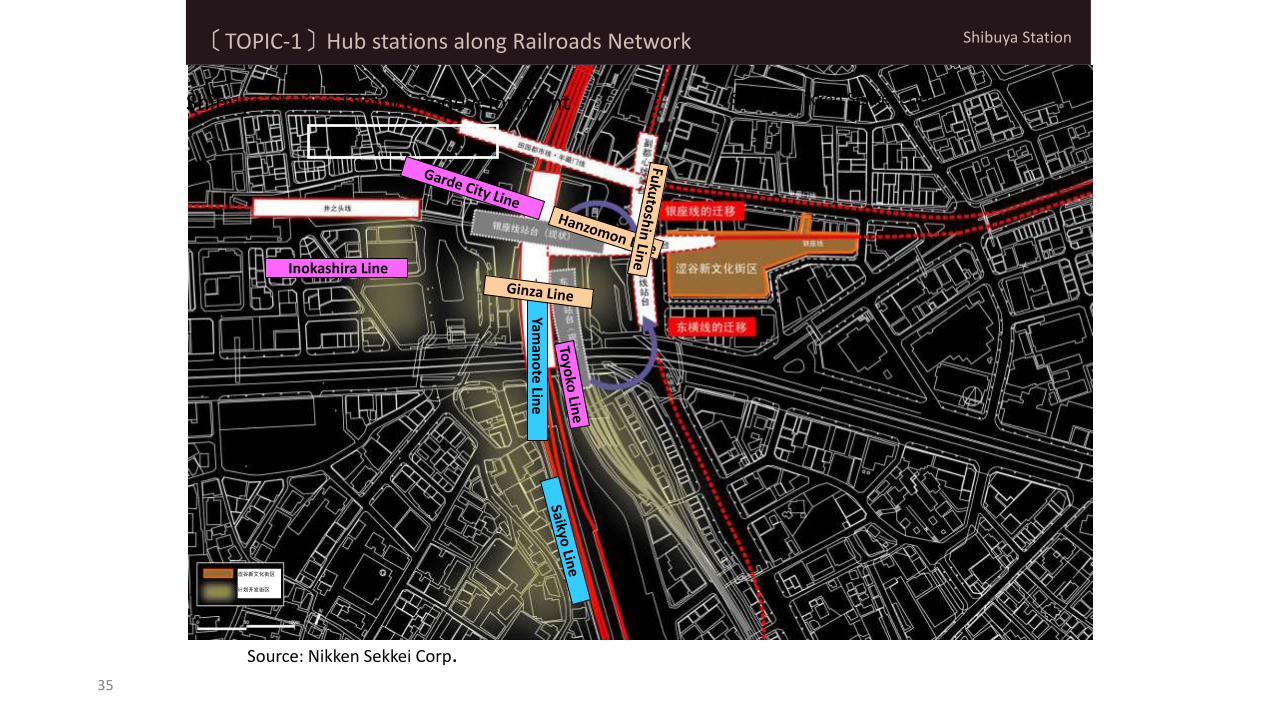
Shibuya Station
Shibuya Station District Redevelopment
〔TOPIC-1〕Hub stations along Railroads Network
Inokashira Line
Yaman
ote Lin
e
Source: Nikken Sekkei Corp.
Source: Nikken Sekkei Corp.

36
至品川
至新宿
2nd/Ground/Underground Floor
Shibuya StationExample 4: Tokyu Shibuya Station District Redevelopment (2)〔Lower Level Connection (B1F, GL, 2nd)
Source: Nikken Sekkei Corp.

Tokyo: Strategic Inclusive Urban
Redevelopment in Built-Up Areas
Sources: Adapted from Ministry of Land, Infrastructure, Transport, and Tourism 2013

ConclusionTOD which creates articulated densities around transit hubs by
locating amenities, employment, retail, and housing in close proximity—is one of the most effective ways to achieve sustainable urban development. Collaborative efforts of municipalities, transit agencies,
developers, landowners, and communities can maximize LVCpremium. In this joint value-creating and sharing exercise, municipalities and transit agencies can contribute significantly to value creation either through zoning changes (FARs and land use) or through transit investment. The rapid population increase and robust economic growth in
rapidly growing cities in developing countries, particularly in middle-income countries, are certainly favorable for development-based LVC.

TODSustainable
Urban DevelopmentLVC
39
New Book Soon
THANKS
[email protected]://openknowledge.worldbank.org/handle/10986/12233
http://documents.worldbank.org/curated/en/2014/01/20351542/financing-transit-oriented-development-land-values-adapting-land-value-capture-developing-countries-overview
https://openknowledge.worldbank.org/handle/10986/2453
http://www.worldbank.org/en/news/feature/2015/01/15/infographic-financing-transit-oriented-development-with-land-values