financing the metropolis - munk school of global affairs - university
TRANSCRIPT
Financing the Metropolis Presentation to International Symposium on Innovations and the Making of Metropolitan Identity Paris, France 27 November, 2013 Enid Slack Institute on Municipal Finance and Governance Munk School of Global Affairs University of Toronto
Introduction Metropolitan areas are generally characterized by many small, fragmented local governments and public agencies that provide local services in different parts of the region
Governance of these metropolitan areas is thus critical to coordinate service delivery across local government boundaries and to help shape a metropolitan identity
This presentation asks “how do you deliver services and pay for them on a metropolitan-wide basis when there are many local governments?”
2
Outline of Presentation
Governance in metropolitan areas
Need to balance metropolitan and local interests
How do different governance models achieve this balance? How do they impact service delivery and taxes?
Financing services in metropolitan areas
How should metropolitan services be paid for?
Which revenue tools?
3

Balancing metropolitan and local interests
Efficiency Ability to achieve economies of scale Ability to reduce negative spillovers (externalities) across
local boundaries
Equity Ability to share costs and benefits of services fairly across
the metropolitan area Accessibility and accountability for decision-making Local responsiveness/competition
4

How well do different governance models achieve this balance?
One-tier government model (fragmented local governments)
One-tier government model (consolidated local governments)
Two-tier government model
Voluntary cooperation/special purpose districts
5

Fragmented One-Tier
Many local governments operate in metropolitan area with independence in choosing public services and fees, taxes, and debt financing
Local autonomy, responsiveness, competition
Inability to address spillovers; lack of coordination of services, planning and economic development; cost of services not shared equitably across metropolitan area
6
One-Tier Consolidated Metropolitan government with powers to regulate
service delivery and financing across metropolitan area
Economies of scale; redistribution between rich and poor areas; coordination of service delivery; potential for more local influence with national policy makers; more unified actions for urban problems that do not respect political boundaries e.g. floods, crime, environmental pollution; more choices for efficient taxation
Threat to local autonomy, responsiveness, and citizen
engagement
7

Economies of Scale? Spreading fixed costs over a larger population lowers per capita costs (e.g. public transit); economies from bulk purchases (e.g. busses, computer equipment, etc.)
Empirical evidence shows economies of scale are service- specific:
Some economies of scale in central administrative functions; services with large capital inputs e.g. transportation, water and sewage systems
Cities can also become too large – diseconomies of scale
Canadian evidence: economies of scale for police at 50,000 people; for fire at 20,000 people (Found 2012)
Evidence from Finland: economies of scale between 20,000 and 40,000 people (Moisio et al.)
8

Cost of Service Delivery
Does consolidation/amalgamation reduce the cost of service delivery?
May be able to achieve economies of scale and reduce duplication
BUT:
harmonization of wages and salaries
harmonization of service levels
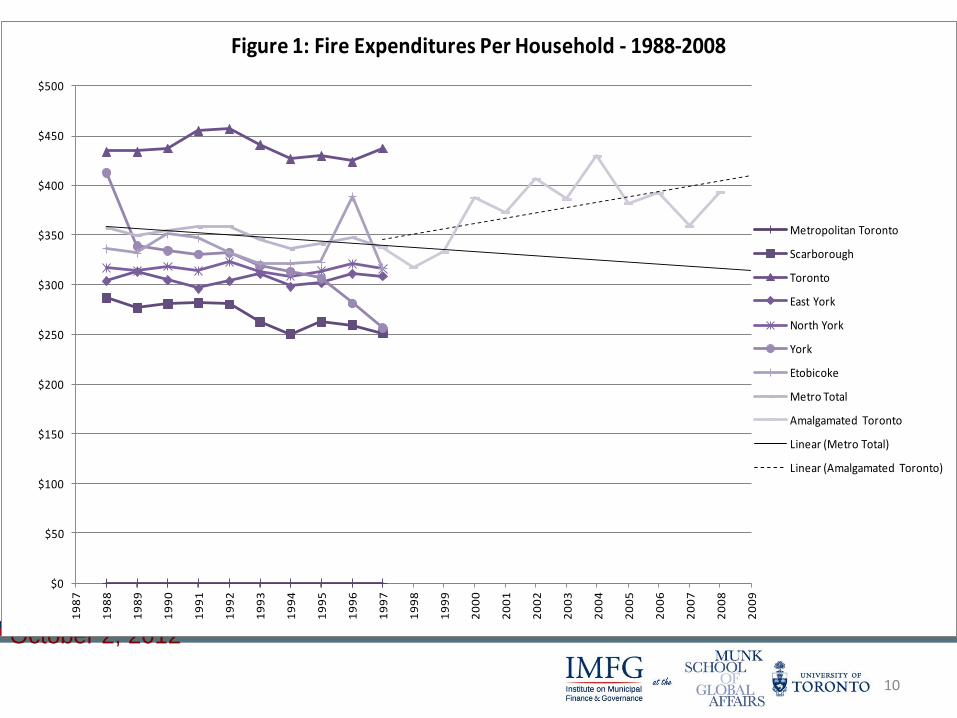
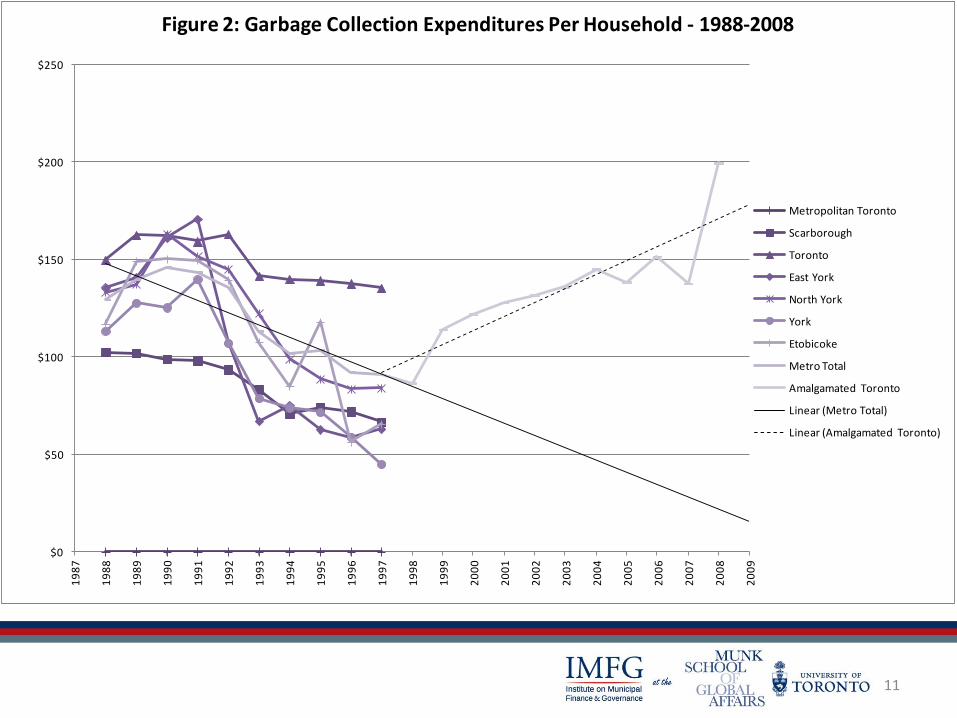
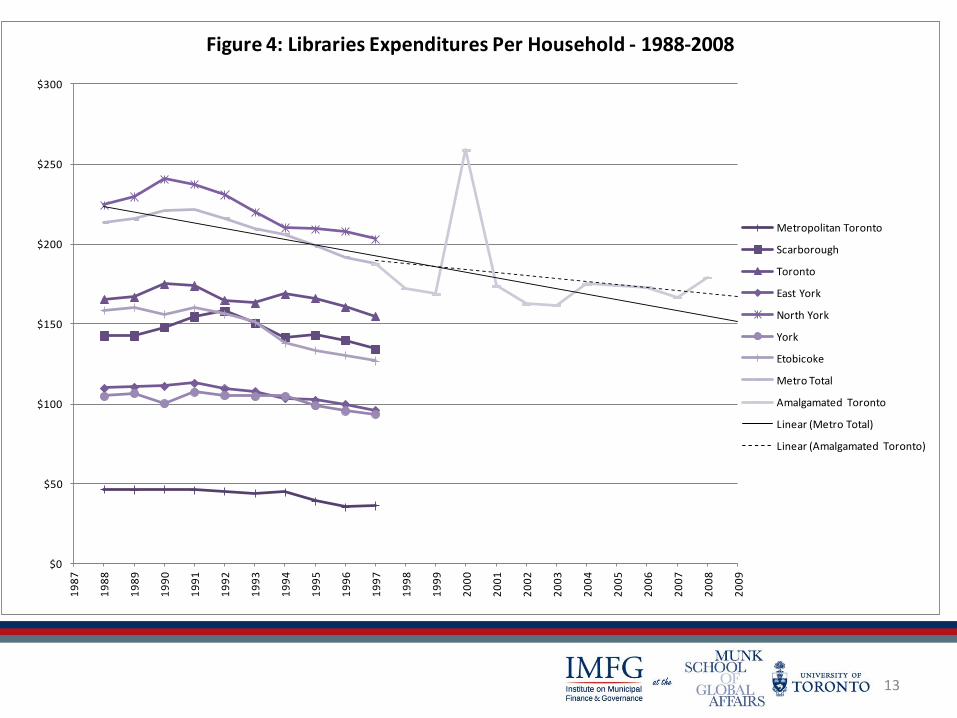
Case study of Toronto amalgamation 1998
9
Merging Municipalities: Is Bigger Better?
Enid Slack and Richard Bird
University of Toronto
Presentation to Government Institute for Economic Research (VATT)
Helsinki, Finland
October 2, 2012
$0
$50
$100
$150
$200
$250
$300
$350
$400
$450
$5001
98
7
19
88
19
89
19
90
19
91
19
92
19
93
19
94
19
95
19
96
19
97
19
98
19
99
20
00
20
01
20
02
20
03
20
04
20
05
20
06
20
07
20
08
20
09
Figure 1: Fire Expenditures Per Household - 1988-2008
Metropolitan Toronto
Scarborough
Toronto
East York
North York
York
Etobicoke
Metro Total
Amalgamated Toronto
Linear (Metro Total)
Linear (Amalgamated Toronto)
10
11
$0
$50
$100
$150
$200
$2501
98
7
19
88
19
89
19
90
19
91
19
92
19
93
19
94
19
95
19
96
19
97
19
98
19
99
20
00
20
01
20
02
20
03
20
04
20
05
20
06
20
07
20
08
20
09
Figure 2: Garbage Collection Expenditures Per Household - 1988-2008
Metropolitan Toronto
Scarborough
Toronto
East York
North York
York
Etobicoke
Metro Total
Amalgamated Toronto
Linear (Metro Total)
Linear (Amalgamated Toronto)

12
$0
$100
$200
$300
$400
$500
$6001
98
7
19
88
19
89
19
90
19
91
19
92
19
93
19
94
19
95
19
96
19
97
19
98
19
99
20
00
20
01
20
02
20
03
20
04
20
05
20
06
20
07
20
08
20
09
Figure 3: Parks & Recreation Expenditures Per Household - 1988-2008
Metropolitan Toronto
Scarborough
Toronto
East York
North York
York
Etobicoke
Metro Total
Amalgamated Toronto
Linear (Metro Total)
Linear (Amalgamated Toronto)
13
$0
$50
$100
$150
$200
$250
$3001
98
7
19
88
19
89
19
90
19
91
19
92
19
93
19
94
19
95
19
96
19
97
19
98
19
99
20
00
20
01
20
02
20
03
20
04
20
05
20
06
20
07
20
08
20
09
Figure 4: Libraries Expenditures Per Household - 1988-2008
Metropolitan Toronto
Scarborough
Toronto
East York
North York
York
Etobicoke
Metro Total
Amalgamated Toronto
Linear (Metro Total)
Linear (Amalgamated Toronto)

Two-Tier Model
Upper tier provides services that are region-wide, lower tiers provide local services
Upper tier: economies of scale , redistribution, and internalize externalities
Lower tiers: access and accountability
Costs may be higher because of waste and duplication; may be less transparent and more confusing for citizens
14

Special Purpose Districts
Single function placed under control of special district government; may have access to dedicated revenue stream (e.g. user fee or earmarked tax)
Easy to create politically; easy to disband; local autonomy; economies of scale; address externalities
Potential problems of accountability; redistribution not
automatic
15

Examples from Nine Federal Countries
16
Country Metropolitan Area Governance Model
Australia South East Queensland
(Brisbane)
One-tier; strong state role
Perth Fragmented local governments; strong state role
Brazil Belo Horizonte Voluntary cooperation; state government in charge of shared
functions; inter-municipal cooperation
São Paulo Special purpose districts; state role
Canada Toronto One-tier consolidated
Vancouver Two-tier
Germany Central Germany Voluntary cooperation
Hamburg Voluntary cooperation
India Hyderabad Amalgamation; special purpose agencies
Mumbai Special purpose agencies
South Africa Gauteng city region 3 metros; limited inter-municipal cooperation
Cape Town One-tier consolidated
Spain Barcelona Two-tier
Madrid Two-tier
Switzerland Geneva Purpose-oriented intergovernmental cooperation
Zurich Purpose-oriented intergovernmental cooperation
United States Louisville Consolidated one-tier
Los Angeles Fragmented one-tier

Findings from Governance Research
Different models have worked in different places at different times Political boundaries rarely coincide with boundaries of the economic region Strong traditions of local autonomy make metro-wide
cooperation difficult
Special districts may work where metropolitan area is too large for a political structure
Consolidation does not necessarily reduce costs but may make it easier to levy taxes over the metropolitan area
17

How to Pay for Metropolitan Services
Connection between those who decide, those who benefit, and those who pay:
Expenditure responsibilities matched by revenue resources
Revenue capacities matched with political accountability
Benefit areas matched with financing areas
18

How to Pay for Metropolitan Services
Taxes levied by local governments should fall on local residents or non-residents (commuters and visitors) who benefit from services
The more closely spending and taxing decisions are linked by being made by the same body at the same time, the better government will be efficiency of service delivery
Lack of metropolitan governing structure is a constraint in providing local services efficiently in metropolitan areas
19
20
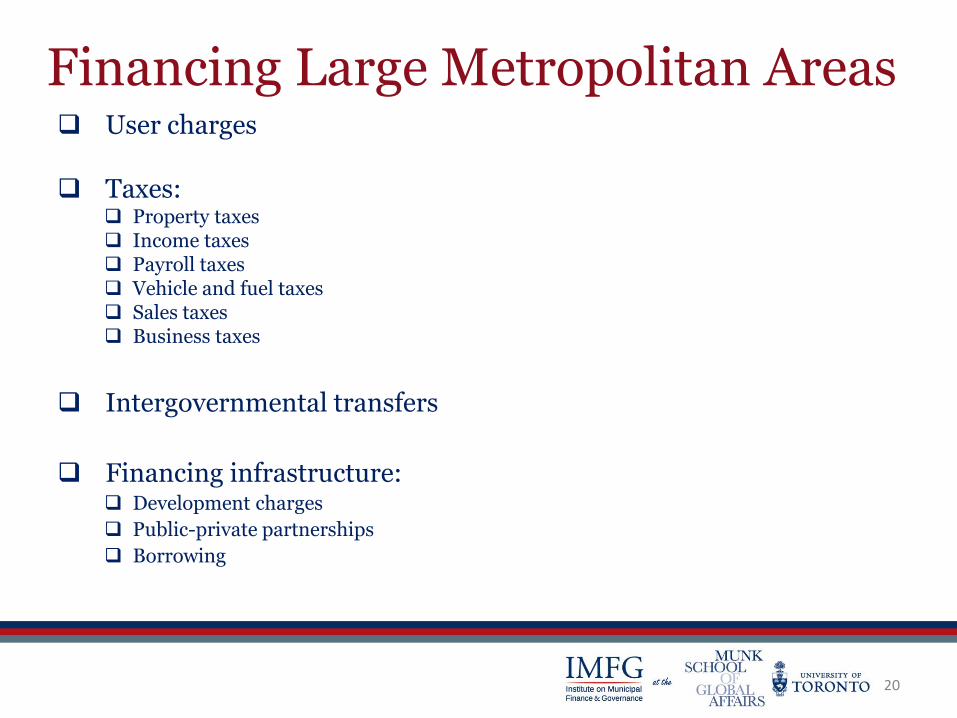
Financing Large Metropolitan Areas User charges Taxes:
Property taxes Income taxes Payroll taxes Vehicle and fuel taxes Sales taxes Business taxes
Intergovernmental transfers
Financing infrastructure: Development charges
Public-private partnerships
Borrowing

DIFFERENT SERVICES – DIFFERENT REVENUE TOOLS
Private Public Redistributive Spillovers
Water Police Social assistance Roads/transit
Sewers Fire Social housing Culture
Garbage Local parks Social assistance
Transit Street lights
__________________________________________________
User fees Property tax Income tax Intergovernmental
Sales tax Transfers
21

DIFFERENT INFRASTRUCTURE – DIFFERENT FISCAL TOOLS
Taxes User fees Borrowing
______________________________________________
short asset life identifiable beneficiaries large scale assets (police cars, (transit, water) with long life
computers) (roads, bridges)
22

DIFFERENT INFRASTRUCTURE – DIFFERENT FISCAL TOOLS
Development charges P3s Land value capture
taxes
______________________________________________
Growth-related costs; large in scale; increase property values
new development or revenue stream; (transit)
redevelopment measurable results
(water, roads, sewers) (toll roads)
23

24
Own-source
revenues
(taxes, user
fees, other
own-source
revenues)
Shared
taxes
Intergovernmental
Transfers
London (2011/12)
Berlin (2010)
Madrid (2009)
New York (2011)
Paris (2011)
Tokyo (2010)*
26.2
39.5
58.5
69.1
82.5
82.3
35.0
4.5
9.5
73.9
25.5
37.0
30.9
17.5
7.7
Distribution of Own-Source Revenues, Shared Taxes, and Transfers
(%) .
Note: *Included in own-source revenues are some taxes over which the metropolitan
government has limited flexibility over tax rate setting
How Should Metropolitan Services be Financed?
Metropolitan areas should have greater fiscal autonomy than other urban areas –
greater responsibility for local services
greater ability to levy own taxes, collect own revenues, and borrow for capital expenditures
less dependence on intergovernmental transfers
BUT
they need a governance structure that will allow them to levy taxes on a metropolitan-wide basis
25

Final Comments Area-wide general purpose government to address public financing problems in metropolitan areas may not be attainable
A two-tier metropolitan structure could foster a metropolitan identity, address metro-wide issues, while still retaining local autonomy
Elected metropolitan governments could be viewed as service delivery areas and financing districts (matching taxes and expenditures, beneficiaries and payers)
Room for metro-wide governments to contribute more own- source revenues to finance services in metro areas: user fees and taxes (e.g. property, income); less dependence on transfers
26