financing patterns of european smes revisitedthis eif working paper investigates financing patterns...
TRANSCRIPT
An Updated Empirical Taxonomy and Determinants of SME Financing Clusters
Working Paper 2017/40
EIF Research & Market Analysis
Christian Masiak Alexandra Moritz
Frank Lang
Financing Patterns of European SMEs Revisited:

Editor
Helmut Kraemer-Eis,
Head of EIF’s Research & Market Analysis, Chief Economist
Contact:
European Investment Fund
37B, avenue J.F. Kennedy, L-2968 Luxembourg
Tel.: +352 248581 394
http://www.eif.org/news_centre/research/index.htm
Luxembourg, March 2017
Christian Masiak is PhD student and research assistant at the Chair of
Management at the University of Trier.
Contact: [email protected]
Tel.: +49 651 201 4489
Alexandra Moritz is research associate at the Chair of Management at
the University of Trier. Alexandra is also managing director at the
research institute “Forschungsstelle Mittelstand” at the University of Trier.
Contact: [email protected]
Tel.: +49 651 201 3232
Frank Lang is Senior Manager in EIF’s Research & Market Analysis team.
Contact: [email protected]
Tel.: +352 248581 278
Scan above to
obtain a PDF
version of this
working paper
Disclaimer:
This Working Paper should not be referred to as representing the views of the European Investment
Fund (EIF) or of the European Investment Bank Group (EIB Group). Any views expressed herein,
including interpretation(s) of regulations, reflect the current views of the author(s), which do not
necessarily correspond to the views of EIF or of the EIB Group. Views expressed herein may differ
from views set out in other documents, including similar research papers, published by EIF or by
the EIB Group. Contents of this Working Paper, including views expressed, are current at the date
of publication set out above, and may change without notice. No representation or warranty,
express or implied, is or will be made and no liability or responsibility is or will be accepted by EIF
or by the EIB Group in respect of the accuracy or completeness of the information contained
herein and any such liability is expressly disclaimed. Nothing in this Working Paper constitutes
investment, legal, or tax advice, nor shall be relied upon as such advice. Specific professional
advice should always be sought separately before taking any action based on this Working Paper.
Reproduction, publication and reprint are subject to prior written authorisation of the authors.
Preface
Small and medium-sized enterprises (SMEs) play an important role for employment, investment,
innovation, and economic growth of the European economy. However, SMEs differ in many ways
from larger firms, such as, for example, age, size, activity, and ownership. Furthermore, the
macroeconomic environments as well as the legal and institutional frameworks in which they are
active affect SMEs more than larger companies. All this has an impact on, inter alia, the access to
finance of SMEs as well as their financing patterns.
Enhancing the access to finance of SMEs through a wide range of financial intermediaries is the
central mission of the European Investment Fund (EIF). To this end, the EIF primarily designs,
promotes and implements equity and debt financial instruments which specifically target SMEs. In
this role, the EIF fosters EU objectives in support of entrepreneurship, growth, innovation, research
and development, and employment.
EIF’s Research & Market Analysis (RMA) supports EIF’s strategic decision-making, product
development and mandate management processes through applied research and market analyses.
RMA works as internal advisor, participates in international fora and maintains liaison with many
organisations, institutions, universities and think tanks.
EIF’s RMA division and the Chair of Management at the University of Trier have established a
research cooperation, which has already generated many outputs. The most preeminent part of
our cooperation is the joint research project “Financing of European SMEs: Patterns, Determinants
and Dynamics over Time”, which benefitted from a research grant of the STAREBEI research
support programme of the EIB Institute. STAREBEI forms part of the EIB Institute’s Knowledge
Programme, which aims at providing support to higher education and research activities. More
information can be found on the EIB Institute’s website: https://institute.eib.org/.
This EIF Working Paper is a result of our joint STAREBEI research project. A second publication,
which will more strongly focus on the differences between financing patterns of microenterprises
and other SMEs, is underway and will be published soon. More information about the STAREBEI
project can be found here: https://www.uni-trier.de/index.php?id=58427
We thank the authors for their important work and the very good cooperation.
Prof. Dr. Jörn Block Dr. Helmut Kraemer-Eis
Professor of Management at the University of Trier Head of Research & Market Analysis,
and the Erasmus University Rotterdam; Chief Economist, EIF
University Tutor of this project Editor of the EIF Working Paper Series

Abstract1
This EIF Working Paper investigates financing patterns of European SMEs by looking at a large
number of different financing instruments and their complementary and substitutive effects, using
the SAFE dataset collected in 2015. We develop an empirical taxonomy of SME financing patterns
in Europe, applying cluster analyses. In order to investigate the cluster stability over time, we
replicate an approach by Moritz et al. (2016)2
, who used the SAFE data from 2013. In addition,
we extend that study by looking at the role of the country-specific macroeconomic and institutional
environment for the financings patterns of SMEs. Our results confirm the results of Moritz et al.
(2016) and show that European SME financing is not homogenous, but that different financing
patterns exist. Our cluster analysis identifies seven distinct SME financing types based on the
financing instruments used: mixed-financed SMEs with focus on other loans, mixed-financed SMEs
with focus on retained earnings or sale of assets, state-subsidised SMEs, debt-financed SMEs,
trade-financed SMEs, asset-based financed SMEs, and internally-financed SMEs. Moreover, the
SME financing types can be profiled according to their firm-, product-, industry-, and country-
specific characteristics. Our findings can support policy makers in assessing the impact of changes
in policy measures for SME financing.
Keywords: EIF; European SME financing; financing patterns; empirical taxonomy; cluster analysis
JEL codes: G32, G21, G24, G18
1
This paper has benefited from financial support under the STAREBEI program of the European Investment
Bank Institute for financing of University research. We would like to thank Prof. Dr. Joern Block (University
of Trier and Erasmus University Rotterdam), Dr. Andreas Heinz (University of Luxembourg) and Dr. Helmut
Kraemer-Eis (EIF Chief Economist) for their valuable feedback. Moreover, we would like to thank Annalisa
Ferrando from the European Central Bank (ECB) for the fruitful discussions about our research project. The
study benefited from various discussions at the G-Forum in Leipzig, the working group for Entrepreneurship
and Entrepreneurial Financing of the Förderkreis Gründungs-Forschung (FGF) and the seminars at the ECB
and the European Commission. Furthermore, we appreciate the support of Klaus Krummrich und Gregor
Mauer from “Deutscher Sparkassen- und Giroverband (DSGV) Wissenschaftsförderung e.V.”. Further
details about the research project can be found at the dedicated website of the “Forschungsstelle
Mittelstand” of the University of Trier: https://www.uni-trier.de/index.php?id=58427.
2
Former versions of Moritz et al. (2016): Moritz (2015) and Moritz et al. (2015), i.e. EIF Working Paper
2015/30.

Non-technical Summary
This EIF Working Paper investigates financing patterns of European SMEs by looking at a large
number of financing instruments using the European Commission (EC) and European Central Bank
(ECB) Survey on the Access to Finance of Enterprises (SAFE) dataset collected in 2015. We develop
an empirical taxonomy of SME financing patterns in Europe by applying cluster analyses. In order
to investigate the cluster stability over time, we replicate previous work by Moritz et al. (2016),
which was based on the SAFE data from 2013. In addition, we extend that study by looking into
the role of the country-specific macroeconomic and institutional environment on the financing
patterns of SMEs.
Our study confirms the results of Moritz et al. (2016) and shows that European SME financing is
not homogenous, but that different financing patterns exist. Our cluster analysis identifies seven
distinct SME financing types based on the financing instruments used: mixed-financed SMEs with a
focus on other loans, mixed-financed SMEs with a focus on retained earnings or sale of assets,
state-subsidised SMEs, debt-financed SMEs, trade-financed SMEs, asset-based financed SMEs, and
internally-financed SMEs. The SME financing types can be profiled according to their firm-,
product-, industry-, and country-specific characteristics.
When investigating the use of specific financing instruments in the different clusters, we find that
bank loans are relevant for all externally-financed SMEs, except for those in the cluster of asset-
based financed SMEs. Equity capital is almost exclusively used by SMEs in the mixed-financed
cluster with a focus on retained earnings or sale of assets, while subordinated debt instruments,
participating loans and crowdfunding is predominantly used by SMEs in the mixed-financed cluster
with a focus on other loans.
A look at the financing patterns of enterprises with particular characteristics reveals that innovative
SMEs are relatively strongly represented in both mixed-financed clusters and in the cluster that
comprises only state-subsidised SMEs. In the latter, SMEs are also characterised by relatively high
past growth rates and future growth expectations. Even though this cluster contains a large share of
SMEs that perceive high access to finance problems, our analysis shows that many SMEs in the
state-subsidised cluster complement grants or subsidised loans with a large variety of financing
instruments, including bank loans. This is in line with Moritz et al. (2016), and our findings support
their assumption that government promotional programs for relatively risky innovative and fast
growing SMEs appear to send a positive signal to external capital providers (Beck et al. 2008;
Freel 2006; Mina, Lahr, and Hughes 2013).
Apart from the cluster comprising state-subsidised SMEs, those enterprises that perceive major
difficulties when accessing finance are strongly overrepresented in the two clusters of debt-financed
and mixed-financed SMEs with a focus on other loans. They can also be found comparatively more
often in the cluster of trade-financed SMEs. These clusters show a relatively strong use of credit
lines and bank or credit card overdrafts. This can also be seen as a sign for problematic access to
other financing instruments.
Internally-financed enterprises frequently state low access to finance problems, which indicates that
the non-use of external finance seems to be more often driven by a voluntary choice of SMEs rather
than by supply-side-related restrictions.

SMEs in which the largest stake is owned by a venture capital (VC) firm or a business angel (BAs)
are most common among the mixed-financed SMEs with a focus on retained earnings/sale of
assets, while those enterprises cannot be found in the cluster comprising state-subsidised SMEs.
We also find that state subsidies seem to be more often used by small and medium-sized
companies and less by micro firms. Micro firms are more likely to be in the internally-financed or
debt-financed cluster (with a high percentage of short-term debt), in line with findings by Moritz et
al. (2016). Further analyses could investigate if this result can be explained by specificities of these
subsidies that do not fit the needs of micro firms or if micro firms simply lack the awareness of
government support programmes. Related research within our project is underway and will be
published in due course.
Moreover, we observe that country-specific differences, as well as the macroeconomic- and
institutional-environment impact the financing patterns of SMEs often to an even higher degree
than firm-specific characteristics. SMEs in countries with a higher inflation rate tend to use less
trade financing and state subsidies, while SMEs in countries with very high inflation volatility tend to
be comparatively more often in the internally-financed or mixed-financed cluster (with focus on
other loans). This result might be due to lower predictability of a country’s future development
which in turn increases the business risk of firms.
SMEs in countries with high GDP per capita are comparatively more often in the mixed-financed
(with a focus on retained earnings or sale of assets), asset-based and debt-financed clusters.
Hence, SMEs in more developed and economically sound countries seem to be able to obtain
financing from a larger variety of financing sources (Bas et al. 2009). In line with this finding, firms
in countries with relatively high GDP growth rates appear to use a broader range of financing
instruments, whereas SMEs in countries with lower GDP growth rates are more likely to use state
subsidies. SMEs in countries with high unemployment rates are more likely to be in the internally-
financed and trade-financed cluster.
In countries with higher tax rates, SMEs are more likely to be in the debt-financed and in the state-
subsidised clusters, in which the use of bank loans is relatively high. This result could be driven by a
higher importance of the tax deductibility of interest rates.
Table of contents
Preface ........................................................................................................................ 3
Abstract ........................................................................................................................ 4
Non-technical Summary .................................................................................................. 5
Table of contents ........................................................................................................... 7
List of Tables ................................................................................................................. 8
1 Introduction ............................................................................................................. 9
2 Literature review ..................................................................................................... 11
3 Data, Method and Variables .................................................................................... 15
3.1 The SAFE Survey ................................................................................................. 15
3.2 Method ............................................................................................................. 15
3.3 Variables ........................................................................................................... 16
3.4 Descriptive Statistics ............................................................................................ 23
4 Empirical analysis ................................................................................................... 25
4.1 Identifying an empirical taxonomy of SMEs in 2015 ................................................ 25
4.2 Profiling and describing the taxonomy ................................................................... 26
4.2.1 Firm level characteristics of the clusters ........................................................... 28
4.2.2 Country level characteristics of the clusters ...................................................... 30
4.3 Comparison of two taxonomies of SME financing patterns ....................................... 33
5 Discussion ............................................................................................................. 35
5.1 Summary of main findings and contributions .......................................................... 35
5.2 Limitations and future research ............................................................................. 38
References .................................................................................................................. 39
ANNEX ...................................................................................................................... 46
Annex 1: Number of SMEs in the SAFE survey by country ................................................... 46
Annex 2: List of abbreviations ......................................................................................... 47
About … .................................................................................................................... 48
… the European Investment Fund ................................................................................... 48
… EIF’s Research & Market Analysis................................................................................ 48
… this Working Paper series .......................................................................................... 48
EIF Working Papers ...................................................................................................... 49

List of Tables
Table 1: Literature review ................................................................................................... 12
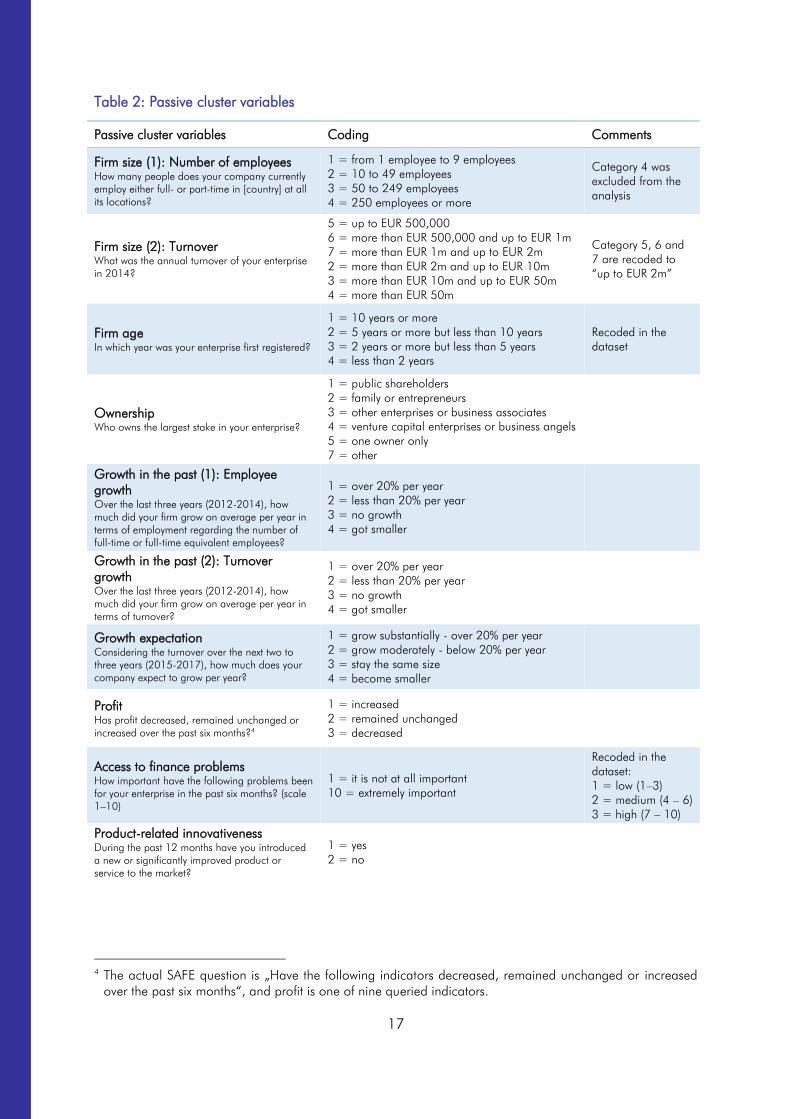
Table 2: Passive cluster variables ........................................................................................ 17
Table 3: Sample description (active cluster variables)............................................................. 24
Table 4: Cluster results ...................................................................................................... 25
Table 5: Cluster comparison: Firm-, and country-specific characteristics .................................. 27
Table 6: Cluster comparison: Country-specific characteristics ................................................. 30
Table 7: Cluster summary .................................................................................................. 36

9
1 Introduction
Small and medium-sized enterprises (SMEs) are a significant driver of the European economy, as
approximately 99.8% of all European non-financial enterprises are SMEs generating around EUR
3.9 trillion value added per year (European Commission 2016). Nevertheless, SMEs are often
confronted with financing constraints due to high information asymmetries, insufficient collateral,
agency risks and high transaction costs for capital providers (e.g., Artola and Genre 2011; Berger
and Udell 1998; Block, Colombo, Cumming, and Vismara 2017; Chong, Lu, and Ongena 2013;
Ferrando and Griesshaber 2011; Popov and Udell 2012; Sogorb-Mira 2005; Ryan, O’Toole, and
McCann 2014).
Although research in SME financing has increased over the last years, little is known about the
substitutive or complementary usage of several financing instruments (Beck, Demirgüç-Kunt, and
Maksimovic 2008; Casey and O’Toole 2014; Lawless, O’Connell, and O’Toole 2015; Moritz,
Block and Heinz 2016). Moritz et al. (2016) have taken a holistic approach to investigate SME
financing patterns in Europe by using cluster analysis. They identified six different SME financing
clusters in Europe: mixed-financed SMEs, state-subsidised SMEs, debt-financed SMEs, flexible-debt
financed SMEs, trade-financed SMEs, and internally-financed SMEs. The authors found that SMEs
in the clusters differ regarding to firm-, product-, industry-, and country-specific characteristics such
as age, firm size, or ownership structure, which is in line with previous research (e.g., Berger and
Udell 1998; Chavis, Klapper and Love 2011; Ferrando and Griesshaber 2011). Our study is
based on Moritz et al. (2016) but complements it in two respects: first, it remains unclear whether
the identified financing patterns are stable over time. By using SME financing data collected in
2015 we investigate how the financing patterns differ from those identified by using data from
2013. Second, Moritz et al. (2016) found that country differences seem to have the strongest
impact on cluster differences.
However, the authors did not further investigate the reasons for these differences. In our study we
explore this by including macroeconomic variables (e.g., Beck et al. 2008; Camara 2012;
Demirgüç-Kunt and Maksimovic 1999; Hernández-Cánovas and Koëter-Kant 2011).
In analogy to Moritz et al. (2016) we use the “Survey on the access to finance of enterprises (SAFE
survey)”, which is conducted on behalf of the European Central Bank (ECB) and the European
Commission (EC). The SAFE survey contains information on about 17,950 firms in 39 countries
(wave 2015H1). Since the majority of firms in the SAFE survey are SMEs (approximately 90%), the
survey is ideally suited for our research question. Moreover, the SAFE survey contains information
about a large number of different financing instruments (e.g., retained earnings or sale of assets,
grants and subsidised bank loans, credit line, bank overdraft or credit card overdrafts, bank loan,
trade credit, loans from family and friends, factoring, leasing or hire-purchase, debt securities
issued, equity capital), as well as firm-, product-, industry- and country-specific information. We
use the different financing instruments as active variables in our cluster analysis to identify financing
patterns of SMEs in Europe. To profile the different financing patterns, we use the firm-, product-,
industry-, and country-specific characteristics provided in the SAFE survey. To complement these
profiles, we added a number of relevant macroeconomic variables to our dataset such as GDP per
10
capita, inflation rate and volatility, unemployment rate, or property i
rights. Finally, we compare our
results with the results by Moritz et al. (2016) in order to investigate the stability of SME financing
patterns over time.
Our findings contribute to the literature on SME financing in different ways (e.g., Beck et al. 2008;
Casey and O’Toole 2014; Lawless et al. 2015; Moritz et al. 2016). To date, little is known about
the complementary and substitutive use of different financing instruments (Beck et al. 2008; Casey
and O’Toole 2014). Our findings suggest that the identified financing patterns by Moritz et al.
(2016) are relatively stable over time and various financing instruments are used as complements
and substitutes by European SMEs. Moreover, our study extends the research of Moritz et al.
(2016) by adding macroeconomic variables to the dataset. We contribute to the literature by
investigating the influence of country characteristics on small firms’ financing (e.g., Beck et al.
2008; Camara 2012; Demirgüç-Kunt and Maksimovic 1999; Hernández-Cánovas and Koëter-
Kant 2011; Mokhova and Zinecker 2014).
The remainder of the paper proceeds as follows: Section 2 provides a literature review focused on
macroeconomic variables influencing SME financing. Section 3 explains the dataset (SAFE survey),
the method applied and the description of the variables used in the empirical analysis. In Section 4
we provide the results of the cluster analysis, the determinants of the financing patterns and the
comparison of our findings with those of Moritz et al. (2016). Section 5 summarises the results,
discusses limitations and suggests further research areas.

11
2 Literature review
Previous research identified a significant effect of industry-, firm-, or product-specific factors such
as firm size, firm age, growth, ownership structure, and industry sector on SMEs’ access to and
usage of different financing sources (Chittenden, Hall, and Hutchinson 1996; Ferrando and
Griesshaber 2011; Hall, Hutchinson, Michaelas 2004; Mac an Bhaird and Lucey 2010). However,
many previous studies focused on a single financing instrument and did not investigate the
complementary and substitutive use of different debt and equity instruments (exceptions are, for
example, Beck et al. 2008; Casey and O’Toole 2014; Lawless et al. 2015; Moritz et al. 2016).
Moritz (2015) provides a comprehensive and detailed literature review on SME financing and its
influencing factors.
As we do not want to be repetitive, we focus our literature review on previous research that
analyzed the effects of macroeconomic variables on the financing of firms (e.g., Booth et al. 2001;
Bopkin 2009; Cull et al. 2006; La Porta, Lopez-De-Silanes, Shleifer, and Vishny 1997). The Gross
Domestic Product (GDP) is an indicator for a countries’ economic development and its influence
on the capital structure of firms has been widely investigated (e.g., Bopkin 2009; Mokhova and
Zinecker 2013). Prior research found that there is a negative relation between both GDP and GDP
growth and the firm’s capital structure (Bopkin 2009; Gajurel 2006). Also, the unemployment rate
is used as an indicator for the economic development. However, prior findings on the influence of
a countries’ unemployment rate on the capital structure of firms have been mixed, such as the
finding of a non-significant effect or a significant positive effect on the leverage level of firms
(Camara 2012; Mokhova and Zinecker 2013). Moreover, empirical studies investigated the effect
of the inflation rate on the financing of firms but also with mixed findings. Whereas Camara
(2012), Hanousek and Shamshur (2011), Sett and Sarkhel (2010) found a positive effect on the
firm’s leverage, Gajurel (2006) reported a negative influence of the inflation rate on total leverage.
Beside these factors, prior research investigated the effect of macroeconomic indexes, such as
legal system index or the property right index (e.g., Duan, Chic, and Liu 2012). It has been found
that companies in countries with better protection of property rights use to a larger extent external
financing, especially bank and equity finance, as better protection of property rights increases the
security for capital providers (Beck et al. 2008; Psillaki and Daskalakis 2009).
However, most prior studies are either focused on larger firms and/or did not investigate the
complementary and substitutive use of different financing instruments (e.g., Beck and Demirgüç-
Kunt 2006; Bopkin 2009; Chavis et al. 2011). We tap into this research gap by developing an
empirical taxonomy of SME financing patterns and characterise the patterns according to the
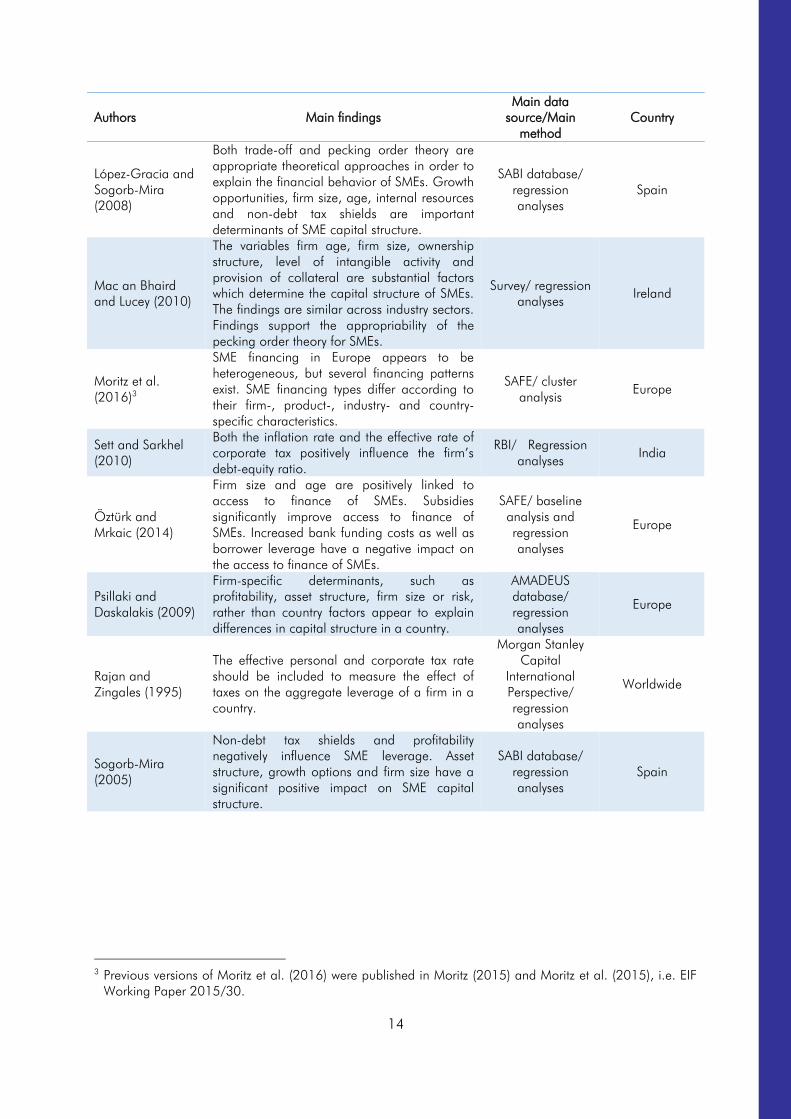
macroeconomic variables. Table 1provides an overview of relevant empirical studies regarding the
effects of macroeconomic variables on SMEs’ capital structure.

12
Table 1: Literature review
Authors Main findings
Main data
source/Main
method
Country
Agarwal and
Mohtadi (2004)
Stock market development is negatively linked
to the debt levels of firms relative to their equity
level, whereas the banking sector development
is positively linked to debt level of firms relative
to their equity level.
WorldScope, IFC,
World
Development
Indicators/
regression
analyses
Worldwide
Ayyagari et al.
(2007)
The business environment, for instance better
credit information, is positively linked to a
larger size of the SME sector in a country.
World Bank Doing
Business
Database/
regression
analyses
Worldwide
Beck and
Demirgüç-Kunt
(2006)
The improvement of financial and legal
institutions can alleviate the access to finance
constraints for SMEs.
Literature review Worldwide
Bas et al. (2009)
The financing decisions of large and listed
firms are influenced less by economic
conditions than are small and private firms.
World Bank
Enterprise Survey
(WBES)
Developing
countries
Beck et al. (2008)
Protection of property rights has a positive
effect on external financing of small firms. Firm
size determines the capital structure. Both
financial and institutional development has an
impact on financing of small and large firms.
WBES/ regression
analyses Worldwide
Berger and Udell
(1998)
Government policies and national structures
affect credit availability through lending
technologies. Beside company-characteristics,
the macroeconomic environment determines
the financing of SMEs.
Literature review Worldwide
Booth et al.
(2001)
The capital structure choices are influenced by
similar variables for both developed and
developing countries. Country-specific fixed
effects explain approximately 43% of firm
leverage variation in developing countries.
International
Finance
Corporation (IFC)/
regression
analyses
Worldwide
Bopkin (2009)
Inflation has a significantly positive effect on
the choice of short-term debt over equity,
whereas GDP per capita negatively affects the
capital structure choices.
Accounting
data/regression
analyses
Worldwide
Chavis et al.
(2011)
Younger firms rely more on informal financing
and less on bank financing. More mature firms
substitute informal financing with bank
financing (substitution effect hold for different
industries and countries). These effects hold for
firms in countries with different GDP per capita
rates.
WBES/ regression
analyses Worldwide

13
Authors Main findings
Main data
source/Main
method
Country
Daskalakis and
Psillaki (2008)
Firm size has a positive relationship with
leverage. Profitability and asset structure (ratio
of tangible assets divided by the total assets of
the firm) have a significant negative impact on
leverage. Firm-specific rather than country-
specific factors explain capital structure (at
least for SMEs in France and Greece).
AMADEUS
database/
regression
analyses
France and
Greece
Frank and Goyal
(2009)
Median industry leverage, tangibility, log of
assets and expected inflation positively
influence market leverage, whereas market-to-
book assets ratio and profits negatively affect
market leverage.
Compustat,
Center for
Research in
Security Prices,
public databases/
regression
analyses
United States
Giannetti (2003)
The leverage of individual unlisted firms
significantly influences institutional variables
(e.g., stock market development, legal
enforcement, or creditor protection).
AMADEUS
database/
regression
analyses
Europe
Hanousek and
Shamshur (2011)
Both the GDP growth and the corruption
perception index are positively related to the
firm’s leverage ratio.
AMADEUS
database/
regression
analyses
Europe
Hall et al. (2004)
Firm-specific determinants (firm size, firm age,
profit, growth, asset structure) have partly a
significant influence on the capital structure of
SMEs but there exists variations between
countries.
Dun & Bradstreet/
regression
analyses
Europe
Hernández-
Cánovas and
Koëter-Kant
(2011)
SMEs in countries with high protection rights
are more likely to obtain long-term bank loans.
The institutional environment effect is more
pronounced for micro firms.
ENSR Survey/
regression
analyses
Europe
Jõeveer (2013)
The explanatory power of country-specific
factors is higher for small firms than it is for
larger firms. The leverage of a firm varies
according to the firm size.
AMADEUS
database/
ANOVA and
regression
analyses
Western Europe
La Porta et al.
(1997)
Countries with poorer investor protections have
smaller capital markets. Common law
countries have better investor protections and
developed capital markets than have French
civil law countries.
WorldScope
Database/
regression
analyses
Worldwide
Levine (2002) The legal system has an influence on the
financial sector development.
Country
publications and
national
regulatory
authorities/
regression
analyses
Worldwide
14
Authors Main findings
Main data
source/Main
method
Country
López-Gracia and
Sogorb-Mira
(2008)
Both trade-off and pecking order theory are
appropriate theoretical approaches in order to
explain the financial behavior of SMEs. Growth
opportunities, firm size, age, internal resources
and non-debt tax shields are important
determinants of SME capital structure.
SABI database/
regression
analyses
Spain
Mac an Bhaird
and Lucey (2010)
The variables firm age, firm size, ownership
structure, level of intangible activity and
provision of collateral are substantial factors
which determine the capital structure of SMEs.
The findings are similar across industry sectors.
Findings support the appropriability of the
pecking order theory for SMEs.
Survey/ regression
analyses Ireland
Moritz et al.
(2016)3
SME financing in Europe appears to be
heterogeneous, but several financing patterns
exist. SME financing types differ according to
their firm-, product-, industry- and country-
specific characteristics.
SAFE/ cluster
analysis Europe
Sett and Sarkhel
(2010)
Both the inflation rate and the effective rate of
corporate tax positively influence the firm’s
debt-equity ratio.
RBI/ Regression
analyses India
Öztürk and
Mrkaic (2014)
Firm size and age are positively linked to
access to finance of SMEs. Subsidies
significantly improve access to finance of
SMEs. Increased bank funding costs as well as
borrower leverage have a negative impact on
the access to finance of SMEs.
SAFE/ baseline
analysis and
regression
analyses
Europe
Psillaki and
Daskalakis (2009)
Firm-specific determinants, such as
profitability, asset structure, firm size or risk,
rather than country factors appear to explain
differences in capital structure in a country.
AMADEUS
database/
regression
analyses
Europe
Rajan and
Zingales (1995)
The effective personal and corporate tax rate
should be included to measure the effect of
taxes on the aggregate leverage of a firm in a
country.
Morgan Stanley
Capital
International
Perspective/
regression
analyses
Worldwide
Sogorb-Mira
(2005)
Non-debt tax shields and profitability
negatively influence SME leverage. Asset
structure, growth options and firm size have a
significant positive impact on SME capital
structure.
SABI database/
regression
analyses
Spain
3
Previous versions of Moritz et al. (2016) were published in Moritz (2015) and Moritz et al. (2015), i.e. EIF
Working Paper 2015/30.

15
3 Data, Method and Variables
3.1 The SAFE Survey
The main data set used for our analysis is obtained from the ‘Survey on the access to finance of
enterprises (SAFE survey)’, which is conducted on behalf of the European Central Bank (ECB) and
the European Commission (EC). The SAFE survey is run on a bi-annual basis by the ECB, while it is
carried out once a year (since 2013) as a cooperation between EC and ECB (European Central
Bank 2016; European Commission 2015). The difference between the bi-annual and annual
questionnaire are the number of questions asked and the participating countries. The firms in the
sample are selected randomly from the Dun & Bradstreet database by a specialist research institute
to underline that it is anonymous and professional.
The SAFE survey contains various firm-specific information such as firm size (turnover, number of
employees), firm age, ownership structure, main activity (industry, trade, construction, service),
growth, innovation activity and financing information (e.g., current financing sources, evaluation of
the access to finance). According to the size categories, the SAFE differentiates between micro (1-9
employees), small (10-49 employees), medium-sized (50-249 employees), and large enterprises
(> 250 employees). The sample of the SAFE survey is artificially distorted due to the sampling
process. Therefore, we used post-stratification weights (calculated on the basis of Eurostat data) in
order to restore the non-distorted proportions based on the approach applied by Moritz et al.
(2016). For our analysis, we used the joint EC/ECB wave number 13 that was conducted between
April and September 2015. In total, the sample includes 17,950 firms in 39 European countries.
The reduced sample for our analysis is described in more detail in Section 3.4.
3.2 Method
In order to identify an empirical taxonomy of SME financing patterns, we conduct a hierarchical
cluster analysis. Cluster analysis is an appropriate method to identify groups of firms that use
similar financing instruments. The goal is to identify clusters which are relatively homogeneous
within the clusters but are distinctively different from each other (e.g., Hair, Black, Babin, and
Anderson 2010; Özari, Köse, and Ulusoy 2013).
Different hierarchical cluster analysis algorithms were tested (single linkage, average linkage,
complete linkage and Ward’s method) in order to identify an empirical taxonomy of SMEs in
Europe. We decided to use the Ward’s method because this algorithm generated relatively
homogeneous clusters with balanced cluster sizes, whereas the other methods provided
unbalanced cluster sizes or clusters with a high intra-cluster heterogeneity (Backhaus, Erichson,
Plinke, and Weiber 2013). Furthermore, this approach allows us to directly compare our results
with the analysis done by Moritz et al. (2016) without causing differences due to different methods
applied. Consistent with the Ward’s algorithm, we used the squared Euclidean distance as a
measure of proximity. Based on the validation tests (Test of Mojena and Elbow Criterion) as well as
face validity and theoretical foundation (Backhaus et al. 2013; Mojena 1977), we identified seven
distinct SME financing clusters.

16
3.3 Variables
Active cluster variables
In the SAFE survey, the participating SMEs are asked about the financing of their company, and in
particular, the financing instruments used. The question consists of two parts: First, it was asked
whether the enterprise used the specific financing instrument in the past or considered using it in
the future (i.e., whether the financing instrument was relevant to the firm). Second, it was asked
whether the company used the financing instrument during the past six months. The following
financing instruments were queried: (a) retained earnings or sale of assets, (b) grants or subsidised
bank loans, (c) credit line, bank overdraft or credit card overdrafts, (d) bank loans (both short and
long-term), (e) trade credit, (f) other loans (for example from family and friends, a related enterprise
or shareholders), (g) leasing or hire purchase, (h) factoring (i) debt-securities issued, (j) equity
(quoted shares, unquoted shares or other forms of equity provided by the owners or external
investors such as venture capital companies or business angels), (k) other sources of financing
(subordinated debt instruments, participating loans, peer-to-peer lending, crowdfunding).
As we are also interested in firms which did not use any of these financing instruments, we added
an additional variable that indicated whether a company did not use any external financing in the
past six months. To be able to compare the cluster results with the analysis done by Moritz et al.
(2016), we combined the financing instruments ‘factoring’ and ‘leasing or hire-purchase’ as these
financing instruments were combined in one category in 2013. The different financing instruments
are used as active cluster variables in order to identify financing patterns of European SMEs and to
create a comprehensive taxonomy of European SME financing.
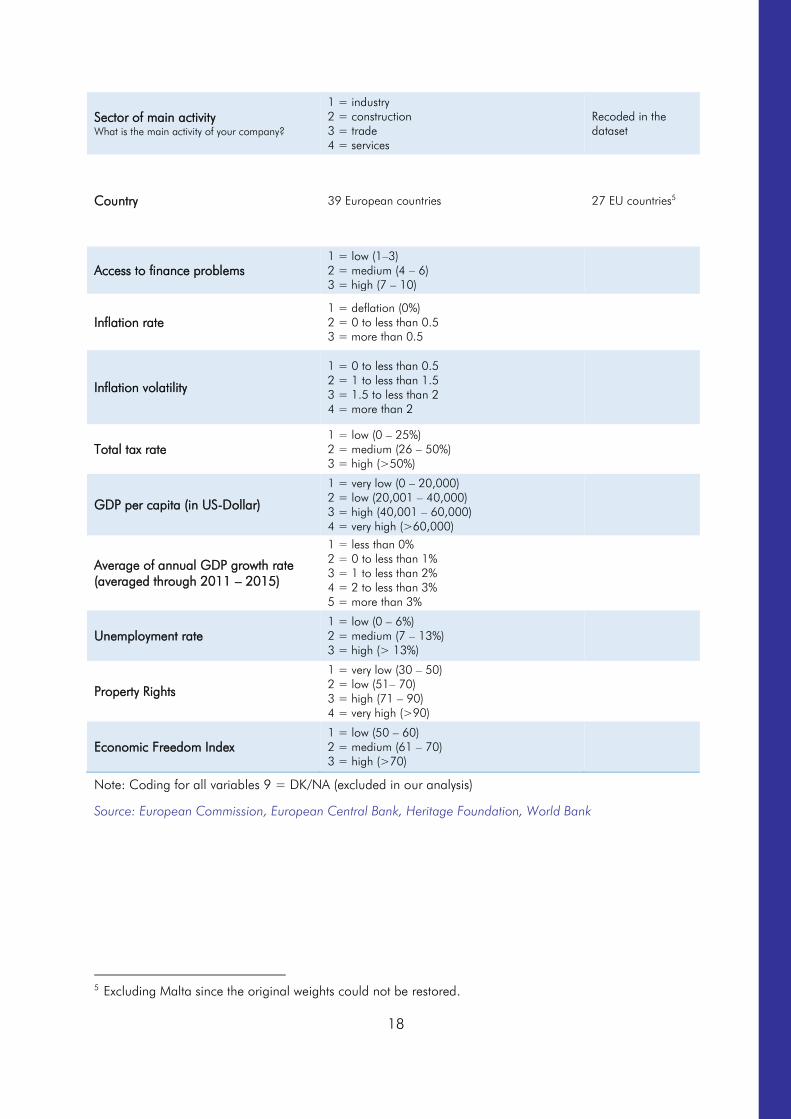
Passive cluster variables
To characterise the different financing patterns, several firm-, product-, industry-, and country-
specific determinants are included as passive cluster variables. The majority of the variables is
retrieved from the SAFE survey (see Table 2). To analyse the country specific differences, we add
macroeconomic variables provided by the OECD, the European Commission, the Heritage
Foundation and the World Bank.
17
Table 2: Passive cluster variables
Passive cluster variables Coding Comments
Firm size (1): Number of employees
How many people does your company currently
employ either full- or part-time in [country] at all
its locations?
1 = from 1 employee to 9 employees
2 = 10 to 49 employees
3 = 50 to 249 employees
4 = 250 employees or more
Category 4 was
excluded from the
analysis
Firm size (2): Turnover
What was the annual turnover of your enterprise
in 2014?
5 = up to EUR 500,000
6 = more than EUR 500,000 and up to EUR 1m
7 = more than EUR 1m and up to EUR 2m
2 = more than EUR 2m and up to EUR 10m
3 = more than EUR 10m and up to EUR 50m
4 = more than EUR 50m
Category 5, 6 and
7 are recoded to
“up to EUR 2m”
Firm age
In which year was your enterprise first registered?
1 = 10 years or more
2 = 5 years or more but less than 10 years
3 = 2 years or more but less than 5 years
4 = less than 2 years
Recoded in the
dataset
Ownership
Who owns the largest stake in your enterprise?
1 = public shareholders
2 = family or entrepreneurs
3 = other enterprises or business associates
4 = venture capital enterprises or business angels
5 = one owner only
7 = other
Growth in the past (1): Employee
growth
Over the last three years (2012-2014), how
much did your firm grow on average per year in
terms of employment regarding the number of
full-time or full-time equivalent employees?
1 = over 20% per year
2 = less than 20% per year
3 = no growth
4 = got smaller
Growth in the past (2): Turnover
growth
Over the last three years (2012-2014), how
much did your firm grow on average per year in
terms of turnover?
1 = over 20% per year
2 = less than 20% per year
3 = no growth
4 = got smaller
Growth expectation
Considering the turnover over the next two to
three years (2015-2017), how much does your
company expect to grow per year?
1 = grow substantially - over 20% per year
2 = grow moderately - below 20% per year
3 = stay the same size
4 = become smaller
Profit
Has profit decreased, remained unchanged or
increased over the past six months?4
1 = increased
2 = remained unchanged
3 = decreased
Access to finance problems
How important have the following problems been
for your enterprise in the past six months? (scale
1–10)
1 = it is not at all important
10 = extremely important
Recoded in the
dataset:
1 = low (1–3)
2 = medium (4 – 6)
3 = high (7 – 10)
Product-related innovativeness
During the past 12 months have you introduced
a new or significantly improved product or
service to the market?
1 = yes
2 = no
4
The actual SAFE question is „Have the following indicators decreased, remained unchanged or increased
over the past six months“, and profit is one of nine queried indicators.
18
Sector of main activity
What is the main activity of your company?
1 = industry
2 = construction
3 = trade
4 = services
Recoded in the
dataset
Country 39 European countries 27 EU countries5
Access to finance problems
1 = low (1–3)
2 = medium (4 – 6)
3 = high (7 – 10)
Inflation rate
1 = deflation (0%)
2 = 0 to less than 0.5
3 = more than 0.5
Inflation volatility
1 = 0 to less than 0.5
2 = 1 to less than 1.5
3 = 1.5 to less than 2
4 = more than 2
Total tax rate
1 = low (0 – 25%)
2 = medium (26 – 50%)
3 = high (>50%)
GDP per capita (in US-Dollar)
1 = very low (0 – 20,000)
2 = low (20,001 – 40,000)
3 = high (40,001 – 60,000)
4 = very high (>60,000)
Average of annual GDP growth rate
(averaged through 2011 – 2015)
1 = less than 0%
2 = 0 to less than 1%
3 = 1 to less than 2%
4 = 2 to less than 3%
5 = more than 3%
Unemployment rate
1 = low (0 – 6%)
2 = medium (7 – 13%)
3 = high (> 13%)
Property Rights
1 = very low (30 – 50)
2 = low (51– 70)
3 = high (71 – 90)
4 = very high (>90)
Economic Freedom Index
1 = low (50 – 60)
2 = medium (61 – 70)
3 = high (>70)
Note: Coding for all variables 9 = DK/NA (excluded in our analysis)
Source: European Commission, European Central Bank, Heritage Foundation, World Bank
5
Excluding Malta since the original weights could not be restored.
19
Firm level variables
Firm size: The SAFE survey contains two different measures with regard to the size of the firm. We
include both variables - the number of employees and the annual turnover - in our analysis
(categorical variables). Empirical research indicates that the size of a firm has a significant impact
on its capital structure (e.g., Berger and Udell 1998; Cassar 2004; Hall et al. 2004). Due to the
specific characteristics of SMEs, such as informational opacity, liability of smallness and liability of
newness (Stinchcombe, 1965; Zimmerman and Zeitz, 2002), the capital structure of SMEs differs
from that of larger enterprises (Berger and Udell 1998; Moritz et al. 2016; Psillaki and Daskalakis
2009; Watson and Wilson 2002). Previous research found that the size effect is particularly strong
for accessing bank financing (e.g., Canton, Grilo, Monteagudo, and Van der Zwan 2013; Jõeveer
2012; Öztürk and Mrkaic 2014). In addition, recent studies have found validity of the pecking
order theory6
for SMEs (López-Gracia and Sogorb-Mira 2008; Mac an Bhaird and Lucey 2010;
Watson and Wilson 2002) with the result that smaller enterprises prefer internal financing or short-
term external debt over long-term debt and equity (Mac an Bhaird and Lucey 2010).
Firm age: The survey contains information about firm age (categorical variable). Previous research
has shown a significant effect of firm age on the capital structure of SMEs (e.g., Chavis et al.
2011; Chittenden et al. 1996). Younger firms rely more on informal financing, whereas older firms
appear to use more formal financing such as bank loans (Chavis et al. 2011). More mature firms
are more likely to receive formal financing, as they already have track records, a credit history and
established relationships, which decreases information asymmetries for capital providers (Berger
and Udell 1998; Chavis et al. 2011). Formal capital providers such as banks are more inclined to
provide short-term debt for young firms as it is more flexible and the contract is easier to terminate
in case the firm does not develop as expected (Huyghebaert and Van de Gucht 2007).
Growth: The SAFE survey gathers information about future growth expectations and past growth
rates. Whereas the former is measured in terms of turnover growth rates, the latter considers
turnover growth as well as number of full-time or full-time equivalent employees. Former studies
suggest that the growth of small firms is constrained by the availability of financing. When internal
financing sources are depleted external financing is required for further growth (Becchetti and
Trovato 2002; Carpenter and Petersen 2002). In particular, SMEs with high growth ambitions
require external financing sources in order to finance their future objectives (Cassar 2004; Rogers
2014).
Ownership: This variable captures the main owner of the firm. Since previous studies have shown
that ownership structure affects business financing (e.g., Chittenden et al. 1996; Ferrando and
Griesshaber 2011; Moritz et al. 2016), we included all different ownership types included in the
SAFE survey in our analysis. Previous research has found that family firms, single-owner firms and
6
The pecking-order theory assumes that firms prefer internal financing over external financing due to higher
information costs associated with external financing (Myers 1984; Myers and Majluf 1984). However, if
external financing is required, firms prefer debt to equity since equity has not only the highest information
costs but also leads to a dilution of control (López-Gracia and Sogorb-Mira 2008; Mac an Bhaird and
Lucey 2010; Myers 1984).
20
owner-teams appear to avoid external sources of financing due to a possible loss of control rights
(Bathala, Bowlin, and Dukes 2004; Chittenden et al. 1996).
Profit: According to former research, profitability is negatively related to gearing. In other words,
SMEs with a higher profitability seem to prefer internal (e.g., retained earnings) to external
financing instruments (e.g., Michaelas, Chittenden, and Poutziouris 1999; Hall, Hutchinson, and
Michaelas 2000). In particular, firms with higher profits appear to use less debt (Frank and Goyal
2009). In the past, the SAFE survey contained information about the development of the profit
margin as a measure of profitability. However, since 2015 the survey does not cover information
about the profit margin. Therefore, we include the change in profit of the firm as a proxy for
profitability in our analysis.
Access to finance: The SAFE survey contains a variable concerning the most pressing problem of
the firm in the past six months. Companies were asked to indicate how important a specific
problem (amongst others access to finance) was on a scale from 1 (not at all important) to 10
(extremely important). As SMEs typically are more opaque than larger firms, they are likely to have
more difficulties to access external finance (e.g., Beck and Demirgüç-Kunt 2006). To understand
how SMEs perceive their access to finance, we included this variable in our analysis and recoded
the scale into three categories: low (1-3), medium (4-6) and high importance (7-10) that are also
used in the ECB analyses (European Central Bank 2016).
Product characteristics - Innovativeness: The SAFE also covers questions about the innovativeness
of firms. Participants were asked if they introduced a new or significantly improved product or
service to the market during the past 12 months. Developing new products and services is often
cost intensive and the success is highly uncertain (Block, 2012; Coad and Rao, 2008). Especially
for SMEs innovations are often very risky as they are too small to diversify their portfolio, which
increases the risk of bankruptcy for these firms (Achleitner, Braun, and Kohn 2011; Huyghebaert
and Van de Gucht 2007; Rajan and Zingales 1995). As a consequence it has been found that
innovative SMEs face problems in particular to obtain external debt (Hall 2010; Hall and Lerner
2010; Mina, Lahr and Hughes 2013; Singh, Tucker and House 1986).
Hence, equity investors such as venture capital firms, which are specialized on investing in
innovative small and start-up firms with a high return potential, are an alternative financing source
for these high-risk firms. In general, venture capital firms have a variety of selection criteria and
extensive experience to evaluate innovative start-up companies (Franke, Gruber, Harhoff and
Henkel 2008; Zhou, Sandner, Martinelli, and Block 2016). By using their networks and
experience, venture capital firms are able to decrease information asymmetries and opportunity
costs (Florida and Kenney 1988; Hall 2010). In addition, they closely monitor the firms after their
investment and provide value-adding services. In contrast to debt providers, equity investors
participate in the success of the firm and are incentivised by higher return potentials through an
exit, such as an IPO or buyout (Gompers and Lerner 2004; Hall 2010).
Industry characteristics: According to the firm’s main activities, the SAFE dataset distinguishes
between different sectors. The one-digit European NACE classification was the basis for the
statistical stratification. In order to ensure representativeness and anonymity, the different sectors

21
were grouped together into four categories: industry, construction, trade and other services
(European Central Bank 2016). Previous research found that financing requirements differ between
industries due to different asset structures and risks (Bradley, Jarrell and Kim 1984; Coleman and
Robb 2012; Degryse, de Goeji, and Kappert 2012; Hall et al. 2000). While SMEs in the industry
sector typically require more long-term capital to finance their assets with a long term character,
SMEs in the trade sector appear to require more short-term debt (Chavis et al. 2011; Hall et al.
2000; Michaelas et al. 1999; Moritz et al. 2016). Service firms, however, have been found to use
more internal financing sources than external financing, since capital requirements are relatively
low (Harrison, Mason and Girlin 2004).
Country level and macroeconomic variables
Countries: The SAFE Survey (2015H1) covers in total 39 countries including mainly European but
also non-European countries such as the United States, China, Japan or the Russian Federation.
Our sample covers all countries, where the weights could be restored with the Eurostat data, i.e.
27 European countries.7
A number of previous research has highlighted the importance of country
differences for firm financing (e.g., Booth et al. 2001; Canton et al. 2013; Chavis et al. 2011;
Daskalakis and Psillaki 2008; Demirgüç-Kunt and Levine 1999; La Porta et al. 1997). In
particular, the countries’ legal and financial system affects the capital structure of firms (Beck et al.
2008; Demirgüç-Kunt and Maksimovic 1999 ; Fan, Titman and Twite 2012; Levine, 2002). This
effect is even stronger for SMEs as they are more restricted in their cross-border financing activity
than larger companies (Guiso et al., 2004; Jõeveer, 2012). It has been found that firms in
countries with more developed financial and legal systems use more external financing (Beck et al.
2008; Demirgüç-Kunt and Maksimovic 1999). In order to analyse country differences, the 27
European countries are classified based on geography (Northern, Southern, Western and Eastern
Europe), their financial market system (bank-based, market-based and former socialist countries)
and the impact of the financial crisis (distressed and non-distressed countries) (Beck et al. 2008;
Casey and O’Toole 2014; Demirgüç-Kunt and Maksimovic 1999; Ferrando, Popov and Udell
2015; Moritz et al. 2016). Furthermore, several country-specific and macroeconomic variables,
which we took from sources other than the SAFE survey, are included in the analysis:
Inflation rate and volatility: The inflation rate and the inflation rate volatility of the different
countries were obtained from the World Bank. We grouped the inflation rates of 2015 into three
categories: deflation (rate below 0%), very low (0.0%-0.5%) and low (0.5%-1%)8
. Different previous
studies have analysed the connection between a countries’ inflation rate and the financing of firms
(Beck et al. 2008; Demirgüç-Kunt and Maksimovic 1999; Frank and Goyal 2009; Hernández-
Cánovas and Koëter-Kant 2011; Jõeveer 2013; Öztekin, 2015). The results of the different
studies, however, vary considerably. Whereas Demirgüç-Kunt and Maksimovic (1999), Hernández-
Cánovas and Koëter-Kant (2011), Bopkin (2009) and Beck et al. (2008) reported a negative effect
of high levels of inflation on the use of long-term debt, other studies did not find any significant
7
All 27 countries in the sample are members of the European Union (EU). Malta was excluded, since the
original weights could not be restored. Moreover, the non-EU member Norway, which was part of the
previous analysis by Moritz et al. (2016), was not included in our data set due to missing data.
8
The inflation rates are all below 1% in 2015.
22
relation between inflation rate and the firms’ capital structure or reported the inflation rate as a
non-reliable factor to predict leverage (Fan et al. 2012; Frank and Goyal 2009).
Furthermore, high inflation rates and high inflation volatility in the past indicate a high uncertainty
about future inflation rates (Ball 1992; Fan et al. 2012; Frank and Goyal 2009). This uncertainty
is associated with higher business risks as higher inflation rates increase the volatility of the firms’
operating income. As a consequence, it has been found that inflation uncertainty negatively
influences the number of firms’ investments by issuing debt (Fan et al. 2012; Hatzinikolaou,
Katsimbris and Noulas 2002).
Tax rate: We include the total tax rate and the corporate tax rate of a country as additional
variables. We grouped these into three categories: low (0-25%), medium (26-50%) and high
(>50%). Several studies analyzed the effect of taxes on corporate decision making and in
particular, on financial decision making (e.g., Fan et al. 2012; Graham 2003). According to
trade-off theory9
, firms in countries with higher tax rates appear to use more debt (Graham 2003;
Modigliani and Miller 1958; Miller 1977; Myers 1984; Wu and Yue 2009). Debt has a tax
advantage over equity, since interest expenses are deductible (Graham 2000).
Gross Domestic Product (GDP) per capita: The World Bank provides data about countries’ GDP.
We categorized the GDP per capita levels (in US dollars): very low (0-20,000), low (20,001-
40,000), high (40,001-60,000) and very high (>60,000). The GDP per capita is an indicator for
the economic development of a country. Various studies have found a relationship between GDP
and the capital structure of firms (Bopkin 2009; Camara 2012): firms in countries with a high GDP
per capita have been found to rely more on internal (e.g., retained earnings) rather than external
financing (Bopkin 2009).
In addition, previous research has investigated the effect of GDP growth rate and GDP change rate
on the capital structure of firms (De Jong, Kabir and Nguyen 2008; Hernández-Cánovas and
Koëter-Kant 2011; Holton, Lawless and McCann 2014). De Jong et al. (2008) investigated how
firm- and country-specific factors affect the leverage choice of firms in 42 countries worldwide.
They revealed that GDP growth rate has a positive effect on the firm’s debt level (De Jong et al.
2008).
Unemployment rate: We include the countries’ unemployment rate as another macroeconomic
variable in the cluster analysis. We grouped the unemployment rates into three categories: low (0-
6%), medium (7-13%) and high (>13%). Similar to the variable GDP per capita, the
unemployment rate is an indicator for the economic development and stability of a country.
Previous research has found a significant relationship between the unemployment rate and a firm’s
capital structure, but with mixed findings (non-significant effect or a significant positive effect on the
leverage level of firms) (Camara 2012; Mokhova and Zinecker 2014).
9
The trade-off theory states that firms have to choose between tax advantages by using debt and the risk of
bankruptcy due to high leverage (Bradley, 1984; Klapper, Sarria-Allende, and Sulla 2002; Myers 1977).
Hence, this theory suggests that firms aim to reach an optimal debt level (Myers 1984).
23
Property rights (Index): In order to provide information on the impact of the institutional
environment on firms’ financing decisions, we include an indicator of property rights protection
compiled by the Heritage Foundation. Since all European countries have at least a property rights
index of 30, we grouped the values into four categories based on the classification of the Heritage
Foundation: very low (property rights values between 30 and 50), low (51-70), high (71-90) and
very high (>90). According to the Heritage Foundation, a property rights index of less than 30
means that the property rights are weakly protected, the court system is highly inefficient, corruption
is extensive and expropriation is possible. On the contrary, a value of more than 90 implies that
the government guarantees the protection of private property, the court system enforces contracts
efficiently and there is neither corruption nor expropriation. Previous studies have indicated the
importance of the protection of private property for the financial development of a country (Beck,
Demigrüç-Kunt and Levine 2003; Beck et al. 2008). Furthermore, it has been found that
companies in countries with better protection of property rights use to a larger extent external
finance. In particular, bank and equity finance is used more often in these countries, as better
protection of property rights is necessary for financial contracts and the security of investments
(Beck et al. 2008; Psillaki and Daskalakis 2009).
Economic Freedom (Index): The Heritage Foundation also publishes annually an economic
freedom index that covers ten quantitative and qualitative factors, grouped into four broad
categories of economic freedom: rule of law (property rights, freedom from corruption), limited
government (fiscal freedom, government spending), regulation efficiency (labor/business/monetary
freedom) and openness of markets (financial/trade/investment freedom). Protection of property
rights is one of ten factors included in the Economic Freedom index. However, additional country-
specific characteristics with regard to the institutional environment are covered by this index. Each
of the ten factors of economic freedom is measured on a scale of 0 to 100. The overall Economic
Freedom Index is the average of the different category factors. Again, we grouped the values into
categories based on the classification of the Heritage Foundation: low (index between 0 and 60),
medium (61-70) and high (>70). Previous research has shown that the legal and financial
environment has an impact on the firms’ capital structure (La Porta et al. 1997; Fan et al. 2012).
For instance, firms in countries with a higher corruption appear to be more levered as the
expropriation of external equity holders is easier than it is for debt holders (Fan et al. 2012).
3.4 Descriptive Statistics
For our research goal to identify financing patterns of SMEs in Europe, we include all firms from
the SAFE survey with less than 250 employees according to the definition of the European
Commission (European Commission, 2005). Hence, our study includes 13,098 firms (see Tables 3
and 5). We reweighted the sample using data on firm size, economic activities and countries by
Eurostat in order to make valid statements for the overall population of SMEs in Europe. The final
reweighted sample mainly consists of micro firms with less than 10 employees (93%). Moreover,
6% of the firms employ 10-49 people, whereas only 1% of the firms have 50-249 employees.
Furthermore, approximately 90% of the companies have an annual turnover of less than EUR 2m.
Regarding to firm age, most of the firms (71.8%) are mature companies (≥ 10 years old). The
majority of SMEs is from Italy (16.8%), France (13.3%), Spain (10.4%), Germany (9.7%) and the
24
United Kingdom (7.9%). About 40% are single-owner firms or belong to families or entrepreneurs,
while only 0.2% of the companies are owned by venture capitalists or business angels. Most of the
firms belong to the service (47.6%) and trade sector (27.8%). One third of the SMEs introduced a
new or significantly improved product or service to the market during the past 12 months.
Regarding growth expectations, around 45% of the firms expect to have a moderate turnover
growth in the next two to three years (0-20% per year).
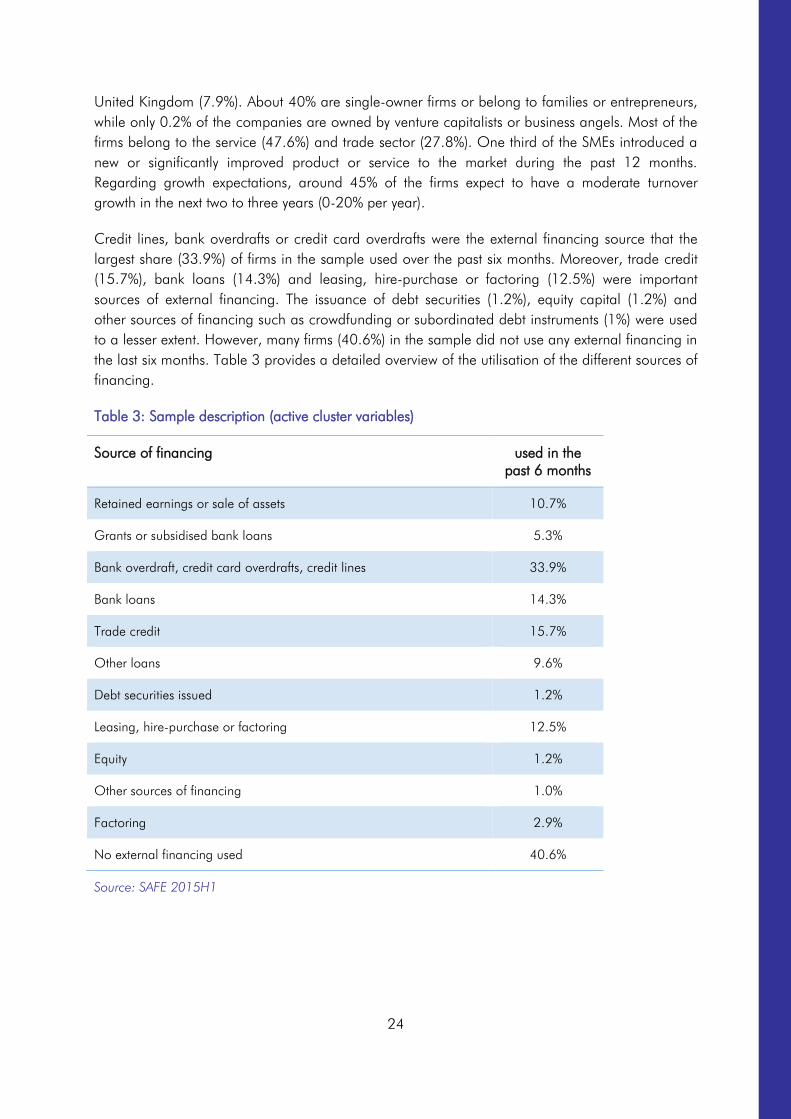
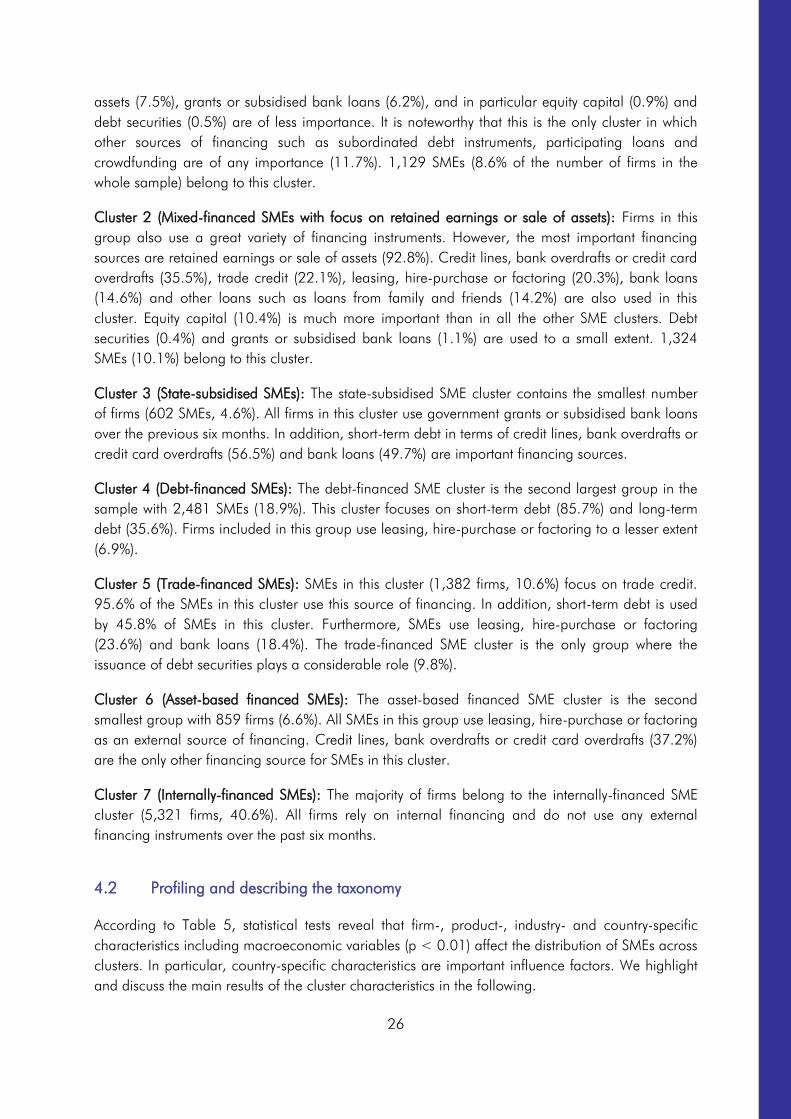
Credit lines, bank overdrafts or credit card overdrafts were the external financing source that the
largest share (33.9%) of firms in the sample used over the past six months. Moreover, trade credit
(15.7%), bank loans (14.3%) and leasing, hire-purchase or factoring (12.5%) were important
sources of external financing. The issuance of debt securities (1.2%), equity capital (1.2%) and
other sources of financing such as crowdfunding or subordinated debt instruments (1%) were used
to a lesser extent. However, many firms (40.6%) in the sample did not use any external financing in
the last six months. Table 3 provides a detailed overview of the utilisation of the different sources of
financing.
Table 3: Sample description (active cluster variables)
Source of financing used in the
past 6 months
Retained earnings or sale of assets 10.7%
Grants or subsidised bank loans 5.3%
Bank overdraft, credit card overdrafts, credit lines 33.9%
Bank loans 14.3%
Trade credit 15.7%
Other loans 9.6%
Debt securities issued 1.2%
Leasing, hire-purchase or factoring 12.5%
Equity 1.2%
Other sources of financing 1.0%
Factoring 2.9%
No external financing used 40.6%
Source: SAFE 2015H1
25
4 Empirical analysis
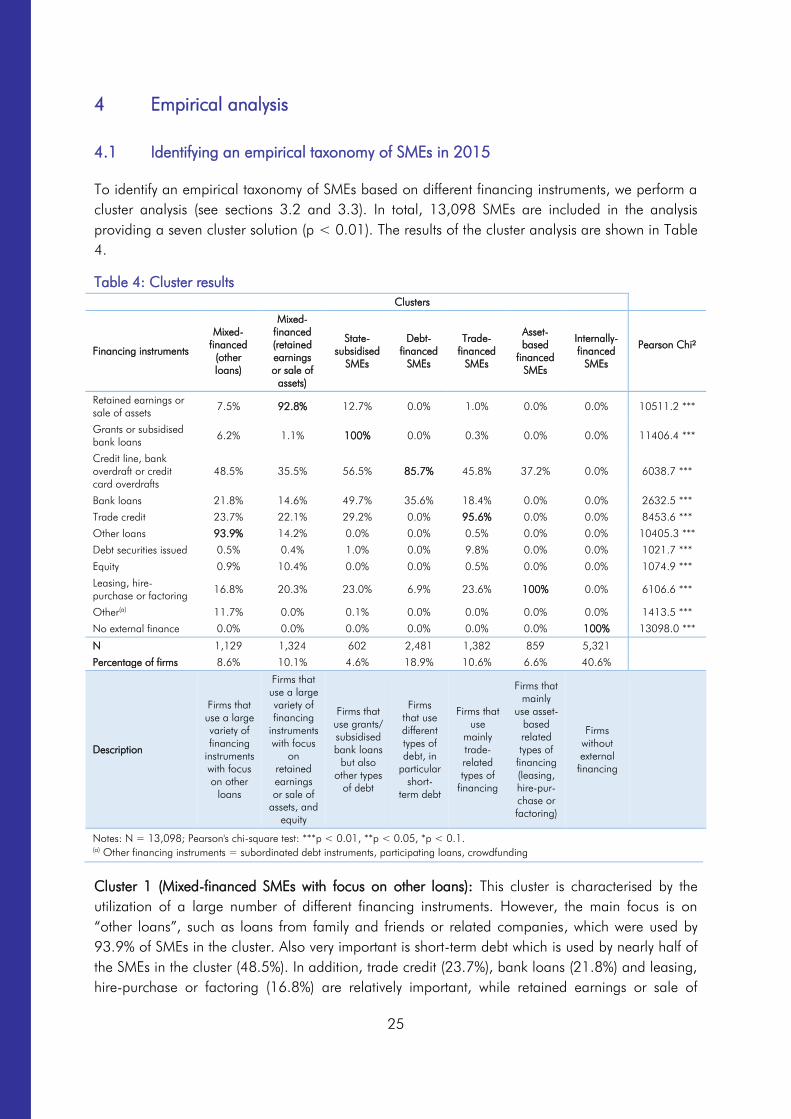
4.1 Identifying an empirical taxonomy of SMEs in 2015
To identify an empirical taxonomy of SMEs based on different financing instruments, we perform a
cluster analysis (see sections 3.2 and 3.3). In total, 13,098 SMEs are included in the analysis
providing a seven cluster solution (p < 0.01). The results of the cluster analysis are shown in Table
4.
Table 4: Cluster results
Clusters
Financing instruments
Mixed-
financed
(other
loans)
Mixed-
financed
(retained
earnings
or sale of
assets)
State-
subsidised
SMEs
Debt-
financed
SMEs
Trade-
financed
SMEs
Asset-
based
financed
SMEs
Internally-
financed
SMEs
Pearson Chi²
Retained earnings or
sale of assets 7.5% 92.8% 12.7% 0.0% 1.0% 0.0% 0.0% 10511.2 ***
Grants or subsidised
bank loans 6.2% 1.1% 100% 0.0% 0.3% 0.0% 0.0% 11406.4 ***
Credit line, bank
overdraft or credit
card overdrafts
48.5% 35.5% 56.5% 85.7% 45.8% 37.2% 0.0% 6038.7 ***
Bank loans 21.8% 14.6% 49.7% 35.6% 18.4% 0.0% 0.0% 2632.5 ***
Trade credit 23.7% 22.1% 29.2% 0.0% 95.6% 0.0% 0.0% 8453.6 ***
Other loans 93.9% 14.2% 0.0% 0.0% 0.5% 0.0% 0.0% 10405.3 ***
Debt securities issued 0.5% 0.4% 1.0% 0.0% 9.8% 0.0% 0.0% 1021.7 ***
Equity 0.9% 10.4% 0.0% 0.0% 0.5% 0.0% 0.0% 1074.9 ***
Leasing, hire-
purchase or factoring 16.8% 20.3% 23.0% 6.9% 23.6% 100% 0.0% 6106.6 ***
Other(a)
11.7% 0.0% 0.1% 0.0% 0.0% 0.0% 0.0% 1413.5 ***
No external finance 0.0% 0.0% 0.0% 0.0% 0.0% 0.0% 100% 13098.0 ***
N 1,129 1,324 602 2,481 1,382 859 5,321
Percentage of firms 8.6% 10.1% 4.6% 18.9% 10.6% 6.6% 40.6%
Description
Firms that
use a large
variety of
financing
instruments
with focus
on other
loans
Firms that
use a large
variety of
financing
instruments
with focus
on
retained
earnings
or sale of
assets, and
equity
Firms that
use grants/
subsidised
bank loans
but also
other types
of debt
Firms
that use
different
types of
debt, in
particular
short-
term debt
Firms that
use
mainly
trade-
related
types of
financing
Firms that
mainly
use asset-
based
related
types of
financing
(leasing,
hire-pur-
chase or
factoring)
Firms
without
external
financing
Notes: N = 13,098; Pearson's chi-square test: ***p < 0.01, **p < 0.05, *p < 0.1.
(a) Other financing instruments = subordinated debt instruments, participating loans, crowdfunding
Cluster 1 (Mixed-financed SMEs with focus on other loans): This cluster is characterised by the
utilization of a large number of different financing instruments. However, the main focus is on
“other loans”, such as loans from family and friends or related companies, which were used by
93.9% of SMEs in the cluster. Also very important is short-term debt which is used by nearly half of
the SMEs in the cluster (48.5%). In addition, trade credit (23.7%), bank loans (21.8%) and leasing,
hire-purchase or factoring (16.8%) are relatively important, while retained earnings or sale of
26
assets (7.5%), grants or subsidised bank loans (6.2%), and in particular equity capital (0.9%) and
debt securities (0.5%) are of less importance. It is noteworthy that this is the only cluster in which
other sources of financing such as subordinated debt instruments, participating loans and
crowdfunding are of any importance (11.7%). 1,129 SMEs (8.6% of the number of firms in the
whole sample) belong to this cluster.
Cluster 2 (Mixed-financed SMEs with focus on retained earnings or sale of assets): Firms in this
group also use a great variety of financing instruments. However, the most important financing
sources are retained earnings or sale of assets (92.8%). Credit lines, bank overdrafts or credit card
overdrafts (35.5%), trade credit (22.1%), leasing, hire-purchase or factoring (20.3%), bank loans
(14.6%) and other loans such as loans from family and friends (14.2%) are also used in this
cluster. Equity capital (10.4%) is much more important than in all the other SME clusters. Debt
securities (0.4%) and grants or subsidised bank loans (1.1%) are used to a small extent. 1,324
SMEs (10.1%) belong to this cluster.
Cluster 3 (State-subsidised SMEs): The state-subsidised SME cluster contains the smallest number
of firms (602 SMEs, 4.6%). All firms in this cluster use government grants or subsidised bank loans
over the previous six months. In addition, short-term debt in terms of credit lines, bank overdrafts or
credit card overdrafts (56.5%) and bank loans (49.7%) are important financing sources.
Cluster 4 (Debt-financed SMEs): The debt-financed SME cluster is the second largest group in the
sample with 2,481 SMEs (18.9%). This cluster focuses on short-term debt (85.7%) and long-term
debt (35.6%). Firms included in this group use leasing, hire-purchase or factoring to a lesser extent
(6.9%).
Cluster 5 (Trade-financed SMEs): SMEs in this cluster (1,382 firms, 10.6%) focus on trade credit.
95.6% of the SMEs in this cluster use this source of financing. In addition, short-term debt is used
by 45.8% of SMEs in this cluster. Furthermore, SMEs use leasing, hire-purchase or factoring
(23.6%) and bank loans (18.4%). The trade-financed SME cluster is the only group where the
issuance of debt securities plays a considerable role (9.8%).
Cluster 6 (Asset-based financed SMEs): The asset-based financed SME cluster is the second
smallest group with 859 firms (6.6%). All SMEs in this group use leasing, hire-purchase or factoring
as an external source of financing. Credit lines, bank overdrafts or credit card overdrafts (37.2%)
are the only other financing source for SMEs in this cluster.
Cluster 7 (Internally-financed SMEs): The majority of firms belong to the internally-financed SME
cluster (5,321 firms, 40.6%). All firms rely on internal financing and do not use any external
financing instruments over the past six months.
4.2 Profiling and describing the taxonomy
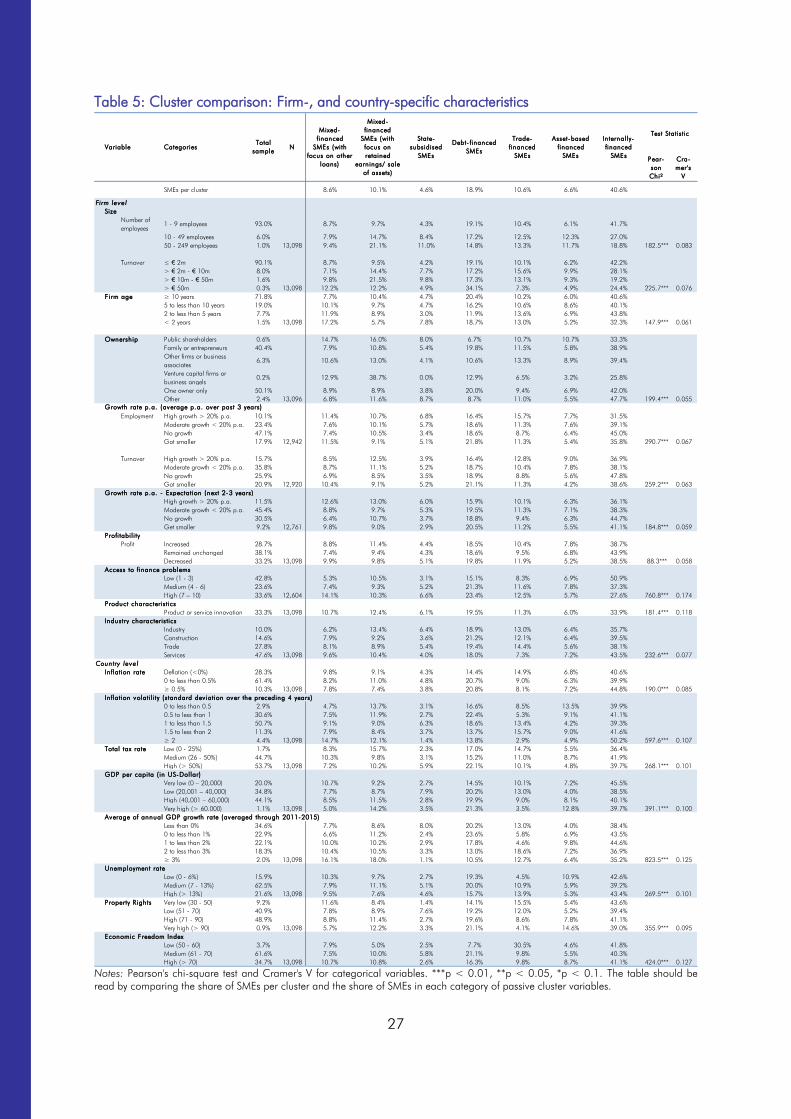
According to Table 5, statistical tests reveal that firm-, product-, industry- and country-specific
characteristics including macroeconomic variables (p < 0.01) affect the distribution of SMEs across
clusters. In particular, country-specific characteristics are important influence factors. We highlight
and discuss the main results of the cluster characteristics in the following.
27
Table 5: Cluster comparison: Firm-, and country-specific characteristics
Notes: Pearson's chi-square test and Cramer's V for categorical variables. ***p < 0.01, **p < 0.05, *p < 0.1. The table should be
read by comparing the share of SMEs per cluster and the share of SMEs in each category of passive cluster variables.
Pear-
son
Chi²
Cra-
mer's
V
Firm level
Size
Number of
employees
1 - 9 employees 93.0% 8.7% 9.7% 4.3% 19.1% 10.4% 6.1% 41.7%
10 - 49 employees 6.0% 7.9% 14.7% 8.4% 17.2% 12.5% 12.3% 27.0%
50 - 249 employees 1.0% 13,098 9.4% 21.1% 11.0% 14.8% 13.3% 11.7% 18.8% 182.5*** 0.083
Turnover ≤ € 2m 90.1% 8.7% 9.5% 4.2% 19.1% 10.1% 6.2% 42.2%
> € 2m - € 10m 8.0% 7.1% 14.4% 7.7% 17.2% 15.6% 9.9% 28.1%
> € 10m - € 50m 1.6% 9.8% 21.5% 9.8% 17.3% 13.1% 9.3% 19.2%
> € 50m 0.3% 13,098 12.2% 12.2% 4.9% 34.1% 7.3% 4.9% 24.4% 225.7*** 0.076
Firm age ≥ 10 years 71.8% 7.7% 10.4% 4.7% 20.4% 10.2% 6.0% 40.6%
5 to less than 10 years 19.0% 10.1% 9.7% 4.7% 16.2% 10.6% 8.6% 40.1%
2 to less than 5 years 7.7% 11.9% 8.9% 3.0% 11.9% 13.6% 6.9% 43.8%
< 2 years 1.5% 13,098 17.2% 5.7% 7.8% 18.7% 13.0% 5.2% 32.3% 147.9*** 0.061
Ownership Public shareholders 0.6% 14.7% 16.0% 8.0% 6.7% 10.7% 10.7% 33.3%
Family or entrepreneurs 40.4% 7.9% 10.8% 5.4% 19.8% 11.5% 5.8% 38.9%
Other firms or business
associates
6.3% 10.6% 13.0% 4.1% 10.6% 13.3% 8.9% 39.4%
Venture capital firms or
business angels
0.2% 12.9% 38.7% 0.0% 12.9% 6.5% 3.2% 25.8%
One owner only 50.1% 8.9% 8.9% 3.8% 20.0% 9.4% 6.9% 42.0%
Other 2.4% 13,096 6.8% 11.6% 8.7% 8.7% 11.0% 5.5% 47.7% 199.4*** 0.055
Employment High growth > 20% p.a. 10.1% 11.4% 10.7% 6.8% 16.4% 15.7% 7.7% 31.5%
Moderate growth < 20% p.a. 23.4% 7.6% 10.1% 5.7% 18.6% 11.3% 7.6% 39.1%
No growth 47.1% 7.4% 10.5% 3.4% 18.6% 8.7% 6.4% 45.0%
Got smaller 17.9% 12,942 11.5% 9.1% 5.1% 21.8% 11.3% 5.4% 35.8% 290.7*** 0.067
Turnover High growth > 20% p.a. 15.7% 8.5% 12.5% 3.9% 16.4% 12.8% 9.0% 36.9%
Moderate growth < 20% p.a. 35.8% 8.7% 11.1% 5.2% 18.7% 10.4% 7.8% 38.1%
No growth 25.9% 6.9% 8.5% 3.5% 18.9% 8.8% 5.6% 47.8%
Got smaller 20.9% 12,920 10.4% 9.1% 5.2% 21.1% 11.3% 4.2% 38.6% 259.2*** 0.063
High growth > 20% p.a. 11.5% 12.6% 13.0% 6.0% 15.9% 10.1% 6.3% 36.1%
Moderate growth < 20% p.a. 45.4% 8.8% 9.7% 5.3% 19.5% 11.3% 7.1% 38.3%
No growth 30.5% 6.4% 10.7% 3.7% 18.8% 9.4% 6.3% 44.7%
Get smaller 9.2% 12,761 9.8% 9.0% 2.9% 20.5% 11.2% 5.5% 41.1% 184.8*** 0.059
Profitabili ty
Profit Increased 28.7% 8.8% 11.4% 4.4% 18.5% 10.4% 7.8% 38.7%
Remained unchanged 38.1% 7.4% 9.4% 4.3% 18.6% 9.5% 6.8% 43.9%
Decreased 33.2% 13,098 9.9% 9.8% 5.1% 19.8% 11.9% 5.2% 38.5% 88.3*** 0.058
Low (1 - 3) 42.8% 5.3% 10.5% 3.1% 15.1% 8.3% 6.9% 50.9%
Medium (4 - 6) 23.6% 7.4% 9.3% 5.2% 21.3% 11.6% 7.8% 37.3%
High (7 – 10) 33.6% 12,604 14.1% 10.3% 6.6% 23.4% 12.5% 5.7% 27.6% 760.8*** 0.174
Product characteristics
Product or service innovation 33.3% 13,098 10.7% 12.4% 6.1% 19.5% 11.3% 6.0% 33.9% 181.4*** 0.118
Industry 10.0% 6.2% 13.4% 6.4% 18.9% 13.0% 6.4% 35.7%
Construction 14.6% 7.9% 9.2% 3.6% 21.2% 12.1% 6.4% 39.5%
Trade 27.8% 8.1% 8.9% 5.4% 19.4% 14.4% 5.6% 38.1%
Services 47.6% 13,098 9.6% 10.4% 4.0% 18.0% 7.3% 7.2% 43.5% 232.6*** 0.077
Country level
Inflation rate Deflation (<0%) 28.3% 9.8% 9.1% 4.3% 14.4% 14.9% 6.8% 40.6%
0 to less than 0.5% 61.4% 8.2% 11.0% 4.8% 20.7% 9.0% 6.3% 39.9%
≥ 0.5% 10.3% 13,098 7.8% 7.4% 3.8% 20.8% 8.1% 7.2% 44.8% 190.0*** 0.085
Inflation volatil i ty ( standard dev iation over the preceding 4 years)
0 to less than 0.5 2.9% 4.7% 13.7% 3.1% 16.6% 8.5% 13.5% 39.9%
0.5 to less than 1 30.6% 7.5% 11.9% 2.7% 22.4% 5.3% 9.1% 41.1%
1 to less than 1.5 50.7% 9.1% 9.0% 6.3% 18.6% 13.4% 4.2% 39.3%
1.5 to less than 2 11.3% 7.9% 8.4% 3.7% 13.7% 15.7% 9.0% 41.6%
≥ 2 4.4% 13,098 14.7% 12.1% 1.4% 13.8% 2.9% 4.9% 50.2% 597.6*** 0.107
Total tax rate Low (0 - 25%) 1.7% 8.3% 15.7% 2.3% 17.0% 14.7% 5.5% 36.4%
Medium (26 - 50%) 44.7% 10.3% 9.8% 3.1% 15.2% 11.0% 8.7% 41.9%
High (> 50%) 53.7% 13,098 7.2% 10.2% 5.9% 22.1% 10.1% 4.8% 39.7% 268.1*** 0.101
GDP per capita ( in US-Dollar)
Very low (0 – 20,000) 20.0% 10.7% 9.2% 2.7% 14.5% 10.1% 7.2% 45.5%
Low (20,001 – 40,000) 34.8% 7.7% 8.7% 7.9% 20.2% 13.0% 4.0% 38.5%
High (40,001 – 60,000) 44.1% 8.5% 11.5% 2.8% 19.9% 9.0% 8.1% 40.1%
Very high (> 60.000) 1.1% 13,098 5.0% 14.2% 3.5% 21.3% 3.5% 12.8% 39.7% 391.1*** 0.100
Average of annual GDP growth rate (averaged through 2011-2015)
Less than 0% 34.6% 7.7% 8.6% 8.0% 20.2% 13.0% 4.0% 38.4%
0 to less than 1% 22.9% 6.6% 11.2% 2.4% 23.6% 5.8% 6.9% 43.5%
1 to less than 2% 22.1% 10.0% 10.2% 2.9% 17.8% 4.6% 9.8% 44.6%
2 to less than 3% 18.3% 10.4% 10.5% 3.3% 13.0% 18.6% 7.2% 36.9%
≥ 3% 2.0% 13,098 16.1% 18.0% 1.1% 10.5% 12.7% 6.4% 35.2% 823.5*** 0.125
Unemployment rate
Low (0 - 6%) 15.9% 10.3% 9.7% 2.7% 19.3% 4.5% 10.9% 42.6%
Medium (7 - 13%) 62.5% 7.9% 11.1% 5.1% 20.0% 10.9% 5.9% 39.2%
High (> 13%) 21.6% 13,098 9.5% 7.6% 4.6% 15.7% 13.9% 5.3% 43.4% 269.5*** 0.101
Property Rights Very low (30 - 50) 9.2% 11.6% 8.4% 1.4% 14.1% 15.5% 5.4% 43.6%
Low (51 - 70) 40.9% 7.8% 8.9% 7.6% 19.2% 12.0% 5.2% 39.4%
High (71 - 90) 48.9% 8.8% 11.4% 2.7% 19.6% 8.6% 7.8% 41.1%
Very high (> 90) 0.9% 13,098 5.7% 12.2% 3.3% 21.1% 4.1% 14.6% 39.0% 355.9*** 0.095
Economic F reedom Index
Low (50 - 60) 3.7% 7.9% 5.0% 2.5% 7.7% 30.5% 4.6% 41.8%
Medium (61 - 70) 61.6% 7.5% 10.0% 5.8% 21.1% 9.8% 5.5% 40.3%
High (> 70) 34.7% 13,098 10.7% 10.8% 2.6% 16.3% 9.8% 8.7% 41.1% 424.0*** 0.127
Access to finance problems
Growth rate p.a. - Expectation (next 2-3 years)
Growth rate p.a. (average p.a. over past 3 years)
Test Statistic
Internally-
financed
SMEs
Asset-based
financed
SMEs
Trade-
financed
SMEs
State-
subsidised
SMEs
Debt- financed
SMEs
40.6%
Industry characteristics
Variable Categories
Total
sampleN
6.6%
Mixed-
financed
SMEs (with
focus on other
loans)
Mixed-
financed
SMEs (with
focus on
retained
earnings/ sale
of assets)
SMEs per cluster 8.6% 10.1% 4.6% 18.9% 10.6%

28
4.2.1 Firm level characteristics of the clusters
While larger SMEs use a great variety of financing instruments such as bank loans, trade credit,
state-subsidised financing and equity, smaller SMEs tend to use more internal financing (41.7% of
SMEs with 1-9 employees belong to the internally-financed cluster) and short-term bank debt
(19.1% of SMEs with 1-9 employees belong to the debt-financed cluster). This result is in line with
previous studies, which found that smaller firms with their liability of smallness and legitimacy
problems, face difficulties to obtain external financing (e.g., Aldrich and Auster 1986; see for an
overview also Kraemer-Eis, Lang, Torfs, and Gvetadze 2016). In particular, banks have been
found to be reluctant to lend money to smaller companies as the bankruptcy risk for these firms is
higher (Degryse et al. 2012; Michaelas et al. 1999). Hence, small firms tend to be more often
financed by internal sources or short-term bank debt (Beck et al. 2008; Berger and Udell 1998;
Freeman, Carroll, and Hannan 1983; Huyghebaert and Van de Gucht 2007; Singh, Tucker, and
House 1986). In line with previous research, our cluster analysis reveals that not only size but also
firm age seems to be an important determinant for financing (Chavis et al. 2011; Huyghebaert
and van de Gucht 2007; Mac an Bhaird and Lucey 2010). More mature firms use a larger
number of financing sources including bank loans, equity and retained earnings, whereas younger
SMEs appear to rely more on other loans (e.g., loans from family and friends), internal or state-
subsidised financing. Due to higher information asymmetries resulting from missing track records
and the absence of established relationships between capital providers and younger firms, these
firms typically have problems to obtain external financing and are more likely to rely on informal
financing sources (Berger and Udell 1998; Chittenden et al. 1996; Holmes and Kent 1991;
Jensen and Meckling 1976).
In addition, the ownership structure of SMEs across clusters differs significantly. In particular,
owner-managed SMEs seem to prefer short-term bank financing (20% of owner-managed firms
belong to the debt-financed cluster), whereas family-owned firms and SMEs with more than one
owner tend to use a larger variety of financing instruments. These results are in line with previous
research which found a significant influence of SME’s ownership structure on its capital structure
(Huyghebaert, Van de Gucht, and Van Hulle 2007; Romano, Tanewski, and Smyrnios 2001). In
particular, it has been shown that owner-managed firms prefer debt and internal financing
instruments over equity in order to retain control (Bathala, Bowlin, and Dukes 2004; Chittenden et
al. 1996). Whereas family-owned SMEs have been found to use a larger variety of financing
instruments (Romano et al. 2001).
Furthermore, we find that innovative SMEs seem to use short-term bank debt to a relatively large
extent (19.5% of SMEs with a product or service innovation in the last 12 months belong to the
debt-financed cluster). Moreover, they are comparably strongly represented in both mixed-financed
clusters, which have a high utilization of retained earnings or sale of assets, equity, and other loans
(such as from family and friends). They also seem to frequently use grants or state-subsidised loans
(6.1% of all “innovative” SMEs belong to the state-subsidised cluster, which is higher than the
share of all SMEs (4.6%) in this cluster). Innovative firms are typically associated with a higher asset
intangibility and higher failure risks (see Chapter 3.3). In addition, information asymmetries are
particularly high and result in higher agency costs (Cosh, Cumming, and Hughes 2009; Gompers
and Lerner 2000). Therefore, innovative SMEs have comparatively more difficulties to obtain
external capital and especially bank debt (Achleitner et al. 2011; Huyghebaert and Van de Gucht
29
2007; Rajan and Zingales 1995). With regard to growth, the cluster analysis reveals that SMEs
with higher past (turnover or employment) growth rates tend to use a larger variety of financing
instruments and in particular trade credit, leasing or hire-purchase and factoring. Hence, they can
be found more often in the trade-financed and asset-based financed clusters. Moreover,
companies with high turnover growth rates are well-represented in the mixed-financed cluster with
focus on retained earnings or sale of assets, while enterprises with high employment growth rates
are more often in the mixed-financed cluster with focus on other loans as well as in the state-
subsidised cluster. SMEs with high growth expectations for the future are also comparatively more
often in the mixed-financed and the state-subsidised clusters. This result can be explained with
previous findings stating that high growth firms typically require more external financing but at the
same time have been found to face more difficulties to acquire external capital from formal
financing sources due to their risk profile (Carpenter and Petersen, 2002b; Cassar, 2004).
With regard to profit development, our cluster analysis reveals that SMEs with increased profits in
the past 12 months tend to be more often in the mixed-financed SME cluster (with focus on
retained earnings or sale of assets). This result is not surprising as more profitable firms are more
likely to retain earnings. Hence, these firms have more internal financing at their disposal and
require less external financing. This result is also in line with the pecking order theory (Myers and
Majluf 1984; Myers 1984). Furthermore, we find that firms with low perceived access to finance
problems tend to be more often internally financed, while only a relatively small fraction of these
firms is state-subsidised. SMEs suffering from high perceived access to finance problems are
comparatively more often in the debt-financed, mixed-financed, state-subsidised and trade-
financed clusters. This result might be explained by the fact that internally financed firms seem not
to require external financing. On the contrary, financially constrained firms appear to follow a
diversification strategy to secure the required level of financing.10
Comparing the industry-specific characteristics across clusters, service firms seem to focus mainly
on internal financing. In addition, they are comparatively more often in the asset-based financing
and mixed-financing clusters. This result is in line with previous research, which has shown that
service firms typically rely more on internal financing due to their asset structure. Furthermore, they
are less able to provide collateral which is required for external financing, especially bank debt.
Therefore, they seem to rely more on alternative financing instruments such as asset-based
financing (Chavis et al. 2011; Erramilli and Rao 1993; Grier and Zychowicz 1994). SMEs in the
10
However, the result can - at least to some degree - also be biased by measurement and data collection.
For instance, self-assessment of perceived and actual access to finance problems might be distorted in the
sense that well-performing firms are less likely to complain about access to finance problems, while SMEs
with a poor performance might be inclined to blame their problems on their access to finance situation in
order to justify their current situation (Claessens and Tziousmis 2006). Therefore, the results might be - at
least in part - driven by the current business situation of the firms. With regard to our sample, especially
SMEs in the clusters with high perceived access to finance problems show decreasing profits in the past 12
months, whereas SMEs in the internally-financed cluster (where SMEs that stated low access to finance
problems are comparatively strongly represented) have relatively stable profits. Moreover, the definition of
access to finance problems is difficult to assess and might cause problems in firms’ self-assessment
(Claessens and Tziousmis 2006). Ferrando and Mulier (2015) indicate significant differences between
perceived and actual financing constraints. Due to the data set, however, only the perceived access to
finance problems of SMEs could be included as a passive cluster variable.

30
industry sector, however, tend to be more likely to be in the trade- or mixed-financed clusters with a
focus on retained earnings and sale of assets. Due to their asset structure, SMEs in the industry
sector require more long-term financing (golden rule of capital) but are also able to attract more
debt as they can provide collateral to secure the debt (Michaelas et al. 1999; Degryse et al.
2012). This might be one explanation why SMEs in the industry sector are comparatively more
often in the state-subsidised cluster, in which bank loans also play a prominent role. The cluster
analysis further reveals that SMEs in the construction sector rely strongly on debt and trade-based
finance. According to previous research, SMEs in the construction sector have to rely more on
short-term rather than long-term debt, as banks are reluctant to provide long-term debt due to the
sector’s higher risks (Degryse et al. 2012; Hall et al. 2000; Jiménez and Saurina 2004). The
typical assessment that the construction sector intensively uses asset-based financing (Kraemer-Eis
and Lang 2012) is not confirmed by our analysis. SMEs in the trade sector especially use trade
financing. SMEs in the trade sector, typically require more working capital and hence, are more
likely to be financed by short-term debt and trade credit. (Chittenden et al. 1996; Klapper, Sarria-
Allende, and Sulla 2002; Petersen and Rajan 1997).
4.2.2 Country level characteristics of the clusters
Country-specific characteristics: To analyze the effect of country-specific variables on SME
financing, we follow the approach of Moritz et al. (2016) and categorize the various countries
according to their geographic location in Europe, their financial market system and the effect of the
financial market crisis (distressed vs. non-distressed countries) (see Table 6). To be able to analyse
country-specific effects in more detail, we included a number of macroeconomic variables in our
analysis. Using Cramer’s V as an indicator for the ability to explain the cluster affiliation, we find
that country-specific and macroeconomic differences are more pronounced than the differences by
product-, firm- and industry-specific characteristics
Table 6: Cluster comparison: Country-specific characteristics
Pearson
Chi ²
Cra-
mer' s V
Eastern Europe(a)
10.2% 8.8% 2.8% 15.0% 10.4% 7.1% 45.7%
Northern Europe(b)
11.0% 12.8% 2.8% 12.6% 16.9% 7.7% 36.3%
Southern Europe(c)
7.7% 8.6% 7.9% 20.2% 12.9% 4.1% 38.6%
Western Europe(d)
7.6% 11.3% 2.8% 22.8% 5.1% 8.5% 42.0%
Total sample 8.6% 10.1% 4.6% 18.9% 10.6% 6.6% 40.6% 651.7*** 0.129
Notes: N = 13,098; Pearson's chi-square test and Cramer's V for categorical variables. ***p < 0.01, **p < 0.05, *p < 0.1.
(a)
BG, CZ, HU, PL, RO, SK; (b)
DK, EE, FI, IE, LT, LV, SE, UK; (c)
CY, ES, GR, HR, IT, PT, SI; (d)
AT, BE, DE, FR, LU, NL
Pearson
Chi ²
Cra-
mer' s V
Bank-based countries(a)
7.4% 10.3% 5.9% 21.9% 9.5% 6.1% 38.9%
Market-based countries(b)
10.8% 10.2% 2.2% 13.6% 15.0% 7.3% 41.0%
Former socialist countries(c)
10.7% 9.5% 2.7% 14.4% 9.9% 7.5% 45.5%
Total sample 8.6% 10.1% 4.6% 18.9% 10.5% 6.6% 40.6% 295.2*** 0.150
Notes: N = 13,068; Pearson's chi-square test and Cramer's V for categorical variables. ***p < 0.01, **p < 0.05, *p < 0.1.
(a)
AT, BE, CY, DE, ES, FI, FR, GR, IE, IT, LU, PT; (b)
NL, SE, UK, FI; (c)
BG, CZ, EE, HR, HU, LT, LV, PL, RO, SI, SK
In ternal l y-
f i nanced
SMEs
In ternal l y-
f i nanced
SMEs
Asset -based
f i nanced
SMEs
Test Stat i st i cGroups of
bank-based,
market -based
and former
social i st count ri es
Groups of
count ri es
by region
(UNSD)
Mi xed-
f i nanced
SMEs (wi th
focus on
other l oans)
Mi xed-
f i nanced
SMEs (wi th
focus on
retai ned
earn i ngs/
sal e of asset s)
State-
subsi di sed
SMEs
Debt -
f i nanced
SMEs
Trade-
f i nanced
SMEs
Asset -based
f i nanced
SMEs
Test Stat i st i c
Mi xed-
f i nanced
SMEs (wi th
focus on
other l oans)
Mi xed-
f i nanced
SMEs (wi th
focus on
retai ned
earn i ngs/
sal e of asset s)
State-
subsi di sed
SMEs
Debt -
f i nanced
SMEs
Trade-
f i nanced
SMEs
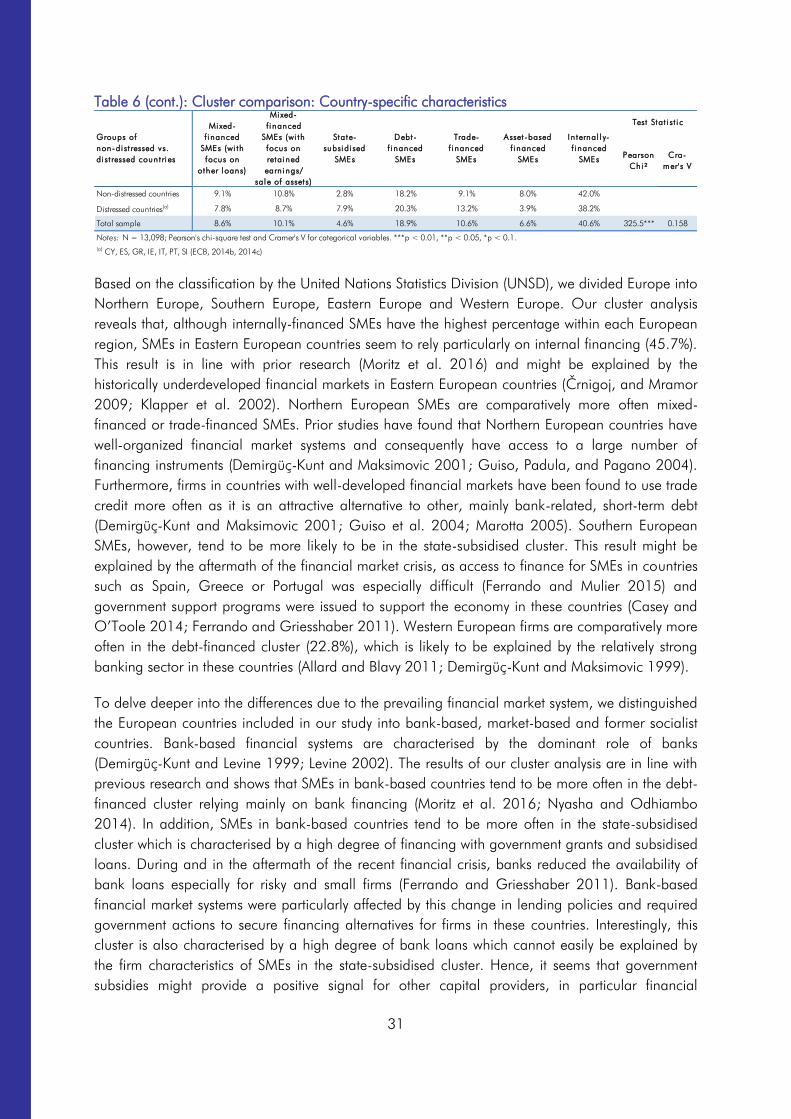
31
Table 6 (cont.): Cluster comparison: Country-specific characteristics
Based on the classification by the United Nations Statistics Division (UNSD), we divided Europe into
Northern Europe, Southern Europe, Eastern Europe and Western Europe. Our cluster analysis
reveals that, although internally-financed SMEs have the highest percentage within each European
region, SMEs in Eastern European countries seem to rely particularly on internal financing (45.7%).
This result is in line with prior research (Moritz et al. 2016) and might be explained by the
historically underdeveloped financial markets in Eastern European countries (Črnigoj, and Mramor
2009; Klapper et al. 2002). Northern European SMEs are comparatively more often mixed-
financed or trade-financed SMEs. Prior studies have found that Northern European countries have
well-organized financial market systems and consequently have access to a large number of
financing instruments (Demirgüç-Kunt and Maksimovic 2001; Guiso, Padula, and Pagano 2004).
Furthermore, firms in countries with well-developed financial markets have been found to use trade
credit more often as it is an attractive alternative to other, mainly bank-related, short-term debt
(Demirgüç-Kunt and Maksimovic 2001; Guiso et al. 2004; Marotta 2005). Southern European
SMEs, however, tend to be more likely to be in the state-subsidised cluster. This result might be
explained by the aftermath of the financial market crisis, as access to finance for SMEs in countries
such as Spain, Greece or Portugal was especially difficult (Ferrando and Mulier 2015) and
government support programs were issued to support the economy in these countries (Casey and
O’Toole 2014; Ferrando and Griesshaber 2011). Western European firms are comparatively more
often in the debt-financed cluster (22.8%), which is likely to be explained by the relatively strong
banking sector in these countries (Allard and Blavy 2011; Demirgüç-Kunt and Maksimovic 1999).
To delve deeper into the differences due to the prevailing financial market system, we distinguished
the European countries included in our study into bank-based, market-based and former socialist
countries. Bank-based financial systems are characterised by the dominant role of banks
(Demirgüç-Kunt and Levine 1999; Levine 2002). The results of our cluster analysis are in line with
previous research and shows that SMEs in bank-based countries tend to be more often in the debt-
financed cluster relying mainly on bank financing (Moritz et al. 2016; Nyasha and Odhiambo
2014). In addition, SMEs in bank-based countries tend to be more often in the state-subsidised
cluster which is characterised by a high degree of financing with government grants and subsidised
loans. During and in the aftermath of the recent financial crisis, banks reduced the availability of
bank loans especially for risky and small firms (Ferrando and Griesshaber 2011). Bank-based
financial market systems were particularly affected by this change in lending policies and required
government actions to secure financing alternatives for firms in these countries. Interestingly, this
cluster is also characterised by a high degree of bank loans which cannot easily be explained by
the firm characteristics of SMEs in the state-subsidised cluster. Hence, it seems that government
subsidies might provide a positive signal for other capital providers, in particular financial
Pearson
Chi ²
Cra-
mer' s V
Non-distressed countries 9.1% 10.8% 2.8% 18.2% 9.1% 8.0% 42.0%
Distressed countries(a)
7.8% 8.7% 7.9% 20.3% 13.2% 3.9% 38.2%
Total sample 8.6% 10.1% 4.6% 18.9% 10.6% 6.6% 40.6% 325.5*** 0.158
Notes: N = 13,098; Pearson's chi-square test and Cramer's V for categorical variables. ***p < 0.01, **p < 0.05, *p < 0.1.
(a)
CY, ES, GR, IE, IT, PT, SI (ECB, 2014b, 2014c)
In ternal l y-
f i nanced
SMEs
Groups of
non-di st ressed vs.
di st ressed count ri es
Asset -based
f i nanced
SMEs
Test Stat i st i cMi xed-
f i nanced
SMEs (wi th
focus on
other l oans)
Mi xed-
f i nanced
SMEs (wi th
focus on
retai ned
earn ings/
sal e of asset s)
State-
subsidi sed
SMEs
Debt -
f i nanced
SMEs
Trade-
f i nanced
SMEs

32
institutions (Beck et al. 2008; Freel 2006; Mina, Lahr, and Hughes 2013). Previous research
revealed that especially SMEs faced financing constraints during the recent economic and financial
crisis (Ferrando and Griesshaber, 2011). To understand how the financial market crisis affected the
financing patterns of SMEs, we divided the countries into distressed and non-distressed countries
(Moritz et al. 2016). We find that SMEs in distressed countries seem to be more likely to fall into
the trade-financed or state-subsidised cluster. This result is in line with previous studies that has
indicated an increasing utilization of alternative financing instruments in deteriorating financial
markets (Casey and O’Toole 2014; Moritz et al. 2016). Furthermore, SMEs in distressed countries
appear to rely more on grants or subsidised bank loans which can be explained by financial
constraints and the higher availability of subsidies (Casey and O’Toole 2014).
Macroeconomic variables: The cluster analysis further reveals that a country’s inflation rate
(Cramer’s V = 0.085) and inflation volatility (Cramer’s V = 0.107) seem to be important
factors, in determining the financing patterns of SMEs (see Table 5). SMEs in countries with a
higher inflation rate tend to use less trade financing and state subsidies, but are comparatively
more often in the debt-financed cluster. Previous research found that higher inflation is negatively
associated with the utilization of external financing (Beck et al. 2008), but, at the same time, higher
inflation rates and higher expected inflation rates seem to increase the leverage ratio of SMEs
(Frank and Goyal 2009; Öztekin 2015). However, we find a contrary result: firms in countries with
a low inflation volatility tend to be more often in the debt-financed SME cluster. Regarding inflation
volatility we find that SMEs in countries with a very high inflation volatility tend to be comparatively
more often in the internally-financed or mixed-financed cluster (with focus on other loans). This can
be explained by the fact that high inflation volatility decreases the predictability of a country’s future
development which in turn increases the business risk of firms. As a consequence, firms are more
likely to avoid long-term debt in this uncertain environment (Ball 1992; Fan et al. 2012; Frank and
Goyal 2009).
Furthermore, we find that GDP per capita (Cramer’s V = 0.100) and GDP growth rates
(Cramer’s V = 0.125) are related to the financing of firms. Both variables provide information
about the economic condition of a country (Bas, Muradoglu, and Phylaktis 2009; De Jong et al.
2008). Our cluster analysis reveals that SMEs in countries with high GDP per capita are
comparatively more often in the mixed-financed (with focus on retained earnings or sale of assets),
asset-based and debt-financed clusters. Hence, SMEs in more developed and economically sound
countries seem to be able to obtain financing from a larger variety of financing sources (Bas et al.
2009). In line with this finding, firms in countries with relatively high GDP growth rate appear to
use a broader range of financing instruments (18.0% of SMEs in countries with an average GDP
growth rate of ≥ 3% from 2011-2015 belong to the mixed-financed SME cluster with focus on
retained earnings or sale of assets), whereas SMEs in countries with lower GDP growth rates are
more likely to use state subsidies. This result implies that SMEs in less well developing countries
obtain more government support than do SMEs in countries with high GDP growth rates.
SMEs in countries with higher tax rates are more likely to be in the debt-financed cluster (22.1% of
SMEs in countries with a total tax rate of >50% belong to the debt-financed cluster) and in the
state-subsidised cluster, in which the use of bank loans is also relatively high. In contrast, SMEs in
countries with lower tax rates tend to use a larger variety of financing instruments as well as trade
33
financing. This result is in line with trade-off theory which is based on the idea that firms have to
make a trade-off decision between a positive tax effect of debt and bankruptcy risk (Miller 1977;
Myers 1977). Therefore, firms in countries with higher tax rates are able to generate a higher
positive tax effect and are therefore more likely to use more debt than do firms in low tax rate
countries (Graham 2003; Jensen and Meckling 1976; Meyers 1977; Psillaki and Daskalakis
2009).
A number of European countries suffered from economic instability and high unemployment rates
due to the financial and economic crisis starting in 2007. The banking system was strongly affected
by these developments and firms still suffer from bank lending constraints (Casey and O’Toole
2014; Tanveer, Marelli, and Signorelli 2012; Ferrando and Griesshaber 2011; O’Higgins 2012).
It has been found that firms with bank lending constraints, are more likely to use internal financing
and alternative financing instruments, for instance trade credit (Casey and O’Toole 2014;
Ferrando and Mulier 2015; Love, Preve, and Sarria-Allende, 2007). These findings are reflected in
our cluster analysis which shows that SMEs in countries with high unemployment rates (> 13%) are
more likely to be in the internally-financed and trade-financed cluster.
In addition, we find that SMEs in countries with low property right protections tend to rely strongly
on internal rather than external financing. Nevertheless, trade finances and other loans (e.g., from
family and friends, a related enterprise or shareholders) also appear to be important financing
instruments in these countries. Property right protections are closely related to financial
development and the effectiveness of financial contracting (Beck et al. 2003; La Porta et al.1997).
Therefore, better protection of property rights is associated with better access to external financing
for SMEs (Beck et al. 2008; Psillaki and Daskalakis 2009). This finding is further supported by
looking at the economic freedom index. We find that SMEs in countries with higher economic
freedom use a broader range of financing instruments and are consequently more likely to be in
the mixed-financed clusters. In addition, our cluster analysis reveals that SMEs in countries with a
very low level of economic freedom seem to be more often in the trade financed cluster (30.5% of
SMEs in countries with an Economic Freedom Index between 50 and 60 belong to this cluster).
This finding might also be due to the financial crisis and the difficulties faced by various European
countries, especially Greece (Drakos 2012; Gibson, Hall, and Tavlas 2012).11
4.3 Comparison of two taxonomies of SME financing patterns
The results in the previous Sections 4.1 and 4.2 have shown that the distribution of SMEs across
clusters differs significantly. In this section, we compare our cluster results, which is based on the
SAFE Survey 2015H1, with the cluster analysis of Moritz et al. (2016), based on the SAFE Survey
2013H1, to examine the stability of the clusters over time.
11
Greece is the sole country in the cluster comparison with an Economic Freedom Index that is less than 60.
Due to the banking sector difficulties after the financial crisis, Greek firms appear to use alternative
financing sources instead of bank loans and are consequently more likely to be in the trade-financed
cluster (Casey and O’Toole 2014; Love et al. 2007)
34
Comparing the financing instruments used, both cluster analyses (SAFE Survey 2013H1 and
2015H1) show similar financing patterns, in particular with regard to the trade-financed, internally-
financed and state-subsidised clusters. The latter is characterised in both cluster analyses by a very
high utilization of government subsidies and grants. However, bank loans and short-term bank
debt, trade credit, leasing, hire-purchase and factoring are used complementary to grants or
subsidised bank loans. Both cluster analyses identified a cluster of SMEs which did not use any
external financing over the past six months. This internally-financed cluster is the largest group of
SMEs in both cluster analyses. In addition, the trade-financed cluster in both studies is
characterised by the utilization of trade credit, other short-term debt and leasing, hire-purchase
and factoring. The main differences between both cluster results are that the current cluster analysis
(2015H1) contains two mixed-financed clusters, which are similar to the one mixed-financed
cluster identified in the SAFE Survey 2013H1 but with two different main instruments: SMEs in the
one cluster rely more on retained earnings and sale of assets whereas SMEs in the other use more
loans from families, friends and business associates. In addition, we find a combined debt-financed
cluster (2015H1), which includes elements of the debt-financed and flexible-debt financed cluster
identified in the data of 2013. Finally, we found a new cluster in the 2015 data, in which all SMEs
used leasing, hire-purchase or factoring as an external source of financing (asset-based financed
cluster).
Even though the clusters changed in part, we find strong similarities regarding firm-, product-,
industry- and country-specific characteristics in both cluster analyses. Both studies reveal that
smaller firms are more likely to use internal financing or short-term debt (Moritz et al. 2016).
Younger firms, however, tend to be more often in the mixed-financed or state-subsidised cluster.
Interestingly, very young firms (< 2 years) are less likely to be in the internally-financed cluster in
2015H1 (32.3%) than they are in 2013H1 (41.8%), but there is a comparatively high proportion
of young SMEs in the mixed-financed cluster with the focus on other loans in 2015H1 (17.2%).
Since external financing is often not available, due to high information asymmetries, and internal
financing is often not sufficient, young SMEs have been found to rely on informal financing sources
(e.g., loans from family and friends) (Berger and Udell 1998; Chittenden et al. 1996). However,
the results are limited by the very small sample of young firms in the SAFE-Survey 2015H1, since
only 1.5% of all SMEs belong to this age classification. This small subsample might lead to
significant inconsistent results over time. Both cluster analyses reveal that single-owner companies
are more likely to be in the internally-financed cluster, whereas family firms or SMEs with owner
teams appear to be more often in the debt-financed cluster. Owner-managed companies are more
likely to avoid a dilution of control, which might explain the high proportion of these firms in the
internally-financed cluster. Even though, family firms and entrepreneurial teams are also likely to
avoid too much influence through external parties, they seem to be more open to a larger variety
of external financing instruments but focus on low influential financing sources, in particular short-
term bank debt (Bathala et al. 2004; Chittenden et al. 1996; López-Gracia and Sogorb-Mira
2008; Mac an Bhaird and Lucey 2010; Myers 1984). Innovative SMEs are more likely to use short-
term debt, state-subsidised forms of financing or a large number of financing instruments whereas
equity financing also seems to be a relevant financing instrument (2013H1 and 2015H1). As
innovative SMEs are associated with a higher asset intangibility, higher risk due to less
diversification possibilities and higher information asymmetries, firms are more likely to be
restricted to short-term debt or have to rely on alternative financing sources. Venture capital is also

35
an important source of financing for innovative, high-growth SMEs (Achleitner et al. 2011; Block et
al 2017; Cosh et al. 2009; Gompers and Lerner 2004). The high percentage of innovative SMEs
in the state-subsidised cluster might be explained by the different government support programs
initiated to support in particular these types of companies. Looking at the industry sectors, both
cluster analyses reveal that SMEs in the service sector rely strongly on internal financing. This result
might be explained by the typically low degree of tangible assets and consequently, less necessity
for external financing. In addition, these firms also have less access to bank loans due to very
limited availability of collateral. Therefore, financing from turnover or bootstrapping techniques are
important financing sources for these companies (Chavis et al. 2011; Klapper et al. 2002; Moritz
et al. 2016). According to the two cluster analyses, SMEs in the trade sector seem to prefer trade
financing and short-term debt. This result is in line with prior research, which found that SMEs in
the trade sector need large amounts of working capital which makes short-term debt and trade
financing appropriate financing instruments (Hutchinson 1995; Klapper et al. 2002; Michaelas et
al. 1999).
To sum up, both cluster analyses (2013H1 and 2015H1) show very similar cluster results and are
surprisingly stable over time. Although our study (2015H1) reveals a seven cluster solution in
contrast to the six cluster solution of the previous work (Moritz et al. 2016), SMEs in both cluster
analyses use similar financing instruments as substitutes or complements, in particular in the trade-
financed, internally-financed and state-subsidised clusters (2013H1, 2015H1). Moreover, SMEs in
these clusters show very similar characteristics. However, some clusters identified in both studies
differ from each other. The debt-financed cluster (2015H1), for instance, seems to be a
combination of the debt- and flexible-debt financed cluster found in 2013. Furthermore, we found
a distinction between two mixed-financed clusters and identified a completely new asset-based
financed SME cluster. However, looking at the characteristics of the SMEs in the different clusters
we find very strong similarities between both cluster analyses.
5 Discussion
5.1 Summary of main findings and contributions
We developed an empirical taxonomy of European SME financing patterns using the SAFE Survey
2015H1 and identified seven financing types: mixed-financed SMEs with a focus on other loans,
mixed-financed SMEs with a focus on retained earnings or sale of assets, state-subsidised SMEs,
debt-financed SMEs, trade-financed SMEs, asset-based financed SMEs, and internally-financed
SMEs. The seven clusters differ according to firm-, product-, industry- and country-specific
characteristics (including macroeconomic variables). Table 7 summarises the main results of the
cluster analysis.
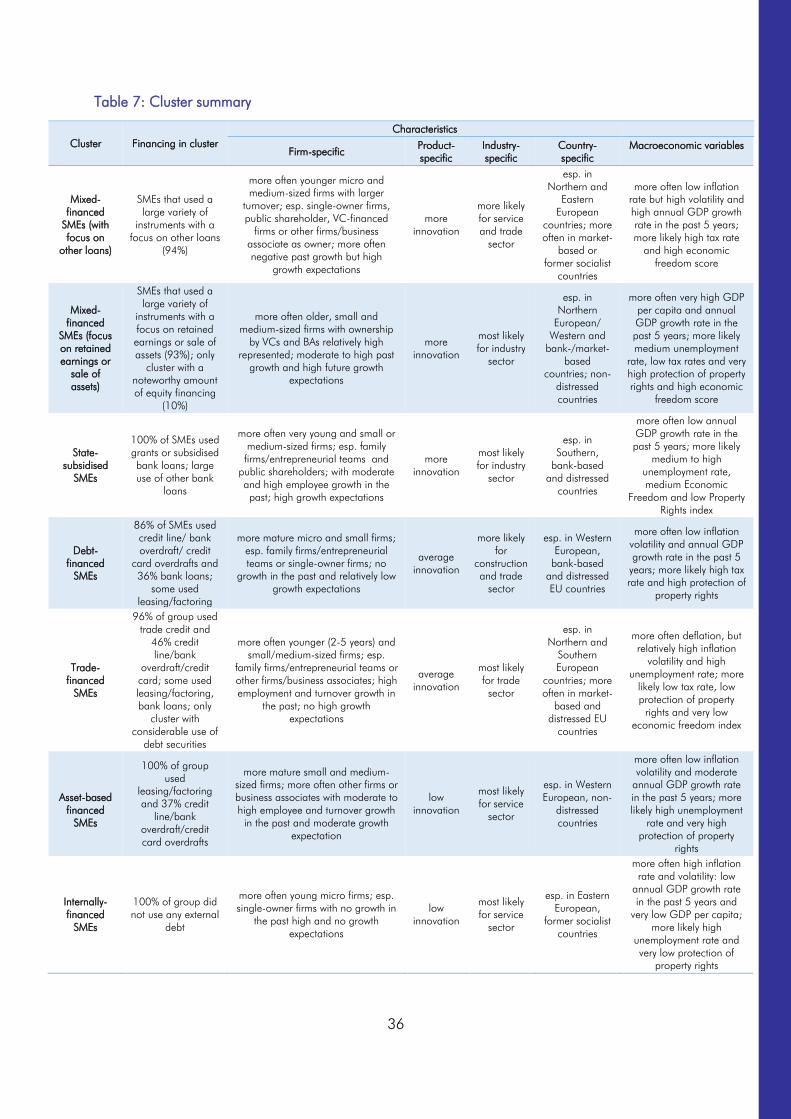
36
Table 7: Cluster summary
Cluster Financing in cluster
Characteristics
Firm-specific Product-
specific
Industry-
specific
Country-
specific
Macroeconomic variables
Mixed-
financed
SMEs (with
focus on
other loans)
SMEs that used a
large variety of
instruments with a
focus on other loans
(94%)
more often younger micro and
medium-sized firms with larger
turnover; esp. single-owner firms,
public shareholder, VC-financed
firms or other firms/business
associate as owner; more often
negative past growth but high
growth expectations
more
innovation
more likely
for service
and trade
sector
esp. in
Northern and
Eastern
European
countries; more
often in market-
based or
former socialist
countries
more often low inflation
rate but high volatility and
high annual GDP growth
rate in the past 5 years;
more likely high tax rate
and high economic
freedom score
Mixed-
financed
SMEs (focus
on retained
earnings or
sale of
assets)
SMEs that used a
large variety of
instruments with a
focus on retained
earnings or sale of
assets (93%); only
cluster with a
noteworthy amount
of equity financing
(10%)
more often older, small and
medium-sized firms with ownership
by VCs and BAs relatively high
represented; moderate to high past
growth and high future growth
expectations
more
innovation
most likely
for industry
sector
esp. in
Northern
European/
Western and
bank-/market-
based
countries; non-
distressed
countries
more often very high GDP
per capita and annual
GDP growth rate in the
past 5 years; more likely
medium unemployment
rate, low tax rates and very
high protection of property
rights and high economic
freedom score
State-
subsidised
SMEs
100% of SMEs used
grants or subsidised
bank loans; large
use of other bank
loans
more often very young and small or
medium-sized firms; esp. family
firms/entrepreneurial teams and
public shareholders; with moderate
and high employee growth in the
past; high growth expectations
more
innovation
most likely
for industry
sector
esp. in
Southern,
bank-based
and distressed
countries
more often low annual
GDP growth rate in the
past 5 years; more likely
medium to high
unemployment rate,
medium Economic
Freedom and low Property
Rights index
Debt-
financed
SMEs
86% of SMEs used
credit line/ bank
overdraft/ credit
card overdrafts and
36% bank loans;
some used
leasing/factoring
more mature micro and small firms;
esp. family firms/entrepreneurial
teams or single-owner firms; no
growth in the past and relatively low
growth expectations
average
innovation
more likely
for
construction
and trade
sector
esp. in Western
European,
bank-based
and distressed
EU countries
more often low inflation
volatility and annual GDP
growth rate in the past 5
years; more likely high tax
rate and high protection of
property rights
Trade-
financed
SMEs
96% of group used
trade credit and
46% credit
line/bank
overdraft/credit
card; some used
leasing/factoring,
bank loans; only
cluster with
considerable use of
debt securities
more often younger (2-5 years) and
small/medium-sized firms; esp.
family firms/entrepreneurial teams or
other firms/business associates; high
employment and turnover growth in
the past; no high growth
expectations
average
innovation
most likely
for trade
sector
esp. in
Northern and
Southern
European
countries; more
often in market-
based and
distressed EU
countries
more often deflation, but
relatively high inflation
volatility and high
unemployment rate; more
likely low tax rate, low
protection of property
rights and very low
economic freedom index
Asset-based
financed
SMEs
100% of group
used
leasing/factoring
and 37% credit
line/bank
overdraft/credit
card overdrafts
more mature small and medium-
sized firms; more often other firms or
business associates with moderate to
high employee and turnover growth
in the past and moderate growth
expectation
low
innovation
most likely
for service
sector
esp. in Western
European, non-
distressed
countries
more often low inflation
volatility and moderate
annual GDP growth rate
in the past 5 years; more
likely high unemployment
rate and very high
protection of property
rights
Internally-
financed
SMEs
100% of group did
not use any external
debt
more often young micro firms; esp.
single-owner firms with no growth in
the past high and no growth
expectations
low
innovation
most likely
for service
sector
esp. in Eastern
European,
former socialist
countries
more often high inflation
rate and volatility: low
annual GDP growth rate
in the past 5 years and
very low GDP per capita;
more likely high
unemployment rate and
very low protection of
property rights

37
Our study has several implications for both theory and practice. According to the theoretical
contribution, our research extends the SME finance literature in particular in three ways. First, we
contribute to the literature with regard to substitutive and complementary use of different financing
instruments for SMEs. While previous research focused mainly on a single financing source or a
small number of financing instruments (few exceptions are Beck et al. 2008; Berger and Udell
1998; Casey and O’Toole 2014; Lawless et al. 2015; Moritz et al. 2016; Robb 2002), for
instance bank loans, trade credit, or venture capital, we considered a large variety of different
financing instruments (Andrieu, Stagliano, and Van der Zwan 2015; Block et al. 2017; Cosh et al.
2009; Hutchinson 1995) by creating an empirical taxonomy of SME financing patterns. Second,
we examine whether the empirical taxonomy of SME financing patterns found by Moritz et al.
(2016) remains stable over time. The authors identified six distinct SME financing types, namely:
mixed-financed SMEs, state-subsidised SMEs, debt-financed SMEs, flexible-debt-financed SMEs,
trade-financed SMEs and internally-financed SMEs. Our study shows similar financing patterns
which strongly indicates that specific financing instruments are often used as complements or
substitutes. Third, we extend the study of Moritz et al. (2016) by adding macroeconomic variables
to the dataset. Not only firm-, product-, and industry-specific variables affect the financing patterns
of SMEs (e.g., Beck et al. 2008; Cosh et al. 2009; Michaelas et al.1999) but also country-specific
characteristics which we analysed deeper by investigating their macroeconomic differences (e.g.,
Beck and Demirgüç-Kunt 2006; Chavis et al. 2011; Hernández-Cánovas and Koëter-Kant 2011).
The results of our research can help policy makers to develop and adapt government support
programs. Our results reveal that several homogeneous SME financing patterns in Europe exist.
They can be characterised by different firm-, product-, industry- and country specific characteristics
and use financing instruments in different combinations as substitutes or complements. Policy
makers can benefit from these findings in several ways:
The results of the cluster analysis by Moritz et al. (2016) revealed that SMEs in the state-subsidised
SME cluster complement grants or subsidised bank loans with a large variety of financing
instruments, but in particular with bank loans. Our study supports this finding and reveals that
state-subsidised SMEs have access to bank loans even though, their specific characteristics would
imply a different result. We find that SMEs in this cluster are characterised by relatively high growth
rates in the past, high future growth expectations and high innovation activities which typically
make access to bank debt rather difficult. Hence, our findings support the assumption of Moritz et
al. (2016) that the financing by government support programs for relatively risky innovative and
fast growing SMEs appears to send a positive signal to external capital providers. In addition, we
also find that state subsidies seem to be more used by small and medium-sized firms and less for
micro firms. Micro firms, however, are more likely to be in the internally-financed or debt-financed
cluster (with a high percentage of short-term debt financing instruments). This result is also in line
with the results of Moritz et al. (2016). Hence, further analyses could investigate if this result can be
explained by the specific structure of these subsidies which does not fit the requirements of micro
firms or if micro firms simply lack the awareness of government support programmes. The answer
to these questions can help policy makers to give valuable information on how to further improve
their programmes. Further related work under our research project is underway and will be
published in due course.
38
Finally, the cluster analysis identifies the impact of macroeconomic variables on the financing
patterns of European SMEs. By comparing Cramer’s V, we find that macroeconomic differences
are more pronounced than firm level characteristics with regard to European financing patterns.
Therefore, policy makers should consider macroeconomic factors, such as the country’s inflation
volatility, the property rights or the unemployment rate and their impact on the firms‘ financing.
5.2 Limitations and future research
Our study is subject to some limitations. First, the study is limited to the sampling technique and
questions asked in the SAFE survey. For instance, the SAFE survey does not include solo self-
employed entrepreneurs and consequently a large number of start-up firms are excluded from the
research. In addition, firms are asked about the application for and the usage of different financing
instruments rather than about the relative importance of each instrument for the firm. Also, SMEs
are asked whether they used the specific financing instruments during the past six months. Although
the short time period offers the possibility to control for macroeconomic changes and biases over
the business life cycle of the firms, longer time periods could investigate more comprehensively
SMEs’ financing patterns. Furthermore, the inclusion of more firm-specific variables in the analysis,
particularly balance sheet data, which have been used in prior research (Ferrando and Mulier
2013), would strengthen the results of our analysis. However, due to the anonymity of the SAFE
survey a matching of these information with the survey data is very problematic (Ferrando and
Mulier, 2013).
Second, our statistical approach leads to some further limitations. Although we have controlled for
different cluster analysis algorithms and similarity measures, cluster analyses are relatively sensible
to the number of variables included and variations in the data set (Hair et al. 2010). Furthermore,
the comparison of the calculated cluster analysis in our study with the analysis of Moritz et al.
(2016) can only be descriptive as there are no statistical tests for the differences and similarities of
the two cluster solutions.
The described limitations provide a number of future research areas. First, to obtain a full picture
of the stability of financing patterns over time, a panel data set of SMEs is required. Even though
the ECB has introduced a (small) panel component to the survey, a complete panel data set for all
waves is not available (European Central Bank 2016). However, future research could include the
different waves of the SAFE survey in the cluster analysis and use the wave number as a passive
cluster variable to examine the stability of the clusters over time. Second, the relation between
financially constrained SMEs and the use of alternative financing instruments, including switches
between them over time, would be an interesting research area. Hence, including separate
categories for new financing instruments such as crowdfunding into the research could shed more
light on the trends in SME financing. Third, future research could investigate the differences in
financing of micro, small and medium-sized companies. In particular, research about the financing
of micro firms and its differences to larger SMEs is still scarce. Similar to our results, Moritz et al.
(2016) found that micro firms appear to use internal financing instruments and short-term debt
more often. Lawless et al. (2015) have shown that size (measured as the number of employees) is
positively related to the use of financing instruments. They found that the smaller the firms the less
likely they are to use different financing instruments. However, it remains unclear whether the
financing patterns of micro firms differ from other small or medium-sized companies which would
be an interesting research questions for future studies.
39
References
Achleitner, Ann-Kristin, Reiner Braun, and Karsten Kohn. 2011. “New Venture Financing in Germany:
Effects of Firm and Owner Characteristics.” Zeitschrift Für Betriebswirtschaft 81 (3): 263–94.
Agarwal, Sumit, and Hamid Mohtadi. 2004. “Financial Markets and the Financing Choice of Firms:
Evidence from Developing Countries.” Global Finance Journal 15 (1): 57–70.
Allard, Julien, and Rodolphe Blavy. 2011. “Market Phoenixes and Banking Ducks: Are Recoveries Faster
in Market-Based Financial Systems?” IMF Working Papers 11 (213): 1.
doi:10.5089/9781463902292.001.
Andrieu, Stagliano, and Van der Zwan. 2015. “Bank Debt and Trade Credit for SMEs: International
Evidence.” available at: http://dx.doi.org/10.2139/ssrn.2494213 (accessed 10 October 2016).
Artola, Concha, and Veronique Genre. 2011. “Euro Area SMEs Under Financial Constraints: Belief or
Reality?” CESifo Working Papers, available at: http://www.econstor.eu/handle/10419/53136 (accessed
20 October 2016).
Ayyagari, Meghana, Thorsten Beck, and Asil Demirgüç-Kunt. 2007. “Small and Medium Enterprises
Across the Globe.” Small Business Economics 29 (4): 415–34.
Backhaus, Klaus, Bernd Erichson, Wulff Plinke, and Rolf Weiber. 2013. Multivariate Analysemethoden.
13th ed. Berlin: Springer.
Ball, Laurence. 1992. “Why Does High Inflation Raise Inflation Uncertainty?” Journal of Monetary
Economics 29 (3): 371–88.
Bas, Tugba, Gulnur Muradoglu, and Kate Phylaktis. 2009. “Detmerinants of Capital Structure in
Developing Countries” Research Paper Series, available at:
https://www.researchgate.net/profile/Gulnur_Muradoglu/publication/228465937_Determinants_of_Ca
pital_Structure_in_Developing_Countries/links/0c960528f4a56601b8000000.pdf (accessed 10
October 2016).
Bathala, Chenchuramaiah T., Oswald D. Bowlin, and William P. Dukes. 2004. “Sources of Capital and
Debt Structure in Small Firms.” The Journal of Entrepreneurial Finance 9 (1): 29–50.
Becchetti, Leonadro, and Giovanni Trovato. 2002. “The Determinants of Growth for Small and Medium
Sized Firms. The Role of the Availability of External Finance.” Small Business Economics 19 (4): 291–
306.
Beck, Thorsten, and Asli Demirgüç-Kunt. 2006. “Small and Medium-Size Enterprises: Access to Finance
as a Growth Constraint.” Journal of Banking & Finance 30 (11): 2931–43.
Beck, Thorsten, Asli Demirgüç-Kunt, and Ross Levine. 2003. “Law and Finance: Why Does Legal Origin
Matter?” Journal of Comparative Economics 31 (4): 653–75.
Beck, Thorsten, Asli Demirgüç-Kunt, and Vojislav Maksimovic. 2008. “Financing Patterns Around the
World: Are Small Firms Different?” Journal of Financial Economics 89 (3): 467–87.
Berger, Allen N., and Gregory F. Udell. 1998. “The Economics of Small Business Finance: The Roles of
Private Equity and Debt Markets in the Financial Growth Cycle.” Journal of Banking & Finance 22: 613–
73.
Block, Jörn H. 2012. “R&D Investments in Family and Founder Firms: An Agency Perspective.” Journal
of Business Venturing 27 (2): 248–65.

40
Block, Jörn H., Massimo G. Colombo, Douglas J. Cumming, and Silvio Vismara. 2017. “New Players in
Entrepreneurial Finance and Why They are There.” Small Business Economics (forthcoming).
Booth, Laurence, Varouj Aivazian, Asli Demirgüç-Kunt, and Vojislav Maksimovic. 2001. “Capital
Structures in Developing Countries.” The Journal of Finance 56 (1): 87–130.
Bopkin, Godfred A. 2009. “Macroeconomic Development and Capital Structure Decisions of Firms:
Evidence from Emerging Market Economies.” Studies in Economics and Finance 26 (2): 129–142.
Bradley, Michael, Gregg A. Jarrell, and E Han Kim. 1984. “On the Existence of an Optimal Capital
Structure: Theory and Evidence.” The Journal of Finance. 39 (3): 857–78.
Camara, Omar. 2012. “Capital Structure Adjustment Speed and Macroeconomic Conditions: U.S
MNCs and DCs.” International Research Journal of Finance and Economics. 84: 106–20.
Canton, Erik, Isabel Grilo, Josefa Monteagudo, and Peter Van der Zwan. 2013. “Perceived Credit
Constraints in the European Union” Small Business Economics. 41: 701–15.
Carpenter, Robert E., and Bruce C. Petersen. 2002. “Is the Growth of Small Firms Constrained by
Internal Finance?” Review of Economics and Statistics 84 (2): 298–309.
Casey, Eddie, and Conor O’Toole. 2014. “Bank Lending Constraints, Trade Credit and Alternative
Financing during the Financial Crisis: Evidence from European SMEs.” Journal of Corporate Finance 27:
173–93.
Cassar, Gavin. 2004. “The Financing of Business Start-Ups.” Journal of Business Venturing 19 (2): 261–
83.
Chavis, Larry W., Leora F. Klapper, and Inessa Love. 2011. “The Impact of the Business Environment on
Young Firm Financing.” The World Bank Economic Review 25 (3): 486–507.
Chittenden, Francis, Graham Hall, and Patrick Hutchinson. 1996. “Small Firm Growth , Access to
Capital Markets and Financial Structure : Review of Issues and an Empirical Investigation.” Small
Business Economics 8 (1): 59–67.
Chong, Terence T.-L., Liping Lu, and Steven Ongena. 2013. “Does Banking Competition Alleviate or
Worsen Credit Constraints Faced by Small- and Medium-Sized Enterprises?” Journal of Banking &
Finance 37 (9): 3412–24.
Claessens, Stijn and Konstantinos Tziousmis. 2006. “Measuring Firms’ Access to Finance.” World Bank
available at:
http://siteresources.worldbank.org/FINANCIALSECTOR/Resources/ClaessensEtal_MeasuringFirmAccess.
pdf (accessed 10 October 2016).
Coad, Alex, and Rekha Rao. 2008. “Innovation and Firm Growth in High-Tech Sectors: A Quantile
Regression Apporoach.” Research Policy 37 (4): 633–48.
Coleman, Susan, and Alicia Robb. 2012. “Capital Structure Theory and New Technology Firms: Is There
a Match?” Management Research Review 35 (2): 106–20.
Cosh, Andy, Douglas Cumming, and Alan Hughes. 2009. “Outside Enterpreneurial Capital.” The
Economic Journal 119: 1494–1533.
Črnigoj, Matjaž and Dušan Mramor. 2009. “Determinants of Capital Structure in Emerging European
Economies: Evidence from Slovenian Firms.” Emerging Markets Finance and Trade 45 (1): 72–89.
Cull, Robert, Lance E. Davis, Naomi R. Lamoreaux, and Jean-Laurent Rosenthal. 2006. “Historical
Financing of Small- and Medium-Size Enterprises.” Journal of Banking & Finance 30 (11): 3017–42.
Daskalakis, Nikolaos, and Maria Psillaki. 2008. “Do Country or Firm Factors Explain Capital Structure?
Evidence from SMEs in France and Greece.” Applied Financial Economics 18 (2): 87–97.
41
Degryse, Hans, Peter de Goeij, and Peter Kappert. 2012. “The Impact of Firm and Industry
Characteristics on Small Firms’ Capital Structure.” Small Business Economics 38 (4): 431–47.
De Jong, Abe, Rezaul Kabir, and Thuy Thu Nyuyen. 2008. “Capital Structure around the World : The
Roles of Firm- and Country-Specific Determinants.” Journal of Banking & Finance 32: 1954–69.
Demirgüç-Kunt, Asli, and Ross Levine. 1999. “Bank-Based and Market- Based Financial Systems.” Policy
Research Working Paper 2143, available at: http://elibrary.worldbank.org/doi/abs/10.1596/1813-
9450-2143 (accessed 10 October 2016).
Demirgüç-Kunt, Asli, and Vojislav Maksimovic. 1999. “Institutions, Financial Markets, and Firm Debt
Maturity.” Journal of Financial Economics 54: 295–336.
———. 2001. “Firms as Financial Intermediaries: Evidence from Trade Credit Data.” Policy Research
Working Papers. doi:10.1596/1813-9450-2696.
Drakos, Konstantinos. 2012. “Bank Loan Terms and Conditions for Eurozone SMEs.” Small Business
Economics 41 (3): 717–32.
Duan, Hongbo, Abdul Razak bin Chik, and Chonjun Liu. 2012. “Institutional Environment and Capital
Structure: Evidence from Private Listed Enterprises in China.” International Journal of Finance Research 3
(1): 15–21.
Erramilli, M. Krishna, and Chatrathi P. Rao. 1993. “Sevice Firms’ International Entry-Mode Choice: A
Modified Transaction-Cost Analysis Approach.” The Journal of Marketing 57 (3): 19–38.
European Central Bank. 2016. “Survey on the Access to Finance of Enterprises. Methodological
Information on the Survey and User Guide for the Anonymised Micro Dataset”, available at:
https://www.ecb.europa.eu/stats/pdf/surveys/sme/methodological_information_survey_and_user_guide.
pdf (accessed 28 November 2016).
European Commission. 2005. “The New SME Definition.” Enterprise and Industry Publication, available
at: http://ec.europa.eu/growth/smes/business-friendly-environment/sme-definition/index_en.htm
(accessed 15 August 2016).
European Commission. 2015. “Survey on the Access to Finance of Enterprises (SAFE). Analytical Report
2015.”, available at: http://ec.europa.eu/growth/access-to-finance/data-surveys_en (accessed 5 August
2016).
European Commission. 2016. “Annual Report on European SMEs 2015/2016.”, available at:
http://ec.europa.eu/DocsRoom/documents/20264/attachments/1/translations/en/renditions/native
(accessed 28 January 2017).
Fan, Joseph P. H., Sheridan Titman, and Garry Twite. 2012. “An International Comparison of Capital
Structure and Debt Maturity Choices.” Journal of Financial and Quantitative Analysis 47 (1): 23–56.
Ferrando, Annalisa, and Nicolas Griesshaber. 2011. “Financing Obstacles among Euro Area Firms:
Who Suffers the Most?” ECB Working Paper Series No 1293, available at:
http://www.ecb.europa.eu/pub/pdf/scpwps/ecbwp1293.pdf (accessed 10 October 2016).
Ferrando, Annalisa, and Klaas Mulier. 2015. “Firms’ Financing Constraints: Do Perceptions Match the
Actual Situation?.” The Economic and Social Review 46 (1): 87–117.
Ferrando, Annalisa, Alexander A. Popov, and Gregory F. Udell. 2015. “Sovereign Stress,
Unconventional Monetary Policy, and SME Access to Finance.” ECB Working Paper Series No 1820,
available at:http://www.ecb.europa.eu/pub/pdf/scpwps/ecbwp1577.pdf (accessed 10 October 2016).
Florida, Richard L., and Martin Kenney. 1988. “Venture Capital, High-Technology and Regional
Development” Regional Studies 22 (1): 33–48.
http://www.ecb.europa.eu/pub/pdf/scpwps/ecbwp1577.pdf.
42
Frank, Murray Z., and Vidhan K. Goyal. 2009. “Which Factors Are Reliably Important?” Financial
Management 38 (1): 1–37.
Franke, Nikolaus, Marc Gruber, Dietmar Harhoff, and Joachim Henkel. 2008. “Venture Capitalists’
Evaluations of Start-up Teams: Trade-Offs, Knock-Out Criteria, and the Impact of VC Experience.”
Entrepreneurship Theory and Practice 32 (3): 459–483.
Freel, Mark S. 2006. “Are Small Innovators Credit Rationed?” Small Business Economics 28 (1): 23–35.
Freeman, John, Glenn R. Carroll, and Michael T. Hannan. 1983. “The Liability of Newness: Age
Dependence in Organizational Death Rates.” American Sociological Review 48 (5): 692–710.
Gajurel, Dinesh Prasad. 2006. “Macroeconomic Influences on Corporate Capital Structure.” available
at: http://dx.doi.org/10.2139/ssrn.899049 (accessed 1 February 2017).
Gibson, Heather D., Stephen G. Hall, and George S. Tavlas. 2012. “The Greek Financial Crisis:
Growing Imbalances and Sovereign Spreads.” Journal of International Money and Finance 31 (3): 498–
516.
Gompers, Paul A., and Joshua Lerner. 2004. The Venture Capital Cycle. 2nd ed. Cambridge: MIT
Press.
Graham, John R. 2000. “How Big Are the Tax Benefits of Debt?” The Journal of Finance 55 (5): 1901–
41.
———. 2003. “Taxes and Corporate Finance: A Review.” The Review of Financial Studies 16 (4):
1075–1129.
Grier, Paul, and Edward J. Zychowicz. 1994. “Institutional Investors, Corporate Discipline, and the Role
of Debt.” Journal of Economics and Business 46 (1): 1–11.
Guiso, Luigi, Tullio Jappelli, Mario Padula, and Marco Pagano. 2004. “Financial Market Integration
and Economic Growth in the EU.” Economic Policy 19 (40): 523–77.
Hair, Joseph F., William C. Black, Barry J. Babin, and Rolph E. Anderson. 2010. Multivariate Data
Analysis: A Global Perspective. 7th ed. New Jersey: Pearson Prentice Hall.
Hall, Bronwyn H. 2010. “The Financing of Innovative Firms.” Review of Economics and Institutions 1 (1):
1–30.
Hall, Bronwyn H., and Josh Lerner. 2010. “The Financing of R&D and Innovation.” Handbook of the
Economics of Innovation 1 (2010): 609–39.
Hall, Graham C., Patrick J. Hutchinson, and Nicos Michaelas. 2000. “Industry Effects on the
Determinants of Unquoted SMEs’ Capital Structure.” International Journal of the Economics of Business
7 (3): 297–312.
———. 2004. “Determinants of the Capital Structures of European SMEs.” Journal of Business Finance
& Accounting 31 (5-6): 711–28.
Hanousek, Jan, and Anastasiya Shamshur. 2011. “A Stubborn Persistence: Is the Stability of Leverage
Ratios Determined by the Stability of the Economy?” Journal of Corporate Finance 17 (5): 1360–76.
Harrison, Richard T., Colin M. Mason, and Paul Girling. 2004. “Financial Bootstrapping and Venture
Development in the Software Industry.” Entrepreneurship & Regional Development 16 (4): 307–33.
Hatzinikolaou, Dimitris, George M. Katsimbris, and Athanasios G. Noulas. 2002. “Inflation Uncertainty
and Capital Structure: Evidence from a Pooled Sample of the Dow-Jones Industrial Firms.” International
Review of Economics & Finance 11 (1): 45–55.

43
Hernández-Cánovas, Ginés, and Johanna Koëter-Kant. 2011. “SME Financing in Europe: Cross-
Country Determinants of Bank Loan Maturity.” International Small Business Journal 29 (5): 489–507.
Holmes, Scott, and Pam Kent. 1991. “An Empirical Analysis of the Financial Structure of Small and
Large Australian Manufacturing Enterprises An Empirical Analysis of the Financial.” Journal of
Entrepreneurial Finance 1 (2): 141–54.
Holton, Sarah, Martina Lawless, and Fergal McCann. 2014. “Firm Credit in the Euro Area: A Tale of
Three Crises.” Applied Economics 46 (2): 190–211.
Hutchinson, Robert W. 1995. “The Capital Structure and Investment Decisions of the Small Owner-
Managed Firm: Some Explanatory Issues.” Small Business Economics 7 (3): 231–39.
Huyghebaert, Nancy, and Linda M. Van de Gucht. 2007. “The Determinants of Financial Structure: New
Insights from Business Start-Ups.” European Financial Management 13 (1): 101–33.
Huyghebaert, Nancy, Linda M. Van de Gucht, and Cynthia Van Hulle. 2007. “The Choice between
Bank Debt and Trade Credit in Business Start-Ups.” Small Business Economics 29 (4): 435–52.
Jensen, Michael C., and William H. Meckling. 1976. “Theory of the Firm: Managerial Behavior, Agency
Costs and Ownership Structure.” Journal of Financial Economics 3 (4): 305–60.
Jiménez, Gabriel, and Jesus Saurina. 2004. “Collateral, Type of Lender and Relationship Banking as
Determinants of Credit Risk.” Journal Banking & Finance 28 (9): 2191–2212.
Jõeveer, Karin. 2012. “What Do We Know about the Capital Structure of Small Firms?” Small Business
Economics 41 (2): 479–501.
Jõeveer, Karin. 2013. “Firm, Country and Macroeconomic Determinants of Capital Structure: Evidence
from Transition Economies.” Journal of Comparative Economics 41 (1): 294–308.
Klapper, Leora F., Virginia Sarria-Allende, and Victor Sulla. 2002. “Small-and Medium-Size Enterprise
Financing in Eastern Europe.” World Bank Policy Research Working Paper No. 2933, available at:
http://elibrary.worldbank.org/doi/book/10.1596/1813-9450-2933 (accessed 10 October 2016).
Kraemer-Eis, Helmut, Lang, Frank, Torfs, Wouter, and Gvetadze, Salome. 2016. „European Small
Business Finance Outlook, December 2016.“ EIF Working Paper 2016/37, available at:
http://www.eif.org/news_centre/publications/eif_wp_37_esbfo_dec16_final.pdf (accessed 28 January
2017).
Kraemer-Eis, Helmut and Frank Lang. 2012. “The Importance of Leasing for SME Finance.” EIF Working
Paper 2012/15, available at:
http://www.eif.org/news_centre/research/eif_wp_2012_15_The%20importance%20of%20leasing%20fo
r%20SME%20finance_August_2102.pdf (accessed 28 January 2017).
La Porta, Rafael, Florencio Lopez-de-Silanes, Andrei Shleifer, and Robert W. Vishny. 1997. “Legal
Determinants of External Finance.” Journal of Finance 52 (3): 1131–50.
Lawless, Martina, Brian O’Connell, and Conor O’Toole. 2015. “Financial Structure and Diversification
of European Firms.” Applied Economics 47 (23): 2379–98.
Levine, Ross. 2002. “Bank-Based or Market-Based Financial Systems: Which Is Better?” Journal of
Financial Intermediation 11 (2): 398–428.
López-Gracia, José, and Francisco Sogorb-Mira. 2008. “Testing Trade-off and Pecking Order Theories
Financing SMEs.” Small Business Economics 31 (2): 117–36.
Love, Inessa, Lorenzo A. Preve, and Virginia Sarria-Allende. 2007. “Trade Credit and Bank Credit:
Evidence from Recent Financial Crises.” Journal of Financial Economics 83 (2): 453–469.

44
Mac an Bhaird, Ciarán, and Brian Lucey. 2010. “Determinants of Capital Structure in Irish SMEs.” Small
Business Economics 35: 357–75.
Marotta, Giuseppe. 2005. “When Do Trade Credit Discounts Matter? Evidence from Italian Firm-Level
Data.” Applied Economics 37 (4): 403–16.
Michaelas, Nicos, Francis Chittenden, and Panikkos Poutziouris. 1999. “Financial Policy and Capital
Structure Choice in UK SMEs: Empirical Evidence from Company Panel Data.” Small Business
Economics 12 (2): 113–30.
Miller, Merton H. 1977. “Debt and Taxes.” The Journal of Finance 32 (2): 261–275.
Mina, Andrea, Henry Lahr, and Alan Hughes. 2013. “The Demand and Supply of External Finance for
Innovative Firms.” Industrial and Corporate Change 22 (4): 869–901.
Modigliani, Franco and Merton H. Miller. 1958. “The Cost of Capital, Corporation Finance and the
Theory of Investment.” The American Economic Review 48 (3): 261–297.
Mojena, Richard. 1977. “Hierarchical Grouping Methods and Stopping Rules: An Evaluation.” The
Computer Journal 20 (4): 359–63.
Mokhova, Natalia, and Marek Zinecker. 2014. “Macroeconomic Factors and Corporate Capital
Structure.” Procedia-Social and Behavioral Sciences 110 (2014): 530–40.
Moritz, Alexandra. 2015. “Financing of Small and Medium-Sized Enterprises in Europe – Financing
Patterns and ‘Crowdfunding’, Dissertation, available at: http://ubt.opus.hbz-
nrw.de/frontdoor.php?source_opus=945 (accessed 10 October 2016).
Moritz, Alexandra, Joern H. Block, and Andreas Heinz. 2015. “Financing Patterns of European SMEs:
An Empirical Taxonomy.” EIF Working Paper 2015/30, available at:
http://www.eif.org/news_centre/publications/Financing%20patterns%20of%20European%20SMEs%20-
%20EIF%20working%20paper%202015-30.pdf (accessed 28 January 2017).
Moritz, Alexandra, Joern H. Block, and Andreas Heinz. 2016. “Financing Patterns of European SMEs -
an Empirical Taxonomy.” Venture Capital 18 (2): 115–148.
Murray, Gordon C., and Jonathan Lott. 1995. “Have UK Venture Capitalists a Bias Against Investment
in New Technology-Based Firms?” Research Policy 24 (2): 283–99.
Myers, Stewart C. 1977. “Determinants of Corporate Borrowing.” Journal of Financial Economics 5 (2):
147–75.
Myers, Stewart C. 1984. “The Capital Structure Puzzle.” The Journal of Finance 39 (3): 575–592.
Myers, Stewart C., and Nicholas S. Majluf. 1984. “Corporate Financing and Investment Decisions when
Firms Have Information that Investors Do Not Have.” Journal of Financial Economics 13 (2): 187–221.
Nyasha, Sheilla, and Nicholas M. Odhiambo. 2014. “Bank-Based Financial Development and
Economic Growth: A Review of International Literature.” Journal of Financial Economic Policy 6 (2):
112–32.
O’Higgins, Niall. 2012. “This Time It’s Different? Youth Labour Markets During ‘The Great Recession’.”
Comparative Economic Studies 54 (2): 395–412.
Özari, Çigdem, Ülgen Köse, and Veysel Ulusoy. 2013. “Cluster Analysis: Is Turkey Far From European
Union Members in Economic Perspective?” International Journal of Economics and Finance 5 (12):
127–34.
Öztekin, Özde. 2015. “Capital Structure Decisions Around the World: Which Factors are Reliably
Important?” Journal of Financial and Quantitative Analysis 50 (3): 301–23.

45
Öztürk, Bahar, and Mico Mrkaic. 2014. “SMEs’ Access to Finance in the Euro Area: What Helps or
Hampers?” IMF Working Papers 14/78, available at:
http://www.imf.org/external/pubs/ft/wp/2014/wp1478.pdf (accessed 28 November 2016).
Petersen, Mitchell A., and Raghuram G. Rajan. 1997. “Trade Credit: Theories and Evidence.” Review of
Financial Studies 10 (3): 661–91.
Popov, Alexander, and Gregory F. Udell. 2012. “Cross-Border Banking, Credit Access, and the
Financial Crisis.” Journal of International Economics 87 (1): 147–161.
Psillaki, Maria, and Nikolaos Daskalakis. 2009. “Are the Determinants of Capital Structure Country or
Firm Specific?” Small Business Economics 33 (3): 319–33.
Rajan, Raghuram G., and Luigi Zingales. 1995. “What Do We Know about Capital Structure? Some
Evidence from International Data.” The Journal of Finance 50 (5): 1421–60.
Robb, Alicia M. 2002. “Small Business Financing: Differences between Young and Old Firms.” Journal
of Entrepreneurial Finance 7 (2): 45–64.
Rogers, Steven. 2014. Entrepreneurial Finance: Finance and Business Strategies for the Serious
Entrepreneur. 3rd ed. US: McGraw-Hill Education.
Romano, Claudio A., George A. Tanewski, and Kosmas X. Smyrnios. 2001. “Capital Structure Decision
Making: A Model for Family Business.” Journal of Business Venturing 16 (3): 285–310.
Ryan, Robert M., Conor M. O’Toole and Fergal McCann. 2014. “Does Bank Market Power Affect SME
Financing Constraints?” Journal of Banking & Finance 49: 495–505.
Sett, Kiranjit, and Jaydeb Sarkhel. 2010. “Macroeconomic Variables, Financial Sector Development and
Capital Structure of Indian Private Corporate Sector during the Period 1981–2007.” The IUP Journal of
Applied Finance 16 (1): 40–56.
Singh, Jitendra V., David J. Tucker, and Robert J. House. 1986. “Organizational Legitimacy and the
Liability of Newness” Administrative Science Quarterly 31 (2): 171–93.
Sogorb-Mira, Francisco. 2005. “How SME Uniqueness Affects Capital Structure: Evidence from a 1994-
1998 Spanish Data Panel.” Small Business Economics 25: 447–57.
Tanveer, Choudhry, Misbah E. Marelli, and Marcello Signorelli. 2012. “Youth Unemployment Rate and
Impact of Financial Crisis.” International Journal of Manpower 33 (1): 76–95.
Watson, Robert and Nick Wilson. 2002. “Small and Medium Size Enterprise Financing: A Note on Some
of the Empirical Implications of a Pecking Order.” Journal of Business Finance & Accounting 29 (3-4):
557–578.
Wu, Liansheng and Heng Yue. 2009. “Corporate Tax, Capital Structure, and the Accessibility of Bank
Loans: Evidence from China.” Journal of Banking & Finance 33 (1): 30–38.
Zhou, Haibo, Philipp G. Sandner, Simon L. Martinelli, and Joern H. Block. 2016. “Patents, Trademarks,
and Their Complementarity in Venture Capital Funding.” Technovation 47: 14–22.

46
ANNEX
Annex 1: Number of SMEs in the SAFE survey by country
Country Number of
SMEs
in percent
Austria AT 185 1.4
Belgium BE 329 2.5
Bulgaria BG 182 1.4
Cyprus CY 27 0.2
Czech
Republic
CZ 575 4.4
Germany DE 1,275 9.7
Denmark DK 123 0.9
Estonia EE 36 0.3
Spain ES 1,367 10.4
Finland FI 135 1.0
France FR 1,743 13.3
Greece GR 406 3.1
Croatia HR 85 0.6
Hungary HU 289 2.2
Ireland IE 88 0.7
Italy IT 2,197 16.8
Lithuania LT 88 0.7
Luxembourg LU 18 0.1
Latvia LV 56 0.4
Netherlands NL 598 4.6
Poland PL 864 6.6
Portugal PT 452 3.5
Romania RO 253 1.9
Sweden SE 386 2.9
Slovenia SI 74 0.6
Slovakia SK 228 1.7
United
Kingdom
UK 1,038 7.9
Total 13,098 100
Source: SAFE 2015H1
47
Annex 2: List of abbreviations
Countries
AT Austria ES Spain LT Lithuania RO Romania
BE Belgium FI Finland LU Luxembourg SE Sweden
BG Bulgaria FR France LV Latvia SI Slovenia
CY Cyprus GR Greece MT Malta SK Slovakia
CZ Czech Republic HR Croatia NL The Netherlands UK United Kingdom
DE Germany HU Hungary NO Norway
DK Denmark IE Ireland PL Poland
EE Estonia IT Italy PT Portugal
Other abbreviations
BA: Business Angel
BLS: Business Longitudinal Survey
DK/NA: Don’t know / no answer
DSGV: Deutscher Sparkassen- und Giroverband
EC: European Commission
ECB: European Central Bank
EIB: European Investment Bank
EIF: European Investment Fund
ENSR: European Network for SME Research
EU: European Union
EUR: Euro
FGF: Förderkreis Gründungs-Forschung
GDP: Gross Domestic Product
H1: first half-year
IFC: International Finance Corporation
JEL: Journal of Economic Literature
m: million
NACE: Nomenclature statistique des activités économiques dans la Communauté européenne
OECD: Organisation for Economic Co-operation and Development
RBI: Reserve Bank of India
RMA: Research & Market Analysis
SABI: Sistema de Análisis de Balances Ibéricos
SAFE: Survey on the access to finance of enterprises
SME: Small and medium-sized enterprise
STAREBEI: Stages de Recherche BEI - EIB research internships
UNSD: United Nations Statistics Division
US: United States
VC: Venture capital
WBES: World Business Environment Survey
48
About …
… the European Investment Fund
The European Investment Fund (EIF) is Europe’s leading risk finance provider for small and
medium sized enterprises (SMEs) and mid-caps, with a central mission to facilitate their access to
finance. As part of the European Investment Bank (EIB) Group, EIF designs, promotes and
implements equity and debt financial instruments which specifically target the needs of these
market segments.
In this role, EIF fosters EU objectives in support of innovation, research and development,
entrepreneurship, growth, and employment. EIF manages resources on behalf of the EIB, the
European Commission, national and regional authorities and other third parties. EIF support to
enterprises is provided through a wide range of selected financial intermediaries across Europe.
Since its inception in 1994, EIF has supported over 1.8 million SMEs. EIF is a public-private
partnership whose tripartite shareholding structure includes the EIB, the European Union
represented by the European Commission and various public and private financial institutions from
European Union Member States and Turkey. For further information, please visit www.eif.org.
… EIF’s Research & Market Analysis
Research & Market Analysis (RMA) supports EIF’s strategic decision-making, product development
and mandate management processes through applied research and market analyses. RMA works
as internal advisor, participates in international fora and maintains liaison with many organisations
and institutions.
… this Working Paper series
The EIF Working Papers are designed to make available to a wider readership selected topics and
studies in relation to EIF´s business. The Working Papers are edited by EIF´s Research & Market
Analysis and are typically authored or co-authored by EIF staff. The Working Papers are usually
available only in English and distributed only in electronic form (pdf).

49
EIF Working Papers
2009/001 Microfinance in Europe – A market overview.
November 2009.
2009/002 Financing Technology Transfer.
December 2009.
2010/003 Private Equity Market in Europe – Rise of a new cycle or tail of the recession?
February 2010.
2010/004 Private Equity and Venture Capital Indicators – A research of EU27 Private Equity and
Venture Capital Markets.
April 2010.
2010/005 Private Equity Market Outlook.
May 2010.
2010/006 Drivers of Private Equity Investment activity. Are Buyout and Venture investors really so
different?
August 2010.
2010/007 SME Loan Securitisation – an important tool to support European SME lending.
October 2010.
2010/008 Impact of Legislation on Credit Risk – How different are the U.K. and Germany?
November 2010.
2011/009 The performance and prospects of European Venture Capital.
May 2011.
2011/010 European Small Business Finance Outlook.
June 2011.
2011/011 Business Angels in Germany. EIF’s initiative to support the non-institutional financing market.
November 2011.
2011/012 European Small Business Finance Outlook 2/2011.
December 2011.
2012/013 Progress for microfinance in Europe.
January 2012.
2012/014 European Small Business Finance Outlook.
May 2012.
2012/015 The importance of leasing for SME finance.
August 2012.
2012/016 European Small Business Finance Outlook.
December 2012.
2013/017 Forecasting distress in European SME portfolios.
May 2013.
2013/018 European Small Business Finance Outlook.
June 2013.
2013/019 SME loan securitisation 2.0 – Market assessment and policy options.
October 2013.
2013/020 European Small Business Finance Outlook.
December 2013.

50
2014/021 Financing the mobility of students in European higher education.
January 2014.
2014/022 Guidelines for SME Access to Finance Market Assessments.
April 2014.
2014/023 Pricing Default Risk: the Good, the Bad, and the Anomaly.
June 2014.
2014/024 European Small Business Finance Outlook.
June 2014.
2014/025 Institutional non-bank lending and the role of debt funds.
October 2014.
2014/026 European Small Business Finance Outlook.
December 2014.
2015/027 Bridging the university funding gap: determinants and consequences of university seed funds
and proof-of-concept Programs in Europe.
May 2015.
2015/028 European Small Business Finance Outlook.
June 2015.
2015/029 The Economic Impact of EU Guarantees on Credit to SMEs - Evidence from CESEE
Countries.
July 2015.
2015/030 Financing patterns of European SMEs: An Empirical Taxonomy
November 2015
2015/031 SME Securitisation – at a crossroads?
December 2015.
2015/032 European Small Business Finance Outlook.
December 2015.
2016/033 Evaluating the impact of European microfinance. The foundations.
January 2016.
2016/034 The European Venture Capital Landscape: an EIF perspective. Volume I: the impact of EIF
on the VC ecosystem.
May 2016.
2016/035 European Small Business Finance Outlook.
June 2016.
2016/036 The role of cooperative banks and smaller institutions for the financing of SMEs and small
midcaps in Europe.
July 2016.
2016/037 European Small Business Finance Outlook.
December 2016.
2016/038 The European Venture Capital Landscape: an EIF perspective. Volume II: Growth patterns of
EIF-backed startups.
December 2016.
2017/039 Guaranteeing Social Enterprises – The EaSI way.
February 2017.
2017/040 Financing Patterns of European SMEs revisited: An Updated Empirical Taxonomy and
Determinants of SME Financing Clusters.
March 2017.

51
i