financial turnaround plan - harvey nash – global ... turnaround plan; and – review and revise...
TRANSCRIPT

Financial Turnaround Plan
2014-2016
Executive Summary
1
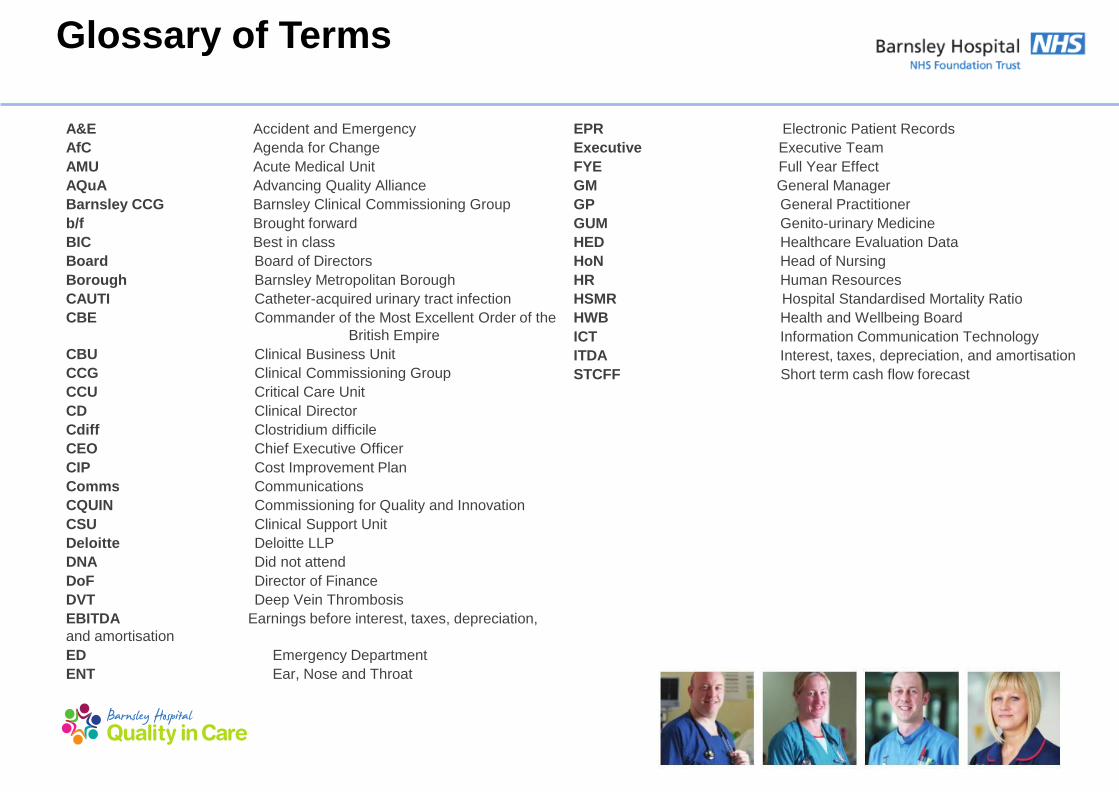
Glossary of Terms
A&E Accident and Emergency
AfC Agenda for Change
AMU Acute Medical Unit
AQuA Advancing Quality Alliance
Barnsley CCG Barnsley Clinical Commissioning Group
b/f Brought forward
BIC Best in class
Board Board of Directors
Borough Barnsley Metropolitan Borough
CAUTI Catheter-acquired urinary tract infection
CBE Commander of the Most Excellent Order of the
British Empire
CBU Clinical Business Unit
CCG Clinical Commissioning Group
CCU Critical Care Unit
CD Clinical Director
Cdiff Clostridium difficile
CEO Chief Executive Officer
CIP Cost Improvement Plan
Comms Communications
CQUIN Commissioning for Quality and Innovation
CSU Clinical Support Unit
Deloitte Deloitte LLP
DNA Did not attend
DoF Director of Finance
DVT Deep Vein Thrombosis
EBITDA Earnings before interest, taxes, depreciation,
and amortisation
ED Emergency Department
ENT Ear, Nose and Throat
EPR Electronic Patient Records
Executive Executive Team
FYE Full Year Effect
GM General Manager
GP General Practitioner
GUM Genito-urinary Medicine
HED Healthcare Evaluation Data
HoN Head of Nursing
HR Human Resources
HSMR Hospital Standardised Mortality Ratio
HWB Health and Wellbeing Board
ICT Information Communication Technology
ITDA Interest, taxes, depreciation, and amortisation
STCFF Short term cash flow forecast

2
Background and Overview
• In 2013/14 the Trust faced a year with challenging financial expectations, coupled with robust performance and quality targets, whilst at the same
time, forecasting an increase in the number of people who would attend the Emergency Department (ED).
• The challenging environment was compounded by a financial irregularity that was identified just prior to the 2013/14 year end.
• In March 2014, the Trust declared a serious incident into financial irregularities, commenced internal and external investigations into how finances
had been managed and submitted appropriate reports to Monitor.
• During the investigation it became evident that the in-year, monthly accounts have been misstated. The necessary corrections to the accounts
were made, which led to a significant adverse movement in the previously reported financial position. The Trust‟s performance showed an
„operating‟ deficit of £7.4 million. |Due to the changes in the Trust‟s properties in 2013/14, the value of the properties has declined, resulting in an
increase to the deficit of £2.5 million. The final reported deficit for the year is £9.9 million.
• In addition to this, the Trust also found it challenging to consistently meet the A&E target to see and treat 95% of all patients within 4 hours and
failed to do so during three quarters of 2013/14.
• Monitor formally opened their own investigations into Trust‟s financial position, its performance against the 4 hour wait target and into governance
arrangements in April 2014.
• In May 2014, Monitor confirmed the Trust was found to be in breach of its licence as a foundation trust and as such, requested a submission of a
robust two-year Turnaround Plan, detailing the actions the Trust will to take to turn its position around.
• Since March 2014, the Trust has taken significant steps to improve its position. These include:
– redress the A&E 4 hour breach, which has now been achieved;
– instigate robust internal and external investigations to identify how the deficit position arose, implement cost savings and develop a robust two-
year Turnaround Plan; and
– review and revise the governance structure, mindful of the issues above subject to external support.
• This plan sets out the Trust‟s current position and how it intends to turn the financial position around, whilst ensuring it maintains high standards of
quality.

3
Background and Overview The Trust and its demographics
• Barnsley Hospital NHS Foundation Trust provides acute hospital
services, including emergency and intensive care, medical and
surgical, elderly care, paediatric and maternity, along with
diagnostic and clinical support.
• The Trust also provides a number of specialised services, such as
cancer and surgical services in partnership with Sheffield
Teaching Hospitals NHS Foundation Trust.
• The Hospital was built in the 1970s and is a single site covering of
approximately 8.2 hectares, with circa 381 beds, 3,272
employees, and an annual income in the region of £165 million.
• During 2013/14, the Trust cared for 426,950 patients (418,712 in
2012/13), saw 216,771 clinic appointments (211,467 in 2012/13)
and treated 79,681 patients in the Emergency Department
(79,953 in 2012/13).
• The Trust serves a local population of approximately 234,400,
which is dispersed across an area matching the same
geographical boundaries as Barnsley Metropolitan Borough
Council and the Trust‟s main commissioner, Barnsley Clinical
Commissioning Group.
• The resident population distribution of Barnsley‟s 234,400 people
is similar to that seen nationally, except for a slightly lower
proportion of young people aged 25 to 39.
• In total 19% of the population is aged under 16, with 17% aged 65
or over. In 2011, there were 2,991 live births in Barnsley and
2,274 deaths.
• The total population of Barnsley is projected to rise by 7.2% by
2021.
• The number of over 65s in the Barnsley population is forecast to
increase to a projected 47,947 people by 2020.
• Overall health in Barnsley, although improving, is worse than the
average for England. Life expectancy at birth is 77.4 years for
men and 80.9 years for women, compared to 78.9 years and
82.9 years nationally.
• Death rates from the three main killers - cardiovascular disease
(heart disease and stroke), cancer and respiratory disease have
fallen over the last 10 years but still remain significantly higher
than the average for England.
• Cancer, particularly lung cancer, is the main cause of premature
death in Barnsley.
• The proportion of Barnsley residents living with a limiting long-
term illness is 24.4%. This is significantly higher when
compared to the average for England of 16.9%.

4
Background and Overview Trust and its demographics (continued)
• Barnsley is ranked as the 47th most deprived Borough of 326
English Boroughs, with 32% of the population living in the most
deprived quartile in the country.
• The deprivation is concentrated in the east of the Borough, with
23.8% of children in Barnsley currently living in poverty.
• 20.3% of working population in Barnsley are currently receiving
out of work benefits. This is the highest in South Yorkshire and
significantly higher than the national rate of 13.1%.
• Overall, there are substantial and persistent inequalities in the
health needs and outcomes of local people when compared to
the rest of the country.
Index of multiple deprivation 2010 in Barnsley
LSOAs ranked relative to England

5
Background and Overview Strategic context and the local health economy
• As part of the Trust‟s wider strategy, the Board has recently reviewed the Trust‟s vision and aims to ensure they are fit for purpose and
confirmed that the Trust‟s vision is “To be the best, integrated healthcare organisation of choice for our local communities and beyond”.
• The Trust recognises that as a small-medium sized district general hospital there is an increasing need to work in partnership with others
to improve pathways of care for patients.
• Accordingly, going forward the Trust intends to work closely with Barnsley Clinical Commissioning Group (CCG), whose key goals for
2014/15 include:
– reduce emergency hospital activity by 15% over five years by driving care closer to home;
– increase capacity and access to primary care and community services;
– improve the support to individuals to manage their own long term conditions in a community setting, through improved care co-
ordination; and
– radically redesign intermediate care facilities in Barnsley.
• The Trust will also continue to work with local partners, as a member of the Health and Wellbeing Board, on the key priorities of the
health and wellbeing strategy.
• Further supporting the approach to partnership working, the trust, together with Barnsley CCG, local authority and South West Yorkshire
Partnership NHS Foundation Trust were successful in 2013 in securing pioneer status for health and social care in Barnsley; this work is
entitled “Stronger Barnsley Together”.
• The Trust is fully committed and actively participating in the Working Together Programme, which is a collaboration with seven other
acute providers in South and Mid Yorkshire, and North Derbyshire.

6
Background and Overview Introduction to current position
Income and expenditure
2012/13 2013/14 2013/14 Variance Plan
£'million Actual Plan Actual to Actual
Income
Clinical income 145.3 144.1 147.2 3.1
Other income 22.3 21.0 22.5 1.5
Total income 167.6 165.1 169.7 4.6
Operating Expenses
Pay cost (111.6) (110.6) (115.8) (5.2)
Non pay cost (46.5) (43.4) (52.8) (9.4)
Total operating expenses (158.1) (154.0) (168.6) (14.6)
EBITDA 9.5 11.1 1.1 (10.0)
ITDA (8.1) (9.5) (8.5) 1.0
Total operating expenses (166.2) (163.5) (177.1) (13.6)
Net surplus/(deficit) pre-impairment 1.4 1.6 (7.4) (9.0)
Impairment - - (2.5) (2.5)
Net surplus/(deficit) post-impairment 1.4 1.6 (9.9) (11.5)
• Historically, the Trust has achieved its financial targets, reporting
a small surplus of £1.4 million in 2012/13. However, this was
achieved with non-recurrent funding from Barnsley PCT of circa
£6.4 million.
• Although the Trust‟s 2013/14 management accounts presented
operational deficits throughout the year, due to various
amendments (some of which were unsupported), small
surpluses were reported to the Board until February 2014.
• Following the identification of the financial reporting issues and
irregularities, the Trust completed an internal review to consider
the impact of these issues on its short-term cash flow, and to
determine the underlying financial position of the Trust is
2013/14 and 2014/15.
• The Trust has historically underperformed on its Cost
Improvement Programme (CIP) targets, in 2013/14 only
achieving £1.9 million of the initial £6.2 million CIP targeted.
• The Trust had an operating deficit of £7.4m for 2013/14.
However, due to changes to the Trust‟s properties in 2013/14,
the value of the properties has declined, resulting in an increase
to the deficit of £2.5m. The final reported deficit for the year is
£9.9m.
• Furthermore, the Trust breached the national A&E target in five
of the previous six quarters, which in conjunction with the
financial deficit led to the involvement of Monitor.

7
Background and Overview Clinical services
• Acute Paediatrics
• Anaesthetics/Critical Care
• Cardio Respiratory
• Care of the Elderly
• Emergency Medicine –
ED/AMU
• General Medicine
• General Surgery: Elective
Breast, Upper GI, Lower GI
• General Surgery: Elective
Urology, Vascular
• GUM
• Head and Neck: ENT,
Ophthalmology, Oral Surgery,
OMFS
• Obstetrics/Gynaecology
• Paediatrics
• Pathology
• Pharmacy
• Radiology
• Speciality Medicine:
Dermatology, Rheumatology,
Clinical Haematology
• Therapies: Physiotherapy,
OT, Dietetics, Speech &
Language
• Trauma and orthopaedics
The future
positioning of
these services
will be
determined by
health policy,
the Trust‟s
clinical strategy
and competition,
and will be
subject to a
sustainability
review.
The services currently provided by the Trust are detailed below.
8
Background and Overview Next Steps
Next steps
• The Trust understands that this document is part of a wider, long-term plan and has therefore developed “next steps” to ensure delivery
of the plan.
• These steps will focus on four key areas; high level details of which are outlined below and on the next page:
– Turnaround Plan;
– Governance;
– The Emergency Care Action Plan including input from ECIST; and
– The Clinical Service Sustainability Review and 5-year strategy.
• The Trust has developed detailed step plans for each of these areas.
• The progress of the plan will be monitored and reported to Board along with monthly meetings with Monitor.
5-year strategy
• In relation to the service review mentioned above, the Trust is currently agreeing the scope and timeline. The Trust anticipates that work
is likely to commence in August 2014, once the scope is agreed.
• The Trust will work with clinical teams and support departments to ensure they are profitable and sustainable, with an interim report due
in Quarter 3 2014.
• Options will be developed by service including working with others to provide services to ensure that patient needs continue to be met.
External engagement will be key to this and plans will be developed in line with commissioning intentions.
• The 5-year strategic plan is expected to be completed by December 2014.

9
Background and Overview Milestones
The Trust has identified key categories and milestones which must be achieved over the next two years in order to successfully deliver the Turnaround
Plan.
- Key milestone
The
turnaround
plan
Subject to Bob’s changes
Timeline
Key milestones
2014/15 2015/16
Q1 Q2 Q3 Q4 Q1 Q2 Q3 Q4
Turnaround Plan
Plan approved by Board and sent to Monitor
Monitor visits to review progress
Key financial milestones
Key CIP milestones
Governance review
Deloitte’s Capability and Governance Review
Recommendations and Action Plan
Project Dearne findings and recommendations
Project Allerton 6 month follow up review
CBU structure fully in place
4 hour action plan
ECIST visits and recommendations
Updated action plan to Monitor
Monitor visits to review progress
Strategy
Agree scope for sustainability review
Benchmarking at a service level
CBU challenge sessions/workshops
Interim Report to be issued
Agree options, understand impacts and risks
External engagement
Submit 5 year plan to Monitor
Delivery of 5 year plan

Baseline Financials

11
Baseline Financials
Financials
• The Trust‟s „Run Rate‟ (an estimate of future financial performance assuming present trends continue without the benefit of deferred or
one off income) at the end of 2013/14 is approximately £16.6 million deficit.
• This run rate is immediately worsened at the start of 2014/15 by a reduction in the national rates at which we are paid to provide our
services, together with inflation to staff salaries and staff rising up pay increments. This gives an effective opening run rate for 2014/15 of
a deficit of £20.7m.
• Through delivery of this Turnaround Plan we aim to close 2015/16 with a run rate deficit of £2.8m.
Staffing
• The Trust budgeted for 2,727.9 Whole Time Equivalents (WTE) as at March 2014 (WTE is a calculation of the staff resource available,
taking into account full and part-time working). The total WTE was 2,821.1 (93.2 over the budget). The main reason for this difference is
primarily the need to support the delivery of non-recurring income and projects.
• The total WTE is made up of 2,578.1 contracted positions, 171.2 bank and overtime positions and 72.1 agency staff positions.

12
Baseline Financials: Income and expenditure
Income and Expenditure
£’million 2013/14
Baseline/
Run Rate
Income
Clinical income 147.2 143.5
Other income 22.5 15.7
Total income 169.7 159.2
Operating Expenses
Pay cost (115.8) (116.2)
Non pay cost (52.8) (50.9)
Total operating expenses (168.6) (167.1)
EBITDA 1.1 (7.9)
Depreciation and amortisation (6.3) (6.7)
Restructuring costs (0.2) -
Interest (0.1) (0.1)
PDC Dividend (1.9) (1.9)
ITDA (8.5) (8.7)
Total operating expenses (177.1) (175.8)
Net deficit pre-impairment (7.4) (16.6)
Impairment (2.5) -
Net deficit post-impairment (9.9) (16.6)
Overview
• In Q4 2013/14, the Trust operated at an underlying Run Rate deficit of £16.6 million. The actual position at the end of 2013/14
was an operating deficit of £7.4m, with a final reported deficit of £9.9m (with the impact of changes to the Trust‟s properties
taken into account).
• The main reasons for the difference between the Run Rate and the actual position are non-recurrent incomes, release of
deferred income (with no directly associated costs), release of provisions (money put aside to cover a future liability), and
higher operating expenses towards the end of the year.

13
Baseline Financials: Assumptions
Area/2013/14
value 2013/14 actual
Baseline
adjustment Baseline assumption
Clinical
income
£147.2
million
• Clinical income includes all patient related
activity and constituted 87% of total income
in 2013/14, of which 85% (£124.8 million)
was received from Barnsley CCG. The
remaining clinical income sources are:
– other CCGs – £10.5 million; and
– other trusts and organisations – £11.9
million.
• Barnsley CCG income includes an element
of non-recurrent income for service
improvement and efficiency projects.
• Furthermore, the CCG income includes
CQUIN income which is conditional based
on specific target achievements. The
amount available is 2.4% of the value of our
contract with the CCG.
• £3.7
million
• During 2013/14, we received £4.7 million as non-recurrent
income. Of this total, £3.7 million was included within
clinical income from Barnsley CCG (and therefore does
not form part of the baseline) and £0.9 million was
included in other income (as adjusted below). The
remaining balance was properly deferred into 2014/15.
• The Trust has historically achieved approximately 80% -
85% of CQUIN, with the current estimate of 84% for
2013/14. There have therefore been no CQUIN related
adjustments.
The following table outlines the assumptions we have made in establishing our baseline finances for 2014/15.
14
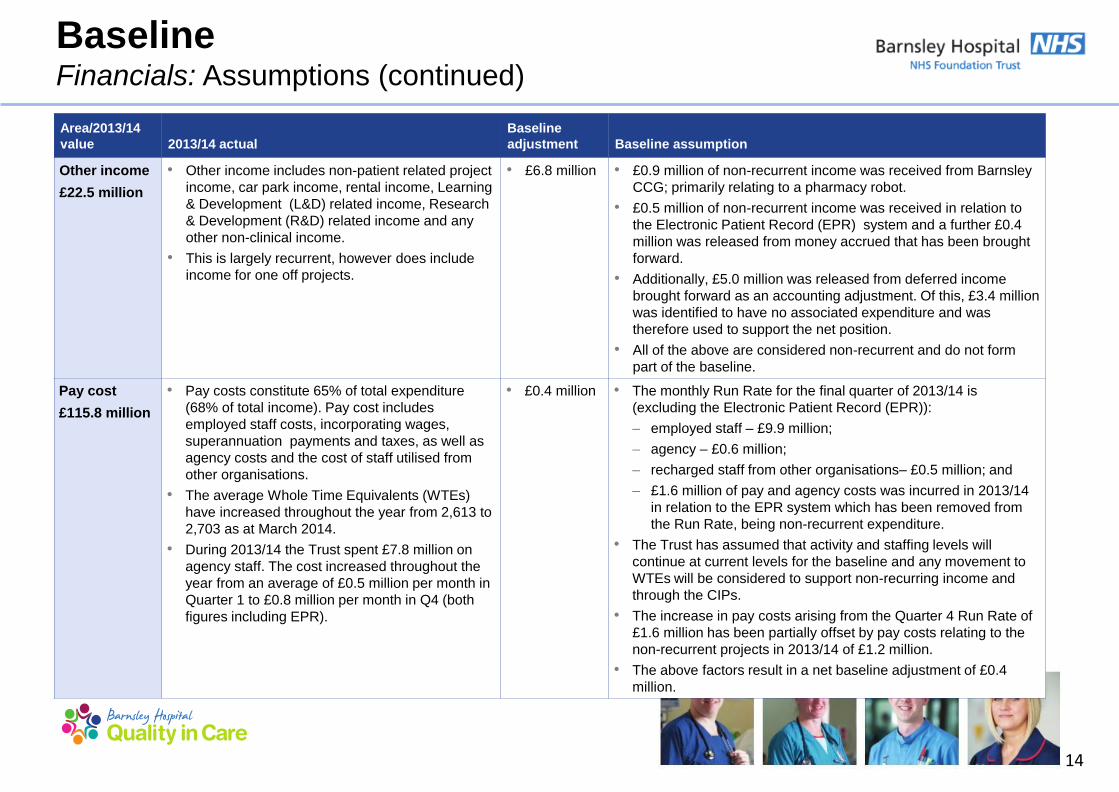
Baseline Financials: Assumptions (continued)
Area/2013/14
value 2013/14 actual
Baseline
adjustment Baseline assumption
Other income
£22.5 million
• Other income includes non-patient related project
income, car park income, rental income, Learning
& Development (L&D) related income, Research
& Development (R&D) related income and any
other non-clinical income.
• This is largely recurrent, however does include
income for one off projects.
• £6.8 million • £0.9 million of non-recurrent income was received from Barnsley
CCG; primarily relating to a pharmacy robot.
• £0.5 million of non-recurrent income was received in relation to
the Electronic Patient Record (EPR) system and a further £0.4
million was released from money accrued that has been brought
forward.
• Additionally, £5.0 million was released from deferred income
brought forward as an accounting adjustment. Of this, £3.4 million
was identified to have no associated expenditure and was
therefore used to support the net position.
• All of the above are considered non-recurrent and do not form
part of the baseline.
Pay cost
£115.8 million
• Pay costs constitute 65% of total expenditure
(68% of total income). Pay cost includes
employed staff costs, incorporating wages,
superannuation payments and taxes, as well as
agency costs and the cost of staff utilised from
other organisations.
• The average Whole Time Equivalents (WTEs)
have increased throughout the year from 2,613 to
2,703 as at March 2014.
• During 2013/14 the Trust spent £7.8 million on
agency staff. The cost increased throughout the
year from an average of £0.5 million per month in
Quarter 1 to £0.8 million per month in Q4 (both
figures including EPR).
• £0.4 million • The monthly Run Rate for the final quarter of 2013/14 is
(excluding the Electronic Patient Record (EPR)):
– employed staff – £9.9 million;
– agency – £0.6 million;
– recharged staff from other organisations– £0.5 million; and
– £1.6 million of pay and agency costs was incurred in 2013/14
in relation to the EPR system which has been removed from
the Run Rate, being non-recurrent expenditure.
• The Trust has assumed that activity and staffing levels will
continue at current levels for the baseline and any movement to
WTEs will be considered to support non-recurring income and
through the CIPs.
• The increase in pay costs arising from the Quarter 4 Run Rate of
£1.6 million has been partially offset by pay costs relating to the
non-recurrent projects in 2013/14 of £1.2 million.
• The above factors result in a net baseline adjustment of £0.4
million.

15
Baseline Financials: Assumptions (continued)
Area/2013/14
value 2013/14 actual
Baseline
adjustment Baseline assumption
Non-pay cost
£52.8 million
• Non-pay costs includes all other operating
expenditure.
• In 2013/14, non-pay cost accounted for 30% of
total expenditure (31% of total income).
• The most significant elements of 2013/14 non-
pay costs included:
– medical consumables – £14.3 million;
– drugs – £11.3 million; and
– other consumables – £10.1 million.
• £1.9 million • In relation to the £5.0 million of deferred income released in the
year the Trust incurred associated expenditure of £1.6 million.
This was considered non-recurrent expenditure.
• Furthermore, non-recurrent entries totalling £0.8 million,
primarily relating to one off costs and accounting adjustments,
were incurred in 2013/14.
• The reduction in cost is partially off set by cost pressures of
£0.7 million, resulting from higher expenditure towards the end
of the year.
• The above three adjustments results in a net £1.7 million
decrease on 2013/14 non-pay costs. This results in a 2013/14
baseline of £51.1 million.
ITDA
£8.6 million
• ITDA (Interest, Taxes, Depreciation and
Amortization) largely comprises:
– depreciation of £6.3 million; and
– Public Dividend Capital (PDC) dividend of
£1.9 million.
• £0.2 million • As a result of £19.1 million of capital expenditure incurred, the
depreciation Run Rate stands at £6.7 million increased from
actual £6.3 million.
• PDC dividends and interest are assumed to remain consistent
for the 2013/14 baseline.
Impairment
£2.5 million
• Impairment charge of £2.5 million. • £2.5 million • The impairment charge of £2.5 million (as a result of changes
to the Trust‟s property) is considered non-recurrent and has
therefore been removed from the baseline.

16
Contracted WTEs
• Contracted WTEs is the actual basic contracted hours of
employed full time and part time staff as at March 2014. This does
not include any overtime hours.
Bank and overtime
• Bank and overtime is based on all actual hours worked over and
above the contracted hours by contracted staff. This also includes
employees on zero hour contracts, forming the bank staff.
WTE summary WTEs
Contracted WTEs 2,578.1
Bank and overtime 171.2
Agency 72.1
Total WTE 2,821.4
Budgeted Establishment 2,727.9
Variance 93.5
Baseline Financials: Staffing as at March 2014
The table below summarises the WTEs the Trust is currently operating at against budgeted establishment levels. This represents the
opening position of WTEs from which the workforce plan is developed.
Agency
• Agency WTEs is based on the average cost by major staff group
divided by the hourly rates towards the end of the 2013/14. This
takes into consideration any months with excessive usage which
may skew the numbers.
Budgeted Staffing Levels
• In order to be fully staffed to deliver all of the agreed services,
the Trust requires a WTE of 2,727.9 as at March 2014. This
does not include the WTE requirement for any non-recurrent
business cases that were approved and delivered during the
year.
Variance
• The Trust is currently operating at 93.5 WTEs over the budgeted
levels.
• The primary reasons for this include:
− Staffing required to deliver services funded through non-
recurring revenues;
− Delivery of the EPR project; and
− Cover for key posts on long-term sickness and higher than
average rates of maternity leave.

Baseline Clinical and operational

18
Baseline Clinical
• The Trust provides a range of district hospital services and is proud to have obtained a CQC Band 6 rating (the best available) in March
2014, in recognition of the quality of care offered by the Trust. Other notable examples of delivering high quality healthcare include:
– The latest PLACE environment assessment shows the Trust ratios exceed all national averages;
– No „Never Events‟ in last 12 months;
– No incidents of grade 4 pressure ulcers during 2013/14; and
– Excellent performance meeting all targets for C Diff and no MRSA bacteraemia for our 4th year running.
• Key areas reviewed as part of the turnaround planning process have been: appropriate use of beds; effective theatre utilisation; and
outpatient efficiency. Significant areas of opportunity have been identified through this exercise, which include:
– Appropriate use of beds; it is recognised that, while the Trust compares well against peers for LoS at Trust-level, there is significant
opportunity at specialty level to reduce admissions and LoS;
– Theatre utilisation figures suggest that some specialties have more theatre capacity than may be warranted by demand;
– Benchmarking indicates that the Trust is an outlier when compared to peers for outpatient efficiency.
• Further to this there is significant opportunity for service redesign. The Trust will work closely with the Clinical Business Units to develop
a clinical strategy at a service line level.
• To support this, the Trust will be commissioning a clinical sustainability review to inform the development of its 5-year plan and to provide
a framework for discussion with commissioners and key partner.

19
Baseline Clinical and operational: Overview
Savings Schemes
As part of the Turnaround Plan, the Trust has developed a number of savings schemes. In doing this, the Trust has reviewed key indicators
of operational efficiency. Key areas reviewed have been:
• Appropriate use of beds – Although the Trust compares well against peers for length of stay at Trust level, there is significant opportunity
at specialty level to reduce admissions and length of stay. The key target area is General Medicine, with a potential bed saving of 35 beds
if „best in class‟ length of stay targets were to be achieved. Collaborative working with primary, community and social care will be required
to achieve this.
• Effective theatre utilisation – The Trust is working with an external company to ensure that theatre resources are better utilised and that
theatre sessions are allocated appropriately to the specialties most in need, in order to release capacity where possible.
• Outpatients efficiency - Benchmarking indicates that the Trust is an outlier when compared to peers for outpatient efficiency. With Did
Not Attend (DNA) rates at 9.6%, compared to a peer average of 7.9%, this is another key area for the Trust to drive cost savings.
Service Redesign Opportunities
While the above opportunities will be vital in delivering financial turnaround, the Trust also recognises that, as a small-medium sized district
general hospital, there are a number of strategic factors that need to be taken into account when formulating its long-term strategy and
assessing its future financial and operational sustainability. These include consideration of:
• the financial and workforce implications of the commissioning drive for seven day working and access to services;
• which services will remain solely provided by the Trust from the single hospital site, and which may become regionally networked or
shared services;
• which services may no longer be delivered from the hospital site – either due to centralisation or transferring care into the community; and
• the role of the Trust in developing community services to enable the delivery of care outside the acute environment, particularly for
patients with long-term conditions, requiring complex domiciliary care.
In order to consider these questions, the Trust will also be commissioning a clinical sustainability review to inform the development of its 5-
year plan and to provide a framework for discussion with commissioners and key partners.

20
Baseline Clinical and operational: SWOT analysis
• Underlying recurrent deficit position of £16.6 million in 2013/14. • High levels of locum usage due to difficulties in recruitment. • Diagnostic wait times under pressure, largely due to limited imaging capacity
related to workforce. • Lack of clarity regarding service level operating costs and income. • Poor track record of CIP delivery in prior years. • Historical under-achievement of A&E 4 hour access target, which has been
met for the first two months of 2014/15 – new model of care may be put at risk by financial position.
• Establishment of collaborative working arrangements for specialised or
smaller specialty services, to ensure service sustainability and local provision where clinically appropriate. For example urology, vascular surgery, and ENT.
• CQC rating 6. • Successful partnership model for pathology services with Rotherham NHS
Foundation Trust, enabling delivery of efficient high quality and cost-effective services.
• Development of A&E model of care and review of non-elective pathways has enabled achievement of 4 hour access target for first two months of 2014/15.
• Provision of bowel cancer screening.
• Expansion of collaborative working in certain specialties to attract skilled
workforce and maintain local services. • Development of ambulatory care pathways, including care of the elderly and
paediatrics. • Partnership working with community services to avoid unnecessary hospital
admissions and attendances. For example development of Deep VeinThrombosis (DVT) community pathway and GUM integration with community services.
• Use of technology to reduce pressure on capacity. For example telephone follow ups and telemedicine links with GPs to promote community management of specific conditions.
• Development of advanced non-medical roles to address reduction in training posts and provide consistency of care.
• Investment in technology including the launch of our EPR programme in September 2014.
• Development of commercial opportunities via Barnsley Hospital Support Services.
• Difficulty in recruitment and retention of skilled workforce for both medical
and non-medical roles. • Reduction in national training posts impacting on capacity to maintain
service delivery and medical rotas. • Commissioning agendas including centralisation and the need for 7 day
working may put services at Barnsley at risk if standards, minimum volume and workforce requirements cannot be met.
• Increasing demand for certain services related to demographic change and changes in clinical behaviour, driven by an aging population and availability of new diagnostics/treatments.
The Trust has undertaken a high level SWOT analysis in order to determine its strengths, weaknesses, opportunities and threats.
Strengths Weaknesses
Opportunities Threats

21
Baseline Clinical and operational: Activity overview
• The Trust has seen an increase in activity over the previous three financial years, which has been largely driven by growth in day case
procedures and outpatient attendances. In terms of percentage variances, the Trust ended the year close to plan.
• ED attendances were slightly down during 2013/14, but volumes were similar to 2012/13 ,which saw a significant increase in
attendance due to ED unplanned service changes at Mid Yorkshire Hospitals NHS Trust.
The below graph shows the breakdown of Trust activity for the past three financial years:
0.0
0.1
0.2
0.3
0.4
0.5
FY12 FY13 FY14
Tru
st A
ctivity (
mill
ions)
Trust activity over previous 3 financial years
Daycases Elective inpatients Non elective inpatients
Outpatients - new Outpatient - follow ups ED Attendances

22
Baseline Clinical and operational: Benchmarking overview
Source: HED; based on comparison with peers as defined by HED for time period Jan 2013 – Dec 2013.
Days LoS (all)
LoS above 30
days (all)
LoS excl. zero
days (all)
Pre-operative
bed days (all)
Day case
rates
Readmission
within 30 days
of discharge
New to follow
up ratios DNA rates
Trust 3.6 43.5 5.0 0.3 84.1% 9.6% 3.2 9.6%
Best in class 3.2 42.9 4.5 0.24 87.4% 7.7% 1.5 6.0%
Peer average 3.9 48.3 5.3 0.4 80.3% 8.7% 2.4 7.9%
Upper quartile 3.5 44.4 5.0 0.3 84.0% 8.0% 1.7 7.1%
The table below compares key operational efficiency indicators of the Trust with peer average, upper quartile and best in class.

23
Baseline Clinical and operational: Specialty level LoS
Source: HED; based on comparison with peers as defined by HED for time period Jan 2013 – Dec 2013.
Specialty level analysis of
LoS indicates priority areas
where there may be potential
for bed day reduction.
The biggest opportunity when
the Trust is compared to best
in class and upper quartile against its peer group is in
General Medicine. This group
of patients is likely to include
Geriatric Medicine patients
who have been coded to
General Medicine.
The Trust is currently
undertaking a number of
initiatives aimed at reducing
bed days overall (including
unnecessary admissions,
LoS, readmissions), and will
review benchmarking
information as necessary to
measure improvement and
identify issues.
The Trust Analysis
Treatment specialty
Total spell
duration Spells
Average total spell
duration
Peer group
BIC
BIC opportunity
(bed days)
Beds saved at
BIC
Peer group
UQ
UQ opportunity
(bed days)
Beds saved at
UQ
Accident & Emergency
732 647 1.1 0.6 324 1 1.2 - -
Breast Surgery 236 105 2.2 1.5 74 - 1.6 63 -
Cardiology 195 44 4.4 1.0 150 - 2.6 79 -
Clinical haematology 1,078 271 4.0 1.3 732 2 3.8 54 -
Dermatology 27 16 1.7 0.7 16 - 1.2 8 -
ENT 1,116 677 1.6 0.9 474 1 1.1 372 1
General medicine 91,568 15,771 5.8 5.0 12,617 35 5.8 789 2
Gynaecology 2,406 1,475 1.6 0.9 1,033 3 1.2 664 2
Neonatology 4,050 420 9.6 4.2 2,268 6 7.9 714 2
Rheumatology 50 9 5.6 0.2 49 - 2.1 32 -
Trauma & Orthopaedics
15,161 2,920 5.2 4.4 2,336 6 5.3 - -
Well Babies 2,904 2,249 1.3 0.9 900 2 1.3 112 -
The below table demonstrates how the Trust compares against peers for Length of Stay (LoS) at specialty level, for all inpatient spells.

24
Baseline Clinical and operational: Bed capacity and utilisation
• Alongside operational efficiency benchmarking information,
the Trust reviews important internal factors such as its bed
occupancy
• Review of bed occupancy figures demonstrates that:
– bed occupancy at Trust level is on average 85.6%; and
– there is seasonal variation in bed occupancy levels,
although medical beds are consistently utilised at 90%
and above.
• When assessing bed occupancy, LoS, and admission data,
opportunities for bed day reduction can be identified. The
Trust has therefore established initiatives to target key
areas, including care of the elderly.
• It is recognised that the Trust currently has a higher
readmission rate when compared to peers, and that any
initiatives looking to reduce bed days will need to identify
this as a risk, defining key mitigating actions. These
mitigating actions and readmission rates will be monitored
at service and Trust level to ensure any issues are
identified and acted upon rapidly.
Source:
Note 1 – Based on bed occupancy at midnight for time period Jan 2013 – Dec 2013
Note 2 – Excludes CCU and SAU
Bed occupancy Jan 2013 – Dec 2013
Specialty Number of beds Occupancy %
Gynaecology 20 65.7%
Medical 232 92.4%
Surgical 49 85.2%
Trauma & Orthopaedics 56 78.7%
Paediatrics 24 53.2%
Total 381 85.6%

25
Theatre utilisation by specialty Jan 2013 – Dec 2013
Type Specialty No of
sessions In session
Day surgery ENT 155 91.1%
General Surgery 158 82.8%
Gynaecology 189 78.7%
Oral & Maxillo Facial Surgery 221 76.9%
Trauma & Orthopaedics 122 69.1%
Urology 177 77.3%
Vascular Surgery 26 74.8%
Total 1,048 79.3%
Main theatres
Breast Surgery 131 95.4%
ENT 177 89.8%
General Surgery 552 88.1%
Gynaecology 333 89.2%
Obstetrics 85 70.7%
Ophthalmology 388 79.9%
Trauma & Orthopaedics 1,005 87.8%
Urology 98 85.7%
Total 2,769 86.7%
Trauma Trauma & Orthopaedics 378 73.9%
Grand total 4,195 83.7%
Baseline Clinical and operational: Effective theatre utilisation
• Review of theatre utilisation figures demonstrates that:
– there is significant opportunity to improve efficiency,
particularly in day case theatres;
– there is an urgent need to undertake a robust capacity
and demand analysis, to review allocation of lists and
ensure that these are correctly matched with demand.
– a more effective theatre scheduling system is required,
to ensure appropriate listing of cases, taking into
account case mix, to best utilise theatre time; and
– there is a need to monitor and improve late starts and
early finishes, to drive improved efficiency and
throughput of lists.
• The Trust is proposing to work with an external company to
review drivers of inefficiency across theatres, with a view
to improving theatre scheduling; increasing productivity
and utilisation; and reducing over-runs and additional
sessions.

26
Baseline Clinical and operational: Outpatient efficiency and utilisation
• The Trust also appears to be an outlier in terms of new to follow up ratios when compared to peers, suggesting opportunity for
improvement . Various initiatives are progressing to improve this, including:
– telephone follow up models;
– MDT “one-stop” clinics;
– increased use of technology for specimen results;
– development of a joint teledermatology service with GPs; and
– development of community pathways, including the implementation of protocols to allow early discharge from rheumatology,
dermatology and haematology.
• The Trust has identified significant opportunity to improve outpatient productivity and efficiency.
• Through the CBU restructure, a Clinical Director for outpatients has been identified, enabling clinical leadership of the improvement
programme.
• DNA rates have been highlighted as higher than peer average, and there is an ongoing project to address these.
• It is recognised that in order to achieve outpatient efficiencies, the Trust needs to work effectively with its partners. Close working with
GPs in the development of community pathways is particularly important.
Source: HED, based on comparison with peers as defined by HED for time period Jan 2013 – Dec 2013.
New to follow up ratios DNA rates
The Trust 3.2 9.6%
Best in Class 1.5 6.0%
Peer Average 2.3 7.9%
Upper Quartile 1.7 7.1%

27
Baseline Clinical and operational: Performance indicators
Source:
Monitoring performance
• The Trust monitors operational performance on a regular basis, reporting key indicators both internally and externally.
28
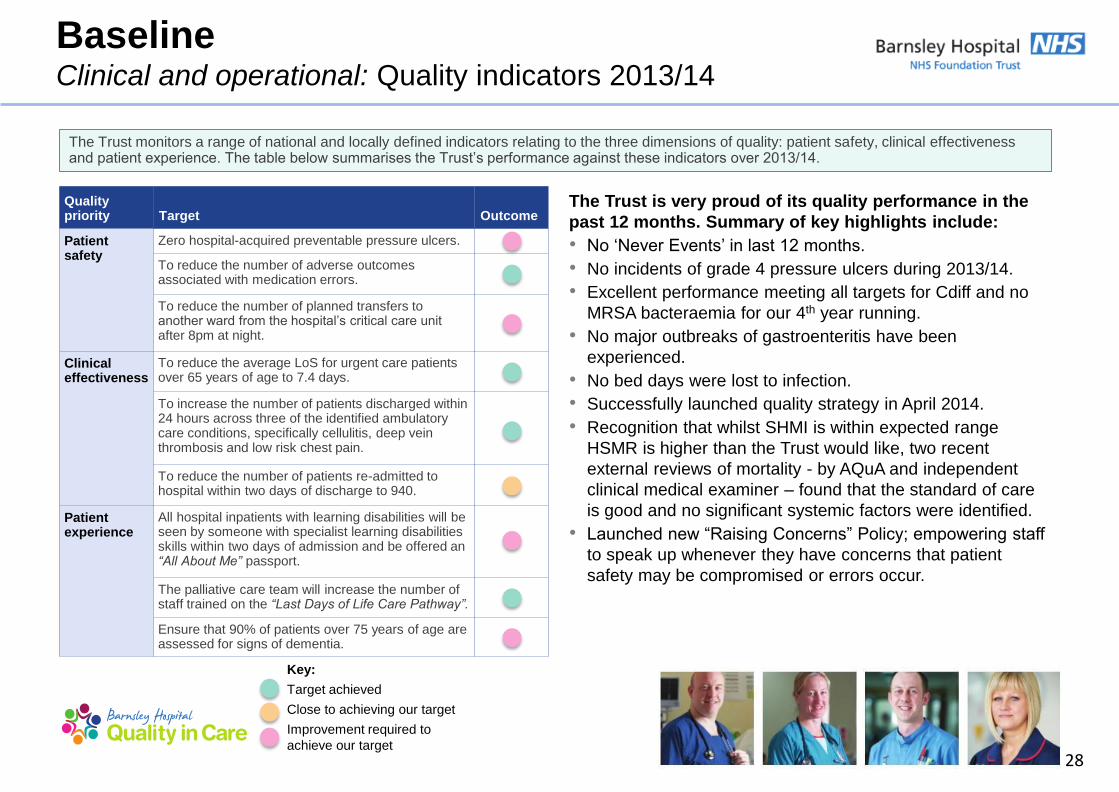
The Trust monitors a range of national and locally defined indicators relating to the three dimensions of quality: patient safety, clinical effectiveness and patient experience. The table below summarises the Trust‟s performance against these indicators over 2013/14.
The Trust is very proud of its quality performance in the
past 12 months. Summary of key highlights include:
• No „Never Events‟ in last 12 months.
• No incidents of grade 4 pressure ulcers during 2013/14.
• Excellent performance meeting all targets for Cdiff and no
MRSA bacteraemia for our 4th year running.
• No major outbreaks of gastroenteritis have been
experienced.
• No bed days were lost to infection.
• Successfully launched quality strategy in April 2014.
• Recognition that whilst SHMI is within expected range
HSMR is higher than the Trust would like, two recent
external reviews of mortality - by AQuA and independent
clinical medical examiner – found that the standard of care
is good and no significant systemic factors were identified.
• Launched new “Raising Concerns” Policy; empowering staff
to speak up whenever they have concerns that patient
safety may be compromised or errors occur.
Quality priority Target Outcome
Patient safety
Zero hospital-acquired preventable pressure ulcers.
To reduce the number of adverse outcomes associated with medication errors.
To reduce the number of planned transfers to another ward from the hospital‟s critical care unit after 8pm at night.
Clinical effectiveness
To reduce the average LoS for urgent care patients over 65 years of age to 7.4 days.
To increase the number of patients discharged within 24 hours across three of the identified ambulatory care conditions, specifically cellulitis, deep vein thrombosis and low risk chest pain.
To reduce the number of patients re-admitted to hospital within two days of discharge to 940.
Patient experience
All hospital inpatients with learning disabilities will be seen by someone with specialist learning disabilities skills within two days of admission and be offered an “All About Me” passport.
The palliative care team will increase the number of staff trained on the “Last Days of Life Care Pathway”.
Ensure that 90% of patients over 75 years of age are assessed for signs of dementia.
Baseline Clinical and operational: Quality indicators 2013/14
Key:
Target achieved
Close to achieving our target
Improvement required to
achieve our target

29
Quality goal Aim/objective Quality indicators
Patient experience;
ensure we deliver patient-
centred care
To identify key patient experience metrics which will drive improvement
in the way we deliver care.
Implementation of core data across all inpatient areas to
consistently measure and benchmark patient experience.
To improve the experience of care provided to patients with dementia
and their carers.
Undertake case finding for at least 90% of patients 75 years
and over admitted as an emergency for >72 hours; ensuring
that, where patients are identified as potentially having
dementia or delirium, at least 90% are appropriately
assessed; and ensuring that, where appropriate, patients
with dementia are referred onto specialist services.
To implement the NHS Friends & Family Test throughout the hospital. Wider roll out of patient experience questionnaires through
the expansion of Open & Honest Care, ensuring openness
and transparency on the reporting of harms or injury to
patients.
Delivering consistently
safe care
To reduce hospital acquired harms in relation to VTEs, Falls, CAUTIs
and pressure ulcers.
During 2014/15 we want to see a reduction in hospital
acquired harms in relation to VTEs, falls, CAUTIs and
pressure ulcers with the aim of achieving the national
average for harm-free care against all areas. Each area will
be monitored separately.
To reduce inpatient falls. In 2013/14 there were 1,030 reported inpatient falls. During
2014/15 we want to see this number being reduced by at
least 50%.
To improve clinical note keeping standards, thereby ensuring robust
patient assessments and plans of care.
By April 2015 we will be able to demonstrate 75%
compliance with clinical note keeping standard audits.
The tables on the following two pages describe the Trust‟s current quality goals, objectives and quality markers for 2014/15. These drive the Trust‟s
current approach to improving patient experience, safety and effectiveness of care.
Baseline Clinical and operational: Quality indicators 2014/15

30
Quality goal Aim/objective Quality markers
Delivering consistently
effective care
To further reduce unavoidable deaths. Our rolling 12 month HSMR value in December 2013 is
112. We aim to reduce this rate further to 105 by January
2015 and 100 by January 2016.
Improve recognition and management of the adult deteriorating patient. We implement NEWS across the organisation in January
2014. By April 2015 we aim to demonstrate 95%
compliance with the implementation of NEWS in the adult
patient.
To improve sepsis recognition and response. For 2014/15 the sepsis recognition and management tool
will be embedded further across the Trust with a
multifaceted approach to educating staff in the use of the
tool. By April 2015 we aim to demonstrate 95% compliance
with the implementation of the sepsis screening and
management tool.
To ensure scrutiny of all in-hospital deaths to ensure learning is
achieved where possible.
From April 2014 we implemented a formal process for
reviewing all in-hospital deaths in a consistent and timely
manner. By April 2015 we aim to demonstrate that 95% of
all in-hospital deaths are being formally reviewed within 15
working days of the death occurring.
Building capacity and
capability
Review HR processes to ensure that we recruit staff with the values that
underpin compassionate care.
Reduce sickness absence to 3.5%.
Review skills mix and team structures where required to ensure that we
have the right people with the right skills at the right time.
Demonstrate 90% compliance with staff appraisals.
Identify and implement competency-based training for non-registered
staff.
Demonstrate 90% compliance with mandatory training.
Baseline Clinical and operational: Quality indicators 2014/15 (continued)

Strategy Turnaround Plan Delivery

32
2014/15
Comms
2015/16
Risks
Benefits
Risks
Governance
Service
review and
redesign
PMO
Financials
Savings
schemes Delivery
The
turnaround
plan
Strategy: Turnaround Plan Delivery
The Turnaround Plan
• The diagram displays the fundamental aspects of the Turnaround Plan which is driven by the Vision of the Trust.
Our four quality goals are:
• Delivering patient-centred care;
• Delivering consistently safe care;
• Delivering consistently effective care; and
• Building on capacity and capability.
The
turnaround
plan
Overview
• Quality is at the heart of everything the Trust does.
• The plan is built on delivery of saving schemes, which will allow the Trust to bridge the existing financial deficit.
Delivery
• The Trust recognises that delivery of saving schemes is critical to success of this Turnaround Plan.
• The Trust put in place structures which will ensure delivery of these schemes.
There are four themes underpinning the plan:
• quality & safety;
• accountability;
• delivery and culture; and
• financial control.
Governance
• The Trust recognises the importance of good governance and has ensured that a robust action plan is in place.

33
1. Patients will experience safe
care
• Action to reduce harm to our
patients in relation to VTE,
falls, catheter acquired
urinary tract infections and
pressure ulcers.
• Implement NHS Friends &
Family Test throughout the
hospital.
• Achieve a 50% reduction in
inpatient falls.
• Continued improvements in
our HSMR value.
• Delivery of a 7 day service,
including radiology therapies
and pharmacy.
• Improve our patients
experience of care for those
who have dementia.
2. Partnerships will be our
strength
• Being open with the public
and our patients, to receive
feedback that will improve
our care.
• Drive changes through
partnership working with the
HWB, including reduction of
emergency activity, increase
capacity and access to
primary care services, assist
in supporting patients in
managing their long-term
conditions in the community.
• Partnership working with the
Working Together
Programme in sharing good
practice, increasing quality of
care.
3. People will be proud to
work at the Trust
• Develop and strengthen our
leaders and teams and CBU
structure.
• Create a motivated and
highly skilled workforce to
have the right people and
right skills to deliver safe and
compassionate care.
• Value and look after our
staff‟s health and wellbeing.
4. Performance matters
• Implement a performance
management framework.
• Achieve our performance
targets.
• Invest wisely in required
technology, such as the EPR.
• Optimise the use of our
estate.
• Cost-effective procurement.
• Development of commercial
partnerships and business
proposals to drive income.
Turnaround Strategy: Trust‟s Vision
The Trust‟s Vision is to be the best integrated healthcare organisation of choice for our local communities and beyond.
Quality goal: Deliver consistently safe and effective patient-centred care, building on our capacity and capability.
The
turnaround
plan

34
1 Quality:
Quality and safety drive our clinical strategy and our future remaining at the heart of
our core business.
2 Accountability:
Teams and individuals are held to account through robust governance to ensure
delivery.
3 Delivery and culture:
Create a “can do” culture; clinically lead with a bottom up approach.
4 Financial control:
To do what we get paid to do: the provision of high quality, cost effective services.
Turnaround Strategy: Themes underpinning the plan
The
turnaround
plan
35
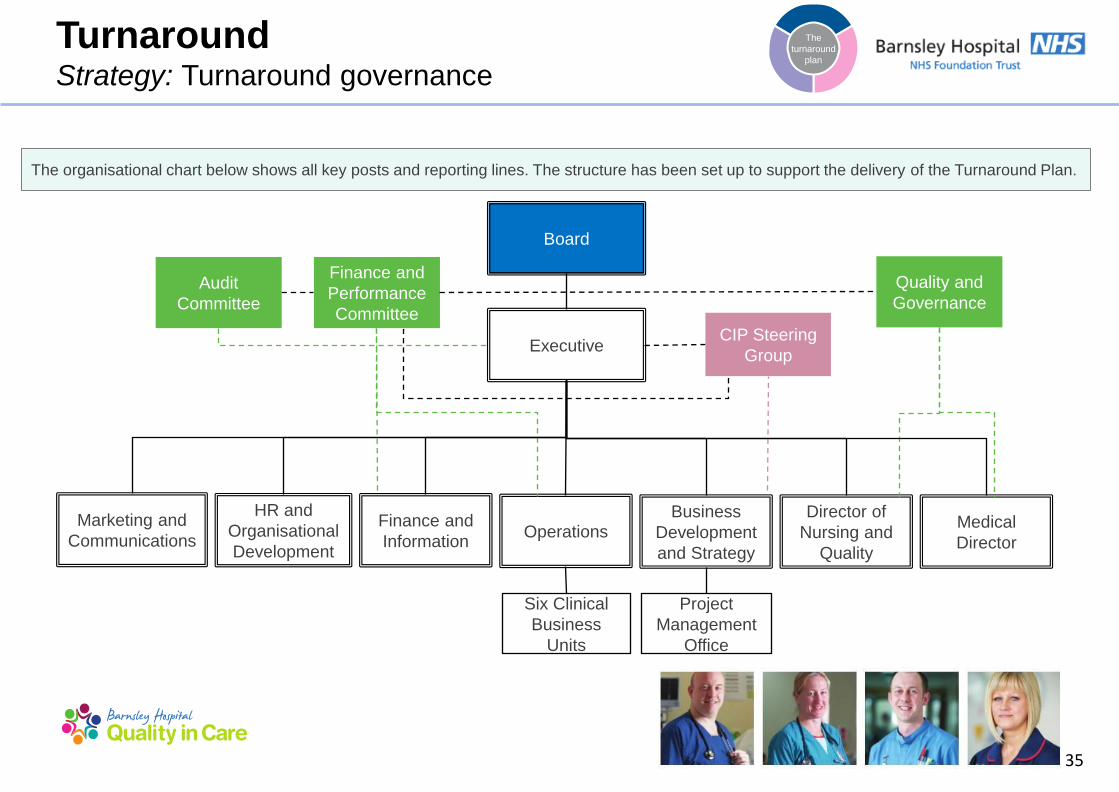
Turnaround Strategy: Turnaround governance
The organisational chart below shows all key posts and reporting lines. The structure has been set up to support the delivery of the Turnaround Plan.
Board
Executive
HR and
Organisational
Development
Finance and
Information
Business
Development
and Strategy
Director of
Nursing and
Quality
Medical
Director
Finance and
Performance
Committee
Project
Management
Office
Six Clinical
Business
Units
Quality and
Governance
Marketing and
Communications Operations
CIP Steering
Group
Audit
Committee
The
turnaround
plan

36
Turnaround Strategy: Turnaround Plan responsibilities
Role Name Appointment Date Responsibilities
Board - Executive Ms D Wake
Dr J Mahajan
Mr D W Peverelle (until 30 June
2014)
Mrs K Kelly
Mrs H Mcnair
Mr S Diggles
Other Directors
Ms H Brearley
Ms E Parkes
Mr R Kirton
Mr J Bradley
Mrs L Christopher
Oct 2013
Sept 2009
May 2000
Jul 2014
Dec 2011
Apr 2014
• Meet weekly to oversee all Trust business, including progress against business and Turnaround Plan.
• Key decision making body for the Trust.
• Consider key business cases for service improvement, develop
strategies for Board approval. The Board is the major decision
making body for the Trust, the Executive ensure the business
plan is executed.
• Plan implementation and monitor progress against Board
approved strategies and plans.
• Monitor performance against the Trust‟s Turnaround Plan.
Accountability for delivery.
• Provide executive sponsorship for generation, identification and
delivery of CIP schemes.
• Provide assurance to Non-Executive Directors and to the
assurance committees.
• Other directors don‟t have voting rights but form part of the
Executive Team but share all of the above responsibilities.
The
turnaround
plan

37
Turnaround Strategy: Turnaround Plan responsibilities
Role Name Appointment
Date
Responsibilities
Board - Non
executive
Mr S Wragg (Chairman)
Mrs S Brain England OBE
Mrs L Christon
Sir Stephen Houghton CBE
Mr P Spinks
Mr F Patton
Jan 2009
Jan 2012
Jan 2010
Jan 2012
Sept 2012
Jan 2008
• Hold the Executive Directors to account.
• Accountable to the Governors.
• Provide assurance to governors regarding the Trust‟s strategy
and performance including the Turnaround Plan.
• Non-Executive Directors will chair all assurance committees (in
particular, Finance & Performance Committee).
Governors Various • Hold the Non-Executive Directors to account.
CEO Ms D Wake Oct 2013 • Overall control and accountability of the Turnaround Plan.
• Chair of Executive meetings – see above.
• Chair of CIP steering group – leading the CIP steering group to
monitor delivery against the CIP plan via CIP tracker. Links to
performance meetings.
• Holds the Executive to account.
Interim Director of
Finance
Mr S Diggles April 2014 • Responsible for all financial information, including:
– baselining;
– cashflow forecast;
– assisting and monitoring the CIP financial information;
– lead on ICT Turnaround Plans; and
– member of the CIP steering group.
The
turnaround
plan

38
Turnaround Strategy: Turnaround Plan responsibilities (continued)
Role Name Appointment
Date
Responsibilities
Director of Strategy
and Business
Development
Mr R Kirton Apr 2014 • Accountable for the delivery of the Turnaround Plan, co-
ordinating the PMO team.
• Member and deputy chair of the CIP steering group.
• Workstream sponsor for support services and non pay.
Director of HR &
Organisational
Development
Ms H Brearley Apr 2010 • Executive lead on:
– workforce Turnaround Plans; and
– responsible for workforce information, analysis and planning.
• Workstream sponsor for workforce.
• Implementation of workforce change.
• Member of CIP steering group.
Director of
Marketing &
Communications
Ms E Parkes Feb 2014 • Responsible for the communication of the plan to employees
and internal and external stakeholders relating to the Trust.
Medical Director Dr J Mahajan Sept 2009 • Executive lead on medical workforce Turnaround Plans.
• To provide quality assurance on all elements of turnaround
programme.
• Member of CIP steering group.
Director of Nursing
& Quality
Mrs H Mcnair Dec 2011 • Executive lead on nursing and quality Turnaround Plans.
• To provide quality assurance on all elements of turnaround
programme.
• Member of CIP steering group.
The
turnaround
plan

39
Turnaround Strategy: Turnaround Plan responsibilities (continued)
Role Name Appointment
Date
Responsibilities
Director of
Operations
Ms K Kelly Apr 2014 • Executive lead on operational and CBU Turnaround Plans.
• Member of CIP steering group.
• Workstream sponsor for frontline and clinical.
CBU leads CBU leadership team – consists of
General Manager, Clinical Director
and Head of Nursing.
General Manager
Clinical Director
Head of Nursing
• Lead in operational delivery of Trust-wide Turnaround Plans.
• Responsible for design and delivery of CBU service,
improvement and development plans, and meeting KPIs.
• Report to performance meetings on progress against CBU plan.
• Overall responsibility for the delivery of Turnaround Plan,
identifying and implementation of CIP schemes, ensuring
delivery of savings.
• Clinical leadership and engagement in Turnaround Plans
(internal and external stakeholder e.g. via clinical senate).
• Professional leadership for the delivery of the Turnaround Plan.
The
turnaround
plan
40
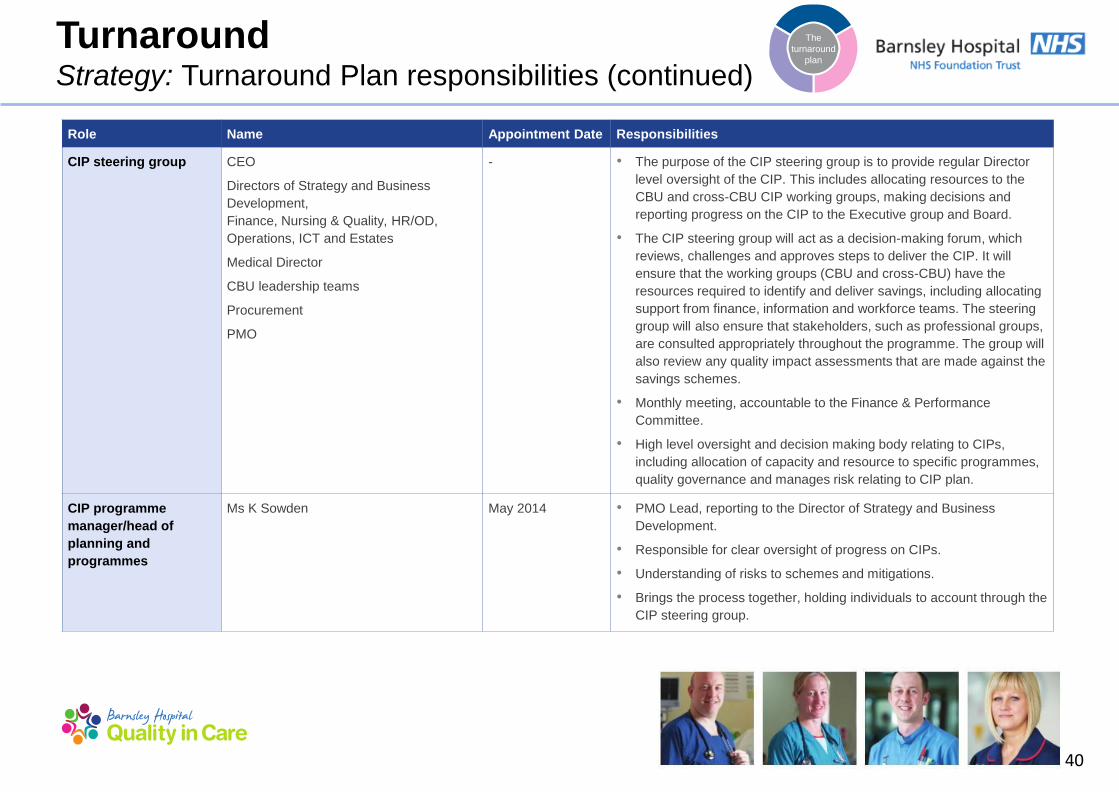
Turnaround Strategy: Turnaround Plan responsibilities (continued)
Role Name Appointment Date Responsibilities
CIP steering group CEO
Directors of Strategy and Business
Development,
Finance, Nursing & Quality, HR/OD,
Operations, ICT and Estates
Medical Director
CBU leadership teams
Procurement
PMO
- • The purpose of the CIP steering group is to provide regular Director
level oversight of the CIP. This includes allocating resources to the
CBU and cross-CBU CIP working groups, making decisions and
reporting progress on the CIP to the Executive group and Board.
• The CIP steering group will act as a decision-making forum, which
reviews, challenges and approves steps to deliver the CIP. It will
ensure that the working groups (CBU and cross-CBU) have the
resources required to identify and deliver savings, including allocating
support from finance, information and workforce teams. The steering
group will also ensure that stakeholders, such as professional groups,
are consulted appropriately throughout the programme. The group will
also review any quality impact assessments that are made against the
savings schemes.
• Monthly meeting, accountable to the Finance & Performance
Committee.
• High level oversight and decision making body relating to CIPs,
including allocation of capacity and resource to specific programmes,
quality governance and manages risk relating to CIP plan.
CIP programme
manager/head of
planning and
programmes
Ms K Sowden May 2014 • PMO Lead, reporting to the Director of Strategy and Business
Development.
• Responsible for clear oversight of progress on CIPs.
• Understanding of risks to schemes and mitigations.
• Brings the process together, holding individuals to account through the
CIP steering group.
The
turnaround
plan

41
Turnaround Strategy: Turnaround Plan responsibilities (continued)
Role Name Appointment Date Responsibilities
CIP lead Various - • Implementation of CIP, reporting to sponsor.
• Primary day-to-day interface with the working group leads, working
group members and technical leads.
• Providing hands on support to drive the detailed planning for each
shared scheme and supporting on analysis required.
• Co-ordinate technical leads in finance, information and HR to provide
data and analytical support to each workstream.
Information lead Various - • Responsible for information and analysis for CIP/Turnaround Plans.
• Technical leads will provide advice within the meeting specific to their
area and may also be required to gather information, conduct analysis
or consult others as part of the process of identifying and
implementing the CIP initiatives for their working group.
Finance leads Various - • Responsible for financial information and analysis for CIP/Turnaround
Plans.
• Technical leads will provide advice within the meeting specific to their
area and may also be required to gather information, conduct analysis
or consult others as part of the process of identifying and
implementing the CIP initiatives for their working group.
Workforce lead Various - • Responsible for co-ordination of workforce Turnaround Plans.
• Workforce planning, numbers etc.
• Technical leads will provide advice within the meeting specific to their
area and may also be required to gather information, conduct analysis
or consult others as part of the process of identifying and
implementing the CIP initiatives for their working group.
The
turnaround
plan

42
Turnaround Strategy: Quality
• The Trust is committed to ensuring that quality drives its clinical strategy and its future and that this remains at the heart of the Trust‟s core business.
• The Trust has developed a quality strategy to support the provision of safe, effective and dignified care, which has defined key metrics and stretch
targets for the next three years.
• This focus on quality will be crucial when maintaining the quality of services during financial turnaround, enabling the Trust to deliver financially and
clinically sustainable services for the future.
• The Trust has recently reviewed its quality governance structures, to ensure an integrated approach to quality management, embedded throughout
all levels of the organisation. The revised structures are shown in the schematic below.
What does quality mean for our patients?
• Every patient will receive the right treatment at the right time, by the
right person.
• Every patient will be kept safe and protected from all avoidable harm
whilst in our care.
• Every patient will receive treatment that follows national guidelines.
• Every patient will be treated with dignity, compassion and respect.
• Every patient will be listened to.
• Every patient will be kept informed regarding their treatment and will
play a key part of any decision making process.
• Every concern or complaint received will be treated with the
importance it deserves and issues will be dealt with in a timely and
open manner.
Board of Directors
Review effectiveness of processes
Clinical Business Units
Identify and monitor local quality targets and
quality impacts
Quality, performance and integrated
governance
Measure, monitor and improve
Quality Quality
The Trust recognises the importance of maintaining quality. This is paramount to the Trust‟s turnaround strategy. The Trust‟s quality approach is set out
below.
The
turnaround
plan

43
Turnaround Strategy: Quality (continued)
• The Trust recognises that a robust approach to quality
management throughout the turnaround process is
required, to closely monitor and mitigate any risks to the
quality of service provided by the Trust.
• Therefore, quality impact assessment and ongoing
monitoring have been identified as integral aspects of the
wider CIP governance. This approach is shown in the
diagram to the left and follows the following steps:
1. Scheme approval
2. Scheme development
3. Quality monitoring
Scheme
approval
Quality
approach
Panel to
review QIA
The
turnaround
plan
The Trust‟s plan to maintain quality during turnaround is set out below.
44
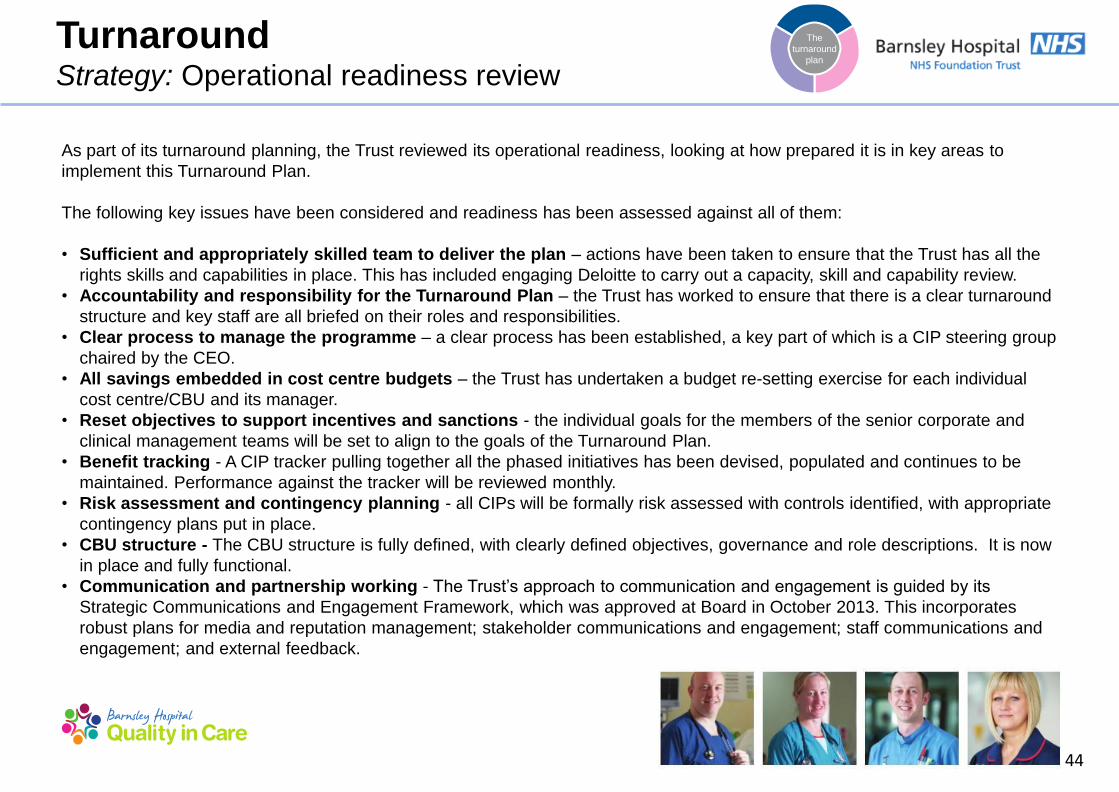
Turnaround Strategy: Operational readiness review
The
turnaround
plan
As part of its turnaround planning, the Trust reviewed its operational readiness, looking at how prepared it is in key areas to
implement this Turnaround Plan.
The following key issues have been considered and readiness has been assessed against all of them:
• Sufficient and appropriately skilled team to deliver the plan – actions have been taken to ensure that the Trust has all the
rights skills and capabilities in place. This has included engaging Deloitte to carry out a capacity, skill and capability review.
• Accountability and responsibility for the Turnaround Plan – the Trust has worked to ensure that there is a clear turnaround
structure and key staff are all briefed on their roles and responsibilities.
• Clear process to manage the programme – a clear process has been established, a key part of which is a CIP steering group
chaired by the CEO.
• All savings embedded in cost centre budgets – the Trust has undertaken a budget re-setting exercise for each individual
cost centre/CBU and its manager.
• Reset objectives to support incentives and sanctions - the individual goals for the members of the senior corporate and
clinical management teams will be set to align to the goals of the Turnaround Plan.
• Benefit tracking - A CIP tracker pulling together all the phased initiatives has been devised, populated and continues to be
maintained. Performance against the tracker will be reviewed monthly.
• Risk assessment and contingency planning - all CIPs will be formally risk assessed with controls identified, with appropriate
contingency plans put in place.
• CBU structure - The CBU structure is fully defined, with clearly defined objectives, governance and role descriptions. It is now
in place and fully functional.
• Communication and partnership working - The Trust‟s approach to communication and engagement is guided by its
Strategic Communications and Engagement Framework, which was approved at Board in October 2013. This incorporates
robust plans for media and reputation management; stakeholder communications and engagement; staff communications and
engagement; and external feedback.

45
Turnaround Strategy: Operational readiness review (continued)
The
turnaround
plan
• CCG relationship - The Trust is working to continually improve the relationship and communications with Barnsley CCG by
actively participating in regular meetings and continuous dialogue.
• Cultural change – Actions are being taken to enact a fundamental change in the culture of the organisation towards a culture
of empowerment and ownership. These include a series of road shows for staff outlining their role in the Turnaround Plan;
regular staff communications outlining progress against the plan; clear targets and milestones; and clearly defined objectives
for management and staff
• Workforce plan - A detailed workforce plan has been produced as part of the Turnaround Plan, incorporating the expected
workforce movements during the two-year period.
• Clear vision - The Trust‟s vision, reflecting its focus on patients, people and partnerships has been in place since 2014 and has
been extensively communicated to the Trust‟s staff and partners in April 2014. This will be reviewed following the planned
sustainability review, and, if necessary, updated
• Internal communications - The Trust has made improvements to internal communications and engagement channels in line
with its Strategic Communications and Engagement Framework 2013-16. These communications explain key milestones, what
is expected of staff regarding the delivery of the plan and also seek to identify further money saving ideas
• Staff engagement - The Trust is committed to effective, honest and regular communication with all members of staff. The
purpose and importance of the Turnaround Plan will be communicated and a message delivered that the successful
achievement of the turnaround will depend on the commitment of all members of staff.

46
Turnaround Strategy: Key risks
The Trust has identified a number of risks that could impact its
ability to deliver the Turnaround Plan. These risks have been
classified in the following areas:
Financial
• A number of financial risks, including achieving the required
forecast activity levels, CQUIN targets and averting CCG
penalties have been identified.
Governance
• The Trust engaged KPMG to undertake an external review of
the governance structure and to make recommendations in
respect of implementation of a more robust budget setting
process. This identified a number of risks which the Trust has
mitigated against.
CIPs
• The achievement of the proposed CIP plan is essential to the
Trust‟s financial turnaround.
• Failure to identify, develop and achieve these savings within the
timeframe detailed within this plan will have a significant impact
on the turnaround.
Delivery
• A number of delivery risks have been identified and are set out
on the following pages.
The
turnaround
plan
2014/15
Comms
2015/16
Risks
Benefits
Risks
Governance
Service
review and
redesign
PMO
Financials
Savings
schemes Delivery
The turnaround
plan
47
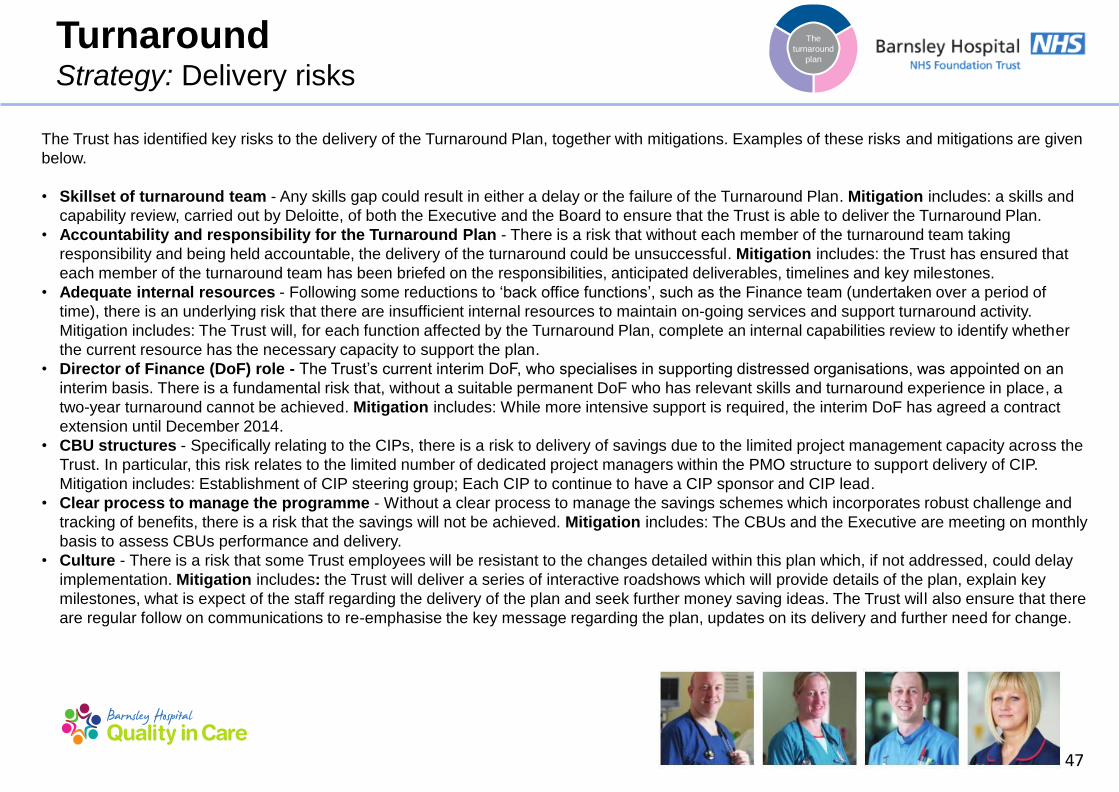
Turnaround Strategy: Delivery risks
The
turnaround
plan
The Trust has identified key risks to the delivery of the Turnaround Plan, together with mitigations. Examples of these risks and mitigations are given
below.
• Skillset of turnaround team - Any skills gap could result in either a delay or the failure of the Turnaround Plan. Mitigation includes: a skills and
capability review, carried out by Deloitte, of both the Executive and the Board to ensure that the Trust is able to deliver the Turnaround Plan.
• Accountability and responsibility for the Turnaround Plan - There is a risk that without each member of the turnaround team taking
responsibility and being held accountable, the delivery of the turnaround could be unsuccessful. Mitigation includes: the Trust has ensured that
each member of the turnaround team has been briefed on the responsibilities, anticipated deliverables, timelines and key milestones.
• Adequate internal resources - Following some reductions to „back office functions‟, such as the Finance team (undertaken over a period of
time), there is an underlying risk that there are insufficient internal resources to maintain on-going services and support turnaround activity.
Mitigation includes: The Trust will, for each function affected by the Turnaround Plan, complete an internal capabilities review to identify whether
the current resource has the necessary capacity to support the plan.
• Director of Finance (DoF) role - The Trust‟s current interim DoF, who specialises in supporting distressed organisations, was appointed on an
interim basis. There is a fundamental risk that, without a suitable permanent DoF who has relevant skills and turnaround experience in place, a
two-year turnaround cannot be achieved. Mitigation includes: While more intensive support is required, the interim DoF has agreed a contract
extension until December 2014.
• CBU structures - Specifically relating to the CIPs, there is a risk to delivery of savings due to the limited project management capacity across the
Trust. In particular, this risk relates to the limited number of dedicated project managers within the PMO structure to support delivery of CIP.
Mitigation includes: Establishment of CIP steering group; Each CIP to continue to have a CIP sponsor and CIP lead.
• Clear process to manage the programme - Without a clear process to manage the savings schemes which incorporates robust challenge and
tracking of benefits, there is a risk that the savings will not be achieved. Mitigation includes: The CBUs and the Executive are meeting on monthly
basis to assess CBUs performance and delivery.
• Culture - There is a risk that some Trust employees will be resistant to the changes detailed within this plan which, if not addressed, could delay
implementation. Mitigation includes: the Trust will deliver a series of interactive roadshows which will provide details of the plan, explain key
milestones, what is expect of the staff regarding the delivery of the plan and seek further money saving ideas. The Trust will also ensure that there
are regular follow on communications to re-emphasise the key message regarding the plan, updates on its delivery and further need for change.

Turnaround Financials

49
Turnaround Financials: 2014/15 and 2015/16 summary
2014/15
• Contract based income increases to baseline by £1.1 million
incorporating the effects of activity and Tariff (the national rate at
which we get paid for our services). Other income including non-
recurrent income increases by £4.4 million to baseline.
• Pay costs increase to support the non-recurring income and due to
cost increases under AfC. Planned savings on agency usage
reduce the total movement to baseline to £6.6 million.
• Non-pay costs increase to baseline based on activity and
inflationary pressures by £1.2 million. ITDA reduces by £0.7 million.
• CIPs are assumed to deliver in year a £6.0 million (4.3%)
improvement to baseline with a further £0.3 million improvement
due to VAT savings on agency costs. The CIP full year effect is
£8.7 million (6.2%).
• The forecast deficit for the year is £11.9 million. Accounting for the
full year effect of CIPs and the Q4 Run Rate, the underlying closing
Run Rate is a deficit of £8.0 million.
2015/16
• Contract based incomes assume activity levels remain the same with a
1.5% reduction to tariff. Other income including non-recurring incomes
(excluding EPR) are assumed to continue at the same level as 2014/15.
• Pay costs are initially assumed to rise in line with AfC. Agency costs are
assumed to reduce by a further £0.9 million.
• Non-pay costs increase due to inflationary pressures assumed between 1-
5% which are then set off by £1.1 million of savings on consultancy and
advisory costs.
• A further £6.0 million (4.3%) of CIP savings are planned to be delivered in
year in 2015/16. The CIP full year effect is £8.3 million (6.0%).
• The forecast deficit for the year is £6.3 million. Accounting for the full year
effect of CIPs and the Q4 Run Rate, the underlying closing run rate is a
deficit of £2.8 million.
Note: CIP percentage savings are calculated
on contracted activity based income.

50
Turnaround Financials: 2014/15 forecast summary
Income and Expenditure
£‘million
2013/14
Actual
Baseline/
Run Rate 2014/15 2015/16
Income
Income from activities 147.2 143.5 149.3 147.3
Other income 22.5 15.7 15.7 14.9
Total income 169.7 159.2 165.0 162.2
Operating Expenses
Pay cost (115.8) (116.2) (117.8) (112.4)
Non pay cost (52.8) (50.9) (51.1) (48.1)
Total operating expenses (168.6) (167.1) (168.9) (160.5)
EBITDA 1.1 (7.9) (3.9) 1.7
Depreciation and amortisation (6.3) (6.7) (5.8) (5.8)
Restructuring costs (0.2) - (0.3) (0.6)
Interest (0.1) (0.1) - -
PDC Dividend (1.9) (1.9) (1.9) (1.6)
ITDA (8.5) (8.7) (8.0) (8.0)
Total operating expenses (177.1) (175.8) (176.9) (168.5)
Net deficit (7.4) (16.6) (11.9) (6.3)
Impairment (2.5) - - -
Net deficit Post-impairment (9.9) (16.6) (11.9) (6.3)

51
Turnaround Financials: 2014/15 forecast summary (continued)
In calculating the Trust‟s 2014/15 forecast, assumptions have been made in the following areas:
• Clinical income (£149.3 million)
Assumptions include (but are not limited to): Clinical income is primarily based on the contract value which factors in changes to activity levels based
on expected demand and achieving required targets (£3.2 million increase) and tariff reductions and inflation (£2.1 million reduction). The Contract
with Barnsley Clinical Commissioning Group (CCG) has now been signed.
• Other income (£15.7 million)
• Assumptions include (but are not limited to): The Trust has assumed a net £0.8 million will be received in relation to EPR implementation related
costs incurred in 2013/14. All EPR related costs incurred in 2014/15 are assumed to be offset with additional income and has not been included in
the 2014/15 plan. £0.9 million of non-recurrent income was received from Barnsley CCG; primarily relating to a pharmacy robot.
• Other income includes non-patient related project income, car park income, rental income, Learning & Development (L&D) related income,
Research & Development (R&D) related income and any other non-clinical income.
• All of the above are considered non-recurrent and do not form part of the baseline.
• Pay costs (£117.8 million)
Assumptions include (but are not limited to): Pay costs are based on the established organisation which factors in the new CBU structures and other
organisational changes. 2014/15 Agenda for Change pay related increases have also been included. Agency premium costs of £3.5 million (a 20%
reduction on 2013/14) have been included to account for the additional costs of use of agency and bank staff to cover vacant positions.
• Non-pay costs (£51.1 million)
Assumptions include (but are not limited to): Non-pay costs are based on the closing Run Rates from 2014/15 and account for inflationary pressures,
activity levels and revised contractual and supplier agreements as appropriate.
• ITDA (£8.0 million)
Assumptions include (but are not limited to): Restructuring costs of £0.4 million have been assumed.

52
Turnaround Financials: 2014/15 cash flow forecast
Overview
• The Trust had an opening cash position of £2.5 million.
• The key monthly cash assumptions included within the Long-term Cash Flow Forecast (LTCFF) on average are:
− contract based income £11.8 million;
− payroll and agency payments £9.9 million; and
− creditor backlog (incl. capital expenditure) payments £11.6 million.
• The Trust received £10.0 million of Public Dividend Capital (PDC) funding in April and May 2014 to facilitate its short-term funding requirement.
Cash flow
£'million
2013/14
Actual
2014/15
Forecast
Operating loss (7.4) (11.9)
Non-cash income and expenses 11.9 (4.0)
Net cash flow from operating activities 4.5 (15.9)
Cash flows from investing activities
Purchase of property, plant and equipment (16.7) (3.5)
Net cash outflow from investing activities (16.7) (3.5)
Cash flows from financing activities
PDC received 0.7 -
Capital element of private finance (0.2) (0.1)
PDC dividend paid (2.5) (1.9)
Net cash outflow from financing activities (2.0) (2.0)
Decrease in cash and cash equivalents (14.2) (21.4)
Cash and cash equivalents at 1 April 16.7 2.5
Cash and cash equivalents at 31 March 2.5 (18.9)
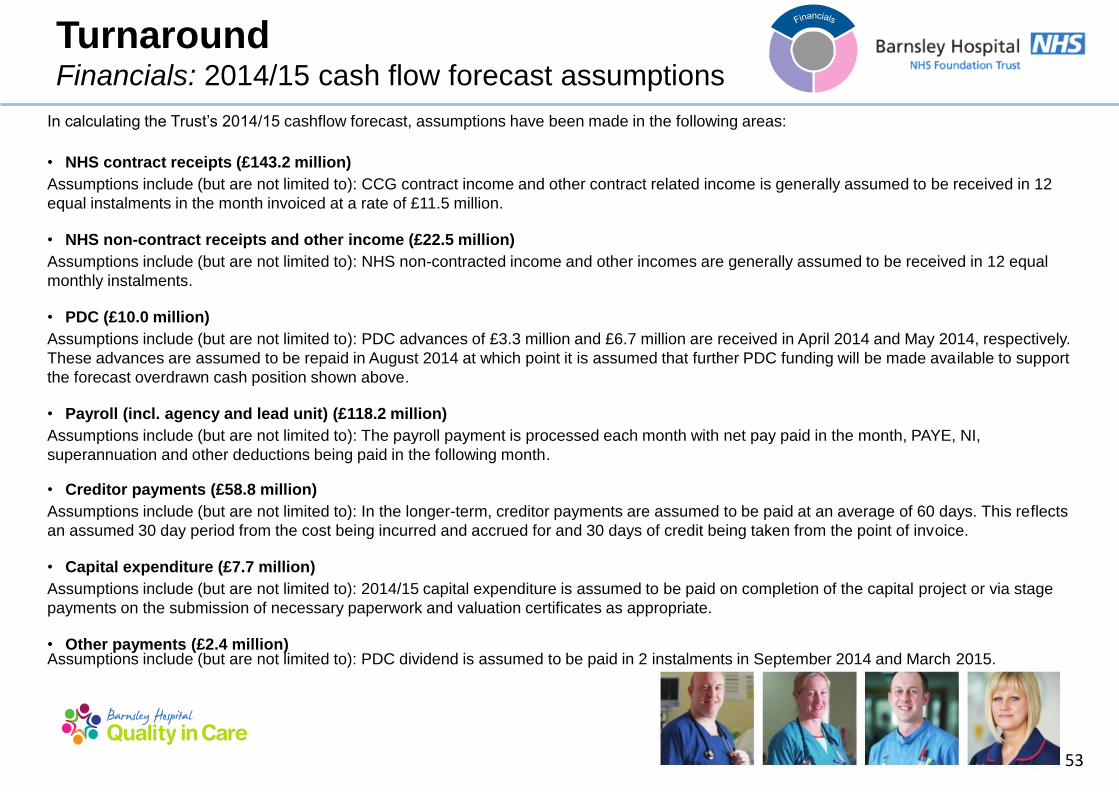
53
Turnaround Financials: 2014/15 cash flow forecast assumptions
In calculating the Trust‟s 2014/15 cashflow forecast, assumptions have been made in the following areas:
• NHS contract receipts (£143.2 million)
Assumptions include (but are not limited to): CCG contract income and other contract related income is generally assumed to be received in 12
equal instalments in the month invoiced at a rate of £11.5 million.
• NHS non-contract receipts and other income (£22.5 million)
Assumptions include (but are not limited to): NHS non-contracted income and other incomes are generally assumed to be received in 12 equal
monthly instalments.
• PDC (£10.0 million)
Assumptions include (but are not limited to): PDC advances of £3.3 million and £6.7 million are received in April 2014 and May 2014, respectively.
These advances are assumed to be repaid in August 2014 at which point it is assumed that further PDC funding will be made available to support
the forecast overdrawn cash position shown above.
• Payroll (incl. agency and lead unit) (£118.2 million)
Assumptions include (but are not limited to): The payroll payment is processed each month with net pay paid in the month, PAYE, NI,
superannuation and other deductions being paid in the following month.
• Creditor payments (£58.8 million)
Assumptions include (but are not limited to): In the longer-term, creditor payments are assumed to be paid at an average of 60 days. This reflects
an assumed 30 day period from the cost being incurred and accrued for and 30 days of credit being taken from the point of invoice.
• Capital expenditure (£7.7 million)
Assumptions include (but are not limited to): 2014/15 capital expenditure is assumed to be paid on completion of the capital project or via stage
payments on the submission of necessary paperwork and valuation certificates as appropriate.
• Other payments (£2.4 million) Assumptions include (but are not limited to): PDC dividend is assumed to be paid in 2 instalments in September 2014 and March 2015.

54
Turnaround Financials: 2015/16 forecast summary
Income and Expenditure
£‘million
2013/14
Actual
Baseline/
Run Rate 2014/15 2015/16
Income
Income from activities 147.2 143.5 149.3 147.3
Other income 22.5 15.7 15.7 14.9
Total income 169.7 159.2 165.0 162.2
Operating Expenses
Pay cost (115.8) (116.2)
(117.8) (112.4)
Non pay cost (52.8) (50.9) (51.1) (48.1)
Total operating expenses (168.6) (167.1) (168.9) (160.5)
EBITDA 1.1 (7.9) (3.9) 1.7
Depreciation and amortisation (6.3) (6.7) (5.8) (5.8)
Restructuring costs (0.2) - (0.3) (0.6)
Interest (0.1) (0.1) - -
PDC Dividend (1.9) (1.9) (1.9) (1.6)
ITDA (8.5) (8.7) (8.0) (8.0)
Total operating expenses (177.1) (175.8) (176.9) (168.5)
Net deficit pre-impairment (7.4) (16.6) (11.9) (6.3)
Impairment (2.5) - - -
Net deficit post-impairment (9.9) (16.6) (11.9) (6.3)

55
Turnaround Financials: 2015/16 cash flow forecast
Overview
• The forecast opening cash position is an overdraft of £18.9 million.
• The key monthly cash assumptions included within the LTCFF on average are:
− Contract based income £11.8 million;
− Other income of £1.6 million;
− Payroll and agency payments £9.4 million; and
− Non-pay payments of £4.1 million.
• The key assumptions in the 2015/16 cash forecast are the same as for 2014/15 (excluding any creditor arrears
assumptions).
Cash flow
£'million 2014/15 Forecast 2015/16 Forecast
Operating loss (11.9) (6.6)
Non-cash income and expenses (4.0) 8.5
Net cash flow from operating activities (15.9) 1.9
Cash flows from investing activities
Purchase of property, plant and equipment (3.5) (4.1)
Net cash outflow from investing activities (3.5) (4.1)
Cash flows from financing activities
Capital element of private finance (0.1) (0.2)
PDC dividend paid (1.9) (1.6)
Net cash outflow from financing activities (2.0) (1.8)
Decrease in cash and cash equivalents (21.4) (4.0)
Cash and cash equivalents at 1 April 2.5 (18.9)
Cash and cash equivalents at 31 March (18.9) (22.9)

56
Turnaround Financials: Key risks and sensitivities
Key risks and sensitivities have been identified around the Trust‟s financials, in the following key areas:
• 2014/15 CIPs - CIPs planned for delivery in year do not deliver either fully or partially, or the realisation of the saving is delayed.
Mitigation: Other CIP savings are advanced, either by being able to advance the delivery of an existing scheme or by advancing the delivery
of a current pipeline scheme. Other CIP savings over perform to plan.
• 2015/16 CIPs - CIPs planned for delivery in year do not deliver either fully or partially, or the realisation of the saving is delayed.
Mitigation: Other CIP savings are advanced, either by being able to advance the delivery of an existing scheme, by advancing the delivery of
a pipeline scheme or the development and delivery of a new scheme within year. Other CIP savings over perform to plan.
• CQUINs and Penalties - The Trust‟s delivery performance under its main contracts do not achieve the required levels as stated within the
contracts. This may result in the failure to achieve a CQUIN and the related income or a penalty may be incurred.
Mitigation: Prior to the signing of the contract with Barnsley CCG the CQUIN targets and penalty thresholds were negotiated to ensure they
are achievable.

57
Turnaround Financials: Key risks and sensitivities (continued)
• Activity/Tariff 2015/16 - The plan currently assumes a 1.5% reduction to contracted activity based income, primarily around an assumed
drop in tariff. Any tariff reduction greater then 1.5% or reduction to income due to lower activity levels in 2015/16 would reduce revenue
further.
Mitigation: Increase activity levels through the set up of shared service delivery for other Trusts. Increase income from other sources.
• Inflation on non-pay costs - Inflationary increases on non-pay beyond those assumed in the plan increase the Trusts cost base, e.g.
commodity market price increases result in increases to the cost of supplies to the Trust, such as utilities or drugs.
Mitigation: Procurement to work with suppliers and source new suppliers to remove cost increases, alternative products to be sourced,
usage levels to be reduced when possible.
• Non-recurrent income - Planned non-recurrent incomes from Barnsley CCG are not ultimately agreed with the CCG.
Mitigation: Unfunded non-recurrent activities are not continued or initiated.
• Funding costs - Funding is currently assumed through PDC with the associated estimation of the PDC dividend payable included within
the plan. Any other funding costs would impact to the planned deficit.
Mitigation: Use of alternative methods of funding.

58
Turnaround Financials: Opportunities
Area Opportunity description Potential benefit
CIPs CIPs planned for delivery in year deliver greater savings than planned. This could be due to
over performance of the schemes or savings being realised ahead of plan.
Any improvements to CIP savings would be a £ for £
benefit to the deficit in year. May also impact to
future years including higher full year effects.
Income Other sources of income can be brought to the Trust, either recurring or non-recurring. This
may include increases to private patient activity, R&D activities or provision of other services
from the Trust such as step-down care.
Any increases to income that can be delivered from
existing resources would be a £ for £ benefit to both
income and deficit.
Any increase to income requiring the addition of
existing levels of variable costs would be a £ for £
increase to income and a benefit to deficit at an
approximate variable contribution of 33%, e.g. a
£0.7 million income increase would be a benefit to
deficit of c.£0.2 million.
Overall Health
Economy –
Locally and
Nationally
Decisions within the local or national health economy that improve the incomes or costs of
the Trust are a potential benefit. These may include:
- Local Government & Council policy changes and service movements
- Primary care changes
- Health and Wellbeing Board
- Better Care Fund
- Working Together
- Macro political changes including a change in government
Cannot be estimated at this stage.

Turnaround Savings schemes
60
Turnaround Savings schemes: Summary
• The Trust is using a model called a four stage maturity model in order to assess and then assure the delivery of its CIP schemes (level 4 being
fully assured)
• The Project Management Office (PMO) is responsible for governing the delivery of CIPs, working with the CBUs and departments to support
the delivery of CIPs and reporting through the CIP Steering Group and in to the Finance and Performance Committee
• In 2014/15 CIPs are assumed to deliver in year £6.3 million of savings
• Over 40 pipeline CIP schemes are in the process of being developed, these can either:
– increase the level of CIP savings delivered in year and carried forward to 2015/16;
– to mitigate the impact of any existing schemes which may not deliver the full savings planned;
– Support the CIP savings planned for 2015/16.
• In 2015/16 a further £6.0 million (4.3%) of CIP savings are planned to be delivered in year. Plans are in the process of being developed to
support this.

61
Turnaround Savings schemes: Benefit timings
Summary
• The Trust has identified £8.8 million worth of cost improvements for 2014/15 to 2015/16, leaving £7.8 million to be identified.
• The schemes identified have been split into three areas: Frontline Clinical, Workforce and Support Services.
• There are a number of pipeline schemes that have been identified but are yet to have completed project overview documents (PODs).
Such schemes include pathway redesign in outpatients.
• Once schemes have PODs, including costs and start dates, they will be included in the Trust‟s tracker and benefits will be tracked.
Timeline
CIP (£’000) 2014/15 2015/16
Q1 Q2 Q3 Q4 Q1 Q2 Q3 Q4 Total (£)
Front Line Clinical 175 375 901 904 729 529 3 - 3,616
Workforce 294 361 1,040 1,040 501 476 - - 3,711
Support Services 260 274 344 374 114 100 30 - 1,497
729 1,010 2,285 2,318 1,344 1,105 33 - 8,823

62
Saving schemes Summary of WTE impact
Below is a summary of the main schemes which make up the 2014/15 Whole Time Equivalent (WTE) reductions.
Vacancy control panel
• The Trust operates a vacancy control panel process. All vacancies must be approved by the panel (senior directors, weekly)
prior to the post being advertised. The process is used to drive workforce policy such as use of apprentices as an alternative
in Band 2 posts, and reduction of hours from 37.5 per week to 30 hours in support of the 1% vacancy and reduced hours
CIPs. Any post held at panel cannot be backfilled with temporary or agency staff.
Closure of Wards/Beds – organisational change
• A large part of the 2014/15 workforce plan is based on the closure of a Ward and a reduction of two further wards or
equivalent beds.
• Ward 29 closed on 1 April 2014, resulting in a reduction of 19 WTE nursing posts. The closure of two further wards equates
to 68.4 nursing posts, two therapy posts and one clerical posts and reducing bank and agency.
• Staff currently in these posts have been and will be redeployed in active vacant posts across the Trust.
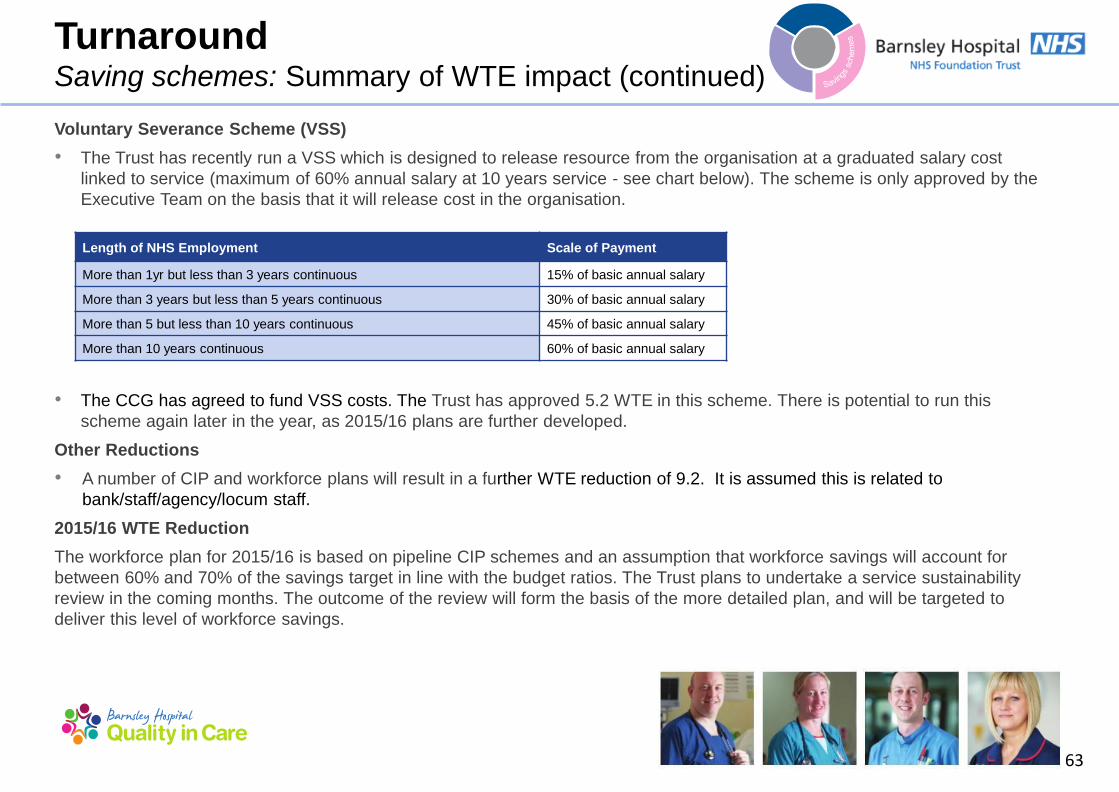
63
Voluntary Severance Scheme (VSS)
• The Trust has recently run a VSS which is designed to release resource from the organisation at a graduated salary cost
linked to service (maximum of 60% annual salary at 10 years service - see chart below). The scheme is only approved by the
Executive Team on the basis that it will release cost in the organisation.
• The CCG has agreed to fund VSS costs. The Trust has approved 5.2 WTE in this scheme. There is potential to run this
scheme again later in the year, as 2015/16 plans are further developed.
Other Reductions
• A number of CIP and workforce plans will result in a further WTE reduction of 9.2. It is assumed this is related to
bank/staff/agency/locum staff.
2015/16 WTE Reduction
The workforce plan for 2015/16 is based on pipeline CIP schemes and an assumption that workforce savings will account for
between 60% and 70% of the savings target in line with the budget ratios. The Trust plans to undertake a service sustainability
review in the coming months. The outcome of the review will form the basis of the more detailed plan, and will be targeted to
deliver this level of workforce savings.
Length of NHS Employment Scale of Payment
More than 1yr but less than 3 years continuous 15% of basic annual salary
More than 3 years but less than 5 years continuous 30% of basic annual salary
More than 5 but less than 10 years continuous 45% of basic annual salary
More than 10 years continuous 60% of basic annual salary
Turnaround Saving schemes: Summary of WTE impact (continued)

64
Area Risk Mitigation
People
Skillset of employees to be redeployed does
not match that required of vacant positions
• £100,000 built into 2015/16 to fund the re-training of redeployed staff
into vacant posts. Any additional training requirements in 2014/15
will be met from the Trust‟s established training budget.
• Contingency built into the 2014/15 plan of £350,000 and 2015/16
plan of £600,000 to mitigate against any additional restructuring
costs. WTE reductions for 2015/16 identified in 2014/15 will enable
any recruitment to take place on a fixed-term contract basis, so that
posts can be released without incurring additional costs in 2015/16.
Proposed workforce changes relating to terms
and conditions leads to difficulties in
recruiting and retaining key skills in the Trust.
• Resourcing manager appointed to the Trust in June 2014, to plan
proactive recruitment campaigns to match Trust requirements.
• The Trust has a comprehensive workforce development plan which
will support succession planning in the Trust, retaining key skills,
knowledge and experience.
Turnaround Saving schemes: Workforce delivery risks

65
Turnaround Service review and redesign: Overview
• As stated on previous pages, in year two of the plan, the Trust anticipates to save a further £1.6 million (FYE £3.3 million) through
additional CIPs and strategic service review and redesign.
Service review and redesign
• The Trust recognises that the CIPs identified to date are unlikely to provide sufficient savings to bridge the existing deficit and assumed
some year two savings will be achieved from service review and subsequent redesign.
• The Trust is currently working on the detailed scope of a service sustainability review and the timeline, however, the process is likely to
include the following:
– clinical, financial and operational sustainability analysis, including assessment of the Trust‟s position against key clinical and
performance indicators;
– longlist options development for existing services, supported by clinical working groups;
– this phase will include assessment of the opportunities for collaboration and partnerships;
– shortlist development;
– engagement with key strategic partners, including Barnsley CCG, local authorities and provider organisations;
– drafting of the 5-year plan required for Monitor.
• The Trust currently anticipates that the service review and redesign, including drafting of the 5-year plan may take a minimum of 17
weeks.

Turnaround Delivery – PMO

67
Turnaround CIP Management and PMO: Summary
• The Trust has worked closely with KPMG to build on what was in place, identify any gaps in structure, approach and governance and to
ensure recommended changes were made.
• The Trust‟s intention is that it‟s newly established six CBUs have the lead responsibility for identifying and delivering cost improvements
and that they are well supported in this by the Trust‟s corporate functions such as Finance and HR. In addition, substantial support,
particularly in the initial stages of the Trust‟s cost improvement programme, is provided by a central PMO team.
• The PMO team‟s role is to accelerate the identification of opportunities, to share good practice across the Trust, and to ensure
organisational grip of the monitoring and delivery of CIP.
• A CIP tracker pulling together all the phased initiatives has been devised, populated and continues to be maintained. Performance
against the tracker will be reviewed at the monthly CIP steering group, the monthly CBU performance meetings and Finance &
Performance Committee.
• The roles and responsibilities for CBUs are clearly defined and communicated to the team. The new CBU leads were specifically chosen
based on their commitment to turnaround and CIP delivery.
• The Trust recognises that whilst not all key staff are in place, transitional arrangements have been made and communicated, with a fully
staffed CBU structure to be in place by September 2014.

68
Turnaround Delivery: PMO Introduction
Trust’s approach to driving cost improvement
• The cost improvements required by the Trust to deliver the
Turnaround Plan cannot be delivered without significant changes
to how the Trust works.
• This level of service redesign can only take place when cost
improvement is the responsibility of all teams and staff within the
Trust.
• Clinical and operational staff from across the CBUs and staff from
supporting areas such as Finance, HR, Information and Quality
will work together to drive improvement and will all have key parts
to play in identifying, developing, implementing and monitoring
CIPs.
PMO support for CIP
• The PMO team consists of project managers with experience of
delivering change projects.
• The PMO team has already been involved in gathering cost
improvement ideas from across the Trust, reviewing and
analysing these ideas before structuring them into a set of
coherent cost improvement projects.
• The PMO team has worked with the CIP scheme owners
nominated by CIP executive leads in order to develop the
projects into project overview documents, which represent „level
2‟ maturity savings opportunities.
• The PMO will continue to provide support to the CIP scheme
owners to develop and validate new and existing cost
improvement opportunities. In addition, they will have a key role
in monitoring the development and implementation of the full
range of schemes. This will encompass tracking the realisation
of benefits, escalation of risks and identification of risks and
decisions required, all of which will be reported up to the Trust‟s
CIP steering group on a monthly basis.
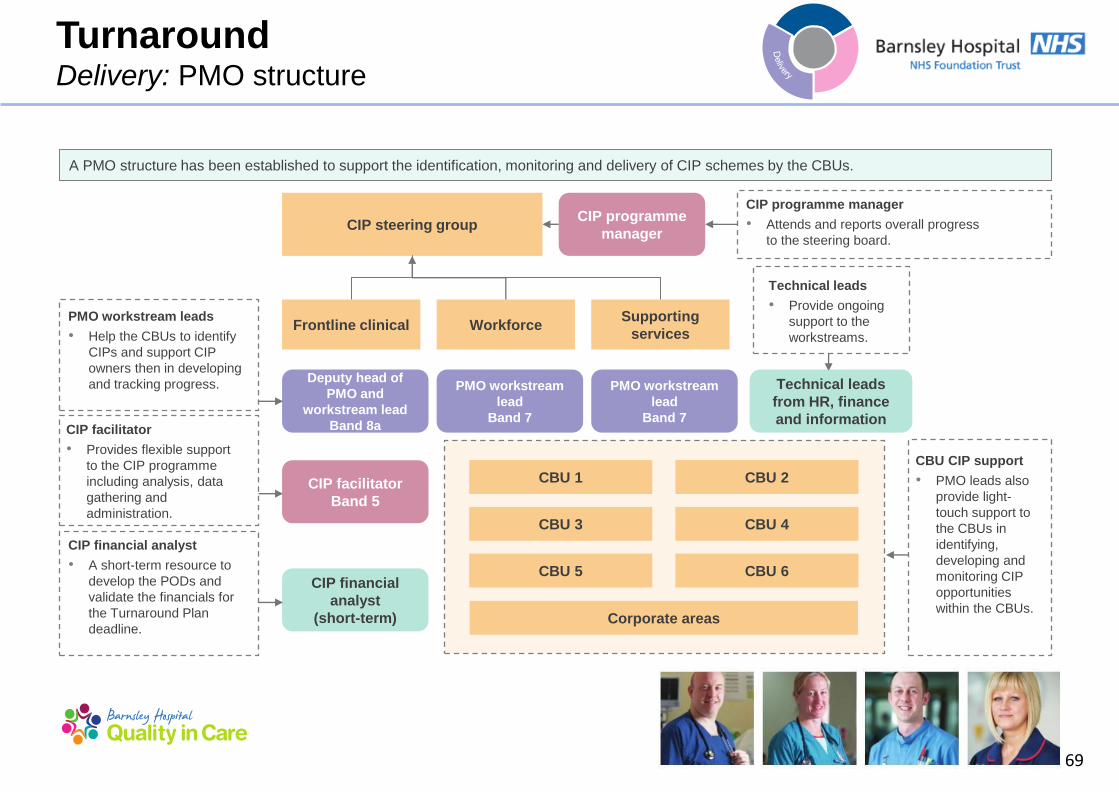
69
CIP financial analyst
• A short-term resource to
develop the PODs and
validate the financials for
the Turnaround Plan
deadline.
CIP steering group
CBU 1 CBU 2
CBU 3 CBU 4
CBU 5 CBU 6
Frontline clinical Workforce Supporting
services
Deputy head of
PMO and
workstream lead
Band 8a
PMO workstream
lead
Band 7
PMO workstream
lead
Band 7
CIP programme
manager
CIP facilitator
Band 5
CIP financial
analyst
(short-term)
CIP programme manager
• Attends and reports overall progress
to the steering board.
PMO workstream leads
• Help the CBUs to identify
CIPs and support CIP
owners then in developing
and tracking progress.
CIP facilitator
• Provides flexible support
to the CIP programme
including analysis, data
gathering and
administration.
CBU CIP support
• PMO leads also
provide light-
touch support to
the CBUs in
identifying,
developing and
monitoring CIP
opportunities
within the CBUs.
Technical leads
from HR, finance
and information
Technical leads
• Provide ongoing
support to the
workstreams.
Turnaround Delivery: PMO structure
A PMO structure has been established to support the identification, monitoring and delivery of CIP schemes by the CBUs.
Corporate areas

70
Turnaround Delivery: CBU governance
• The Quarter 1 2014/15 transition from 14 CSUs to six CBUs will bring more robust governance arrangements, with a number
of clinical services, such as pharmacy and theatres, previously not included in the CSU structure now being part of the CBU
teams.
• The aim of the new structure is to have fewer, but better supported, units that are better connected to the Board and to the
teams who care for patients, families and carers.
• There is robust, formal performance management running through the CBU structure, ultimately linking the ward to the Board.
Each CBU is held accountable for their performance in terms of both quality and finance.
• The key objectives of performance management for the Trust are:
– regular reporting to the Board;
– facilitation of the management team‟s role of ensuring progress and identifying corrective action;
– risk management;
– informing of priorities for management action, developments and finance;
– improving performance linked to benchmarking and other areas; and
– providing input for the appraisal and development process in regard to training and skills development.
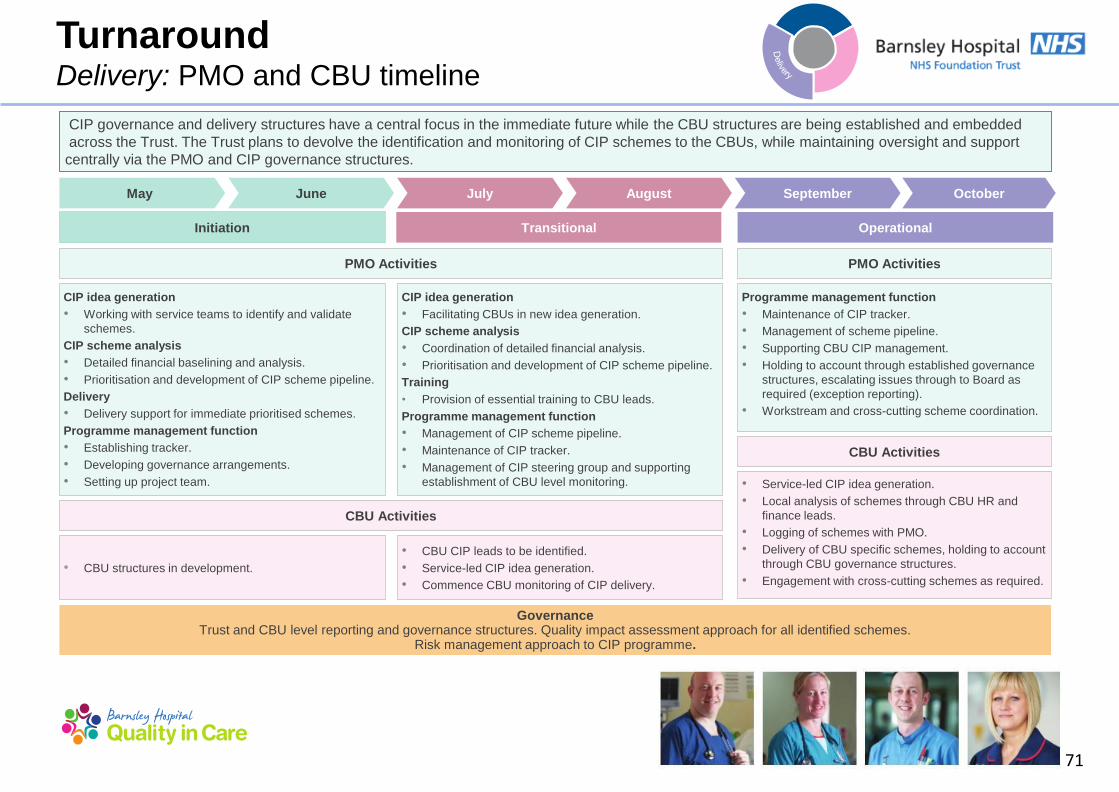
71
• Service-led CIP idea generation.
• Local analysis of schemes through CBU HR and
finance leads.
• Logging of schemes with PMO.
• Delivery of CBU specific schemes, holding to account
through CBU governance structures.
• Engagement with cross-cutting schemes as required.
Programme management function
• Maintenance of CIP tracker.
• Management of scheme pipeline.
• Supporting CBU CIP management.
• Holding to account through established governance
structures, escalating issues through to Board as
required (exception reporting).
• Workstream and cross-cutting scheme coordination.
CIP idea generation
• Working with service teams to identify and validate
schemes.
CIP scheme analysis
• Detailed financial baselining and analysis.
• Prioritisation and development of CIP scheme pipeline.
Delivery
• Delivery support for immediate prioritised schemes.
Programme management function
• Establishing tracker.
• Developing governance arrangements.
• Setting up project team.
CIP idea generation
• Facilitating CBUs in new idea generation.
CIP scheme analysis
• Coordination of detailed financial analysis.
• Prioritisation and development of CIP scheme pipeline.
Training
• Provision of essential training to CBU leads.
Programme management function
• Management of CIP scheme pipeline.
• Maintenance of CIP tracker.
• Management of CIP steering group and supporting
establishment of CBU level monitoring.
• CBU structures in development.
• CBU CIP leads to be identified.
• Service-led CIP idea generation.
• Commence CBU monitoring of CIP delivery.
Governance Trust and CBU level reporting and governance structures. Quality impact assessment approach for all identified schemes.
Risk management approach to CIP programme.
May September July October August June
Initiation Transitional Operational
PMO Activities PMO Activities
CBU Activities
CBU Activities
Turnaround Delivery: PMO and CBU timeline
CIP governance and delivery structures have a central focus in the immediate future while the CBU structures are being established and embedded
across the Trust. The Trust plans to devolve the identification and monitoring of CIP schemes to the CBUs, while maintaining oversight and support
centrally via the PMO and CIP governance structures.
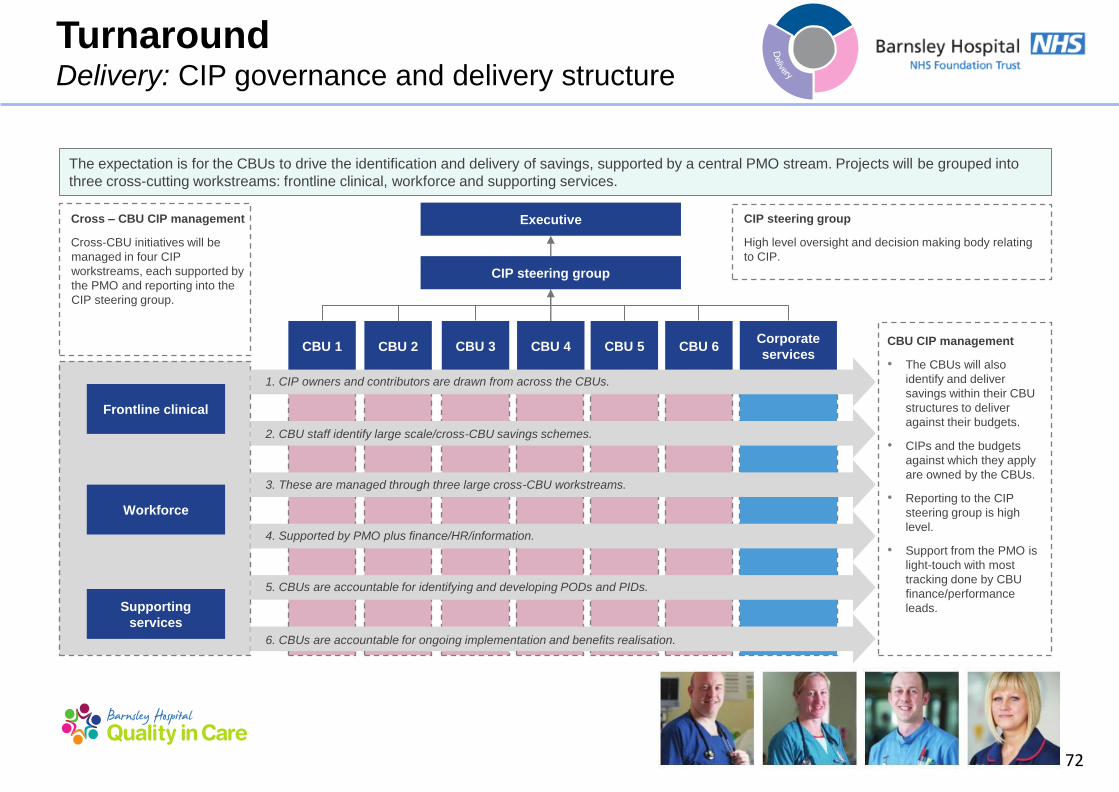
72
Corporate
services CBU 6 CBU 5
Executive
CIP steering group
CBU 1 CBU 2 CBU 3 CBU 4
Frontline clinical
Workforce
Supporting
services
1. CIP owners and contributors are drawn from across the CBUs.
2. CBU staff identify large scale/cross-CBU savings schemes.
4. Supported by PMO plus finance/HR/information.
6. CBUs are accountable for ongoing implementation and benefits realisation.
5. CBUs are accountable for identifying and developing PODs and PIDs.
3. These are managed through three large cross-CBU workstreams.
CBU CIP management
• The CBUs will also
identify and deliver
savings within their CBU
structures to deliver
against their budgets.
• CIPs and the budgets
against which they apply
are owned by the CBUs.
• Reporting to the CIP
steering group is high
level.
• Support from the PMO is
light-touch with most
tracking done by CBU
finance/performance
leads.
Cross – CBU CIP management
Cross-CBU initiatives will be
managed in four CIP
workstreams, each supported by
the PMO and reporting into the
CIP steering group.
CIP steering group
High level oversight and decision making body relating
to CIP.
Turnaround Delivery: CIP governance and delivery structure
The expectation is for the CBUs to drive the identification and delivery of savings, supported by a central PMO stream. Projects will be grouped into
three cross-cutting workstreams: frontline clinical, workforce and supporting services.

73
Turnaround Delivery: CIP roles and responsibilities
We have established clear structures for delivering the cost improvement programme. Roles and responsibilities of the structures are described below.
CIP management structure Role and responsibilities
CIP steering group • Senior decision-making group for the entire CIP programme. • Accountable to the Finance & Performance Committee. • Manages risk. • Unblocks issues.
CBU CIP management • Identifies, manages and monitors CIP savings schemes within each CBU. • Fits within the existing CBU management structures and meetings.
Cross-CBU CIP management • Identifies, manages and monitors CIP savings schemes that cut across CBUs. • Need to establish cross-CBU working groups.

74
Turnaround Delivery: PMO workstreams
Identified cost improvement schemes have been allocated to one of three high level workstreams. These three workstreams group the various
schemes according to the main theme being addressed: front-line clinical services, workforce, and support services. Each of these
workstreams has an executive level sponsor, and designated PMO support. Operational and clinical leads will vary according to service area, and the
PMO will be responsible for identifying interdependencies within and across workstreams.
Frontline Clinical Workforce Support Services
Sponsor Karen Kelly, Director of Operations.
Hilary Brearley, Director of HR and
Organisational Development.
Bob Kirton, Director of Strategy and
Business Development.
Description The front-line clinical workstream
includes any schemes relating to
changes in the direct delivery of
patient care.
This workstream covers schemes
involving changes in workforce or
workforce management.
The support services and procurement
workstream includes schemes linked
to non-clinical support services and
procurement initiatives.
Schemes • Outpatients transformation.
• Theatres efficiency.
• Diagnostics review.
• Reducing bed days.
• Medicines management.
• Nursing skill-mix review.
• Improved absence management through e-rostering.
• Temporary staffing.
• Disclosure barring service.
• Activity based job planning.
• Non-NHS income generation.
• Paperless strategy.

75
Maturity level 1 Maturity level 2 Maturity level 3 Maturity level 4
Cri
teri
a
• An opportunity to reduce
cost and/or increase
revenue has been
identified.
• „Programme lead‟
identified (at this early
stage, this will be
whomever identified the
opportunity or their
nominated deputy).
• PMO review and
approval to proceed.
• A statement of the
proposed change and
desired outcomes has
been defined.
• Outline plan has been
developed.
• Financial and workforce
impact has been
developed.
• Basis of assumptions/
benchmarks have been
identified to support the
initiative/scheme.
• All key project roles
(project/ programme
lead, clinical lead and
SMT lead as well as
finance and HR leads)
identified and agreed
with the SMT lead.
• POD produced to support
the idea and capture the
above, and POD
submitted for QIA review.
• Completed first full draft of
PID template, and
submitted to PMO for
review.
• Detailed project plan sets
out key milestones in PID.
• Initial engagement with
clinical, finance and HR
leads has been completed.
• Saving/income has been
evaluated, with phasing
identified and the impact on
outturn and budgets
identified. This should
include alignment of
expected savings values
between finance and
programme leads.
• Valuation is supported by
robust evidence.
• PID submitted for full QIA.
• Engagement with programme lead,
focused on the practical steps
required to complete the project,
culminating in a completed PID that is
reflective of a realistic and achievable
project.
• Clinical engagement and sign-off to
ensure that the key clinical risks have
been identified, captured, assessed,
that mitigating actions have been put
in place where necessary via the
completed QIA.
• Additional clinical engagement has
been built into the delivery plan as
required.
• Liaison with project finance lead to
confirm valuation of net financial
savings (including cash and divisional
budget impact), and with the
contracting team to validate income
where necessary.
• Engagement with HR lead to ensure
workforce impact has been agreed,
given the assumptions listed in the
POD and implications understood and
incorporated into planning.
Turnaround Delivery: CIP maturity model
Imple-
mentation
and robust
monitoring
of delivery
The Trust has adopted a maturity model methodology for the development of CIP schemes. This methodology ensures there are clear requirements for
each scheme in terms of financial and quality analysis, and project planning and documentation, prior to the scheme being implemented.

76
Turnaround Delivery: CIP planning process
Cost
improvement
planning process
Trust and CBU
level
idea generation
Financial
and quality
impact
analysis
Schemes
approved
through
QIA
Benefits tracking
and realisation
Financial
gap
or cost
improve-
ment
target
identified
by finance
team
• The Trust recognises the need to maintain an effective cost
improvement planning process. This requires:
– advance identification of cost improvement targets;
– managed idea generation process;
– robust feasibility, financial and quality assessment; and
– ongoing benefits tracking and realisation.
• The diagram on the left outlines the planning process.
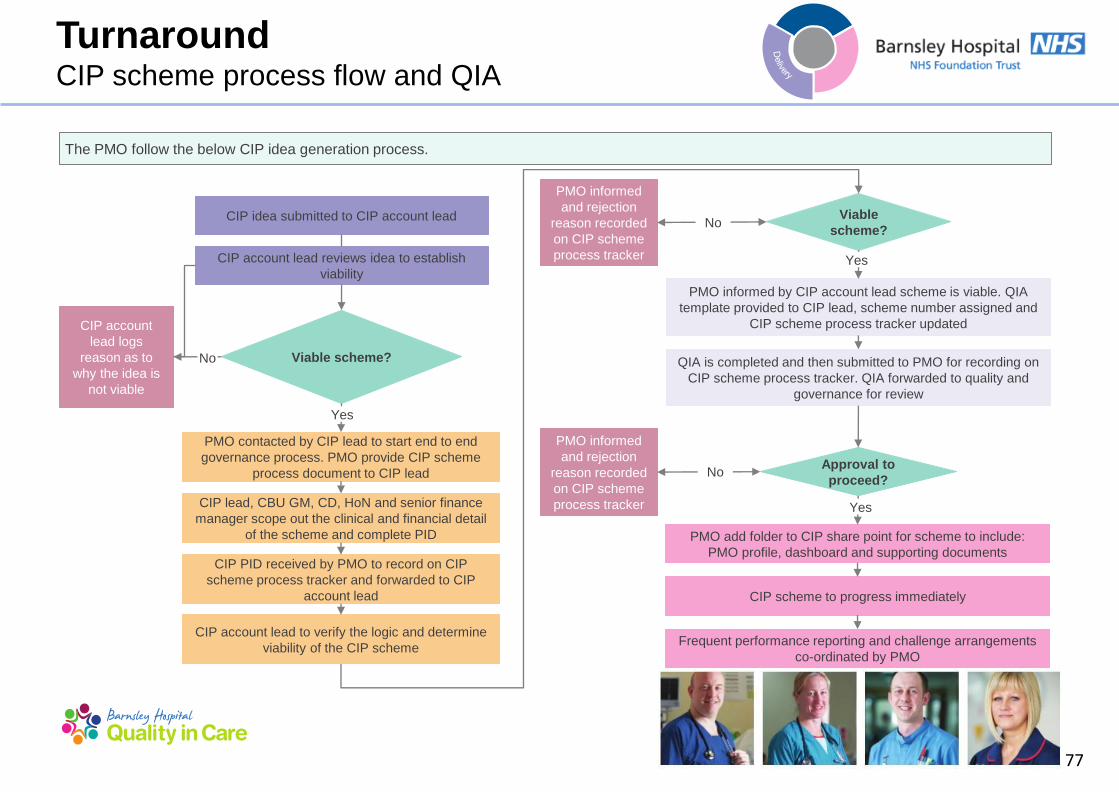
77
Turnaround CIP scheme process flow and QIA
The PMO follow the below CIP idea generation process.
CIP idea submitted to CIP account lead
CIP account lead reviews idea to establish
viability
PMO contacted by CIP lead to start end to end
governance process. PMO provide CIP scheme
process document to CIP lead
CIP lead, CBU GM, CD, HoN and senior finance
manager scope out the clinical and financial detail
of the scheme and complete PID
CIP PID received by PMO to record on CIP
scheme process tracker and forwarded to CIP
account lead
CIP account lead to verify the logic and determine
viability of the CIP scheme
Viable scheme?
CIP account
lead logs
reason as to
why the idea is
not viable
No
Yes
PMO informed by CIP account lead scheme is viable. QIA
template provided to CIP lead, scheme number assigned and
CIP scheme process tracker updated
QIA is completed and then submitted to PMO for recording on
CIP scheme process tracker. QIA forwarded to quality and
governance for review
PMO add folder to CIP share point for scheme to include:
PMO profile, dashboard and supporting documents
CIP scheme to progress immediately
Frequent performance reporting and challenge arrangements
co-ordinated by PMO
Viable
scheme?
PMO informed
and rejection
reason recorded
on CIP scheme
process tracker
Approval to
proceed?
PMO informed
and rejection
reason recorded
on CIP scheme
process tracker
No
No
Yes
Yes

78
Turnaround CIP scheme process flow and QIA
The PMO follow the Quality Impact Assessment (QIA) process set out below.
Reviewed by QIA review team (Medical Director, Head of Nursing and Head of Quality
and Governance)
QIA received by quality and governance team
Full QIA reviewed and revised by CBU/CIP
lead
Revised QIA re-reviewed by QIA review
team
CBU/CIP lead to monitor any associated
risks and mitigation at least monthly
Regular updates to QSIEB
Decision of QIA
review
Accept Reject

Turnaround Delivery – Governance
80
Delivery Governance
Governance Overview
• The Trust has undertaken an review of its governance structure in respect of implementation of a more robust budget setting process. The Trust
has reviewed the findings and recommendations and is undertaking actions. The following areas have been identified as those which should be
addressed to improve the governance arrangements within the Trust:
– scrutiny and challenge;
– stakeholders;
– adequacy and sufficiency of information;
– level of assurance;
– risk identification and mitigation;
– capacity of the finance team;
– budget setting process; and
– financial processes.
• The actions and the timetable will be reviewed on regular basis and closely monitored by the Board. The relevant committee will be responsible
for monitoring delivery of findings and recommendations
• The Trust is also undertaking a capacity, skill and capability review of the Board to ensure that the Trust is able to deliver the Turnaround Plan.
Recommendations and a plan to address any gaps will be finalised by the end of August.
• The Trust is currently in the process of implementing new governance arrangements for the approval of revenue and capital investment
proposals and business cases. This process will include clear identification of authorisation levels throughout the Trust. A formal process flow will
be created for the facilitation of all new revenue and capital proposals and business cases. This will be facilitated by the PMO. These
arrangements will cover; capital investment; approval of project proposals and business cases; authorisation of contract award post-
procurement; and review of benefits reports from completed projects.

Turnaround Delivery – Stakeholders

82
Turnaround Delivery: Stakeholders overview
External stakeholder engagement
• Good external communication is fundamental to the effective
management of the Trust‟s reputation. The Trust has taken steps
to ensure external stakeholders remain up to date with the Trust‟s
situation through various channels. Key stakeholders include:
– Monitor;
– patients;
– Partner organisations;
– Barnsley CCG; and
– MPs.
Internal stakeholder engagement
• Internal stakeholders are primarily Trust employees, Trust
Governors and Unions, who are informed of the Trust‟s position
and engaged in a timely and regular manner.
• Clarity and consistency of information has been crucial in
ensuring staff understand the Trust‟s financial position,
performance against the A&E 4 hour target, actions of regulators
and other parties and in ensuring they are aware of likely media
coverage where possible.
Trust’s overall aims for the communications and engagement
plan
• Positively manage the process of raising awareness and
engaging Trust‟s staff, partner organisations, patients and wider
community in implementing the Turnaround Plan.
• Through this shared understanding, ensure the Turnaround Plan
has a positive impact on public confidence and that Trust‟s
reputation as a provider of quality services and care is
proactively managed throughout.
• Ensure communications and engagement activity links with
Trust‟s Strategic Communications and Engagement Framework
• Support the proactive management of a change in staff, patient
and public understanding in relation to Trust‟s financial situation
and in relation to the pressures on the ED.
Stakeholders Overview
Good external communication is fundamental to the effective management of the Trust‟s reputation. The Trust has taken steps to ensure external
stakeholders remain up-to-date with the Trust‟s situation through various channels. Details of key stakeholders and the individual
communication plans can be found in Appendix 3.

83
Turnaround Delivery: Stakeholders overview (continued)
Key objectives for the communications and engagement plan
• Create understanding and support (through awareness of staff and key external stakeholders) about the need for and implications of the
Turnaround Plan.
• Manage the expectation of staff and stakeholders regarding future investment in and development of services and provide clarity of any
changes required to deliver the Turnaround Plan.
• Sustain staff morale and retain the good will and dedication of colleagues through genuine two-way communication channels.
• Support the focus on continuing to deliver quality care alongside the Turnaround Plan as well as ensuring statutory responsibilities in
relation to internal and external consultation and scrutiny are met.
Trust’s key messages
• The need for change on how the Trust operates and delivers services.
• Reassurance that patient safety and quality care are the highest priorities.
• The Trust is committed to being part of a local NHS, which is both modern and sustainable.
• A clear explanation of the rationale, details and timescales behind every service change.
• Action the Trust has taken to date and its benefits to patients and staff.

84
Turnaround: Communications Stakeholder management to date
Stakeholder Summary of engagement activity, March to May 2014
MPs • Regular written briefings.
• MP meeting with Chairman and CEO.
• Liaison with MPs in respect of media statements and their own media stance.
Barnsley CCG • A range of regular meetings, written briefings and updates.
Patients and the
public
• Proactive engagement of local media to ensure timely delivery of key messages.
• Targeted CEO column in the Barnsley Chronicle requesting patient feedback, all of which has been responded to by the
CEO.
Royal College of
Midwives
• Regular, timely written briefings.
Royal College of
Nursing
• Regular, timely written briefings.
External partners • Regular, timely written briefings.
Trust Council of
Governors
• Bi-monthly meetings and sub-committees attended by members of the Board.
• Regular written briefings at key stages and advance notification of media coverage.
Trust Membership • Updated via Barnsley Hospital News, media coverage and through governors.
Monitor • Weekly contact calls with KPMG, CEO and DoF.
• Trust Board presentation to Monitor 15 April 2014.
• Ongoing contact between CEO and Monitor.
• Regular contact with the communications function.
External stakeholder engagement
Summary of key external stakeholder briefings during the period from March to May 2014.

85
Turnaround: Communications Stakeholder management to date (continued)
Stakeholder Summary of engagement activity, March to May 2014
All Trust Staff • Regular written briefings from the CEO and Chairman.
• Face-to-face briefings, attended by the CEO, Chairman and Board members.
• A range of two-way communication channels, asking for staff input, feedback and ideas.
• Weekly e-bulletin and monthly CEO team brief restructured to ensure performance updates (operational and
financial) are standard and prioritised from April. Specific emails to managers in respect of actions to take.
Medical Staffing
Committee
• Monthly attendance by CEO.
• Monthly written briefings.
Trade Unions • Weekly and monthly meetings, regular written briefings.
• Collective consultation on organisational change.
Stakeholder Summary of engagement activity, March to May 2014
NHS England Regional
Team
• Regular written briefings to the communications function in advance of anticipated media coverage.
NHS Yorkshire & Humber
Communications Hub
• Regular written briefings to the communications function in advance of anticipated media coverage.
Internal stakeholder engagement
Summary of key external stakeholder briefings during the period from March to May 2014.

86
Turnaround: Communications Stakeholder management – communications plan
Internal channel Frequency/type Audience
CEO e-bulletin/All user emails Specific, focused email as required. All trust staff
Team brief Monthly event and information cascade. All trust staff
Quality catch up e-bulletin Weekly email. All trust staff
Intranet site 24/7 information. All trust staff
Join the conversation Monthly two-way engagement events. All trust staff
Medical staff committee Monthly meeting and paper briefing. Medics
Monthly leaders meeting Monthly, face-to-face. Senior leaders
Clinical summit Quarterly development sessions. Clinical leaders
Junior doctors forum Monthly, face-to-face, with the Medical Director. Junior doctors
Clinical director forum Monthly, face-to-face, with the Medical Director. All trust staff
Union meetings Weekly information meetings, monthly joint partnership forum meetings. Union reps
Communication email address
([email protected]) On all communications to encourage feedback from staff. All trust staff
How will the Trust communicate:
Our formal channels of communication are set out in detail in the Strategic Communications and Engagement Framework 2013 – 16 and Medical
Engagement Plan 2014/15, and include:

87
External Channel Frequency/type Audience
MP briefing Face-to-face, quarterly with CEO, Chairman and communications support. MPs
Internet site and NHS choices Online, up-to-date information. All
Barnsley Hospital news Quarterly membership magazine. Membership
Council of Governors briefing E-brief as required. Governors
Annual general meeting Annual, formal meeting. All
CEO Barnsley Chronicle Column Monthly local media column. All
Social media Trust Twitter and Facebook channels. All
Stakeholder briefings Ad-hoc written and face-to-face briefings as required. Partners
Suggestions box In the main hospital entrance. All
Communication email address
([email protected]) Promoted via all internal communications channels All
Turnaround: Communications Stakeholder management – communications plan (continued)

88
Turnaround: Communications Stakeholder management – communications plan (continued)
Media relations and reputation management
• The Trust has a responsibility to be open and transparent with external stakeholders and the relationship and activity with the media is
central to this.
• The Trust will seek to ensure maximum positive news coverage about the Trust and its services, ensuring a proactive approach to
sourcing potential stories and issuing media releases.
• When undertaking changes to services, the Trust will seek to engage the media to ensure reporting is accurate, timely and where
possible, contains key messages via publication of a statement from the Trust.
• The Trust will utilise the positive relationship with the Barnsley Chronicle to facilitate the delivery of important service-related information
to the wider general public.
• The Trust will seek feedback from the public via the monthly CEO column in the Barnsley Chronicle, ensuring this channel provides open
and transparent information to the public.
• Where the media may seek to publish negative coverage, the Trust will seek to ensure balance by providing a reactive statement for
publication.
• Wherever possible, the Trust will ensure the Board, staff and Governors are informed in advance of negative coverage.
• The Communications function will approve and monitor FOI requests from media sources.
89
Turnaround: Communications Stakeholder management – communications plan (continued)
Issues to be aware of:
• There is a need to engage positively with the media and to help them understand the reasons for changes.
• Changes to services will cause concern amongst patients, particularly where services affected are provided to vulnerable groups (such as
frail older people). If there are reductions in services (rather than changes or reconfigurations) the Trust needs to be clear about what
alternative services are available or what support routes can be accessed and publicise these widely.
• The decisions the Trust takes may impact on partner organisations and the trust needs to engage these organisations at the earliest
opportunity.
• The Trust must follow due process in terms of formal consultation. This is vital as it is the process which will be under scrutiny if any
individual or organisation seeks, for example, a judicial review of any decision taken by the Trust.
• During this time of organisational change, there may be anxiety and low morale amongst employees. The Trust‟s proactive approach of
leading by example and „walking the talk‟, with senior clinicians and directors going out into every area of the hospital to reinforce the
positive message about the value we place on staff will be vital in managing this.
• Formal communication channels are to be complemented by information cascade from the Executive down through the management
structure.