financial supplement 2009 | zurich financial services
TRANSCRIPT

Financial Supplement 2009Zurich Financial Services GroupResults for the Nine Months to September 30, 2009

Financial Information
Zurich Financial Services Group Results for the Nine Months to September 30, 2009Financial Supplement2
Contents
Financial highlights
Business operating profit by business segment 3
Adjusted business operating profit by business segment 4
Reconciliation of BOP to net income
after income taxes 4
Assets and liabilities by business segment 5
Additional information
Principal exchange rates 15
Currency translation impact on key financial figures 15
– General Insurance
– Global Life
Investment result 16
Details of investments by category 17
Equity securities (including trading equity portfolios in
capital markets and banking activities) 17
General Insurance
General Insurance
– Customer segment overview 6
– Revenues by region 7
– Assets by region 8
Customer segment reporting
– Europe General Insurance by region 9
– Europe General Insurance split into
Commercial and Personal 9
Customer segment reporting
– International Markets by region 10
– International Markets split into
Commercial and Personal 10
Information for the three months ended September 30
Business operating profit by business segment 18 Reconciliation of BOP to net income after income taxes 19
General Insurance – Customer segment overview 20
Global Life – Overview 21
Farmers – Overview 22
Global Life
Overview 11
Americas 12
Emerging markets in Asia 12
Rest of the world 13
Total investments 13
Reserves for life insurance contracts and liabilities
for investment contracts, net of reinsurance 13
Summary of quarterly consolidated financial information
Summary of quarterly consolidated financial information 27
Explanatory notes
Explanatory notes 28
Farmers
Overview 14
Results for the Nine Months to September 30, 2009 Financial Supplement (unaudited)
Information for the nine months ended September 30 – FX adjusted
Business operating profit by business segment
– FX adjusted 23
Assets and liabilities by business segment – FX adjusted 24
General Insurance –
Customer segment overview – FX adjusted 25
Global Life – Overview – FX adjusted 26

Financial Information
Zurich Financial Services Group Results for the Nine Months to September 30, 2009Financial Supplement3
Financial highlights (unaudited)
General Insurance Global Life Farmers
Other Operating
Businesses
Non-Core
Businesses Eliminations Total
2009 2008 2009 2008 2009 2008 2009 2008 2009 2008 2009 2008 2009 2008
Revenues Direct written premiums and policy fees 25,064 27,885 8,671 7,129 – – – (6) 395 278 (3) – 34,128 35,287Assumed written premiums 1,257 1,322 78 79 4,964 2,346 105 136 114 138 (181) (214) 6,338 3,807
Gross written premiums and policy fees 26,321 29,207 8,750 7,208 4,964 2,346 105 131 509 416 (183) (214) 40,465 39,094Less premiums ceded to reinsurers (4,077) (4,466) (553) (556) – – (41) (45) (25) (31) 183 214 (4,513) (4,884)
Net written premiums and policy fees 22,243 24,742 8,197 6,652 4,964 2,346 64 86 485 385 – – 35,952 34,210Net change in reserves for unearned premiums (557) (893) 35 29 (970) (1,091) 3 4 7 23 – – (1,482) (1,928)
Net earned premiums and policy fees 21,686 23,849 8,232 6,681 3,993 1,255 68 90 491 408 – – 34,470 32,282Farmers management fees and other related revenues – – – – 1,973 1,831 – – – – – – 1,973 1,831Net investment result on Group investments 2,377 2,804 3,007 2,848 130 121 271 411 335 246 (650) (766) 5,471 5,664
Net investment income on Group investments 2,297 2,847 3,013 3,319 130 121 331 415 448 599 (650) (766) 5,569 6,534Net capital gains/(losses) and impairments on Group investments 80 (44) (6) (471) – – (60) (3) (113) (353) – – (99) (871)
Net investment result on unit-linked investments – – 9,240 (15,707) – – – – 686 (1,918) – – 9,927 (17,625)Other income 499 540 547 893 63 13 880 780 128 66 (879) (950) 1,237 1,341Total BOP revenues 24,563 27,192 21,026 (5,285) 6,160 3,220 1,218 1,281 1,641 (1,199) (1,529) (1,716) 53,078 23,493
of which: intersegment revenues (257) (370) (166) (112) (69) (74) (978) (1,071) (60) (89) 1,529 1,716 – –Benefits, losses and expenses Insurance benefits and losses, net 15,489 17,506 7,521 5,675 2,759 898 5 73 1,057 488 – – 26,831 24,641
Losses and loss adjustment expenses, net 15,462 17,463 50 25 2,759 898 4 – 86 104 5 5 18,366 18,495Life insurance death and other benefits, net 27 42 7,152 6,758 – – 64 79 475 295 1 – 7,719 7,174(Decrease)/increase in future life policyholders’ benefits, net – 1 320 (1,107) – – (63) (6) 496 90 (6) (6) 747 (1,028)
Policyholder dividends and participation in profits, net 9 12 9,510 (15,193) – – – – 711 (1,827) – – 10,230 (17,008)Income tax expense/(benefit) attributable to policyholders – – 298 (966) – – – – – – – – 298 (966)Underwriting and policy acquisition costs, net 3,943 4,312 678 1,441 1,211 349 – – 6 8 (3) (2) 5,835 6,107Administrative and other operating expense (excl. depreciation / amortization) 2,361 2,447 1,279 1,351 980 881 617 765 129 (56) (842) (919) 4,524 4,469Interest credited to policyholders and other interest 24 167 304 402 – – 1 8 45 56 (10) (16) 365 618Restructuring provisions and other items not included in BOP (95) (150) (78) 539 (36) – 85 70 1 55 – – (123) 514Total BOP benefits, losses and expenses (before interest, depreciation and amortization) 21,731 24,294 19,512 (6,750) 4,915 2,128 709 917 1,950 (1,276) (856) (937) 47,960 18,376Business operating profit (before interest, depreciation and amortization) 2,833 2,898 1,514 1,465 1,245 1,093 509 363 (309) 77 (673) (779) 5,118 5,117Depreciation and impairments of property and equipment 48 45 25 32 52 48 25 24 9 2 – – 160 152Amortization and impairments of intangible assets 130 76 257 161 53 42 23 13 2 2 – – 465 294Interest expense on debt 152 178 71 21 7 7 760 870 112 152 (673) (779) 428 449Business operating profit before non-controlling interests 2,502 2,598 1,161 1,250 1,132 996 (298) (544) (433) (79) – – 4,065 4,221Non-controlling interests (6) 20 4 19 – – – (2) – – – – (1) 36Business operating profit 2,508 2,578 1,157 1,232 1,132 996 (298) (542) (433) (79) – – 4,066 4,185Supplementary information Additions and capital improvements to property, equipment and intangible assets 319 1,031 321 972 731 131 57 59 (1) 9 – – 1,427 2,201
in USD millions, for the nine months ended September 30Business operating profit by business segment
in USD millions, for the nine months ended September 30Business operating profit by business segment

Financial Information
Zurich Financial Services Group Results for the Nine Months to September 30, 2009Financial Supplement4
Financial highlights (unaudited)
General Insurance Global Life Farmers
Other Operating
Businesses
Non-Core
Businesses Total
2009 2008 2009 2008 2009 2008 2009 2008 2009 2008 2009 2008
Average allocated common shareholders’ equity 14,034 16,081 5,708 5,221 3,016 2,145 502 698 1,484 1,660 24,744 25,806Adjusted business operating profit 2,456 2,619 1,008 1,039 1,081 907 (15) (226) (464) (153) 4,066 4,185Adjusted BOP return on common shareholders’ equity 1 23.3% 21.7% 23.5% 26.5% 47.8% 56.4% (8.3%) (48.2%) (41.7%) (12.3%) 21.8% 21.5%BOPAT return on average allocated common shareholders’ equity 21.1% 17.4% 17.1% 20.5% 31.1% 36.8% (6.2%) (7.2%) (38.9%) (70.9%) 16.9% 16.4%
General Insurance Global Life Farmers
Other Operating
Businesses
Non-Core
Businesses Total
2009 2008 2009 2008 2009 2008 2009 2008 2009 2008 2009 2008
Business operating profit 2,508 2,578 1,157 1,232 1,132 996 (298) (542) (433) (79) 4,066 4,185Revenues/(expenses) not included in BOP:
Net capital gains/(losses) on investments and impairments, net of policyholder allocation (647) (695) (403) (247) (32) (8) (85) 35 21 (21) (1,146) (936)Net gain/(loss) on divestments of businesses (2) 14 – 4 – – – – (3) (2) (4) 16Restructuring provisions and other (95) (150) (78) 539 (36) – 85 70 1 55 (123) 514
Add back: Business operating profit attributable to non-controlling interests (6) 20 4 19 – – – (2) – – (1) 36Net income before shareholders’ taxes 1,759 1,766 680 1,545 1,064 988 (297) (438) (414) (47) 2,792 3,815Income tax expense attributable to policyholders – – 298 (966) – – – – – – 298 (966)
Net income before income taxes 1,759 1,766 977 579 1,064 988 (297) (438) (414) (47) 3,089 2,849Income tax expense (attributable to policyholders and shareholders) (924) 69
Net income after taxes 2,165 2,917
in USD millions, as of September 30Adjusted business operating profit by business segment
in USD millions, as of September 30Adjusted business operating profit by business segment
in USD millions, for the nine months ended September 30Reconciliation of BOP to net income after income taxes
in USD millions, for the nine months ended September 30Reconciliation of BOP to net income after income taxes

Financial Information
Zurich Financial Services Group Results for the Nine Months to September 30, 2009Financial Supplement5
Financial highlights (unaudited)
General Insurance Global Life Farmers
Other Operating
Businesses
Non-Core
Businesses Eliminations Total
09/30/09 12/31/08 09/30/09 12/31/08 09/30/09 12/31/08 09/30/09 12/31/08 09/30/09 12/31/08 09/30/09 12/31/08 09/30/09 12/31/08
Assets Total Group Investments 85,910 77,328 104,179 94,626 4,469 3,607 18,923 15,193 17,162 15,415 (29,669) (26,600) 200,975 179,570
Cash and cash equivalents 10,151 9,703 4,350 5,130 1,172 714 7,041 6,682 3,252 2,935 (13,644) (12,736) 12,321 12,428Equity securities 6,787 5,966 5,433 4,816 – 224 1,934 2,277 1,259 1,021 – – 15,413 14,303Debt securities 61,148 53,578 64,619 56,256 1,157 696 2,947 1,478 6,629 6,644 (365) (365) 136,136 118,287Real estate held for investment 3,076 2,922 4,459 4,228 160 156 46 44 180 175 – – 7,920 7,524Mortgage loans 1,614 1,794 9,179 8,953 – – – – 2,300 2,104 (33) (32) 13,060 12,820Other loans 3,107 3,340 16,017 15,131 1,980 1,817 6,952 4,708 3,462 2,459 (15,627) (13,468) 15,891 13,988Investments in associates 27 26 122 113 – – 3 3 81 78 – – 233 220
Investments for unit-linked contracts – – 82,281 65,977 – – – – 11,726 12,226 – – 94,007 78,203Total investments 85,910 77,328 186,460 160,604 4,469 3,607 18,923 15,193 28,888 27,641 (29,669) (26,600) 294,981 257,773Reinsurers’ share of reserves for insurance contracts 13,536 12,749 2,177 2,008 210 209 – – 4,780 5,477 (1,442) (1,849) 19,261 18,595Deposits made under assumed reinsurance contracts 67 68 2 – 2,764 1,685 – – 674 677 (33) (32) 3,473 2,397Deferred policy acquisition costs 3,433 3,247 12,101 10,768 550 307 – – 2 2 – – 16,085 14,323Deferred origination costs – – 817 770 – – – – – – – – 817 770Goodwill 1,033 895 448 395 776 382 5 5 – – – – 2,262 1,677Other intangible assets 1,419 1,303 4,101 3,925 1,355 1,207 214 185 9 13 – – 7,099 6,633Other assets 1 15,985 16,119 6,998 6,835 1,803 1,500 2,039 1,907 1,326 1,704 (2,192) (2,289) 25,959 25,776Total assets (after cons. of investments in subsidiaries) 121,382 111,710 213,104 185,304 11,927 8,897 21,181 17,290 35,679 35,514 (33,335) (30,771) 369,938 327,944Liabilities Liabilities for investment contracts – – 44,023 36,230 – – – – – – (250) (251) 43,773 35,979Reserves for insurance contracts, gross 81,727 77,468 135,717 120,706 3,774 2,095 386 415 22,327 23,325 (1,424) (1,831) 242,507 222,179
Reserves for losses and loss adjustment expenses, gross 64,173 61,396 44 18 1,544 835 49 44 3,457 4,147 (827) (1,223) 68,438 65,218Reserves for unearned premiums, gross 16,318 14,874 214 226 2,231 1,260 2 5 31 43 (9) (10) 18,787 16,399Future life policyholders’ benefits, gross 99 95 76,824 72,782 – – 336 366 4,043 3,573 (589) (598) 80,713 76,218Policyholders’ contract deposits and other funds, gross 1,137 1,102 14,839 12,611 – – – – 3,072 3,334 1 – 19,048 17,047Reserves for unit-linked contracts, gross – – 43,797 35,069 – – – – 11,723 12,228 – – 55,520 47,297
Debt related to capital markets and banking activities – – – – – – 553 – 3,114 3,632 (1,776) (1,106) 1,892 2,527Senior debt 4,003 3,031 651 694 – – 23,159 19,893 1,083 1,054 (22,524) (21,314) 6,372 3,358Subordinated debt 2,056 2,189 713 412 180 180 5,283 5,169 274 73 (3,299) (2,926) 5,207 5,096Other liabilities 16,679 14,680 18,120 15,399 1,790 1,582 1,682 2,707 5,655 3,999 (4,062) (3,344) 39,864 35,024Total liabilities 104,464 97,368 199,224 173,441 5,745 3,858 31,064 28,184 32,452 32,083 (33,335) (30,771) 339,614 304,163Equity Common shareholders’ equity 27,947 21,542Preferred securities 561 561Shareholders’ equity 28,508 22,103Non-controlling interests 1,815 1,678Total equity 30,323 23,781Total liabilities and equity 369,938 327,944
1 As of September 30, 2009, for the General Insurance segment, other assets include USD 72 million related to land and buildings held for own use reclassified as assets held for sale in March 2009.
in USD millions, as ofAssets and liabilities by business segment
in USD millions, as ofAssets and liabilities by business segment

Financial Information
Zurich Financial Services Group Results for the Nine Months to September 30, 2009Financial Supplement6
General Insurance (unaudited)
Global
Corporate
North
America
Commercial
Europe
General
Insurance
International
Markets
GI Global Functions
including Group
Reinsurance Eliminations Total
2009 2008 2009 2008 2009 2008 2009 2008 2009 2008 2009 2008 2009 2008
Gross written premiums and policy fees 5,999 6,293 7,553 8,456 11,214 12,857 1,992 2,094 361 388 (800) (881) 26,321 29,207Net earned premiums and policy fees 3,589 3,852 6,286 6,909 10,290 11,502 1,489 1,539 32 46 – – 21,686 23,849Insurance benefits and losses, net 2,773 3,471 4,360 5,026 7,506 8,169 916 942 (65) (102) – – 15,489 17,506Policyholder dividends and participation in profits, net 1 4 7 9 – – – – – – – – 9 12Total net technical expenses 701 755 1,740 1,873 2,538 2,833 532 549 8 18 (12) – 5,508 6,028Net underwriting result 115 (378) 180 2 245 501 40 48 89 130 12 – 681 302Net investment income 455 528 864 933 829 1,188 111 130 45 117 (6) (48) 2,297 2,847Net capital gains/(losses) and impairments on investments 25 (16) 38 (16) 17 (12) – – – – – – 80 (44)Net non-technical result (excl. items not included in BOP) (82) (12) (165) (180) (251) (293) (37) (50) (15) (21) (6) 48 (556) (508)Business operating profit before non-controlling interests 512 122 917 738 840 1,384 114 129 119 225 – – 2,502 2,598Non-controlling interests – – – – (7) 19 1 1 – – – – (6) 20Business operating profit 512 122 917 738 846 1,365 113 127 119 225 – – 2,508 2,578Adjusted business operating profit 530 141 897 754 803 1,301 106 122 119 301 2,456 2,619Adjusted business operating profit return on common shareholders’ equity 20.4% 5.5% 25.1% 18.6% 24.9% 37.6% 18.2% 18.4% 21.3% 23.0% 23.3% 21.7% Ratios, as % of net earned premiums and policy fees
Loss ratio 77.2% 90.1% 69.3% 72.7% 72.9% 71.0% 61.5% 61.2% nm nm n / a n / a 71.4% 73.4%Expense ratio 19.6% 19.7% 27.8% 27.2% 24.7% 24.6% 35.8% 35.7% nm nm n / a n / a 25.4% 25.3%Combined ratio 96.8% 109.8% 97.1% 100.0% 97.6% 95.6% 97.3% 96.9% nm nm n / a n / a 96.9% 98.7%
in USD millions, for the nine months ended September 30General Insurance – Customer segment overview
in USD millions, for the nine months ended September 30General Insurance – Customer segment overview

Financial Information
Zurich Financial Services Group Results for the Nine Months to September 30, 2009Financial Supplement7
General Insurance (unaudited)
Gross written premiums and
policy fees from external customers
2009 2008
Global Corporate North America 2,141 2,357Europe 3,414 3,630Rest of Global Corporate 264 83Subtotal 5,819 6,070Europe & Africa United Kingdom 2,319 3,153Germany 2,394 2,671Switzerland 1,977 2,145Italy 1,506 1,567Spain 994 1,165Southern Africa 496 524Rest of Europe & Africa 1,446 1,561Subtotal 11,132 12,785Americas United States 7,063 7,885Rest of North America 326 403Latin America 1,012 923Subtotal 8,401 9,210Asia-Pacific & Middle East Asia-Pacific Mature Markets 783 895China & South East Asia 169 231Subtotal 951 1,125Central Region Europe 1 1Subtotal 1 1Total 26,304 29,191
in USD millions, for the nine months ended September 30General Insurance – Revenues by region
in USD millions, for the nine months ended September 30General Insurance – Revenues by region

Financial Information
Zurich Financial Services Group Results for the Nine Months to September 30, 2009Financial Supplement8
General Insurance (unaudited)
Property / equipment and
intangible assets
09/30/09 12/31/08
Europe & Africa United Kingdom 223 211Germany 265 259Switzerland 126 109Italy 75 128Spain 758 764Southern Africa 21 10Rest of Europe & Africa 1,433 1,341Subtotal 2,901 2,822Americas United States 240 244Rest of North America 5 3Latin America 157 46Subtotal 401 293Asia-Pacific & Middle East Asia-Pacific Mature Markets 88 68China & South East Asia 27 23Subtotal 114 90Total 3,416 3,206
in USD millions, as ofGeneral Insurance – Assets by region
in USD millions, as ofGeneral Insurance – Assets by region

Financial Information
Zurich Financial Services Group Results for the Nine Months to September 30, 2009Financial Supplement9
General Insurance (unaudited)
United Kingdom Germany Switzerland Italy Spain Southern Africa
Rest of
Europe & Africa Eliminations Total
2009 2008 2009 2008 2009 2008 2009 2008 2009 2008 2009 2008 2009 2008 2009 2008 2009 2008
Gross written premiums and policy fees 2,331 3,181 2,408 2,686 1,977 2,149 1,526 1,570 1,009 1,182 496 525 1,944 2,165 (476) (601) 11,214 12,857Net earned premiums and policy fees 2,253 2,928 1,884 2,064 1,557 1,712 1,565 1,549 860 992 399 428 1,772 1,831 – – 10,290 11,502Net underwriting result 51 78 125 159 150 188 (201) 8 71 71 (25) 15 74 (23) – 3 245 501 Business operating profit 227 406 243 250 245 274 (140) 122 99 136 (4) 27 176 149 – – 846 1,365 Ratios, as % of net earned premiums and policy fees
Loss ratio 72.1% 72.0% 72.2% 71.0% 67.9% 66.5% 88.2% 75.6% 66.9% 71.6% 79.9% 73.1% 67.1% 69.1% n / a n / a 72.9% 71.0%Expense ratio 25.6% 25.4% 21.1% 21.3% 22.4% 22.5% 24.6% 23.9% 24.9% 21.3% 26.3% 23.3% 28.7% 32.2% n / a n / a 24.7% 24.6%Combined ratio 97.7% 97.3% 93.4% 92.3% 90.4% 89.0% 112.8% 99.5% 91.8% 92.9% 106.3% 96.5% 95.8% 101.2% n / a n / a 97.6% 95.6%
Commercial Personal Eliminations Total
2009 2008 2009 2008 2009 2008 2009 2008
Gross written premiums and policy fees 4,626 5,235 6,594 7,631 (5) (9) 11,214 12,857Net earned premiums and policy fees 4,122 4,628 6,167 6,875 – – 10,290 11,502Net underwriting result 268 142 (28) 364 4 (6) 245 501 Business operating profit 609 622 237 743 – – 846 1,365 Ratios, as % of net earned premiums and policy fees
Loss ratio 69.5% 73.3% 75.2% 69.5% n / a n / a 72.9% 71.0%Expense ratio 24.0% 23.7% 25.2% 25.2% n / a n / a 24.7% 24.6%Combined ratio 93.5% 96.9% 100.5% 94.7% n / a n / a 97.6% 95.6%
in USD millions, for the nine months ended September 30
Customer segment reporting – Europe General Insurance by region
in USD millions, for the nine months ended September 30
Customer segment reporting – Europe General Insurance by region
in USD millions, for the nine months ended September 30Customer segment reporting – Europe General Insurance split into Commercial and Personal
in USD millions, for the nine months ended September 30Customer segment reporting – Europe General Insurance split into Commercial and Personal
Financial Information
Zurich Financial Services Group Results for the Nine Months to September 30, 2009Financial Supplement10
General Insurance (unaudited)
Latin America
Asia-Pacific
Mature Markets
China &
South East Asia
Rest of
International Markets Eliminations Total
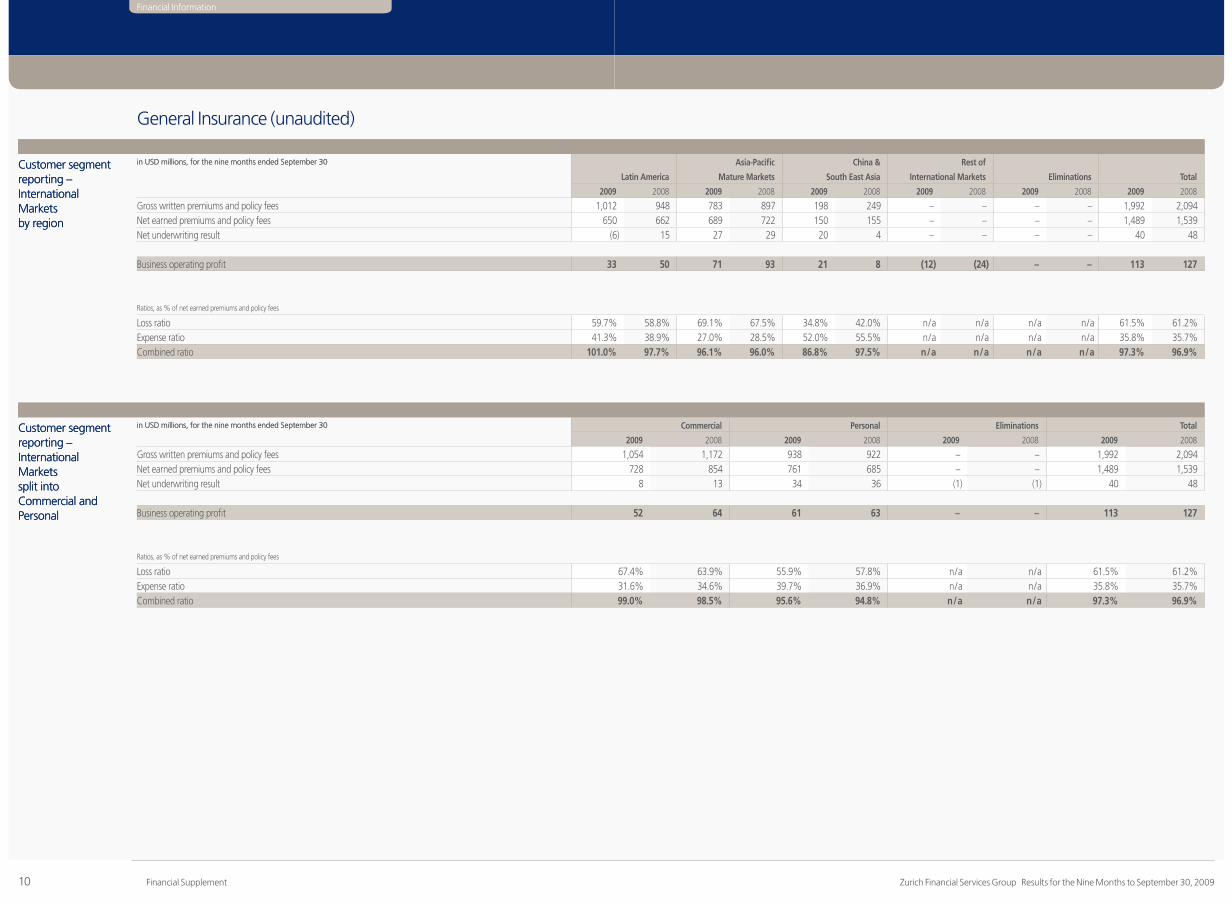
2009 2008 2009 2008 2009 2008 2009 2008 2009 2008 2009 2008
Gross written premiums and policy fees 1,012 948 783 897 198 249 – – – – 1,992 2,094Net earned premiums and policy fees 650 662 689 722 150 155 – – – – 1,489 1,539Net underwriting result (6) 15 27 29 20 4 – – – – 40 48 Business operating profit 33 50 71 93 21 8 (12) (24) – – 113 127 Ratios, as % of net earned premiums and policy fees
Loss ratio 59.7% 58.8% 69.1% 67.5% 34.8% 42.0% n / a n / a n / a n / a 61.5% 61.2%Expense ratio 41.3% 38.9% 27.0% 28.5% 52.0% 55.5% n / a n / a n / a n / a 35.8% 35.7%Combined ratio 101.0% 97.7% 96.1% 96.0% 86.8% 97.5% n / a n / a n / a n / a 97.3% 96.9%
Commercial Personal Eliminations Total
2009 2008 2009 2008 2009 2008 2009 2008
Gross written premiums and policy fees 1,054 1,172 938 922 – – 1,992 2,094Net earned premiums and policy fees 728 854 761 685 – – 1,489 1,539Net underwriting result 8 13 34 36 (1) (1) 40 48 Business operating profit 52 64 61 63 – – 113 127 Ratios, as % of net earned premiums and policy fees
Loss ratio 67.4% 63.9% 55.9% 57.8% n / a n / a 61.5% 61.2%Expense ratio 31.6% 34.6% 39.7% 36.9% n / a n / a 35.8% 35.7%Combined ratio 99.0% 98.5% 95.6% 94.8% n / a n / a 97.3% 96.9%
in USD millions, for the nine months ended September 30Customer segment reporting – International Markets by region
in USD millions, for the nine months ended September 30Customer segment reporting – International Markets by region
in USD millions, for the nine months ended September 30Customer segment reporting – International Markets split into Commercial and Personal
in USD millions, for the nine months ended September 30Customer segment reporting – International Markets split into Commercial and Personal

Financial Information
Zurich Financial Services Group Results for the Nine Months to September 30, 2009Financial Supplement11
Global Life (unaudited)
Americas
United
Kingdom Germany Switzerland Ireland Spain
Emerging
Markets in Asia
Rest of
the world Eliminations Total
2009 2008 2009 2008 2009 2008 2009 2008 2009 2008 2009 2008 2009 2008 2009 2008 2009 2008 2009 2008
Revenues Life insurance deposits 466 423 2,557 2,833 1,463 1,335 34 50 1,036 949 1,704 309 907 1,376 491 577 – – 8,656 7,852Gross written premiums and policy fees 884 819 724 1,039 2,323 2,785 1,202 1,344 270 259 2,578 239 176 195 616 537 (23) (10) 8,750 7,208Net earned premiums and policy fees 693 641 595 901 2,245 2,705 1,197 1,340 199 189 2,558 228 148 176 596 501 – – 8,232 6,681
Net investment income on Group investments 324 328 247 494 1,270 1,429 447 488 66 81 359 141 32 41 269 316 – – 3,013 3,319Net capital gains/(losses) and impairments on Group investments 7 (13) 104 (294) (106) (88) 15 (70) (50) (10) 3 – 28 28 (7) (23) – – (6) (471)
Net investment result on Group investments 331 314 351 201 1,164 1,341 462 418 16 71 362 141 60 69 262 293 – – 3,007 2,848Net investment income on unit-linked investments (10) 28 1,146 1,854 14 19 1 6 135 181 46 24 3 11 56 238 – – 1,391 2,361Net capital gains/(losses) and impairments on unit-linked investments 137 (204) 4,094 (11,757) 1,318 (2,075) 44 (88) 772 (1,437) 215 (190) 824 (1,202) 446 (1,116) – – 7,849 (18,068)
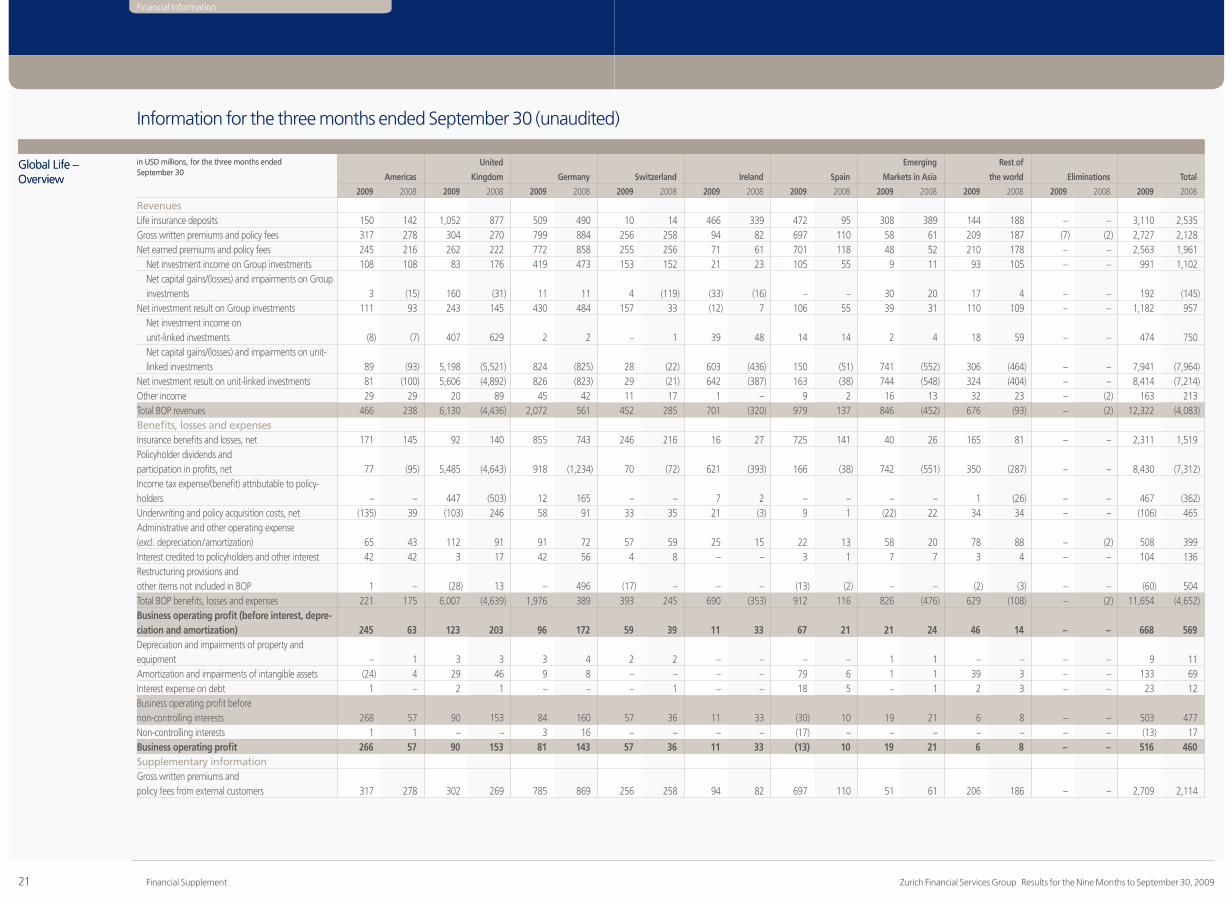
Net investment result on unit-linked investments 127 (176) 5,240 (9,902) 1,332 (2,056) 45 (82) 907 (1,256) 261 (165) 827 (1,191) 502 (878) – – 9,240 (15,707)Other income 86 91 119 353 131 247 35 53 2 – 29 6 47 37 100 107 (1) (2) 547 893Total BOP revenues 1,237 871 6,304 (8,447) 4,872 2,237 1,739 1,728 1,122 (996) 3,210 210 1,083 (909) 1,460 23 (1) (2) 21,026 (5,285)Benefits, losses and expenses Insurance benefits and losses, net 462 435 281 470 2,463 2,675 1,111 1,251 33 66 2,654 289 79 58 438 431 – – 7,521 5,675Policyholder dividends and participation in profits, net 121 (166) 5,130 (9,467) 1,501 (2,178) 178 (1) 912 (1,217) 269 (166) 823 (1,198) 576 (798) – – 9,510 (15,193)Income tax expense/(benefit) attributable to policy-holders – – 244 (1,083) 31 178 – – 15 (1) – – – – 8 (61) – – 298 (966)Underwriting and policy acquisition costs, net (35) 73 136 711 239 297 110 117 73 53 53 5 6 89 96 97 – – 678 1,441Administrative and other operating expense (excl. depreciation / amortization) 164 153 296 348 251 263 151 175 53 45 55 34 88 69 221 266 (1) (2) 1,279 1,351Interest credited to policyholders and other interest 127 128 9 53 116 170 13 18 – – 9 2 21 21 9 10 – – 304 402Restructuring provisions and other items not inlcuded in BOP 1 (1) (46) 50 – 496 2 – – – (38) (2) 10 – (7) (4) – – (78) 539Total BOP benefits, losses and expenses 839 621 6,049 (8,918) 4,601 1,901 1,565 1,560 1,087 (1,055) 3,003 162 1,029 (960) 1,342 (59) (1) (2) 19,512 (6,750)Business operating profit (before interest, depre-ciation and amortization) 398 249 256 471 271 336 174 168 36 59 207 48 54 51 119 82 – – 1,514 1,465Depreciation and impairments of property and equipment 1 2 7 10 9 11 3 5 1 1 – – 3 3 1 1 – – 25 32Amortization and impairments of intangible assets (14) 11 9 107 29 30 – – 1 – 163 6 3 2 67 5 – – 257 161Interest expense on debt 2 2 9 2 – – 2 5 – – 52 7 – 1 7 5 – – 71 21Business operating profit before non-controlling interests 409 236 231 352 233 294 169 158 34 58 (8) 35 48 46 44 72 – – 1,161 1,250Non-controlling interests 3 1 – – 7 17 – – – – (6) – – – – – – – 4 19Business operating profit 406 234 231 352 227 277 169 158 34 58 (2) 34 48 46 44 72 – – 1,157 1,232Supplementary information Gross written premiums and policy fees from external customers 884 819 719 1,036 2,282 2,740 1,202 1,344 270 259 2,578 239 148 188 608 535 – – 8,691 7,160Property, equipment and intangible assets 1 297 244 453 403 1,013 996 199 159 9 6 2,953 2,742 14 14 173 270 – – 5,113 4,835
1 As of September 30, 2009 and December 31, 2008, respectively.
in USD millions, for the nine months ended September 30
Global Life – Overview
in USD millions, for the nine months ended September 30
Global Life – Overview

Financial Information
Zurich Financial Services Group Results for the Nine Months to September 30, 2009Financial Supplement12
Global Life (unaudited)
United States Latin America Eliminations Total Americas
2009 2008 2009 2008 2009 2008 2009 2008
Insurance deposits 369 383 97 40 – – 466 423Gross written premiums and policy fees 554 541 330 278 – – 884 819Net earned premiums and policy fees 395 387 298 254 – – 693 641
Net investment income on Group investments 250 255 74 73 – – 324 328Net capital gains/(losses) and impairments on Group investments 9 (13) (2) (1) – – 7 (13)
Net investment result on Group investments 258 242 73 72 – – 331 314Net investment result on unit-linked investments 42 (121) 85 (55) – – 127 (176)Total BOP benefits, losses and expenses 419 375 420 246 – – 839 621 Business operating profit 361 197 45 38 – – 406 234
of which
Total ZIS Hong Kong
2009 2008 2009 2008 2009 2008
Insurance deposits 907 1,376 796 1,227 111 150Gross written premiums and policy fees 176 195 119 129 58 69Net earned premiums and policy fees 148 176 75 103 52 62
Net investment income on Group investments 32 41 8 15 24 26Net capital gains/(losses) and impairments on Group investments 28 28 2 24 26 4
Net investment result on Group investments 60 69 11 39 50 30Net investment result on unit-linked investments 827 (1,191) 744 (1,048) 83 (143)Total BOP benefits, losses and expenses 1,029 (960) 831 (915) 173 (50) Business operating profit 48 46 40 40 12 1
in USD millions, for the nine months ended September 30Global Life – Americas
in USD millions, for the nine months ended September 30Global Life – Americas
in USD millions, for the nine months ended September 30Global Life – Emerging Markets in Asia
in USD millions, for the nine months ended September 30Global Life – Emerging Markets in Asia

Financial Information
Zurich Financial Services Group Results for the Nine Months to September 30, 2009Financial Supplement13
Global Life (unaudited)
of which
Total Italy
2009 2008 2009 2008
Insurance deposits 491 577 398 410Gross written premiums and policy fees 616 537 233 202Net earned premiums and policy fees 596 501 249 210
Net investment income on Group investments 269 316 179 187Net capital gains/(losses) and impairments on Group investments (7) (23) (12) (12)
Net investment result on Group investments 262 293 167 175Net investment result on unit-linked investments 502 (878) 292 (467)Total BOP benefits, losses and expenses 1,342 (59) 638 (115) Business operating profit 44 72 3 35
Americas United Kingdom Germany Switzerland Ireland Spain
Emerging
Markets in Asia
Rest of
the world Total
09/30/09 12/31/08 09/30/09 12/31/08 09/30/09 12/31/08 09/30/09 12/31/08 09/30/09 12/31/08 09/30/09 12/31/08 09/30/09 12/31/08 09/30/09 12/31/08 09/30/09 12/31/08
Total Group investments 92.4 92.9 16.1 16.9 82.5 86.0 97.1 97.2 27.8 32.0 72.0 77.3 25.1 31.5 68.4 68.4 55.9 58.9Cash and cash equivalents 4.6 4.1 13.5 14.5 2.2 3.0 3.1 6.1 6.4 6.8 6.1 7.6 12.2 14.8 0.7 2.3 4.2 5.4Equity securities 2.2 3.9 9.5 10.5 1.9 1.9 8.0 7.6 21.8 17.3 0.2 0.4 5.8 4.1 13.3 11.9 5.2 5.1Debt securities 85.9 84.0 73.7 73.2 48.6 46.2 58.8 55.2 68.3 72.2 70.3 65.4 76.1 76.4 79.8 79.0 62.0 59.5Investments in associates – – 0.2 0.2 – – – – – – 0.1 0.1 – – 1.0 1.0 0.1 0.1Other investments 7.4 8.0 3.1 1.7 47.3 48.8 30.1 31.1 3.5 3.7 23.3 26.6 5.9 4.7 5.3 5.8 28.5 29.9
Investments for unit-linked contracts 7.6 7.1 83.9 83.1 17.5 14.0 2.9 2.8 72.2 68.0 28.0 22.7 74.9 68.5 31.6 31.6 44.1 41.1Total investments 100.0 100.0 100.0 100.0 100.0 100.0 100.0 100.0 100.0 100.0 100.0 100.0 100.0 100.0 100.0 100.0 100.0 100.0
Americas United Kingdom Germany Switzerland Ireland Spain
Emerging
Markets in Asia
Rest of
the world Eliminations Total
09/30/09 12/31/08 09/30/09 12/31/08 09/30/09 12/31/08 09/30/09 12/31/08 09/30/09 12/31/08 09/30/09 12/31/08 09/30/09 12/31/08 09/30/09 12/31/08 09/30/09 12/31/08 09/30/09 12/31/08
Unit-linked insurance and investment contracts 1,088 926 50,627 42,655 8,995 6,387 1,792 1,676 7,810 5,985 4,097 2,669 6,629 4,981 6,782 6,021 – – 87,820 71,299Other life insurance liabilities 6,641 6,258 4,494 4,033 43,593 40,879 15,748 15,044 1,385 1,418 10,273 8,775 1,545 1,501 5,821 5,490 (3) 3 89,498 83,401Total reserves and liabilities 7,729 7,184 55,121 46,688 52,588 47,266 17,540 16,720 9,195 7,403 14,371 11,444 8,174 6,482 12,603 11,511 (3) 3 177,318 154,700
in USD millions, for the nine months ended September 30Global Life – Rest of the world
in USD millions, for the nine months ended September 30Global Life – Rest of the world
in %, as ofGlobal Life – Total investments
in %, as ofGlobal Life – Total investments
in USD millions, as ofGlobal Life – Reserves for life insurance contracts and liabilities for investment contracts, net of reinsurance
in USD millions, as ofGlobal Life – Reserves for life insurance contracts and liabilities for investment contracts, net of reinsurance

Financial Information
Zurich Financial Services Group Results for the Nine Months to September 30, 2009Financial Supplement14
Farmers (unaudited)
Farmers Management Services Farmers Re Eliminations Total
2009 2008 2009 2008 2009 2008 2009 2008
Gross written premiums and policy fees – – 4,964 2,346 – – 4,964 2,346Net earned premiums and policy fees – – 3,993 1,255 – – 3,993 1,255Management fees and other related revenues 1,973 1,831 – – – – 1,973 1,831Insurance benefits and losses, net – – (2,759) (898) – – (2,759) (898)Total net technical expenses (1,023) (956) (1,212) (349) – – (2,235) (1,305)Net underwriting result 950 875 23 8 – – 973 883Net investment income 60 65 70 56 – – 130 121Net non-technical result (excl. items not included in BOP) (19) (21) 48 13 – – 29 (7)Business operating profit before non-controlling interests 992 919 141 77 – – 1,132 996Business operating profit 992 919 141 77 – – 1,132 996 Ratios, as % of net earned premiums and policy fees
Loss ratio – – 69.1% 71.5% – – – –Expense ratio – – 30.3% 27.8% – – – –Combined ratio – – 99.4% 99.4% – – – –
in USD millions, for the nine months ended September 30Farmers – Overview
in USD millions, for the nine months ended September 30Farmers – Overview

Financial Information
Zurich Financial Services Group Results for the Nine Months to September 30, 2009Financial Supplement15
Additional information (unaudited)
Balance sheets
Income statements
and cash flows
09/30/09 12/31/08 09/30/09 09/30/08
Euro 1.4630 1.3924 1.3654 1.5217Swiss franc 0.9640 0.9371 0.9044 0.9464British pound sterling 1.6012 1.4620 1.5423 1.9479
in USD
millions in %
change
in USD
change in
local currency
Gross written premiums and policy fees (2,146) (7%) (10%) (3%)Net investment income on total investments (180) (6%) (19%) (13%)Net capital gains/(losses) and impairments on total investments (1) (3%) nm nmInsurance benefits and losses, net of reinsurance 1,343 8% 12% 4%Business operating profit (161) (6%) (3%) 4%
in USD
millions in %
change
in USD
change in
local currency
Insurance deposits (1,426) (18%) 10% 28%Gross written premiums and policy fees (973) (13%) 21% 35%Net investment result on Group investments (336) (12%) 6% 17%
Net investment income on Group investments (325) (10%) (9%) 1%Net capital gains and impairments on Group investments (11) (2%) 99% nm
Net investment result on unit-linked investments (1,954) (12%) nm nmInsurance benefits and losses, net of reinsurance 811 14% (33%) (47%)Business operating profit (118) (10%) (6%) 4%
USD per foreign currency unitPrincipal exchange rates
USD per foreign currency unitPrincipal exchange rates
variance over the prior period, for the nine months ended September 30, 2009Currency translation impact on key financial figures – General Insurance
variance over the prior period, for the nine months ended September 30, 2009Currency translation impact on key financial figures – General Insurance
variance over the prior period, for the nine months ended September 30, 2009Currency translation impact on key financial figures – Global Life
variance over the prior period, for the nine months ended September 30, 2009Currency translation impact on key financial figures – Global Life

Financial Information
Zurich Financial Services Group Results for the Nine Months to September 30, 2009Financial Supplement16
Additional information (unaudited)
Net investment
income
Net capital
gains/(losses) on
investments
and impairments 1
Investment
result
2009 2008 2009 2008 2009 2008
Group investments Cash and cash equivalents 82 401 6 – 88 401Equity securities 266 477 (375) (908) (109) (431)Debt securities 4,087 4,482 (450) (1,719) 3,637 2,763Real estate held for investment 342 376 140 234 483 609Mortgage loans 428 499 (180) (12) 247 487Other loans 529 497 18 3 546 501Investments in associates (2) 3 (2) (11) (4) (8)Other investments 2 5 (10) (401) 606 (396) 595Investment result, gross, for Group investments 5,738 6,724 (1,245) (1,807) 4,493 4,917Investment expenses for Group investments 3 (168) (189) – – (168) (189)Investment result, net, for Group investments 5,569 6,534 (1,245) (1,807) 4,325 4,728Investments for unit-linked contracts Investment result, net, for investments for unit-linked contracts 1,192 2,510 8,734 (20,135) 9,927 (17,625)Total investments Investment result, net, for total investments 6,762 9,044 7,489 (21,942) 14,251 (12,897)
1 Impairment charges on investments amounted in total to USD 1,117 million and USD 1,624 million for the nine months ended September 30, 2009 and 2008, respectively, of which impairments on equity securities comprised USD 491 million and USD 497 million, on debt securities USD 446 million and USD 1,092 million, and on mortgage loans and other investments USD 180 million and USD 35 million for the nine months ended September 30, 2009 and 2008, respectively.
2 Including net capital gains/(losses) on derivative financial instruments of USD (399) million and USD 629 million for the nine months ended September 30, 2009 and 2008, respectively, of which net capital gains/(losses) on derivatives attributable to cash flow hedges ineffectiveness amounted to USD 26 million and USD (3) million for the nine months ended September 30, 2009 and 2008. respectively.
3 Including rental operating expense for real estate held for total investments of USD 82 million and USD 100 million for the nine months ended September 30, 2009 and 2008, respectively.
in USD millions, for the nine months ended September 30Investment result
in USD millions, for the nine months ended September 30Investment result

Financial Information
Zurich Financial Services Group Results for the Nine Months to September 30, 2009Financial Supplement17
Additional information (unaudited)
Group investments
Investments for
unit-linked products Total investments
09/30/09 12/31/08 09/30/09 12/31/08 09/30/09 12/31/08
USD
millions
% of
total
USD
millions
% of
total
USD
millions
USD
millions
USD
millions
USD
millions
Cash and cash equivalents 12,321 6.1 12,428 6.9 5,554 4,460 17,875 16,888Equity securities: Fair value through profit or loss 5,347 2.7 4,996 2.8 75,047 60,154 80,394 65,150
of which: trading 1,117 0.6 1,419 0.8 – – 1,117 1,419of which: trading equity portfolios in capital markets and banking activities 668 0.3 786 0.4 – – 668 786
Available-for-sale 10,066 5.0 9,307 5.2 – – 10,066 9,307Total equity securities 15,413 7.7 14,303 8.0 75,047 60,154 90,460 74,458Debt securities: Fair value through profit or loss 7,734 3.8 7,291 4.1 9,734 9,510 17,468 16,801
of which: trading 84 0.0 186 0.1 – – 84 186Available-for-sale 123,001 61.2 105,752 58.9 – – 123,001 105,752Held-to-maturity 5,400 2.7 5,244 2.9 – – 5,400 5,244Total debt securities 136,136 67.7 118,287 65.9 9,734 9,510 145,870 127,797Real estate held for investment 7,920 3.9 7,524 4.2 3,669 4,077 11,590 11,601Mortgage loans 13,060 6.5 12,820 7.1 – – 13,060 12,820Other loans 15,891 7.9 13,988 7.8 2 2 15,893 13,990Investments in associates 233 0.1 220 0.1 – – 233 220Total investments 200,975 100.0 179,570 100.0 94,007 78,203 294,981 257,773
Group investments
Investments for
unit-linked contracts Total investments
09/30/09 12/31/08 09/30/09 12/31/08 09/30/09 12/31/08
USD
millions
% of
total
USD
millions
% of
total
USD
millions
USD
millions
USD
millions
USD
millions
Common stocks, including equity unit trusts 9,482 4.7 8,957 5.0 65,298 51,276 74,779 60,233Unit trusts (debt securities, real estate, short-term investments) 4,605 2.3 3,930 2.2 9,750 8,879 14,354 12,809Common stock portfolios backing the particpating with-profit policyholder contracts 659 0.3 630 0.4 – – 659 630Trading equity portfolios in capital markets and banking activities 668 0.3 786 0.4 – – 668 786Total equity securities 15,413 7.7 14,303 8.0 75,047 60,154 90,460 74,458
as ofDetails of investments by category
as ofDetails of investments by category
as ofEquity securities (including trading equity portfolios in capital markets and banking activities)
as ofEquity securities (including trading equity portfolios in capital markets and banking activities)

Financial Information
Zurich Financial Services Group Results for the Nine Months to September 30, 2009Financial Supplement18
Information for the three months ended September 30 (unaudited)
General Insurance Global Life Farmers
Other Operating
Businesses
Non-Core
Businesses Eliminations Total
2009 2008 2009 2008 2009 2008 2009 2008 2009 2008 2009 2008 2009 2008
Revenues Direct written premiums and policy fees 7,637 8,181 2,702 2,100 – – – – 137 105 – 6 10,477 10,391Assumed written premiums 437 434 24 28 2,081 1,510 36 44 44 72 (60) (80) 2,562 2,008
Gross written premiums and policy fees 8,074 8,614 2,727 2,128 2,081 1,510 36 44 181 176 (60) (74) 13,039 12,399Less premiums ceded to reinsurers (1,263) (1,326) (193) (193) – – (14) (15) (7) (33) 60 74 (1,417) (1,492)
Net written premiums and policy fees 6,811 7,288 2,533 1,935 2,081 1,510 21 29 175 144 – – 11,622 10,907Net change in reserves for unearned premiums 645 672 30 25 (310) (1,088) 2 2 5 3 – – 371 (387)
Net earned premiums and policy fees 7,456 7,960 2,563 1,961 1,771 422 23 31 179 146 – – 11,993 10,520Farmers management fees and other related revenues – – – – 726 635 – – – – – – 726 635Net investment result on Group investments 793 894 1,182 957 45 35 132 129 258 (115) (231) (246) 2,180 1,654
Net investment income on Group investments 764 937 991 1,102 45 35 111 128 151 194 (231) (246) 1,831 2,150Net capital gains/(losses) and impairments on Group investments 30 (44) 192 (145) – – 20 1 107 (308) – – 349 (496)
Net investment result on unit-linked investments – – 8,414 (7,214) – – – – 589 (1,007) – – 9,004 (8,221)Other income 158 157 163 213 30 5 371 278 20 (3) (297) (339) 446 311Total BOP revenues 8,407 9,011 12,322 (4,083) 2,573 1,096 526 439 1,047 (979) (528) (586) 24,348 4,898
of which: intersegment revenues (87) (144) (54) (31) (24) (21) (343) (376) (20) (14) 528 586 – –Benefits, losses and expenses Insurance benefits and losses, net 5,442 6,300 2,311 1,519 1,200 299 35 41 477 221 – – 9,465 8,381
Losses and loss adjustment expenses, net 5,432 6,292 27 2 1,200 299 3 1 74 73 1 6 6,736 6,673Life insurance death and other benefits, net 11 8 2,382 1,959 – – 23 21 160 102 – – 2,576 2,090(Decrease)/increase in future life policyholders’ benefits, net – – (99) (442) – – 9 20 243 46 (1) (6) 153 (383)
Policyholder dividends and participation in profits, net 2 1 8,430 (7,312) – – – – 609 (982) – – 9,041 (8,293)Income tax expense/(benefit) attributable to policyholders – – 467 (362) – – – – – – – – 467 (362)Underwriting and policy acquisition costs, net 1,348 1,431 (106) 465 555 124 – – 3 6 (1) (1) 1,799 2,025Administrative and other operating expense (excl. depreciation / amortization) 749 858 508 399 404 316 226 358 47 (61) (285) (324) 1,647 1,547Interest credited to policyholders and other interest 6 46 104 136 – – – 3 12 1 (2) (8) 120 178Restructuring provisions and other items not included in BOP (50) (65) (60) 504 (36) – 30 20 – – – – (116) 459Total BOP benefits, losses and expenses (before interest, depreciation and amortization) 7,497 8,571 11,654 (4,652) 2,123 739 290 423 1,148 (814) (289) (333) 22,424 3,935Business operating profit (before interest, depreciation and amortization) 910 440 668 569 450 358 236 15 (101) (165) (239) (253) 1,924 963Depreciation and impairments of property and equipment 16 17 9 11 19 16 9 8 7 – – – 61 52Amortization and impairments of intangible assets 54 18 133 69 20 15 9 5 1 1 – – 216 108Interest expense on debt 53 60 23 12 2 2 277 283 37 43 (239) (253) 153 147Business operating profit before non-controlling interests 787 345 503 477 409 325 (59) (281) (146) (210) – – 1,494 656Non-controlling interests (7) 4 (13) 17 – – – (1) – – – – (20) 20Business operating profit 794 341 516 460 409 325 (59) (281) (146) (209) – – 1,513 636Supplementary information Additions and capital improvements of property, equipment and intangible assets 69 484 59 834 581 41 20 25 (5) 4 – – 724 1,388
in USD millions, for the three months ended September 30Business operating profit by business segment
in USD millions, for the three months ended September 30Business operating profit by business segment

Financial Information
Zurich Financial Services Group Results for the Nine Months to September 30, 2009Financial Supplement19
Information for the three months ended September 30 (unaudited)
General Insurance Global Life Farmers
Other Operating
Businesses
Non-Core
Businesses Total
2009 2008 2009 2008 2009 2008 2009 2008 2009 2008 2009 2008
Business operating profit 794 341 516 460 409 325 (59) (281) (146) (209) 1,513 636Revenues/(expenses) not included in BOP:
Net capital gains/(losses) on investments and impairments, net of policyholder allocation (187) (579) (115) (128) (1) (10) 36 (144) 15 (24) (252) (884)Net gain/(loss) on divestments of businesses – 14 – (1) – – – – – (1) – 12Restructuring provisions and other (50) (65) (60) 504 (36) – 30 20 – – (116) 459
Add back: Business operating profit attributable to non-controlling interests (7) 4 (13) 17 – – – (1) – – (20) 20Net income before shareholders’ taxes 550 (285) 329 852 372 314 7 (405) (131) (234) 1,126 243Income tax expense attributable to policyholders – – 467 (362) – – – – – – 467 (362)
Net income before income taxes 550 (285) 796 490 372 314 7 (405) (131) (234) 1,593 (119)Income tax expense (attributable to policyholders and shareholders) (682) 287
Net income after taxes 911 168
in USD millions, for the three months ended September 30Reconciliation of BOP to net income after income taxes
in USD millions, for the three months ended September 30Reconciliation of BOP to net income after income taxes

Financial Information
Zurich Financial Services Group Results for the Nine Months to September 30, 2009Financial Supplement20
Information for the three months ended September 30 (unaudited)
Global
Corporate
North
America
Commercial
Europe
General
Insurance
International
Markets
GI Global Functions
including Group
Reinsurance Eliminations Total
2009 2008 2009 2008 2009 2008 2009 2008 2009 2008 2009 2008 2009 2008
Gross written premiums and policy fees 1,751 1,799 2,376 2,690 3,368 3,686 697 645 153 136 (272) (341) 8,074 8,614Net earned premiums and policy fees 1,188 1,266 2,165 2,311 3,580 3,842 510 528 12 13 – – 7,456 7,960Insurance benefits and losses, net 938 1,387 1,499 1,831 2,694 2,813 305 322 7 (53) – – 5,442 6,300Policyholder dividends and participation in profits, net 1 (2) 1 3 – – – – – – – – 2 1Total net technical expenses 238 246 579 593 876 928 183 193 (9) 6 (1) 3 1,866 1,969Net underwriting result 11 (365) 86 (116) 10 101 23 13 14 60 1 (3) 146 (310)Net investment income 147 172 285 310 275 386 37 47 20 38 – (15) 764 937Net capital gains/(losses) and impairments on investments 9 (16) 14 (16) 6 (12) – – – – – – 30 (44)Net non-technical result (excl. items not included in BOP) (8) (17) (45) (66) (75) (139) (20) (24) (2) (10) (1) 18 (152) (239)Business operating profit before non-controlling interests 159 (225) 341 111 216 335 40 36 32 88 – – 787 345Non-controlling interests – – – – (7) 5 – (2) – – – – (7) 4Business operating profit 159 (225) 341 111 223 330 39 38 32 88 – – 794 341 Ratios, as % of net earned premiums and policy fees
Loss ratio 78.9% 109.6% 69.2% 79.2% 75.2% 73.2% 59.7% 60.9% nm nm n / a n / a 73.0% 79.2%Expense ratio 20.1% 19.2% 26.8% 25.8% 24.5% 24.2% 35.9% 36.5% nm nm n / a n / a 25.1% 24.7%Combined ratio 99.1% 128.8% 96.0% 105.0% 99.7% 97.4% 95.5% 97.5% nm nm n / a n / a 98.0% 103.9%
in USD millions, for the three months ended September 30General Insurance – Customer segment overview
in USD millions, for the three months ended September 30General Insurance – Customer segment overview
Financial Information
Zurich Financial Services Group Results for the Nine Months to September 30, 2009Financial Supplement21
Information for the three months ended September 30 (unaudited)
Americas
United
Kingdom Germany Switzerland Ireland Spain
Emerging
Markets in Asia
Rest of
the world Eliminations Total
2009 2008 2009 2008 2009 2008 2009 2008 2009 2008 2009 2008 2009 2008 2009 2008 2009 2008 2009 2008
Revenues Life insurance deposits 150 142 1,052 877 509 490 10 14 466 339 472 95 308 389 144 188 – – 3,110 2,535Gross written premiums and policy fees 317 278 304 270 799 884 256 258 94 82 697 110 58 61 209 187 (7) (2) 2,727 2,128Net earned premiums and policy fees 245 216 262 222 772 858 255 256 71 61 701 118 48 52 210 178 – – 2,563 1,961
Net investment income on Group investments 108 108 83 176 419 473 153 152 21 23 105 55 9 11 93 105 – – 991 1,102Net capital gains/(losses) and impairments on Group investments 3 (15) 160 (31) 11 11 4 (119) (33) (16) – – 30 20 17 4 – – 192 (145)
Net investment result on Group investments 111 93 243 145 430 484 157 33 (12) 7 106 55 39 31 110 109 – – 1,182 957Net investment income on unit-linked investments (8) (7) 407 629 2 2 – 1 39 48 14 14 2 4 18 59 – – 474 750Net capital gains/(losses) and impairments on unit-linked investments 89 (93) 5,198 (5,521) 824 (825) 28 (22) 603 (436) 150 (51) 741 (552) 306 (464) – – 7,941 (7,964)
Net investment result on unit-linked investments 81 (100) 5,606 (4,892) 826 (823) 29 (21) 642 (387) 163 (38) 744 (548) 324 (404) – – 8,414 (7,214)Other income 29 29 20 89 45 42 11 17 1 – 9 2 16 13 32 23 – (2) 163 213Total BOP revenues 466 238 6,130 (4,436) 2,072 561 452 285 701 (320) 979 137 846 (452) 676 (93) – (2) 12,322 (4,083)Benefits, losses and expenses Insurance benefits and losses, net 171 145 92 140 855 743 246 216 16 27 725 141 40 26 165 81 – – 2,311 1,519Policyholder dividends and participation in profits, net 77 (95) 5,485 (4,643) 918 (1,234) 70 (72) 621 (393) 166 (38) 742 (551) 350 (287) – – 8,430 (7,312)Income tax expense/(benefit) attributable to policy-holders – – 447 (503) 12 165 – – 7 2 – – – – 1 (26) – – 467 (362)Underwriting and policy acquisition costs, net (135) 39 (103) 246 58 91 33 35 21 (3) 9 1 (22) 22 34 34 – – (106) 465Administrative and other operating expense (excl. depreciation / amortization) 65 43 112 91 91 72 57 59 25 15 22 13 58 20 78 88 – (2) 508 399Interest credited to policyholders and other interest 42 42 3 17 42 56 4 8 – – 3 1 7 7 3 4 – – 104 136Restructuring provisions and other items not included in BOP 1 – (28) 13 – 496 (17) – – – (13) (2) – – (2) (3) – – (60) 504Total BOP benefits, losses and expenses 221 175 6,007 (4,639) 1,976 389 393 245 690 (353) 912 116 826 (476) 629 (108) – (2) 11,654 (4,652)Business operating profit (before interest, depre-ciation and amortization) 245 63 123 203 96 172 59 39 11 33 67 21 21 24 46 14 – – 668 569Depreciation and impairments of property and equipment – 1 3 3 3 4 2 2 – – – – 1 1 – – – – 9 11Amortization and impairments of intangible assets (24) 4 29 46 9 8 – – – – 79 6 1 1 39 3 – – 133 69Interest expense on debt 1 – 2 1 – – – 1 – – 18 5 – 1 2 3 – – 23 12Business operating profit before non-controlling interests 268 57 90 153 84 160 57 36 11 33 (30) 10 19 21 6 8 – – 503 477Non-controlling interests 1 1 – – 3 16 – – – – (17) – – – – – – – (13) 17Business operating profit 266 57 90 153 81 143 57 36 11 33 (13) 10 19 21 6 8 – – 516 460Supplementary information Gross written premiums and policy fees from external customers 317 278 302 269 785 869 256 258 94 82 697 110 51 61 206 186 – – 2,709 2,114
in USD millions, for the three months ended September 30
Global Life – Overview
in USD millions, for the three months ended September 30
Global Life – Overview

Financial Information
Zurich Financial Services Group Results for the Nine Months to September 30, 2009Financial Supplement22
Information for the three months ended September 30 (unaudited)
Farmers Management Services Farmers Re Eliminations Total
2009 2008 2009 2008 2009 2008 2009 2008
Gross written premiums and policy fees – – 2,081 1,510 – – 2,081 1,510Net earned premiums and policy fees – – 1,771 422 – – 1,771 422Management fees and other related revenues 726 635 – – – – 726 635Insurance benefits and losses, net – – (1,200) (299) – – (1,200) (299)Total net technical expenses (386) (334) (586) (133) – – (972) (467)Net underwriting result 340 300 (15) (9) – – 325 291Net investment income 17 16 27 19 – – 45 35Net non-technical result (excl. items not included in BOP) (9) (15) 48 13 – – 38 (1)Business operating profit before non-controlling interests 348 302 61 23 – – 409 325Business operating profit 348 302 61 23 – – 409 325 Ratios, as % of net earned premiums and policy fees
Loss ratio – – 67.8% 70.8% – – – –Expense ratio – – 33.1% 31.4% – – – –Combined ratio – – 100.8% 102.2% – – – –
in USD millions, for the three months ended September 30Farmers – Overview
in USD millions, for the three months ended September 30Farmers – Overview

Financial Information
Zurich Financial Services Group Results for the Nine Months to September 30, 2009Financial Supplement23
Information for the nine months ended September 30 – FX adjusted (unaudited)
General Insurance Global Life Farmers
Other Operating
Businesses
Non-Core
Businesses Eliminations Total
% GC % LC % GC % LC % GC % LC % GC % LC % GC % LC % GC % LC % GC % LC
Revenues Direct written premiums and policy fees (10) (3) 22 35 nm nm nm nm 42 41 nm nm (3) 5Assumed written premiums (5) 2 – 7 nm nm (23) (19) (17) (16) 16 11 66 69
Gross written premiums and policy fees (10) (3) 21 35 nm nm (19) (16) 22 22 14 2 4 11Less premiums ceded to reinsurers 9 2 1 (12) n / a n / a 8 4 21 17 (14) (2) 8 1
Net written premiums and policy fees (10) (3) 23 37 nm nm (25) (22) 26 26 n / a n / a 5 13Net change in reserves for unearned premiums 38 37 20 37 11 11 (9) (8) (72) (71) n / a n / a 23 23
Net earned premiums and policy fees (9) (1) 23 37 nm nm (25) (21) 20 20 n / a n / a 7 15Farmers management fees and other related revenues n / a n / a n / a n / a 8 8 n / a n / a n / a n / a n / a n / a 8 8Net investment result on Group investments (15) (9) 6 17 7 7 (34) (32) 36 34 15 10 (3) 5
Net investment income on Group investments (19) (13) (9) 1 7 7 (20) (18) (25) (18) 15 10 (15) (7)Net capital gains/(losses) and impairments on Group investments nm nm 99 nm n / a n / a nm nm 68 55 n / a n / a 89 85
Net investment result on unit-linked investments n / a n / a nm nm n / a n / a n / a n / a nm nm n / a n / a nm nmOther income (7) 5 (39) (30) nm nm 13 17 95 97 7 2 (8) 2Total BOP revenues (10) (2) nm nm 91 91 (5) (2) nm nm 11 6 nm nmBenefits, losses and expenses Insurance benefits and losses, net 12 4 (33) (47) nm nm 93 93 nm nm n / a n / a (9) (18)
Losses and loss adjustment expenses, net 11 4 nm nm nm nm nm nm 17 8 (4) nm 1 (7)Life insurance death and other benefits, net 35 30 (6) (17) n / a n / a 20 16 (61) (61) nm nm (8) (19)(Decrease)/increase in future life policyholders’ benefits, net 76 67 nm nm n / a n / a nm nm nm nm 16 nm nm nm
Policyholder dividends and participation in profits, net 30 33 nm nm n / a n / a n / a n / a nm nm n / a n / a nm nmIncome tax expense/(benefit) attributable to policyholders n / a n / a nm nm n / a n / a n / a n / a n / a n / a n / a n / a nm nmUnderwriting and policy acquisition costs, net 9 2 53 47 nm nm nm nm 19 20 78 94 4 (2)Administrative and other operating expense (excl. depreciation / amortization) 4 (8) 5 (8) (11) (11) 19 16 nm nm (8) (3) (1) (12)Interest credited to policyholders and other interest 85 82 24 20 nm nm 91 91 20 14 (37) (30) 41 37Restructuring provisions and other items not included in BOP (37) (30) nm nm n / a n / a (21) (26) 98 98 n / a n / a nm nmTotal BOP benefits, losses and expenses (before interest, depreciation and amortization) 11 3 nm nm nm nm 23 19 nm nm (9) (4) nm nmBusiness operating profit (before interest, depreciation and amortization) (2) 4 3 14 14 14 40 43 nm nm 14 8 – 6Depreciation and impairments of property and equipment (6) (17) 23 11 (9) (9) (4) (9) nm nm n / a n / a (5) (13)Amortization and impairments of intangible assets (71) (86) (59) (79) (27) (27) (75) (83) (2) (25) n / a n / a (58) (73)Interest expense on debt 15 11 nm nm – – 13 9 26 20 (14) (8) 5 1Business operating profit before non-controlling interests (4) 3 (7) 2 14 14 45 40 nm nm n / a n / a (4) 1Non-controlling interests nm nm 78 78 nm nm nm nm nm nm n / a n / a nm nmBusiness operating profit (3) 4 (6) 4 14 14 45 40 nm nm n / a n / a (3) 2
variance in % over the prior period, for the nine months ended September 30, 2009Business operating profit by business segment – FX adjusted
variance in % over the prior period, for the nine months ended September 30, 2009Business operating profit by business segment – FX adjusted

Financial Information
Zurich Financial Services Group Results for the Nine Months to September 30, 2009Financial Supplement24
Information for the nine months ended September 30 – FX adjusted (unaudited)
General Insurance Global Life Farmers
Other Operating
Businesses
Non-Core
Businesses Eliminations Total
% GC % LC % GC % LC % GC % LC % GC % LC % GC % LC % GC % LC % GC % LC
Assets Total Group Investments 11 7 10 5 24 24 25 22 11 8 (12) (9) 12 7
Cash and cash equivalents 5 1 (15) (20) 64 64 5 2 11 8 (7) (4) (1) (4)Equity securities 14 5 13 5 nm nm (15) (16) 23 15 n / a n / a 8 1Debt securities 14 11 15 10 66 66 99 96 – (1) – (25) 15 11Real estate held for investment 5 2 5 2 3 3 3 – 3 n / a n / a n / a 5 2Mortgage loans (10) (13) 3 (2) n / a n / a n / a n / a 9 – (5) n / a 2 (3)Other loans (7) (11) 6 1 9 9 48 45 41 34 (16) (13) 14 8Investments in associates 3 1 8 (4) n / a n / a 17 14 3 3 n / a n / a 6 (1)
Investments for unit-linked contracts n / a n / a 25 15 n / a n / a n / a n / a (4) (4) n / a n / a 20 12Total investments 11 7 16 9 24 24 25 22 5 2 (12) (9) 14 9Reinsurers’ share of reserves for insurance contracts 6 3 8 2 – – (62) (63) (13) (15) 22 28 4 1Deposits made under assumed reinsurance contracts (1) (3) nm nm 64 64 nm nm – (1) (3) (2) 45 45Deferred policy acquisition costs 6 2 12 6 79 79 nm nm 20 18 nm nm 12 7Deferred origination costs n / a n / a 6 (2) n / a n / a n / a n / a n / a n / a n / a n / a 6 (2)Goodwill 15 9 13 6 nm nm n / a n / a n / a n / a n / a n / a 35 30Other intangible assets 9 4 4 (1) 12 12 16 13 (28) (34) n / a n / a 7 3Other assets (1) (5) 2 (3) 20 20 7 – (22) (25) 4 7 1 (4)Total assets (after cons. of investments in subsidiaries) 9 5 15 8 34 34 23 19 – (2) (8) (5) 13 8Liabilities Liabilities for investment contracts n / a n / a 22 12 n / a n / a n / a n / a n / a n / a – – 22 12Reserves for insurance contracts, gross 5 2 12 6 80 80 (7) (9) (4) (5) 22 28 9 5
Reserves for losses and loss adjustment expenses, gross 5 1 nm nm 85 85 10 10 (17) (21) 32 38 5 2Reserves for unearned premiums, gross 10 5 (5) (10) 77 77 (69) (69) (27) (28) 9 nm 15 11Future life policyholders’ benefits, gross 5 1 6 1 n / a n / a (8) (11) 13 13 2 3 6 1Policyholders’ contract deposits and other funds, gross 3 – 18 13 n / a n / a n / a n / a (8) (8) nm nm 12 8Reserves for unit-linked contracts, gross n / a n / a 25 16 n / a n / a (14) n / a (4) (4) n / a n / a 17 11
Debt related to capital markets and banking activities n / a n / a n / a n / a n / a n / a n / a n / a (14) (16) (61) (61) (25) (28)Senior debt 32 25 (6) (11) n / a n / a 16 14 3 – (6) (3) 90 83Subordinated debt (6) (6) 73 67 n / a n / a 2 – nm nm (13) (11) 2 –Other liabilities 14 8 18 11 13 13 (38) (47) 41 33 (21) (17) 14 7Total liabilities 7 3 15 8 49 49 10 7 1 (1) (8) (5) 12 6Equity Common shareholders’ equity 30 (1)Preferred securities n / a –Shareholders’ equity 29 (1)Non-controlling interests 8 nmTotal equity 28 23Total liabilities and equity 13 8
variance in % over the prior period, for the nine months ended September 30, 2009Assets and liabilities by business segment – FX adjusted
variance in % over the prior period, for the nine months ended September 30, 2009Assets and liabilities by business segment – FX adjusted

Financial Information
Zurich Financial Services Group Results for the Nine Months to September 30, 2009Financial Supplement25
Information for the nine months ended September 30 – FX adjusted (unaudited)
Global
Corporate
North
America
Commercial
Europe
General
Insurance
International
Markets
GI Global Functions
including Group
Reinsurance Eliminations Total
% GC % LC % GC % LC % GC % LC % GC % LC % GC % LC % GC % LC % GC % LC
Gross written premiums and policy fees (5) 2 (11) (10) (13) (1) (5) 5 (7) 2 9 (2) (10) (3)Net earned premiums and policy fees (7) (3) (9) (8) (11) 2 (3) 7 (31) (24) n / a n / a (9) (1)Insurance benefits and losses, net 20 16 13 13 8 (5) 3 (8) (36) (35) n / a n / a 12 4Policyholder dividends and participation in profits, net 68 79 23 23 nm nm n / a n / a n / a n / a n / a n / a 30 33Total net technical expenses 7 5 7 6 10 (3) 3 (7) 56 51 nm nm 9 1Net underwriting result nm nm nm nm (51) (47) (15) (27) (31) (29) nm nm nm nmNet investment income (14) (9) (7) (7) (30) (19) (15) (1) (62) (59) 87 86 (19) (13)Net capital gains/(losses) and impairments on investments nm nm nm nm nm nm n / a n / a n / a n / a n / a n / a nm nmNet non-technical result (excl. items not included in BOP) nm nm 8 8 14 1 25 16 31 21 nm nm (9) (20)Business operating profit before non-controlling interests nm nm 24 24 (39) (31) (11) (5) (47) (46) n / a n / a (4) 3Non-controlling interests nm nm (23) (23) nm nm 23 23 n / a n / a n / a n / a nm nmBusiness operating profit nm nm 24 24 (38) (30) (11) (4) (47) (46) n / a n / a (3) 4
variance in % over the prior period, for the nine months ended September 30, 2009General Insurance – Customer segment overview – FX adjusted
variance in % over the prior period, for the nine months ended September 30, 2009General Insurance – Customer segment overview – FX adjusted

Financial Information
Zurich Financial Services Group Results for the Nine Months to September 30, 2009Financial Supplement26
Information for the nine months ended September 30 – FX adjusted (unaudited)
Americas
United
Kingdom Germany Switzerland Ireland Spain
Emerging
Markets in Asia
Rest of
the world Eliminations Total
% GC % LC % GC % LC % GC % LC % GC % LC % GC % LC % GC % LC % GC % LC % GC % LC % GC % LC % GC % LC
Revenues Life insurance deposits 10 12 (10) 14 10 22 (33) (29) 9 22 nm nm (34) (19) (15) (5) n / a n / a 10 28Gross written premiums and policy fees 8 15 (30) (12) (17) (7) (11) (6) 4 16 nm nm (10) (4) 15 28 nm nm 21 35Net earned premiums and policy fees 8 16 (34) (17) (17) (8) (11) (6) 5 17 nm nm (16) (10) 19 32 n / a n / a 23 37
Net investment income on Group investments (1) 3 (50) (37) (11) (1) (8) (4) (19) (10) nm nm (22) (21) (15) (5) n / a n / a (9) 1Net capital gains/(losses) and impairments on Group investments nm nm nm nm (21) (34) nm nm nm nm nm nm 1 3 69 71 n / a n / a 99 nm
Net investment result on Group investments 5 10 75 nm (13) (3) 10 16 (78) (76) nm nm (12) (11) (11) – n / a n / a 6 17Net investment income on unit-linked investments nm nm (38) (22) (25) (16) (77) (76) (26) (17) 86 nm (72) (65) (76) (72) n / a n / a (41) (27)Net capital gains/(losses) and impairments on unit-linked investments nm nm nm nm nm nm nm nm nm nm nm nm nm nm nm nm n / a n / a nm nm
Net investment result on unit-linked investments nm nm nm nm nm nm nm nm nm nm nm nm nm nm nm nm n / a n / a nm nmOther income (6) (5) (66) (58) (47) (41) (34) (31) nm nm nm nm 26 58 (6) 8 39 30 (39) (30)Total BOP revenues 42 51 nm nm nm nm 1 5 nm nm nm nm nm nm nm nm 39 30 nm nmBenefits, losses and expenses Insurance benefits and losses, net (6) (17) 40 25 8 (3) 11 7 49 44 nm nm (36) (40) (2) (12) n / a n / a (33) (47)Policyholder dividends and participation in profits, net nm nm nm nm nm nm nm nm nm nm nm nm nm nm nm nm n / a n / a nm nmIncome tax expense/(benefit) attributable to policy-holders n / a n / a nm nm 83 81 n / a n / a nm nm n / a n / a 12 13 nm nm n / a n / a nm nmUnderwriting and policy acquisition costs, net nm nm 81 76 19 10 6 2 (39) (55) nm nm 93 98 1 (9) nm nm 53 47Administrative and other operating expense (excl. depreciation / amortization) (7) (13) 15 (7) 4 (7) 14 10 (19) (32) (60) (79) (27) (50) 17 5 (34) (24) 5 (8)Interest credited to policyholders and other interest 1 1 83 79 32 24 25 21 n / a n / a nm nm (1) – 5 (2) nm nm 24 20Restructuring provisions and other items not inlcuded in BOP nm nm nm nm nm nm nm nm n / a n / a nm nm n / a n / a 66 85 n / a n / a nm nmTotal BOP benefits, losses and expenses (35) (47) nm nm nm nm – (5) nm nm nm nm nm nm nm nm (39) (30) nm nmBusiness operating profit (before interest, depre-ciation and amortization) 60 63 (46) (31) (19) (10) 3 8 (40) (33) nm nm 5 22 44 60 n / a n / a 3 14Depreciation and impairments of property and equipment 12 4 27 8 20 11 48 46 1 (10) 92 92 (4) (25) 2 (3) n / a n / a 23 11Amortization and impairments of intangible assets nm nm 92 90 6 (5) n / a n / a nm nm nm nm (60) nm nm nm n / a n / a (59) (79)Interest expense on debt (28) (28) nm nm 27 19 64 62 n / a n / a nm nm 90 90 (43) (60) n / a n / a nm nmBusiness operating profit before non-controlling interests 74 77 (35) (17) (21) (12) 7 12 (41) (35) nm nm 5 21 (39) (32) n / a n / a (7) 2Non-controlling interests nm nm n / a n / a 60 60 n / a n / a n / a n / a nm nm n / a n / a (98) (98) n / a n / a 78 78Business operating profit 73 76 (35) (17) (18) (9) 7 12 (41) (35) nm nm 5 21 (39) (32) n / a n / a (6) 4
variance in % over the prior period, for the nine months ended September 30, 2009
Global Life – Overview – FX adjusted
variance in % over the prior period, for the nine months ended September 30, 2009
Global Life – Overview – FX adjusted

Financial Information
Zurich Financial Services Group Results for the Nine Months to September 30, 2009Financial Supplement27
Summary of quarterly consolidated financial information (unaudited)
09/30/09 06/30/09 03/31/09 12/31/08 09/30/08 06/30/08 03/31/08 12/31/07 09/30/07
Gross written premiums and policy fees 13,039 13,184 14,242 12,800 12,399 12,345 14,350 11,532 10,977Net earned premiums and policy fees 11,993 11,198 11,280 11,825 10,520 10,786 10,976 10,750 10,122Net investment result on Group investments 1,927 1,593 804 1,077 769 1,793 2,165 2,620 2,670
Net investment income on Group investments 1,831 1,907 1,832 2,163 2,150 2,230 2,155 2,200 2,090Net capital gains/(losses) on Group investments and impairments 97 (314) (1,028) (1,086) (1,380) (437) 10 420 580
Net investment result on unit-linked investments 9,004 4,226 (3,303) (4,105) (8,221) (396) (9,008) 17 872Other revenues 1,172 1,031 1,004 980 957 1,171 1,059 1,081 1,149Total revenues 24,096 18,047 9,786 9,776 4,026 13,354 5,193 14,468 14,812Insurance benefits and losses, net of reinsurance 9,465 8,326 9,041 10,170 8,381 8,123 8,138 7,811 7,560Policyholder dividends and participation in profits, net of reinsurance 9,041 4,418 (3,229) (4,506) (8,293) (527) (8,188) 376 1,313Other expenses 3,997 4,016 3,765 4,298 4,057 4,208 3,824 4,406 4,015Total benefits, losses and expenses 22,503 16,760 9,576 9,962 4,145 11,804 3,775 12,593 12,888Net income before income taxes 1,593 1,287 209 (185) (119) 1,550 1,418 1,876 1,924Net income attributable to shareholders 909 892 362 205 154 1,254 1,427 1,529 1,509 Business operating profit 1,513 1,491 1,061 1,002 636 1,785 1,764 1,796 1,627
in USD millions, for the three months endedSummary of quarterly consolidated financial information
in USD millions, for the three months endedSummary of quarterly consolidated financial information

Financial Information
Financial Supplement (unaudited)
Explanatory notes
The information contained within the Financial Supplement is unaudited. This document should be read in conjunction with the Zurich Financial Services Group Financial Report 2008 and the unaudited consolidated financial statements.
Information regarding accounting policies and embedded value performance measures is located in the notes to the consolidated financial statements and the embedded value report in the Financial Report 2008.
FX adjusted informationThe percentages of variance in Group Currency (%GC) and Local Currency (%LC) are calculated based on the following methodology:
For Income Statement items, the %GC is calculated translating the current year figures using average exchange rates for the current period, and prior year figures using average exchange rates for the same prior year period. The %LC is calculated translating both current and prior year figures using average exchange rates of the same period of prior year.
For Balance Sheet items, %GC is calculated translating current year figures using closing exchange rates at the end of the current period, and prior year figures using closingexchange rates at the end of the prior year period. The %LC is calculated translating both current and prior year figures using the closing exchange rates at the end of the prior year period.
The GroupBook value per share – This measure is calculated by dividing common shareholders’ equity by the number of shares issued less the number of treasury shares.
Business operating profit (BOP) – This measure is the basis on which we manage all our business units. It indicates the underlying performance of our business units by eliminating the impact of financial market volatility and other non-operational variables. Business operating profit reflects adjustments for shareholders’ taxes, net capital gains on investments and impairments (except for the capital markets and banking operations, and investments in hedge funds and certain securities held for specific economic hedging purposes), policyholders’ share of investment results for the life businesses, non-operational foreign exchange movements, and significant items arising from special circumstances, including gains and losses on divestments of businesses. Business operating profit before interest, depreciation and amortization (BOPBIDA) is BOP before interest expense on debt, depreciation of property and equipment and amortization and impairment of goodwill and other intangibles, but including amortization of DAC and DOC. Adjusted business operating profit is adjusted for notional investment income on the difference between the average actual IFRS equity and the average allocated IFRS equity using one global swap rate. Allocated IFRS equity is equal to a segment’s share of the Group’s total IFRS equity allocated based on the segment’s proportion of the Group’s total risk based capital at each period end. These measures are not a substitute for net income as determined in accordance with International Financial Reporting Standards (IFRS).
Business operating profit (after-tax) return on common shareholders’ equity – This measure indicates the level of business operating profit or loss relative to resources provided by common shareholders. It is calculated as business operating profit or loss, annualized on a linear basis and adjusted for preferred shareholder dividends and taxes, divided by the average value of common shareholders’ equity on a simple basis using the value at the beginning and end of the period. Adjusted business operating profit return on common shareholders’ equity is based on average IFRS Group equity and is allocated to each segment based on its share of risk-based capital.
Investments – Total investments on our consolidated balance sheets includes Group investments and investments for unit-linked products. Our Group investments are those for which we bear part or all of the investment risk. They also include investments related to investment policies with discretionary participation features. Average invested assets exclude cash collateral received for securities lending. We manage our diversified Group investments portfolio to optimize benefits for both shareholders and policyholders while ensuring compliance with local regulatory and business requirements under the guidance of our Asset/Liability Management and Investment Committee. Investments for unit-linked products include such investments, where the policyholder bears the investment risk, and are held for liabilities related to unit-linked investment contracts and reserves for unit-linked insurance contracts. They are managed in accordance with the investment objectives of each unit-linked fund. The investment result for unit-linked products is passed to policyholders through a charge to policyholder dividends and participation in profits.
Zurich Financial Services Group Results for the Nine Months to September 30, 2009Financial Supplement28

Financial Information
Financial Supplement
Operational debt – This non-IFRS term refers to debt items that are excluded from rating agency leverage calculations such as collateralized loans, debt related to banking activities and obligations to repurchase securities.
Return on common shareholders’ equity (ROE) – This measure indicates the level of profit or loss relative to resources provided by common shareholders. It is calculated as net income after taxes attributable to common shareholders, annualized on a linear basis, divided by the average value of common shareholders’ equity on a simple basis using the value at the beginning and end of the period.
Zurich Financial Services Group Results for the Nine Months to September 30, 2009Financial Supplement29

Financial Information
Financial Supplement
General InsuranceThe following General Insurance measures are net of reinsurance.
Net underwriting result – This performance measure is calculated as the difference between earned premiums and policy fees and the sum of insurance benefits and losses and net technical expenses.
Total net technical expenses – This line item includes underwriting and policy acquisition costs, as well as the technical elements of administrative and other operating expenses, amortization of intangible assets, interest credited to policyholders and other interest, and other income.
Combined ratio – This performance measure indicates the level of claims and net technical expenses during the period relative to earned premiums and policy fees. It is calculated as earned premiums and policy fees minus the net underwriting result, divided by net earned premiums and policy fees.
Loss ratio – This performance measure indicates the level of claims during the period relative to earned premiums and policy fees. It is calculated as insurance benefits and losses, which include paid claims, claims incurred but not reported (IBNR) and claims handling costs, divided by earned premiums and policy fees.
Expense ratio – This performance measure indicates the level of technical expenses during the period relative to earned premiums and policy fees. It is calculated as the sum of net technical expenses and policyholder dividends and participation in profits, divided by earned premiums and policy fees.
Net non-technical result – This line item includes the non-technical elements of administrative and other operating expenses, amortization of intangible assets, interest credited to policyholders and other interest, other income, as well as net gains and losses on divestments of businesses and interest expense on debt.
Global LifeMore detailed information regarding embedded value performance measures is located in the Embedded Value Report in the Financial Report 2008.
Embedded value (EV) principles – This methodology uses a “bottom-up” market consistent approach, which explicitly allows for market risk. In particular, asset and liability cash flows are valued using risk discount rates consistent with those applied to similar cash flows in the capital markets, and options and guarantees are valued using market consistent models calibrated to observable market prices.
Insurance deposits – These deposits, similar to customer account balances, are not recorded as revenues. However, the fees charged on insurance deposits are recorded as revenue within the gross written premiums and policy fees line item. These deposits arise from investment contracts and insurance contracts that are accounted for under deposit accounting. They represent the pure savings part, which is invested.
New business annual premium equivalent (APE) – This measure is calculated as new business annual premiums plus 10 percent of single premiums. Present value of new business premiums (PVNBP) is calculated as the value of new business premiums discounted at the risk free rate.
New business value, after tax – This measure reflects the value added by new business written during the period, including allowing for frictional costs, time value of options and guarantees, and the cost of non-market risk, and is valued at the point of sale. It is calculated as the present value of the projected after-tax profit from life insurance contracts sold during the period.
FarmersGross management result – This performance measure is calculated as management fees and other related revenues minus management and other related expenses, which include amortization and impairments of intangible assets.
Managed gross earned premium margin – This performance measure is calculated as gross operating profit of Farmers Management Services divided by the gross earned premiums of the Farmers Exchanges, which we manage but do not own.
Surplus ratio (Farmers Exchanges) – This measure indicates the amount of capital available to support the volume of insurance business written, and is calculated by dividing the end-of-period surplus balance by the net premium written in the preceding twelve month period.
Zurich Financial Services Group Results for the Nine Months to September 30, 2009Financial Supplement30

Financial Information
Financial Supplement
Disclaimer & Cautionary Statement
Certain statements in this document are forward-looking statements, including, but not limited to, statements that are predications of or indicate future events, trends, plans or objectives. Forward-looking statements include statements regarding our targeted profit improvement, return on equity targets, expense reductions, pricing conditions, dividend policy and underwriting claims improvements, as well as statements regarding our understanding of general economic, financial and insurance market conditions and expected developments. Undue reliance should not be placed on such statements because, by their nature, they are subject to known and unknown risks and uncertainties and can be affected by other factors that could cause actual results and plans and objectives of Zurich Financial Services Ltd or the Zurich Financial Services Group (the “Group”) to differ materially from those expressed or implied in the forward looking statements (or from past results). Factors such as (i) general economic conditions and competitive factors, particularly in our key markets; (ii) the risk of the global economic downturn and a downturn in the financial services industries in particular; (iii) performance of financial markets; (iv) levels of interest rates and currency exchange rates; (v) frequency, severity and development of insured claims events; (vi) mortality and morbidity experience; (vii) policy renewal and lapse rates; and (viii) changes in laws and regulations and in the policies of regulators may have a direct bearing on the results of operations of Zurich Financial Services Ltd and its Group and on whether the targets will be achieved. Zurich Financial Services Ltd undertakes no obligation to publicly update or revise any of these forward-looking statements, whether to reflect new information, future events or circumstances or otherwise.
It should be noted that past performance is not a guide to future performance. Please also note that interim results are not necessarily indicative of the full year results.
Persons requiring advice should consult an independent adviser.
This communication does not constitute an offer or an invitation for the sale or purchase of securities in any jurisdiction.
THIS COMMUNICATION DOES NOT CONTAIN AN OFFER OF SECURITIES FOR SALE IN THE UNITED STATES; SECURITIES MAY NOT BE OFFERED OR SOLD IN THE UNITED STATES ABSENT REGISTRATION OR EXEMPTION FROM REGISTRATION, AND ANY PUBLIC OFFERING OF SECURITIES TO BE MADE IN THE UNITED STATES WILL BE MADE BY MEANS OF A PROSPECTUS THAT MAY BE OBTAINED FROM THE ISSUER AND THAT WILL CONTAIN DETAILED INFORMATION ABOUT THE COMPANY AND MANAGEMENT, AS WELL AS FINANCIAL STATEMENTS.
Zurich Financial Services Group Results for the Nine Months to September 30, 2009Financial Supplement31