financial summary - toyota · financial summary (all financial information has been prepared in...
TRANSCRIPT

FINANCIAL SUMMARY
(All financial information has been prepared in accordance with accounting principles generally accepted in the United States of America)
FY2007
(April 1, 2006 through March 31, 2007)
English translation from the original Japanese-language document
TOYOTA MOTOR CORPORATION

Cautionary Statement with Respect to Forward-Looking Statements
This report contains forward-looking statements that reflect Toyota’s plans and expectations. These
forward-looking statements are not guarantees of future performance and involve known and unknown risks,
uncertainties and other factors that may cause Toyota’s actual results, performance, achievements or financial position
to be materially different from any future results, performance, achievements or financial position expressed or implied
by these forward-looking statements. These factors include: (i) changes in economic conditions and market demand
affecting, and the competitive environment in, the automotive markets in Japan, North America, Europe and other
markets in which Toyota operates; (ii) fluctuations in currency exchange rates, particularly with respect to the value of
the Japanese yen, the U.S. dollar, the Euro, the Australian dollar and the British pound; (iii) Toyota’s ability to realize
production efficiencies and to implement capital expenditures at the levels and times planned by management; (iv)
changes in the laws, regulations and government policies in the markets in which Toyota operates that affect Toyota’s
automotive operations, particularly laws, regulations and government policies relating to trade, environmental
protection, vehicle emissions, vehicle fuel economy and vehicle safety, as well as changes in laws, regulations and
government policies that affect Toyota’s other operations, including the outcome of future litigation and other legal
proceedings; (v) political instability in the markets in which Toyota operates; (vi) Toyota’s ability to timely develop
and achieve market acceptance of new products; and (vii) fuel shortages or interruptions in transportation systems,
labor strikes, work stoppages or other interruptions to, or difficulties in, the employment of labor in the major markets
where Toyota purchases materials, components and supplies for the production of its products or where its products are
produced, distributed or sold.
A discussion of these and other factors which may affect Toyota’s actual results, performance, achievements
or financial position is contained in Toyota’s annual report on Form 20-F, which is on file with the United States
Securities and Exchange Commission.
This report contains summarized and condensed financial statements prepared in accordance with accounting principles generally accepted in the United States of America. Certain prior year amounts have been reclassified to conform to the presentations for the year ended March 31, 2007.

Consolidated 1
BUSINESS RESULTS AND FINANCIAL POSITION (All financial information has been prepared in accordance with accounting principles generally accepted in the United States of America)
1. Summary of Consolidated Financial Results for FY2007
(1) Financial Results
During FY2007, the Japanese economy experienced some weakness in personal consumption,
but corporate revenues were in better shape and capital expenditure increased, resulting in a continuation of prolonged economic growth. Overseas, economic conditions remained steady overall, with stability in both capital expenditure and personal consumption in the United States, and acceleration in the pace of recovery in the European economy, while in Asia, the Chinese economy showed continued strong growth.
Under these conditions, consolidated vehicle sales in Japan and overseas increased by 550 thousand units, or 6.9%, to 8,524 thousand units in FY2007 compared with FY2006 (April 1, 2005 through March 31, 2006), marking a record high. Vehicle sales in Japan in FY2007 decreased by 91 thousand units, or 3.9%, to 2,273 thousand units compared with FY2006 under the declined market in Japan compared to FY2006. With the efforts of dealers nationwide, however, Toyota and Lexus’ market share excluding mini-vehicles was 45.8%, and its market share (including Daihatsu and Hino) including mini-vehicles was 41.5%, each representing a record high. Meanwhile, overseas vehicle sales in FY2007 increased significantly by 641 thousand units, or 11.4%, to 6,251 thousand units, compared with FY2006, because of sales expansion in North America, Europe and other regions.
As for the results of operations, net revenues increased by 2,911.1 billion yen, or 13.8%, to 23,948.0 billion yen in FY2007 compared with FY2006, and operating income increased by 360.3 billion yen, or 19.2%, to 2,238.6 billion yen in FY2007 compared with FY2006. Among the factors contributing to the increase in operating income totaling 720.0 billion yen, were the effects of marketing efforts of 330.0 billion yen, changes in exchange rates of 290.0 billion yen, and cost reduction efforts of 100.0 billion yen. On the other hand, factors resulting in the decrease in operating income primarily included an increase in expenses of 359.7 billion yen. Income before income taxes, minority interest and equity in earnings of affiliated companies increased by 295.2 billion yen, or 14.1%, to 2,382.5 billion yen in FY2007 compared with FY2006. Net income increased by 271.9 billion yen, or 19.8%, to 1,644.0 billion yen in FY2007 compared with FY2006.

Consolidated 2
(All financial information has been prepared in accordance with accounting principles generally accepted in the United States of America)
(2) Cash Flows Cash flows from operating activities resulted in an increase in cash by 3,238.1 billion yen in
FY2007, mainly due to the net income of 1,644.0 billion yen. Net cash provided by operating activities increased by 722.7 billion yen from 2,515.4 billion yen in FY2006. Cash flows from investing activities resulted in a decrease in cash by 3,814.3 billion yen in FY2007, mainly due to the additions to finance receivables of 7,343.4 billion yen. Net cash used in investing activities increased by 438.8 billion yen from 3,375.5 billion yen in FY2006. Cash flows from financing activities resulted in an increase in cash by 881.7 billion yen in FY2007. Net cash provided by financing activities increased by 4.8 billion yen from 876.9 billion yen in FY2006. After consideration of the effect of changes in exchange rates, cash and cash equivalents increased by 331.0 billion yen, or 21.1%, to 1,900.3 billion yen at the end of FY2007 compared with the end of FY2006.
Regarding the consolidated cash flows by segment for FY2007, in non-financial services business, net cash provided by operating activities was 2,612.0 billion yen, net cash used in investing activities was 1,608.6 billion yen and net cash used in financing activities was 728.7 billion yen. Meanwhile, in the financial services business, net cash provided by operating activities was 790.2 billion yen, net cash used in investing activities was 2,324.0 billion yen and net cash provided by financing activities was 1,564.6 billion yen.
2. Consolidated Financial Results for FY2007 by Segment
(1) Segment Operating Results
Automotive:
Net revenues for the automotive operations increased by 2,589.9 billion yen, or 13.4%, to 21,928.0 billion yen in FY2007 compared with FY2006, and operating income increased by 344.8 billion yen, or 20.4%, to 2,038.8 billion yen in FY2007 compared with FY2006. The increase in operating income was mainly due to increases in both production volume and vehicle units sold, the effects of changes in exchange rates and cost reduction efforts, partially offset by an increase in expenses.
Financial services:
Net revenues for the financial services operations increased by 303.6 billion yen, or 30.5%, to 1,300.5 billion yen in FY2007 compared with FY2006, and operating income increased by 2.7 billion yen, or 1.7%, to 158.5 billion yen in FY2007 compared with FY2006. The increase in operating income was mainly due to a steady increase in financing volume, despite the valuation losses on interest rate swaps stated at fair value by sales finance subsidiaries in North America in accordance with the Statement of Financial Accounting Standards (FAS) No. 133 (as amended by several guidance including FAS No.138).
All other: Net revenues for all other businesses increased by 133.4 billion yen, or 11.2%, to 1,323.7
billion yen in FY2007 compared with FY2006, and operating income was 39.6 billion yen in FY2007, remaining at the same level as in FY2006.

Consolidated 3
(All financial information has been prepared in accordance with accounting principles generally accepted in the United States of America)
(2) Geographic Information
Japan: Net revenues in Japan increased by 1,703.8 billion yen, or 13.0%, to 14,815.3 billion yen in
FY2007 compared with FY2006, and operating income increased by 381.3 billion yen, or 35.4%, to 1,457.2 billion yen in FY2007 compared with FY2006. The increase in operating income was mainly due to the effects of changes in exchange rates, an increase in production volume, and the effects of cost reduction efforts, partially offset by an increase in expenses.
North America: Net revenues in North America increased by 1,341.8 billion yen, or 17.5%, to 9,029.7 billion
yen in FY2007 compared with FY2006, while operating income decreased by 46.0 billion yen, or 9.3%, to 449.6 billion yen in FY2007 compared with FY2006. The decrease in operating income was mainly due to the result of temporary expenses with the start up of the Texas plant, as well as the recording of valuation losses on interest rate swaps stated at fair value by sales finance subsidiaries in accordance with the Statement of Financial Accounting Standards (FAS) No. 133 (as amended by several guidance including FAS No.138).
Europe: Net revenues in Europe increased by 814.7 billion yen, or 29.9%, to 3,542.1 billion yen in
FY2007 compared with FY2006, and operating income increased by 43.4 billion yen, or 46.2%, to 137.3 billion yen in FY2007 compared with FY2006. The increase in operating income was mainly due to increases in both production volume and vehicle units sold and the effects of cost reduction efforts.
Asia:
Net revenues in Asia increased by 182.8 billion yen, or 8.9%, to 2,225.6 billion yen in the FY2007 compared with FY2006, while operating income decreased by 27.9 billion yen, or 19.2%, to 117.6 billion yen in the FY2007 compared with FY2006. The decrease in operating income was mainly due to decreases in both production volume and vehicle units sold.
Other:
Net revenues in other markets increased by 321.0 billion yen, or 20.0 %, to 1,922.7 billion yen in FY2007 compared with FY2006, and operating income increased by 16.3 billion yen, or 24.3%, to 83.5 billion yen in FY2007 compared with FY2006. The increase in operating income was mainly due to increases in both production volume and vehicle units sold.

Consolidated 4
(All financial information has been prepared in accordance with accounting principles generally accepted in the United States of America) 3. Basic Policy on the Distribution of Profits and the Distribution of Profits for FY2007
Toyota Motor Corporation (“TMC”) deems the benefit of its shareholders as one of its priority
management policies and continuously strives to increase per-share earnings, through aggressively promoting its business while improving and strengthening its corporate foundations. With respect to the payment of dividends, TMC seeks to enhance the distribution of profits by striving to raise the consolidated dividend payout ratio, with the aim of increasing it to 30% over the medium- to long-term, while giving due consideration to factors such as the business results of each term and new investment plans. Furthermore, TMC repurchases its own shares to improve capital efficiency and responds appropriately to changes in the business environment.
As TMC anticipates the continued growth of worldwide automotive markets, TMC will utilize its internal funds to invest in improvement of product performance and development of next-generation technologies to achieve future growth, to develop production and sales networks in both domestic and overseas markets for further expansion of its global business and to expand into new business areas, while securing a solid management foundation.
As for dividends, in addition to the increase in interim dividends declared in November 2006 by 15 yen per share to 50 yen per share, TMC plans to increase the year-end dividends by 15 yen per share to 70 yen per share. As a result, on an annual basis, the dividends will be 120 yen per share, which is 30 yen higher than in the previous year, and the consolidated dividend payout ratio for FY2007 would be 23.4%.
TMC pays dividends twice a year — an interim dividend and a year-end dividend —, and in order to secure an opportunity to directly seek shareholders’ opinions, TMC will treat payments of year-end dividends as a matter to be resolved at TMC’s 103rd ordinary general shareholders’ meeting, even though TMC’s articles of incorporation stipulate that retained earnings can be distributed as dividends pursuant to the resolution of the board of directors.
Also, in accordance with the policy mentioned above, TMC repurchased 44 million of its own shares during FY2007 at an aggregate cost of 299.5 billion yen (excluding fractional shares repurchased in accordance with shareholders’ requests to purchase).

Consolidated 5
(All financial information has been prepared in accordance with accounting principles generally accepted in the United States of America)
4. Forecast of Financial Results for FY2008
Although we expect overall growth of the world economy to continue, we face a variety of unstable elements in the future business environment, including concerns about the future of the American economy, changes in the pace of growth of the Chinese economy, and movement in oil prices. The Japanese economy is experiencing a moderate expansion, but there are concerns that rapid fluctuations in exchange rates and continuing high prices for raw materials may have an adverse impact on corporate revenue, which is the driving force of the current economy. In the automobile industry, emerging markets which are expected to continue to grow, competition among leading global and regional auto makers is becoming increasingly fierce. In addition, environmental regulations are being strengthen throughout the world and environmental awareness is on the rise, leading to intense global competition in the development of technologies and the introduction of new products.
Under these circumstances, current forecast of consolidated financial results for the next fiscal year ending March 2008 is set forth below. This forecast assumes average exchange rates through the fiscal year of 115 yen per US$1 and 150 yen per 1 euro.
Forecast of consolidated results for FY2008 Net revenues 25,000.0 billion yen (an increase of 4.4% compared with FY2007) Operating income 2,250.0 billion yen (an increase of 0.5% compared with FY2007) Income before income taxes,
minority interest and equity in earnings of affiliated companies
2,400.0 billion yen (an increase of 0.7% compared with FY2007)
Net income 1,650.0 billion yen (an increase of 0.4% compared with FY2007)
These forward-looking statements are not guarantees of future performance and involve known and unknown risks, uncertainties and other factors that may cause Toyota’s actual results, performance, achievements or financial position to be materially different from any future results, performance, achievements or financial position expressed or implied by these forward-looking statements.
When using forecast of financial results, please refer to the Cautionary Statement with Respect to Forward-Looking Statements in the Financial Summary on the inside cover.

Consolidated 6
OVERVIEW OF ASSOCIATED COMPANIES (All financial information has been prepared in accordance with accounting principles generally accepted in the United States of America)
Toyota Motor Corporation (“TMC”) and its associated companies (522 consolidated subsidiaries and 222 affiliates as of
March 31, 2007) are engaged mainly in the automotive industry and also in the financial services and other businesses. The following three business segments are segmented on the basis as stated under the “Segment Information” according to
the business category.
Automotive: This business involves the design, manufacturing and distribution of sedans, minivans, compact cars, sport-utility vehicles, trucks and related parts and accessories. Automobiles are manufactured mainly by TMC, Hino Motors, Ltd., and Daihatsu Motor Co., Ltd., but a portion of manufacturing is consigned to Toyota Auto Body Co., Ltd. and others. Automobiles are also manufactured by Toyota Motor Manufacturing, Kentucky, Inc. and other overseas companies. Automobile parts are manufactured by TMC, Denso Corporation and others. These products are sold through Tokyo ToyoPet Motor Sales Co., Ltd. and other dealers and to certain large customers, directly by TMC. Overseas, sales are made through Toyota Motor Sales, U.S.A., Inc. and other distributors and dealers. In addition, Volkswagen vehicles are sold through TMC and some dealers in Japan.
Financial Services: This business involves the provision of financing to support the sales of automobiles and other products manufactured by TMC and its associated companies and also covers the leasing of automobiles and equipment. Toyota Finance Corporation in Japan, Toyota Motor Credit Corporation and other overseas associated companies provide sales financing for TMC's products and the products of its associated companies.
All other: Other business includes the design, manufacturing and sale of housing, telecommunications and other businesses. Housing is manufactured mainly by TMC and sold through Toyota Housing Corporation and housing dealers in Japan.
Other major companies include Toyota Motor North America, Inc., which deals with public relations and research activities in
North America, Toyota Motor Engineering & Manufacturing North America, Inc., which carries out research and development and controls manufacturing companies in North America, Toyota Motor Europe NV/SA, which controls manufacturing and sales companies and deals with public relations and research activities in Europe, and Toyota Financial Services Corporation, which controls the management of financial companies.
* Consolidated subsidiaries, ** Companies accounted for under the equity method
Flow of services
Flow of products Toyota Motor Corporation
*Hino Motors, Ltd. *Daihatsu Motor Co., Ltd.
Manufacturing companies in Japan *Toyota Motor Kyushu, Inc. *Toyota Motor Hokkaido, Inc.*Toyota Auto Body Co., Ltd. *Kanto Auto Works, Ltd.
**Toyota Industries Corporation **Aichi Steel Corporation **JTEKT Corporation **Aisin Seiki Co., Ltd. **Denso Corporation **Toyoda Gosei Co., Ltd. **Toyota Boshoku Corporation **Aisin AW Co., Ltd. etc.
Manufacturing companies overseas *Toyota Motor Manufacturing, Kentucky, Inc. *Toyota Motor Manufacturing, Indiana, Inc. *Toyota Motor Manufacturing Canada Inc. *Toyota Motor Manufacturing (UK) Ltd. *Toyota Motor Thailand Co., Ltd. *Toyota Motor Corporation Australia Ltd. *PT Astra Daihatsu Motor **New United Motor Manufacturing, Inc. etc.
Dealers in Japan Distributors overseas*Tokyo Toyota Motor Co., Ltd. *Tokyo Toyopet Motor Sales Co., *Osaka Toyota Motor Co., Ltd. *Toyota Tokyo Corolla Co., Ltd. *Tokyo Hino Motors, Ltd. *Hyogo Daihatsu Hanbai Co., Ltd. etc.
*Toyota Motor Sales, U.S.A., Inc. *Toyota Deutschland GmbH. *Toyota (GB) PLC *Hino Motor Sales (Thailand) Ltd. *Daihatsu Deutschland GmbH. etc.
Financial companies * Toyota Finance Corporation * Toyota Motor Credit Corporation etc.
Customers
Dealers overseas

Consolidated 7
(All financial information has been prepared in accordance with accounting principles generally accepted in the United States of America)
Note 1: Osaka Toyopet Co., Ltd. changed its trade name to Osaka Toyota Motor Co., Ltd. on August 8, 2006. Note 2: Toyota Motor Manufacturing, North America, Inc. changed its trade name to Toyota Motor Engineering & Manufacturing North America, Inc. on April 1, 2006. <Overview of Changes in Major Associated Companies> For FY2007, the change in our major associated companies is as follows: (Change in major associated companies) Companies excluded from consolidated accounting: Toyota Motor North America, Inc.
Toyota Motor North America, Inc., which was a consolidated subsidiary of TMC as of March 31, 2006,
merged into Toyota Technical Center USA, Inc., which is also a consolidated subsidiary of TMC, as of April. Also, Toyota Technical Center USA, Inc. changed its trade name to Toyota Motor North America, Inc.
as of the effective date of the merger.

Consolidated 8
MANAGEMENT POLICY (All financial information has been prepared in accordance with accounting principles generally accepted in the United States of America)
1. Toyota’s Basic Management Policy
Toyota Motor Corporation (“TMC”) holds up the “Guiding Principles at Toyota Motor Corporation” as
its basic management policy and believes that efforts to achieve the goals set forth in the principles will lead to an increase in corporate value. The “Guiding Principles at Toyota Motor Corporation” are as follows:
(1) Honor the language and spirit of the law of every nation and undertake open and fair corporate
activities to be a good corporate citizen of the world. (2) Respect the culture and customs of every nation and contribute to economic and social
development through corporate activities in the communities. (3) Dedicate ourselves to providing clean and safe products and to enhancing the quality of life
everywhere through all our activities. (4) Create and develop advanced technologies and provide outstanding products and services that
fulfill the needs of customers worldwide. (5) Foster a corporate culture that enhances individual creativity and teamwork value, while
honoring mutual trust and respect between labor and management. (6) Pursue growth in harmony with the global community through innovative management. (7) Work with business partners in research and creation to achieve stable, long-term growth and
mutual benefits, while keeping ourselves open to new partnerships.
2. Medium- and Long-term Management Strategy
To put in place a solid foundation while continuing to achieve further growth, the Toyota Group will make combined efforts to address the following agenda.
First, one short-term issue is the stimulation of the Japanese market through the introduction of market-creating products that anticipate customer needs and the implementation of demand-generating strategies with a sense of speed that will promote stronger interest in automobiles. Overseas, on the other hand, we will make every effort to ensure the smooth start up of our new plants in the United States (Mississippi), Canada, Russia, and China, and through further development of the foundation of production, purchasing, and sales structures, promote corporate activities that are rooted in the local regions.
Medium- to long-term issues include the development and commercialization of innovative new technologies related to the environment, safety, and energy, which lead to the realization of the ultimate automobile manufacturing that is beneficial to people, society, and the earth. Next, we will implement global quality improvements in local procurement, one of Toyota’s strengths, to maintain and enhance the world’s leading level of quality and raise cost competitiveness, thus supporting high-quality and sustainable growth. In addition, Toyota fulfills its social responsibilities by carrying out corporate social responsibility (CSR) activities through philanthropic activities undertaken from a global perspective and thorough corporate ethics including full compliance with applicable laws and regulations. Based on the belief that the development of human resources is fundamental to corporate competitiveness, Toyota is engaged in the training of highly-creative personnel that will pass on Toyota’s manufacturing technologies, skills and values to the next generation.
By addressing these agenda, Toyota is working to enhance its corporate value as a company with energy and dignity and maintain growth in harmony with society rooted in “manufacturing” over the 21st century.

Consolidated 9
CONSOLIDATED PRODUCTION AND SALES (All financial information has been prepared in accordance with accounting principles generally accepted in the United States of America)
1. Production
(Units)
FY2006
(April 2005 through March 2006)
FY2007 (April 2006 through
March 2007)
Increase (Decrease)
Japan 4,684,956 5,100,823 415,867
North America 1,201,459 1,204,676 3,217
Europe 622,552 709,263 86,711
Asia 835,669 754,960 (80,709)
Other 367,011 411,229 44,218
Overseas total 3,026,691 3,080,128 53,437
Vehicles (new)
Total 7,711,647 8,180,951 469,304
Houses (Japan) 5,269 5,621 352
Note: The total production of vehicles (new) includes 763,573 units in FY2006 and 855,579 units in FY2007 of Daihatsu brand vehicles (including OEM production), and 100,018 units in FY2006 and 99,511 units in FY2007 of Hino brand vehicles.
2. Sales (by destination) (Units)
FY2006
(April 2005 through March 2006)
FY2007 (April 2006 through
March 2007)
Increase (Decrease)
Japan 2,364,484 2,273,152 (91,332)
North America 2,556,050 2,942,661 386,611
Europe 1,022,781 1,223,628 200,847
Asia 880,661 789,637 (91,024)
Other 1,150,587 1,295,581 144,994
Overseas total 5,610,079 6,251,507 641,428
Vehicles (new)
Total 7,974,563 8,524,659 550,096
Houses (Japan) 5,525 5,807 282
Note: The total sales of vehicles (new) include 711,757 units in FY2006 and 771,296 units in FY2007 of Daihatsu brand vehicles, and 102,474 units in FY2006 and 101,880 units in FY2007 of Hino brand vehicles.

Consolidated 10
BREAKDOWN OF CONSOLIDATED NET REVENUES (All financial information has been prepared in accordance with accounting principles generally accepted in the United States of America)
(Amounts are rounded to the nearest million yen)
FY2006
(April 2005 through March 2006)
FY2007 (April 2006 through
March 2007)
Increase (Decrease)
Vehicles 16,584,317 18,751,807 2,167,490
Parts & components for overseas production 298,492 334,619 36,127
Parts 1,311,617 1,551,969 240,352
Other 1,131,190 1,275,773 144,583
Total Automotive 19,325,616 21,914,168 2,588,552
Financial services 977,416 1,277,994 300,578
Housing 138,103 155,843 17,740
Telecommunications 51,485 59,611 8,126
Other 544,289 540,475 (3,814)
Total 21,036,909 23,948,091 2,911,182
Note: The amounts represent net revenues from external customers.

Consolidated 11
CONSOLIDATED STATEMENTS OF INCOME (All financial information has been prepared in accordance with accounting principles generally accepted in the United States of America)
(Amounts are rounded to the nearest million yen)
FY2006
(April 2005 through March 2006)
FY2007 (April 2006 through
March 2007)
Increase (Decrease)
Net revenues : 21,036,909 23,948,091 2,911,182
Sales of products 20,059,493 22,670,097 2,610,604
Financing operations 977,416 1,277,994 300,578
Costs and expenses : 19,158,567 21,709,408 2,550,841
Cost of products sold 16,335,312 18,356,255 2,020,943
Cost of financing operations 609,632 872,138 262,506
Selling, general and administrative 2,213,623 2,481,015 267,392
Operating income 1,878,342 2,238,683 360,341
Other income (expense) : 209,018 143,833 (65,185)
Interest and dividend income 93,970 131,939 37,969
Interest expense (21,601) (49,326) (27,725)
Foreign exchange gain, net 10,789 33,005 22,216
Other, income net 125,860 28,215 (97,645)
Income before income taxes, minority interest and equity in earnings of affiliated companies
2,087,360 2,382,516 295,156
Provision for income taxes 795,153 898,312 103,159
Income before minority interest and equity in earnings of affiliated companies 1,292,207 1,484,204 191,997
Minority interest in consolidated subsidiaries (84,393) (49,687) 34,706
Equity in earnings of affiliated companies 164,366 209,515 45,149
Net income 1,372,180 1,644,032 271,852
(Yen)
Net income per share – Basic 421.76 512.09 90.33
Net income per share – Diluted 421.62 511.80 90.18

Consolidated 12
CONSOLIDATED BALANCE SHEETS (All financial information has been prepared in accordance with accounting principles generally accepted in the United States of America)
(Amounts are rounded to the nearest million yen)
FY2006 (As of March 31, 2006)
FY2007 (As of March 31, 2007)
Increase (Decrease)
Assets
Current assets : 10,735,222 11,784,123 1,048,901
Cash and cash equivalents 1,569,387 1,900,379 330,992
Time deposits 50,349 26,709 (23,640)
Marketable securities 634,879 435,463 (199,416)
Trade accounts and notes receivable, less allowance for doubtful accounts 1,980,680 2,023,818 43,138
Finance receivables, net 3,497,319 4,036,363 539,044
Other receivables 416,336 486,170 69,834
Inventories 1,620,975 1,803,956 182,981
Deferred income taxes 520,494 551,503 31,009
Prepaid expenses and other current assets 444,803 519,762 74,959
Noncurrent finance receivables, net 4,830,216 5,694,733 864,517
Investments and other assets : 6,099,529 7,035,404 935,875
Marketable securities and other securities investments 3,402,523 3,829,852 427,329
Affiliated companies 1,828,369 2,058,177 229,808
Employees receivables 75,094 96,742 21,648
Other 793,543 1,050,633 257,090
Property, plant and equipment : 7,066,628 8,060,519 993,891
Land 1,215,897 1,233,137 17,240
Buildings 3,156,613 3,444,764 288,151
Machinery and equipment 8,482,832 9,184,751 701,919
Vehicles and equipment on operating leases 2,605,426 3,309,337 703,911
Construction in progress 397,076 349,465 (47,611)
Less – Accumulated depreciation (8,791,216) (9,460,935) (669,719)
Total assets 28,731,595 32,574,779 3,843,184

Consolidated 13
(All financial information has been prepared in accordance with accounting principles generally accepted in the United States of America)
(Amounts are rounded to the nearest million yen)
FY2006 (As of March 31, 2006)
FY2007 (As of March 31, 2007)
Increase (Decrease)
Liabilities
Current liabilities : 10,028,735 11,767,170 1,738,435
Short-term borrowings 3,033,019 3,497,391 464,372
Current portion of long-term debt 1,723,888 2,368,116 644,228
Accounts payable 2,086,587 2,211,586 124,999
Other payables 730,184 807,481 77,297
Accrued expenses 1,464,263 1,668,337 204,074
Income taxes payable 347,488 421,196 73,708
Other current liabilities 643,306 793,063 149,757
Long-term liabilities : 7,552,831 8,343,273 790,442
Long-term debt 5,640,490 6,263,585 623,095
Accrued pension and severance costs 679,918 640,586 (39,332)
Deferred income taxes 1,092,995 1,312,400 219,405
Other long-term liabilities 139,428 126,702 (12,726)
Total liabilities 17,581,566 20,110,443 2,528,877
Minority interest in consolidated subsidiaries 589,580 628,244 38,664
Shareholders’ equity
Common stock 397,050 397,050 –
Additional paid-in capital 495,250 497,593 2,343
Retained earnings 10,459,788 11,764,713 1,304,925
Accumulated other comprehensive income 437,316 701,390 264,074
Treasury stock, at cost (1,228,955) (1,524,654) (295,699)
Total shareholders’ equity 10,560,449 11,836,092 1,275,643
Total liabilities and shareholders’ equity 28,731,595 32,574,779 3,843,184

Consolidated 14
CONSOLIDATED STATEMENTS OF SHAREHOLDERS’ EQUITY
(All financial information has been prepared in accordance with accounting principles generally accepted in the United States of America)
(1) FY2006 (April 2005 through March 2006) (Amounts are rounded to the nearest million yen)
Common
stock
Additional paid-in capital
Retained earnings
Accumulated other
comprehensive income (loss)
Treasury stock, at cost
Total shareholders’
equity
Balances at March 31, 2005 397,050 495,707 9,332,176 (80,660) (1,099,323) 9,044,950Issuance during the year (457) (457)Comprehensive income : Net income 1,372,180 1,372,180 Other comprehensive income Foreign currency translation
adjustments 268,410 268,410
Unrealized gains on securities, net of reclassification adjustments
244,629 244,629
Minimum pension liability adjustments 4,937 4,937
Total comprehensive income 1,890,156Dividends paid (244,568) (244,568)Purchase and reissuance of common
stock (129,632) (129,632)
Balances at March 31, 2006 397,050 495,250 10,459,788 437,316 (1,228,955) 10,560,449
(2) FY2007 (April 2006 through March 2007) (Amounts are rounded to the nearest million yen)
Common
stock
Additional paid-in capital
Retained earnings
Accumulated other
comprehensive income (loss)
Treasury stock, at cost
Total shareholders’
equity
Balances at March 31, 2006 397,050 495,250 10,459,788 437,316 (1,228,955) 10,560,449Issuance during the year 2,343 2,343Comprehensive income : Net income 1,644,032 1,644,032 Other comprehensive income Foreign currency translation
adjustments 130,746 130,746
Unrealized gains on securities, net of reclassification adjustments
38,800 38,800
Minimum pension liability adjustments 3,499 3,499
Total comprehensive income 1,817,077Adjustment to initially apply
FAS No.158 91,029 91,029
Dividends paid (339,107) (339,107)Purchase and reissuance of common
stock (295,699) (295,699)
Balances at March 31, 2007 397,050 497,593 11,764,713 701,390 (1,524,654) 11,836,092

Consolidated 15
CONSOLIDATED STATEMENTS OF CASH FLOWS (All financial information has been prepared in accordance with accounting principles generally accepted in the United States of America)
(Amounts are rounded to the nearest million yen)
FY2006 (April 2005 through
March 2006)
FY2007 (April 2006 through
March 2007) Cash flows from operating activities :
Net income 1,372,180 1,644,032 Adjustments to reconcile net income to net cash provided by operating activities
Depreciation 1,211,178 1,382,594 Provision for doubtful accounts and credit losses 62,646 71,862 Pension and severance costs, less payments 23,860 (32,054) Loss on disposal of fixed assets 54,981 50,472 Unrealized losses on available-for-sale securities, net 4,163 4,614 Deferred income taxes 33,262 132,308 Minority interest in consolidated subsidiaries 84,393 49,687 Equity in earnings of affiliated companies (164,366) (209,515) Changes in operating assets and liabilities and other (166,817) 144,173
Net cash provided by operating activities 2,515,480 3,238,173 Cash flows from investing activities :
Additions to finance receivables (6,476,979) (7,343,474) Collection of and proceeds from sales of finance receivables 5,718,130 6,236,582 Additions to fixed assets excluding equipment leased to others (1,523,459) (1,425,814) Additions to equipment leased to others (1,247,781) (1,410,003) Proceeds from sales of fixed assets excluding equipment leased to others 89,578 64,421
Proceeds from sales of equipment leased to others 410,683 359,923 Purchases of marketable securities and security investments (957,296) (1,068,205) Proceeds from sales of and maturity of marketable securities and security investments 691,032 825,171
Payment for additional investments in affiliated companies, net of cash acquired (1,802) (1,651)
Changes in investments and other assets and other (77,606) (51,328) Net cash used in investing activities (3,375,500) (3,814,378)
Cash flows from financing activities :
Purchase of common stock (129,629) (295,699) Proceeds from issuance of long-term debt 1,928,788 2,890,000 Payments of long-term debt (1,187,506) (1,726,823) Increase in short-term borrowings 509,826 353,397 Dividends paid (244,568) (339,107)
Net cash provided by financing activities 876,911 881,768 Effect of exchange rate changes on cash and cash equivalents 68,743 25,429 Net increase in cash and cash equivalents 85,634 330,992 Cash and cash equivalents at beginning of year 1,483,753 1,569,387 Cash and cash equivalents at end of year 1,569,387 1,900,379
Note: In the Consolidated Statements of Cash Flows, cash and cash equivalents include cash on hand, bank deposits that can be withdrawn at any time and short-term investments that can be converted into cash at any time and carry minimal risk of change in value.

Consolidated 16
SEGMENT INFORMATION (All financial information has been prepared in accordance with accounting principles generally accepted in the United States of America)
1. Segment Operating Results and Assets
(1) FY2006 (April 2005 through March 2006) (Amounts are rounded to the nearest million yen)
Automotive Financial Services All Other
Intersegment Elimination and/or
Unallocated Amount
Consolidated
Net revenues : (1) Sales to external
customers 19,325,616 977,416 733,877 – 21,036,909
(2) Intersegment sales and transfers 12,528 19,493 456,414 (488,435) –
Total 19,338,144 996,909 1,190,291 (488,435) 21,036,909 Operating expenses 17,644,099 841,092 1,150,543 (477,167) 19,158,567 Operating income 1,694,045 155,817 39,748 (11,268) 1,878,342 Assets 12,354,827 11,613,508 1,191,261 3,571,999 28,731,595 Investment in equity
method investees 1,459,556 287,326 – 73,835 1,820,717
Depreciation expenses 880,360 301,734 29,084 – 1,211,178 Capital expenditure 1,615,814 1,110,191 45,282 (47) 2,771,240
(2) FY2007 (April 2006 through March 2007)
(Amounts are rounded to the nearest million yen)
Automotive Financial Services All Other
Intersegment Elimination and/or
Unallocated Amount
Consolidated
Net revenues : (1) Sales to external
customers 21,914,168 1,277,994 755,929 – 23,948,091
(2) Intersegment sales and transfers 13,838 22,554 567,802 (604,194) –
Total 21,928,006 1,300,548 1,323,731 (604,194) 23,948,091 Operating expenses 19,889,178 1,142,053 1,284,052 (605,875) 21,709,408 Operating income 2,038,828 158,495 39,679 1,681 2,238,683 Assets 13,297,362 13,735,434 1,459,965 4,082,018 32,574,779 Investment in equity
method investees 1,664,938 303,271 – 59,072 2,027,281
Depreciation expenses 950,762 402,876 28,956 – 1,382,594 Capital expenditure 1,570,875 1,268,186 47,948 (51,192) 2,835,817
Note: Unallocated corporate assets included under “Intersegment Elimination and/or Unallocated Amount” for FY2006 and FY2007 are 4,231,148 million yen and 4,758,410 million yen, respectively, and consist primarily of funds such as cash and cash equivalents, marketable securities and portion of security investments held by TMC.

Consolidated 17
(All financial information has been prepared in accordance with accounting principles generally accepted in the United States of America)
2. Consolidated Financial Statements as Classified into Non-Financial Services Business and Financial Services Business
(1) Consolidated Statements of Income as Classified into Non-Financial Services Business and Financial
Services Business (Amounts are rounded to the nearest million yen)
FY2006
(April 2005 through March 2006)
FY2007 (April 2006 through
March 2007)
Increase (Decrease)
(Non-financial services) Net revenues 20,068,284 22,679,078 2,610,794 Costs and expenses : 18,328,868 20,592,375 2,263,507
Cost of revenues 16,335,340 18,361,641 2,026,301
Selling, general and administrative 1,993,528 2,230,734 237,206
Operating income 1,739,416 2,086,703 347,287
Other income, net 201,978 145,570 (56,408)
Income before income taxes, minority interest and equity in earnings of affiliated companies
1,941,394 2,232,273 290,879
Provision for income taxes 736,909 844,797 107,888
Income before minority interest and equity in earnings of affiliated companies 1,204,485 1,387,476 182,991
Minority interest in consolidated subsidiaries (82,401) (49,513) 32,888
Equity in earnings of affiliated companies 142,139 193,130 50,991
Net income 1,264,223 1,531,093 266,870 (Financial services)
Net revenues 996,909 1,300,548 303,639 Costs and expenses : 841,092 1,142,053 300,961
Cost of revenues 613,563 879,203 265,640
Selling, general and administrative 227,529 262,850 35,321
Operating income 155,817 158,495 2,678
Other expenses, net (9,859) (8,171) 1,688
Income before income taxes, minority interest and equity in earnings of affiliated companies
145,958 150,324 4,366
Provision for income taxes 58,241 53,548 (4,693) Income before minority interest and equity in
earnings of affiliated companies 87,717 96,776 9,059
Minority interest in consolidated subsidiaries (1,992) (174) 1,818
Equity in earnings of affiliated companies 22,227 16,385 (5,842)
Net income 107,952 112,987 5,035 (Elimination)
Elimination of net income 5 (48) (53) (Consolidated)
Net income 1,372,180 1,644,032 271,852

Consolidated 18
(All financial information has been prepared in accordance with accounting principles generally accepted in the United States of America)
(2) Consolidated Balance Sheets as Classified into Non-Financial Services Business and Financial Services Business
(Amounts are rounded to the nearest million yen)
FY2006 (As of March 31, 2006)
FY2007 (As of March 31, 2007)
Increase (Decrease)
Assets (Non-financial services)
Current assets : 7,154,653 7,614,395 459,742 Cash and cash equivalents 1,418,022 1,714,722 296,700
Marketable securities 633,036 433,434 (199,602) Trade accounts and notes receivable,
less allowance for doubtful accounts 2,002,577 2,044,729 42,152
Inventories 1,620,975 1,803,956 182,981 Prepaid expenses and other current assets 1,480,043 1,617,554 137,511 Investments and other assets 5,702,376 6,464,204 761,828 Property, plant and equipment 5,207,760 5,689,383 481,623
Total 18,064,789 19,767,982 1,703,193 (Financial services)
Current assets : 4,361,374 4,966,089 604,715 Cash and cash equivalents 151,365 185,657 34,292 Marketable securities 1,843 2,029 186 Finance receivables, net 3,497,319 4,036,363 539,044 Prepaid expenses and other current assets 710,847 742,040 31,193
Noncurrent finance receivables, net 4,830,216 5,694,733 864,517 Investments and other assets 563,050 703,476 140,426 Property, plant and equipment 1,858,868 2,371,136 512,268
Total 11,613,508 13,735,434 2,121,926 (Elimination)
Elimination of assets (946,702) (928,637) 18,065 (Consolidated) Total assets 28,731,595 32,574,779 3,843,184
Note: Assets in the non-financial services include unallocated corporate assets.
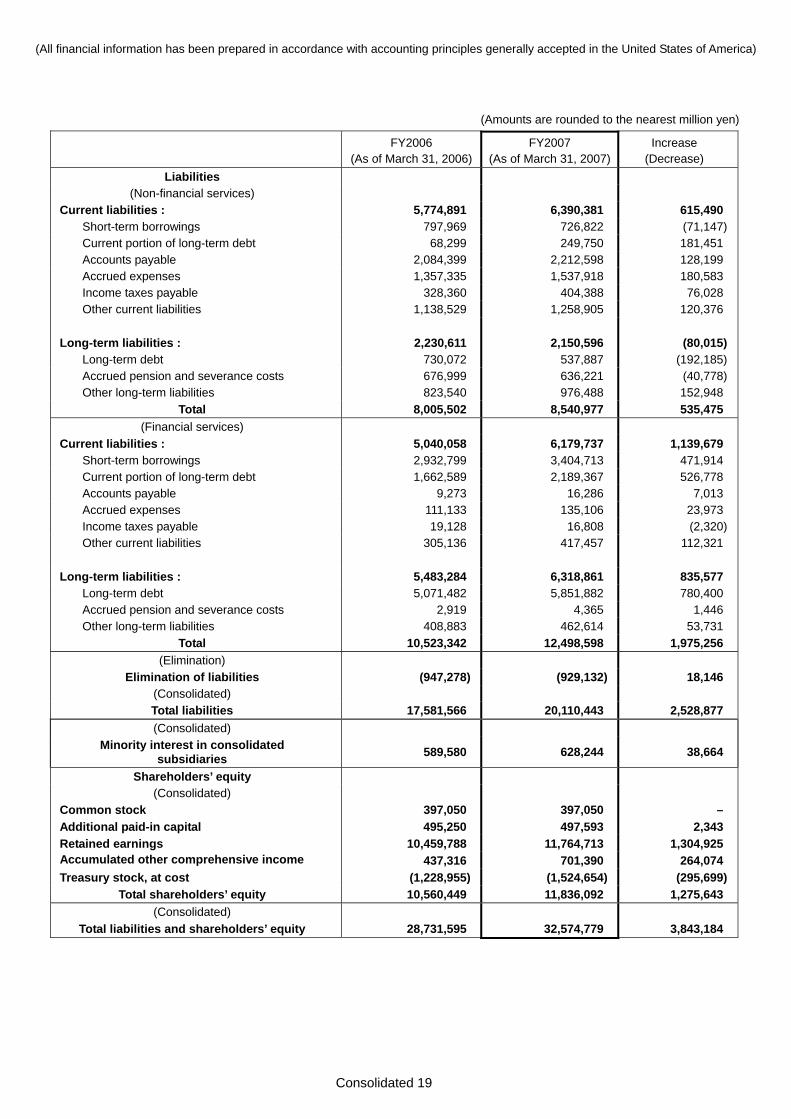
Consolidated 19
(All financial information has been prepared in accordance with accounting principles generally accepted in the United States of America)
(Amounts are rounded to the nearest million yen)
FY2006
(As of March 31, 2006)FY2007
(As of March 31, 2007) Increase
(Decrease) Liabilities
(Non-financial services) Current liabilities : 5,774,891 6,390,381 615,490 Short-term borrowings 797,969 726,822 (71,147) Current portion of long-term debt 68,299 249,750 181,451 Accounts payable 2,084,399 2,212,598 128,199 Accrued expenses 1,357,335 1,537,918 180,583 Income taxes payable 328,360 404,388 76,028 Other current liabilities 1,138,529 1,258,905 120,376 Long-term liabilities : 2,230,611 2,150,596 (80,015) Long-term debt 730,072 537,887 (192,185) Accrued pension and severance costs 676,999 636,221 (40,778) Other long-term liabilities 823,540 976,488 152,948
Total 8,005,502 8,540,977 535,475 (Financial services)
Current liabilities : 5,040,058 6,179,737 1,139,679 Short-term borrowings 2,932,799 3,404,713 471,914 Current portion of long-term debt 1,662,589 2,189,367 526,778 Accounts payable 9,273 16,286 7,013 Accrued expenses 111,133 135,106 23,973 Income taxes payable 19,128 16,808 (2,320) Other current liabilities 305,136 417,457 112,321 Long-term liabilities : 5,483,284 6,318,861 835,577 Long-term debt 5,071,482 5,851,882 780,400 Accrued pension and severance costs 2,919 4,365 1,446 Other long-term liabilities 408,883 462,614 53,731
Total 10,523,342 12,498,598 1,975,256 (Elimination)
Elimination of liabilities (947,278) (929,132) 18,146 (Consolidated) Total liabilities 17,581,566 20,110,443 2,528,877 (Consolidated)
Minority interest in consolidated subsidiaries 589,580 628,244 38,664
Shareholders’ equity (Consolidated)
Common stock 397,050 397,050 – Additional paid-in capital 495,250 497,593 2,343 Retained earnings 10,459,788 11,764,713 1,304,925 Accumulated other comprehensive income 437,316 701,390 264,074 Treasury stock, at cost (1,228,955) (1,524,654) (295,699)
Total shareholders’ equity 10,560,449 11,836,092 1,275,643 (Consolidated)
Total liabilities and shareholders’ equity 28,731,595 32,574,779 3,843,184

Consolidated 20
(All financial information has been prepared in accordance with accounting principles generally accepted in the United States of America)
(3) Consolidated Statements of Cash Flows as Classified into Non-Financial Services Business and Financial Services Business
(Amounts are rounded to the nearest million yen)
FY2006
(April 2005 through March 2006)
FY2007 (April 2006 through
March 2007) (Non-financial services)
Cash flows from operating activities :
Net income 1,264,223 1,531,093Adjustments to reconcile net income to net cash provided by
operating activities
Depreciation 909,444 979,718Provision for doubtful accounts and credit losses 10,361 (841) Pension and severance costs, less payments 22,664 (33,319) Loss on disposal of fixed assets 54,614 49,193 Unrealized losses on available-for-sale securities, net 4,163 4,614 Deferred income taxes 31,370 42,698 Minority interest in consolidated subsidiaries 82,401 49,513 Equity in earnings of affiliated companies (142,139) (193,130) Changes in operating assets and liabilities and other (214,507) 182,548
Net cash provided by operating activities 2,022,594 2,612,087
Cash flows from investing activities : Additions to fixed assets excluding equipment leased to others (1,516,658) (1,414,468)Additions to equipment leased to others (144,391) (153,163)Proceeds from sales of fixed assets excluding equipment leased
to others 81,950 56,040
Proceeds from sales of equipment leased to others 112,692 107,270Purchases of marketable securities and security investments (764,016) (889,008)Proceeds from sales of and maturity of marketable securities and
security investments 561,948 708,130
Payment for additional investments in affiliated companies, net of cash acquired (1,802) (1,651)
Changes in investments and other assets and other (3,292) (21,751)Net cash used in investing activities (1,673,569) (1,608,601)
Cash flows from financing activities :
Purchase of common stock (129,629) (295,699)Proceeds from issuance of long-term debt 33,904 31,509Payments of long-term debt (59,778) (41,833) Increase (Decrease) in short-term borrowings 86,731 (83,651)Dividends paid (244,568) (339,107)
Net cash used in financing activities (313,340) (728,781) Effect of exchange rate changes on cash and cash equivalents 58,211 21,995 Net increase in cash and cash equivalents 93,896 296,700 Cash and cash equivalents at beginning of year 1,324,126 1,418,022 Cash and cash equivalents at end of year 1,418,022 1,714,722

Consolidated 21
(All financial information has been prepared in accordance with accounting principles generally accepted in the United States of America)
(Amounts are rounded to the nearest million yen)
FY2006 (April 2005 through
March 2006)
FY2007 (April 2006 through
March 2007) (Financial services)
Cash flows from operating activities :
Net income 107,952 112,987 Adjustments to reconcile net income to net cash provided by operating activities
Depreciation 301,734 402,876 Provision for doubtful accounts and credit losses 52,285 72,703 Pension and severance costs, less payments 1,196 1,265 Loss on disposal of fixed assets 367 1,279 Deferred income taxes 1,889 89,643 Minority interest in consolidated subsidiaries 1,992 174 Equity in earnings of affiliated companies (22,227) (16,385) Changes in operating assets and liabilities and other 138,766 125,700
Net cash provided by operating activities 583,954 790,242
Cash flows from investing activities : Additions to finance receivables (11,407,390) (14,046,532) Collection of and proceeds from sales of finance receivables 10,545,425 12,776,507 Additions to fixed assets excluding equipment leased to others (6,801) (11,346) Additions to equipment leased to others (1,103,390) (1,256,840) Proceeds from sales of fixed assets excluding equipment leased to others
7,628 8,381
Proceeds from sales of equipment leased to others 297,991 252,653 Purchases of marketable securities and security investments (193,280) (179,197) Proceeds from sales of and maturity of marketable securities and
security investments 129,084 117,041
Changes in investments and other assets and other (83,104) 15,250 Net cash used in investing activities (1,813,837) (2,324,083)
Cash flows from financing activities :
Proceeds from issuance of long-term debt 1,930,823 2,897,028 Payments of long-term debt (1,233,336) (1,694,407) Increase in short-term borrowings 513,602 362,078
Net cash provided by financing activities 1,211,089 1,564,699 Effect of exchange rate changes on cash and cash equivalents 10,532 3,434 Net increase (decrease) in cash and cash equivalents (8,262) 34,292 Cash and cash equivalents at beginning of year 159,627 151,365 Cash and cash equivalents at end of year 151,365 185,657
(Consolidated)
Effect of exchange rate changes on cash and cash equivalents 68,743 25,429 Net increase in cash and cash equivalents 85,634 330,992 Cash and cash equivalents at beginning of year 1,483,753 1,569,387 Cash and cash equivalents at end of year 1,569,387 1,900,379
Note: In the Consolidated Statements of Cash Flows, cash and cash equivalents include cash on hand, bank deposits that can be withdrawn at any time and short-term investments that can be converted into cash at any time and carry minimal risk of change in value.

Consolidated 22
(All financial information has been prepared in accordance with accounting principles generally accepted in the United States of America)
3. Geographic Information
(1) FY2006 (April 2005 through March 2006) (Amounts are rounded to the nearest million yen)
Japan North America Europe Asia Other
Intersegment Elimination
and/or Unallocated
Amount
Consolidated
Net revenues : (1) Sales to external
customers 7,735,109 7,455,818 2,574,014 1,836,855 1,435,113 – 21,036,909
(2) Intersegment sales and transfers
5,376,348 232,124 153,395 205,951 166,623 (6,134,441) –
Total 13,111,457 7,687,942 2,727,409 2,042,806 1,601,736 (6,134,441) 21,036,909Operating expenses 12,035,567 7,192,304 2,633,462 1,897,260 1,534,546 (6,134,572) 19,158,567Operating income 1,075,890 495,638 93,947 145,546 67,190 131 1,878,342Assets 12,177,125 9,199,818 2,471,258 1,255,350 1,299,072 2,328,972 28,731,595
(2) FY2007 (April 2006 through March 2007) (Amounts are rounded to the nearest million yen)
Japan North America Europe Asia Other
Intersegment Elimination
and/or Unallocated
Amount
Consolidated
Net revenues : (1) Sales to external
customers 8,152,884 8,771,495 3,346,013 1,969,957 1,707,742 – 23,948,091
(2) Intersegment sales and transfers
6,662,398 258,278 196,180 255,571 215,000 (7,587,427) –
Total 14,815,282 9,029,773 3,542,193 2,225,528 1,922,742 (7,587,427) 23,948,091Operating expenses 13,358,036 8,580,140 3,404,810 2,107,933 1,839,245 (7,580,756) 21,709,408Operating income 1,457,246 449,633 137,383 117,595 83,497 (6,671) 2,238,683Assets 12,992,379 10,890,157 2,917,183 1,563,742 1,575,255 2,636,063 32,574,779Note: Unallocated corporate assets included under “Intersegment Elimination and/or Unallocated Amount” for FY2006 and FY2007 are
4,231,148 million yen and 4,758,410 million yen, respectively, and consist primarily of funds such as cash and cash equivalents, marketable securities and portion of security investments held by TMC.

Consolidated 23
(All financial information has been prepared in accordance with accounting principles generally accepted in the United States of America)
4. Overseas Sales
(1) FY2006 (April 2005 through March 2006) (Amounts are rounded to the nearest million yen)
North America Europe Asia Other Total
Overseas sales 7,687,738 2,607,819 2,005,777 2,721,981 15,023,315
Consolidated sales – – – – 21,036,909
% % % % %Ratio of overseas sales to consolidated sales 36.6 12.4 9.5 12.9 71.4
(2) FY2007 (April 2006 through March 2007) (Amounts are rounded to the nearest million yen)
North America Europe Asia Other Total
Overseas sales 9,039,560 3,345,001 2,248,031 3,168,580 17,801,172
Consolidated sales – – – – 23,948,091
% % % % %Ratio of overseas sales to consolidated sales 37.7 14.0 9.4 13.2 74.3

Unconsolidated 1
UNCONSOLIDATED STATEMENTS OF INCOME (All financial information has been prepared in accordance with accounting principles generally accepted in Japan)
(Million yen; amounts less than one million yen are omitted)
FY2006
(April 2005 through March 2006)
FY2007 (April 2006 through
March 2007)
Increase (Decrease)
Net sales 10,191,838 11,571,834 1,379,996
Cost of sales 8,248,627 9,233,135 984,508
Gross profit 1,943,211 2,338,698 395,487
Selling, general and administrative expenses 1,095,212 1,187,776 92,564
Operating income 847,998 1,150,921 302,923
Non-operating income 342,165 473,937 131,772
Interest income 18,686 34,045 15,359
Dividend income 228,670 311,830 83,160
Others 94,808 128,061 33,253
Non-operating expenses 85,382 69,665 (15,717)
Interest expenses 10,715 11,159 444
Others 74,666 58,505 (16,161)
Ordinary income 1,104,781 1,555,193 450,412
Income before income taxes 1,104,781 1,555,193 450,412
Income taxes – current 354,100 474,600 120,500
Income taxes – deferred (15,279) 20,483 35,762
Net income 765,961 1,060,109 294,148

Unconsolidated 2
UNCONSOLIDATED BALANCE SHEETS (All financial information has been prepared in accordance with accounting principles generally accepted in Japan)
(Million yen; amounts less than one million yen are omitted)
FY2006
(As of March 31,2006)
FY2007
(As of March 31,2007)
Increase
(Decrease)
Assets
Current assets 3,795,723 4,116,670 320,947
Cash and deposits 107,674 182,855 75,181
Trade accounts receivable 1,206,641 1,254,098 47,457
Marketable securities 922,033 1,011,348 89,315
Finished goods 147,413 126,793 (20,620)
Raw materials 27,336 46,001 18,665
Work in process 109,970 97,592 (12,378)
Supplies 8,177 8,113 (64)
Short-term loans 476,766 541,452 64,686
Deferred tax assets 259,372 292,732 33,360
Others 536,835 568,682 31,847
Less: allowance for doubtful accounts (6,500) (13,000) (6,500)
Fixed assets 6,113,286 6,544,498 431,212
Property, plant and equipment 1,279,608 1,358,160 78,552
Buildings 377,018 414,044 37,026
Structures 40,401 41,316 915
Machinery and equipment 291,186 331,032 39,846
Vehicle and delivery equipment 13,663 21,092 7,429
Tools, furniture and fixtures 88,795 92,957 4,162
Land 385,886 385,450 (436)
Construction in progress 82,656 72,266 (10,390)
Investments and other assets 4,833,678 5,186,338 352,660
Investments in securities 2,314,903 2,595,932 281,029
Investments in subsidiaries and affiliates 1,945,521 1,974,239 28,718
Long-term loans 476,422 473,766 (2,656)
Others 127,430 164,099 36,669
Less: allowance for doubtful accounts (30,600) (21,700) 8,900
Total assets 9,909,010 10,661,169 752,159

Unconsolidated 3
(All financial information has been prepared in accordance with accounting principles generally accepted in Japan)
(Million yen; amounts less than one million yen are omitted)
FY2006 (As of March 31,2006)
FY2007 (As of March 31,2007)
Increase (Decrease)
Liabilities
Current liabilities 2,379,900 2,730,572 350,672 Trade notes payable 1,117 1,227 110
Trade accounts payable 1,044,613 1,035,441 (9,172)
Current portion of bonds – 150,000 150,000
Other payables 393,585 467,229 73,644
Income taxes payable 218,256 283,960 65,704
Accrued expenses 491,032 549,152 58,120
Deposits received 207,254 224,038 16,784
Others 24,040 19,523 (4,517)
Long-term liabilities 842,213 779,993 (62,220) Bonds 500,000 350,000 (150,000)
Allowance for retirement benefits 288,961 283,032 (5,929)
Deferred tax liabilities 24,798 103,593 78,795
Others 28,454 43,367 14,913
Total liabilities 3,222,114 3,510,565 288,451
Net assets
Shareholders’ equity – 6,593,724 6,593,724 Common stock – 397,049 397,049 Capital surplus – 417,378 417,378
Capital reserve – 416,970 416,970
Other capital surplus – 407 407
Retained earnings – 7,335,143 7,335,143 Legal reserve – 99,454 99,454
Other retained earnings
Reserve for losses on overseas investments – 117 117
Reserve for special depreciation – 3,228 3,228
Reserve for reduction of acquisition cost of fixed assets – 7,554 7,554
General reserve – 5,740,926 5,740,926
Retained earnings carried forward – 1,483,862 1,483,862
Less: treasury stock – (1,555,847) (1,555,847)Valuation and translation adjustments – 555,708 555,708
Net unrealized gains on other securities – 554,947 554,947 Deferred hedge gains or losses – 760 760
Stock acquisition rights – 1,171 1,171
Total net assets – 7,150,603 7,150,603

Unconsolidated 4
(All financial information has been prepared in accordance with accounting principles generally accepted in Japan)
(Million yen; amounts less than one million yen are omitted)
FY2006 (As of March 31,2006)
FY2007 (As of March 31,2007)
Increase (Decrease)
Shareholders’ equity
Common stock 397,049 – (397,049)Capital surplus 416,970 – (416,970) Capital reserve 416,970 – (416,970)
Retained earnings 6,614,868 – (6,614,868) Legal reserve 99,454 – (99,454)
Reserve for losses on overseas investments 197 – (197)
Reserve for special depreciation 3,196 – (3,196)
Reserve for reduction of acquisition cost of fixed assets 6,586 – (6,586)
General reserve 5,340,926 – (5,340,926)
Unappropriated retained earnings at end of year 1,164,506 – (1,164,506)
Net unrealized gains on other securities 518,155 – (518,155)Less: treasury stock (1,260,148) – 1,260,148
Total shareholders’ equity 6,686,895 – (6,686,895)
Total 9,909,010 10,661,169 752,159

Unconsolidated 5
UNCONSOLIDATED STATEMENT OF CHANGES IN NET ASSETS
(All financial information has been prepared in accordance with accounting principles generally accepted in Japan)
FY2007 (April 2006 through March 2007) (Million yen; amounts less than one million yen are omitted)
Shareholders’ equity
Capital surplus Retained earnings
Other retained earnings
Common
stock Capital
reserve
Other
capital
surplus
Total
capital
surplus
Legal
reserve Reserve for
losses on
overseas
investments
Reserve for
special
depreciation
Reserve for
reduction of
acquisition
cost of fixed
assets
General
reserve
Retained
earnings
carried
forward
Total
retained
earnings
Treasury
stock
Total
shareholders’
equity
Balance as of March 31, 2006 397,049 416,970 – 416,970 99,454 197 3,196 6,586 5,340,926 1,164,506 6,614,868 (1,260,148) 6,168,740
Changes during the fiscal year
Reversal of reserve for losses on overseas investments (79) 79
Appropriation to reserve for special depreciation 830 (830)
Reversal of reserve for special depreciation (798) 798
Appropriation to reserve for reduction of acquisition cost of fixed assets
992 (992)
Reversal of reserve for reduction of acquisition cost of fixed assets (24) 24
Appropriation to general reserve 400,000 (400,000)
Dividends paid (339,107) (339,107) (339,107)
Bonuses to directors and corporate auditors (727) (727) (727)
Net income 1,060,109 1,060,109 1,060,109
Purchase of treasury stock (300,233) (300,233)
Disposal of treasury stock 407 407 4,534 4,942
Net changes of items other than shareholders’ equity
Total changes during the fiscal year – – 407 407 – (79) 31 967 400,000 319,355 720,275 (295,698) 424,984
Balance as of March 31, 2007 397,049 416,970 407 417,378 99,454 117 3,228 7,554 5,740,926 1,483,862 7,335,143 (1,555,847) 6,593,724
Valuation and translation adjustments
Net unrealized gains on other
securities
Deferred hedge gains or losses
Total valuation and
translation adjustments
Stock acquisition
rights
Total net
assets
Balance as of March 31, 2006 518,155 – 518,155 – 6,686,895
Changes during the fiscal year Reversal of reserve for losses on overseas investments
Appropriation to reserve for special depreciation
Reversal of reserve for special depreciation
Appropriation to reserve for reduction of acquisition cost of fixed assets
Reversal of reserve for reduction of acquisition cost of fixed assets
Appropriation to general reserve
Dividends paid (339,107)
Bonuses to directors and corporate auditors (727)
Net income 1,060,109
Purchase of treasury stock (300,233)
Disposal of treasury stock 4,942
Net changes of items other than shareholders’ equity 36,792 760 37,552 1,171 38,724
Total changes during the fiscal year 36,792 760 37,552 1,171 463,708
Balance as of March 31, 2007 554,947 760 555,708 1,171 7,150,603