financial stress and economic contractions - becker … · · 2014-11-19assess the impact of...
TRANSCRIPT

F
Ra
b
a
ARRAA
JEEFGG
KFFFRS
1
mmkfnfentfittcF
H
1d
Journal of Financial Stability 7 (2011) 78–97
Contents lists available at ScienceDirect
Journal of Financial Stability
journal homepage: www.elsevier.com/locate/jfstabil
inancial stress and economic contractions
oberto Cardarelli a, Selim Elekdagb,∗, Subir Lall a
International Monetary FundCentral Bank of the Republic of Turkey, 10 Istiklal Caddesi, 06100 Ulus, Ankara, Turkey
r t i c l e i n f o
rticle history:eceived 22 June 2009eceived in revised form 7 January 2010ccepted 12 January 2010vailable online 22 January 2010
EL classification:5632
a b s t r a c t
This paper examines why some financial stress episodes lead to economic downturns. The paper identifiesepisodes of financial turmoil in advanced economies using a financial stress index (FSI), and proposes ananalytical framework to assess the impact of financial stress – in particular banking distress – on thereal economy. It concludes that financial turmoil characterized by banking distress is more likely tobe associated with deeper and longer downturns than stress mainly in securities or foreign exchangemarkets. Economies with more arm’s-length financial systems seem to be more exposed to contractionsin activity following financial stress, due to the greater procyclicality of leverage in their banking systems.
© 2010 International Monetary Fund. Published by Elsevier B.V. All rights reserved.
14
eywords:inancial crisesinancial stress indexinancial systems
iio2
rOaeotKi
ecessionslowdowns
. Introduction
With the financial turmoil that began in the summer of 2007utating into a full-blown crisis, encompassing broader securitiesarkets and the banking systems of several advanced economies, a
ey concern is how macroeconomic activity will be affected goingorward, and what policymakers can do both to reduce the eco-omic consequences of this crisis and forestall such crises in the
uture.1 Past episodes of stress in banking, securities and/or foreignxchange markets have only sometimes been associated with eco-omic downturns (Fig. 1). However, these downturns have tendedo be more severe (Fig. 2). In trying to understand the impact ofnancial stress on economic activity more generally, it is impor-
ant to recognize that despite the evolution of financial systemshrough innovation and regulatory changes, the concept of “finan-ial cycles” has been a constant feature of the economic landscape.inancial systems tend to be inherently procyclical, with growth∗ Corresponding author. Tel.: +90 312 310 5620; fax: +90 312 324 2303.E-mail address: [email protected] (S. Elekdag).
1 For some further insights regarding the recent crisis, see White (2008),ildebrand (2008), and Ackermann (2008).
Aesbl
sD
572-3089/$ – see front matter © 2010 International Monetary Fund. Published by Elsevioi:10.1016/j.jfs.2010.01.005
n credit, leverage, and asset prices often reinforcing the underly-ng economic dynamic—and in some cases leading to a build upf financial imbalances followed by a sharp correction (see Borio,007; Goodhart, 1996; Minsky, 1992).
The impact of financial cycles on the real economy, however,emains a matter of debate in both academic and policy circles.ne strand of research has emphasized the role of the financialccelerator in amplifying the effects of financial cycles on the realconomy due to the effects of changes in the values of collateraln the willingness of the financial system to provide credit tohe economy (Bernanke and Gertler, 1995; Bernanke et al., 1999;iyotaki and Moore, 1997). In this view, shocks that affect the cred-
tworthiness of borrowers tend to accentuate swings in output.nother branch of inquiry, focusing on lenders’ balance sheets, has
xamined the role of bank capital in affecting aggregate credit, theo-called bank capital channel.2 If bank capital is eroded, banksecome more reluctant to lend and may be forced to deleverage,eading to sharper economic downturns. Finally, the literature has
2 Which is also related to the banking lending channel—for further details on bothee Bernanke and Lown (1991), Kashyap and Stein (1995), Gambacorta et al. (2007),iamond and Rajan (2000), and Van den Heuvel (2002).
er B.V. All rights reserved.

R. Cardarelli et al. / Journal of Finan
Fig. 1. Financial stress episodes. Source: Authors’ calculations. Note: Measured asthe cumulative output loss when output was below the Hodrick–Prescott trend forslowdowns and cumulative output loss until recovery for recessions.
Fst
aeRfitrtnb
csfctttvfi
an
mS
EbmFiwisf
atdbfifir(kcawtpmfm
•
•
•
•
•
tion elaborates the concept of financial stress that is employed inthis paper and uses this concept to identify episodes of financial
ig. 2. Financial stress and output loss. Source: Authors’ calculations. Note: Mea-ured as the cumulative output loss when output was below the Hodrick–Prescottrend for slowdowns and cumulative output loss until recovery for recessions.
lso analyzed whether the role of the financial accelerator in theconomy varies with the type of financial system (Lall et al., 2006;ajan and Zingales, 2003). One possible implication of changes innancial systems is that the general trend towards financial sys-ems that rely more on arm’s-length-based financing and less onelationship-based lending may have made economies better ableo absorb financial stress, as both corporates and household canow substitute away from banks to markets, or vice versa (and thusenefit from the so-called twin engines of the financial system).
Against the background of the current financial turmoil and theonsiderable literature on the interaction between the financialystem and macroeconomic cycles, this paper aims to address theollowing questions: why are some periods of financial stress asso-iated with slowdowns, or even recessions, while others appearo have little impact on the real economy? Does this depend onhe size or location of the build up of financial imbalances and onhe state of household and firm balance sheets? Has financial inno-ation reduced the role of banks in propagating shocks from the
nancial system to the real economy?In attempting to answer the above questions, this papernalyzes the experience from episodes of financial stress and eco-omic cycles among 17 advanced economies from 1980 to 2007.3
3 The countries included in this study are Australia, Austria, Belgium, Canada, Den-ark, Finland, France, Germany, Italy, Japan, Netherlands, Norway, Spain, Sweden,
witzerland, United Kingdom, and the United States.
so
rsfa
cial Stability 7 (2011) 78–97 79
pisodes of financial turmoil are identified using a novel indexased on high-frequency price variables that can signal stress stem-ing from banking, securities, or foreign exchange markets. The
SI not only accurately captures financial stress periods identifiedn the literature, but also identifies periods of stress not associated
ith downturns. One of the main advantages of the financial stressndicator developed in this paper is that it is based on a uniformet of indicators across the 17 advanced economies, and thereforeacilitates cross-country analysis.
Using the FSI, the paper proposes an analytical framework tossess the impact of financial stress – in particular banking dis-ress – on the real economy. Specifically, the paper attempts toraw lessons from these episodes by differentiating them on theasis of the preconditions that were in place at the time that thenancial stress episode began, including the state of household andrm balance sheets, the dynamics of credit and asset prices in theun up to the stress episode, the type of financial stress episodei.e., to what extent was the stress related to banks, securities mar-ets, or foreign exchange markets), and the policy responses thatharacterized these episodes. Taken together, these factors providecomprehensive view of the channels and mechanisms throughhich financial stress affects economic cycles.4 While establishing
he causality between financial stress and economic downturnsoses an inherently difficult challenge, the analysis in the paperakes an attempt to address this issue by explicitly accounting
or the effect of the most common types of shocks studied in theacroeconomic literature.The key findings of the paper are as follows:
First, episodes of financial turmoil characterized by banking dis-tress are more likely to be associated with deeper and longerdownturns than episodes of stress mainly in securities or foreignexchange markets.Second, and related to the first point, recessions associated withbanking-related financial stress tend to last at least twice as longas recessions not preceded by financial stress.Third, the likelihood that financial stress will be followed by adownturn appears to be associated with the extent to whichhouse prices and aggregate credit rise in the period before thefinancial stress. Moreover, a greater reliance on external financ-ing by households and non-financial corporates is associated witha sharper downturn in the aftermath of financial stress.Fourth, countries with more arm’s-length financial systems seemto be somewhat more vulnerable to sharper contractions in activ-ity in the event of banking stress. This is because leverage in thebanking systems appears to be more procyclical in countries thathave progressed further in terms of financial innovation.Fifth, the importance of core financial intermediaries in the trans-mission of financial shocks to the real economy suggests thatwithin strong financial stability frameworks policies that helprestore the capital base of these institutions can help alleviatedownturns.
The rest of the paper is structured as follows. The next sec-
tress from 1980 to 2007. The paper then analyzes the behaviorf economic cycles in the aftermath of financial stress episodes.
4 This broader approach complements other recent research on the empiricalelationship between asset prices – such as for equity and house prices and bondpreads – and the dynamics of output during the course of the business cycle (see,or example, Claessens et al., 2009; Lall et al., 2008) or between bank capital, lendingnd output (see Kashyap et al., 2008, in the context of the United States).
8 Finan
Ttdtcaacfiotoecs
2
fibTtffw
rbsEklM–sehaAeta
hsi(acspsbi
ptel
eb
vcwaipbbdo1iica
2
othLSiscaiwqtai
•
•
•
0 R. Cardarelli et al. / Journal of
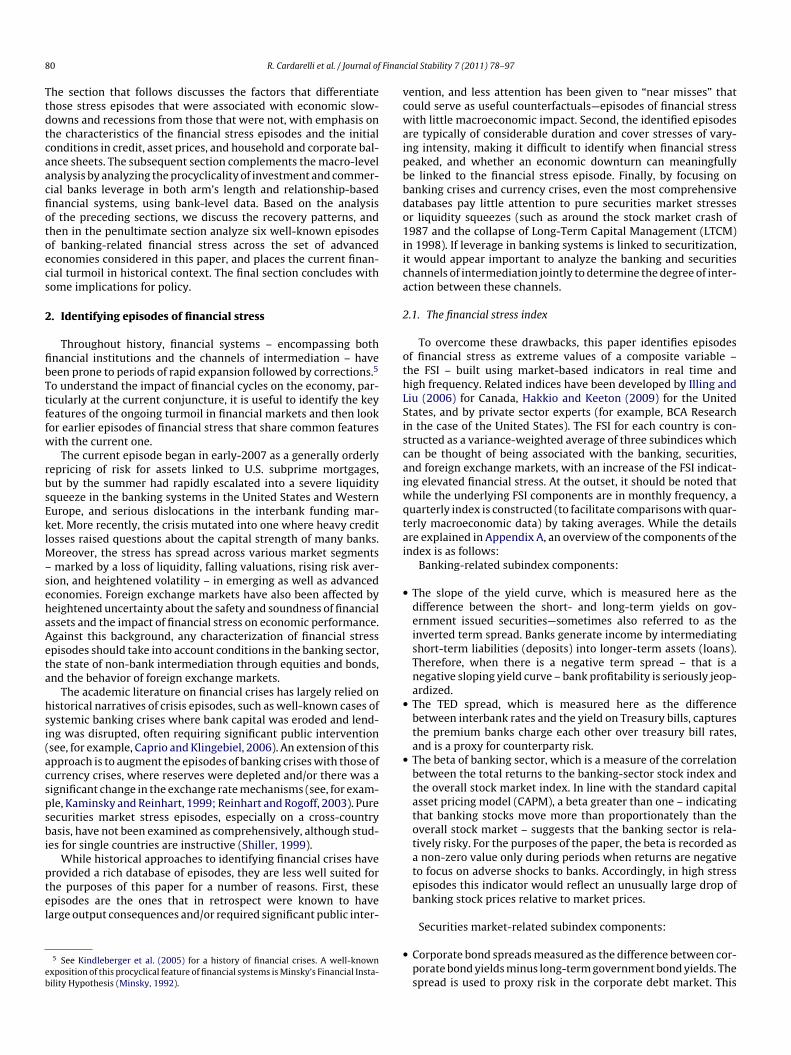
he section that follows discusses the factors that differentiatehose stress episodes that were associated with economic slow-owns and recessions from those that were not, with emphasis onhe characteristics of the financial stress episodes and the initialonditions in credit, asset prices, and household and corporate bal-nce sheets. The subsequent section complements the macro-levelnalysis by analyzing the procyclicality of investment and commer-ial banks leverage in both arm’s length and relationship-basednancial systems, using bank-level data. Based on the analysisf the preceding sections, we discuss the recovery patterns, andhen in the penultimate section analyze six well-known episodesf banking-related financial stress across the set of advancedconomies considered in this paper, and places the current finan-ial turmoil in historical context. The final section concludes withome implications for policy.
. Identifying episodes of financial stress
Throughout history, financial systems – encompassing bothnancial institutions and the channels of intermediation – haveeen prone to periods of rapid expansion followed by corrections.5
o understand the impact of financial cycles on the economy, par-icularly at the current conjuncture, it is useful to identify the keyeatures of the ongoing turmoil in financial markets and then lookor earlier episodes of financial stress that share common featuresith the current one.
The current episode began in early-2007 as a generally orderlyepricing of risk for assets linked to U.S. subprime mortgages,ut by the summer had rapidly escalated into a severe liquidityqueeze in the banking systems in the United States and Westernurope, and serious dislocations in the interbank funding mar-et. More recently, the crisis mutated into one where heavy creditosses raised questions about the capital strength of many banks.
oreover, the stress has spread across various market segmentsmarked by a loss of liquidity, falling valuations, rising risk aver-
ion, and heightened volatility – in emerging as well as advancedconomies. Foreign exchange markets have also been affected byeightened uncertainty about the safety and soundness of financialssets and the impact of financial stress on economic performance.gainst this background, any characterization of financial stresspisodes should take into account conditions in the banking sector,he state of non-bank intermediation through equities and bonds,nd the behavior of foreign exchange markets.
The academic literature on financial crises has largely relied onistorical narratives of crisis episodes, such as well-known cases ofystemic banking crises where bank capital was eroded and lend-ng was disrupted, often requiring significant public interventionsee, for example, Caprio and Klingebiel, 2006). An extension of thispproach is to augment the episodes of banking crises with those ofurrency crises, where reserves were depleted and/or there was aignificant change in the exchange rate mechanisms (see, for exam-le, Kaminsky and Reinhart, 1999; Reinhart and Rogoff, 2003). Pureecurities market stress episodes, especially on a cross-countryasis, have not been examined as comprehensively, although stud-
es for single countries are instructive (Shiller, 1999).While historical approaches to identifying financial crises have
rovided a rich database of episodes, they are less well suited forhe purposes of this paper for a number of reasons. First, thesepisodes are the ones that in retrospect were known to havearge output consequences and/or required significant public inter-
5 See Kindleberger et al. (2005) for a history of financial crises. A well-knownxposition of this procyclical feature of financial systems is Minsky’s Financial Insta-ility Hypothesis (Minsky, 1992).
•
cial Stability 7 (2011) 78–97
ention, and less attention has been given to “near misses” thatould serve as useful counterfactuals—episodes of financial stressith little macroeconomic impact. Second, the identified episodes
re typically of considerable duration and cover stresses of vary-ng intensity, making it difficult to identify when financial stresseaked, and whether an economic downturn can meaningfullye linked to the financial stress episode. Finally, by focusing onanking crises and currency crises, even the most comprehensiveatabases pay little attention to pure securities market stressesr liquidity squeezes (such as around the stock market crash of987 and the collapse of Long-Term Capital Management (LTCM)
n 1998). If leverage in banking systems is linked to securitization,t would appear important to analyze the banking and securitieshannels of intermediation jointly to determine the degree of inter-ction between these channels.
.1. The financial stress index
To overcome these drawbacks, this paper identifies episodesf financial stress as extreme values of a composite variable –he FSI – built using market-based indicators in real time andigh frequency. Related indices have been developed by Illing andiu (2006) for Canada, Hakkio and Keeton (2009) for the Unitedtates, and by private sector experts (for example, BCA Researchn the case of the United States). The FSI for each country is con-tructed as a variance-weighted average of three subindices whichan be thought of being associated with the banking, securities,nd foreign exchange markets, with an increase of the FSI indicat-ng elevated financial stress. At the outset, it should be noted that
hile the underlying FSI components are in monthly frequency, auarterly index is constructed (to facilitate comparisons with quar-erly macroeconomic data) by taking averages. While the detailsre explained in Appendix A, an overview of the components of thendex is as follows:
Banking-related subindex components:
The slope of the yield curve, which is measured here as thedifference between the short- and long-term yields on gov-ernment issued securities—sometimes also referred to as theinverted term spread. Banks generate income by intermediatingshort-term liabilities (deposits) into longer-term assets (loans).Therefore, when there is a negative term spread – that is anegative sloping yield curve – bank profitability is seriously jeop-ardized.The TED spread, which is measured here as the differencebetween interbank rates and the yield on Treasury bills, capturesthe premium banks charge each other over treasury bill rates,and is a proxy for counterparty risk.The beta of banking sector, which is a measure of the correlationbetween the total returns to the banking-sector stock index andthe overall stock market index. In line with the standard capitalasset pricing model (CAPM), a beta greater than one – indicatingthat banking stocks move more than proportionately than theoverall stock market – suggests that the banking sector is rela-tively risky. For the purposes of the paper, the beta is recorded asa non-zero value only during periods when returns are negativeto focus on adverse shocks to banks. Accordingly, in high stressepisodes this indicator would reflect an unusually large drop ofbanking stock prices relative to market prices.
Securities market-related subindex components:
Corporate bond spreads measured as the difference between cor-porate bond yields minus long-term government bond yields. Thespread is used to proxy risk in the corporate debt market. This

Finan
•
•
•
FtAstatpfimmr
tWoeiFd
asoaIaTfsHt
icyMosiaiwihrh
qcipbbfiatmstitiafiiaiho
sficef
avbfspiw
efitofiisusmia
2
i3st–
R. Cardarelli et al. / Journal of
spread incorporates credit, market, and liquidity risk premiums.While credit risk is a function of expected loss, the other twoelements are a function of risk and uncertainty.Stock market returns measured as the monthly return, but withmultiplied by −1 so that a decline in stock prices registers as anincrease in the index.Time-varying stock return volatility derived from a GARCH(1,1)specification (for further details, see Bollerslev et al., 1992). Thisseries is used to capture the observation that many asset pricestend to exhibit volatility clustering, especially when financialmarkets are in a state of uncertainty.
Foreign exchange-related subindex component:
Time-varying volatility of monthly changes in the nominal effec-tive exchange rate, also derived from a GARCH(1,1) specification.
There are many other potential candidates for inclusion in theSI, but given the cross-country nature of this study, one objec-ive was to use a uniform set of time series across all 17 countries.nother objective was parsimony: we wanted to use a minimumet of time series that would signal financial stress episodes. Addingends to be restricted owing to data availability, both across timend country dimensions. It could also potentially contaminatehe FSI with noisy indicators. Further, because of common com-onents, among other things, the qualitative patterns of manynancial series are similar (many measures of volatility and pre-iums increase during financial stress episodes). Therefore, thearginal informative content of additional series diminishes quite
apidly.The FSI can be custom tailored for an individual country, and
his would be a natural extension for country-specific case studies.hile more series will surely improve the informational content
f the country-specific index, this would also complicate the signalxtraction problem. With these considerations in mind, it is alsomportant to emphasize that, as we elaborate further below, theSI is quite robust in capturing the main financial stress episodesocumented in narrative descriptions and in the literature.
As discussed above, the FSI developed in this paper is based onuniform set of indicators across the 17 advanced economies we
tudy. Therefore, in contrast with country-specific stress indices,ur FSI facilitates consistent cross-country analysis. As mentionedbove, one the first indicators of financial stress was developed bylling and Liu (2006) for the Bank of Canada. More recently, Hakkiond Keeton (2009) propose a stress index for the United States.hese two indices have an advantage in that they use financial datarom more advanced and deeper financial systems (for example, thepread between off-the-run and on-the-run U.S. Treasury spreads).owever, at the same time, because such markets may not exist,
hese indices are not readily adaptable to many other countries.In the context of our FSI, the advantage of utilizing such an
ndex is its ability to identify the beginning and peaks of finan-ial stress episodes more precisely, that is, the specific quarter of aear when an episode can be said to have begun, and its duration.oreover, constructing such an index facilitates the identification
f four fundamental characteristics of financial stress events: largehifts in asset prices (stock and bond market returns); an abruptncrease in risk/uncertainty (stock and foreign exchange volatility);brupt shifts in liquidity (TED spreads); and the health of the bank-ng system (the beta of banking-sector stocks and the yield curve,
hich affects the profitability of intermediating short-term liabil-ties into long-term assets). Looking at these subcomponents canelp identify which types of financial stress (banking-related, secu-ities market related, currency related, or a combination of these)ave been associated with larger output consequences.
attte
cial Stability 7 (2011) 78–97 81
While the corporate finance literature might suggest using auantity-based index in order to identify periods when the finan-ial sector is under strain and its ability to intermediate may bempaired, this paper’s strategy of using financial market (assetrice-based) variables has four major advantages. First, asset price-ased variables are easy to monitor and compute on a comparableasis across a large set of countries. Second, movements in broadernancial asset prices can be expected to play a greater role in thebility of financial firms to supply intermediation services than inhe ability of specific non-financial corporates to fund new invest-
ent, which is much more closely tied to developments in theirector. Third, asset prices are observable continuously, while quan-ity variables are only observed with a lag. Therefore, price-basedndices are more useful from a policy perspective, particularly inhe context of financial sector surveillance. Fourth, it is useful tonitially consider a broad range of financial stress events based onsset prices, and then use quantity-based variables to identify whennancial stress episodes are associated with a significant economic
mpact. The underlying hypothesis is that, within the universe ofsset price-based stress episodes, only some reflect true underly-ng distress in the balance sheets of financial intermediaries thatave an economic impact by restricting the supply of credit, whilethers merely reflect normal market corrections.
Using the seven subcomponents described above, the FSI is con-tructed for each of the 17 countries in the sample. Episodes ofnancial stress are identified as those periods when the index for aountry is more than one standard deviation above its trend. Thesepisodes signal that one or more of the banking, securities and/ororeign exchange market subcomponents has shifted abruptly.
The trend is identified using the Hodrick–Prescott (HP) filter,nd serves two fundamental purposes: first, because it is a time-arying trend, it captures the notion that financial systems haveeen evolving. This is useful because the financial stress may mani-est itself in different ways across time and across evolving financialystems. Second, the HP filter is used for each country, and therebyicks up country-specific factors not explicitly captured by the
ndex—it could be thought of a time-varying fixed-effect term,hich is useful given the cross-country nature of our analysis.
The foundation of our empirical investigation is based on anvent analysis. The FSI was used to identify the events: episodes ofnancial stress. The event study methodology can be traced backo Fama et al. (1969), which measured the impact of certain eventsn security prices. Given the quality and quantity of financial data,nancial economics was a fertile area of research where event stud-
es have been used extensively (Gibbons, 1987). However, eventtudies have also been used in macroeconomics in general, partic-larly in the field of international economics. For example, eventtudies have been used in analyzing currency crises in emergingarkets (Frankel and Rose, 1996), or for example, towards assess-
ng the implications of current account dynamics (Edwards, 2007,nd Freund, 2005).
.2. Episodes of financial stress
Overall, 113 financial stress episodes were identified by the FSIn the sample of countries considered in this paper over the last0 years (Table 1). Of these episodes, 43 were mainly driven bytress in the banking sector – the banking variables accounted forhe large portion of the increase of the FSI during these episodes
50 episodes mainly reflected turmoil in the securities market,
nd 20 in the foreign exchange market. In some cases, impor-antly, stresses beginning in one segment eventually encompassedhe other segments of the financial system. For example, in 17 ofhe episodes that mainly reflected stress in securities or foreignxchange markets, the banking variables accounted for at least one-
82 R. Cardarelli et al. / Journal of Financial Stability 7 (2011) 78–97
Table 1Descriptive statistics on financial stress episodes.
Number of episodes Financial stress duration(average; quarters)
Total 1980s 1990s 2000s Current
Financial stress 113 37 42 34 16 2.42
Of which:Banking 43 12 19 12 4 2.44Securities markets 50 19 12 19 11 2.4Foreign exchange 20 6 11 3 1 2.4
Memo:Banking-related 60 16 25 19 10 2.6
31
S
tapst
fisEtcdbi
otsMsn
ttwpInscwkbmw–aERo
est
cficoi
twitsantisfit
aesm
3
oeconomic slowdown or outright recession? Were economic down-turns preceded by episodes of financial stress different from thosethat were not? It should be emphasized that the focus of this paperis on identifying the main characteristics of financial stress episodes
7 Furthermore, the FSI captures 100 percent of all episodes identified in the liter-ature if the duration of episodes is interpreted more broadly, that is, if the window
Of which:Above median arm’s length 31 9 1Below median arm’s length 27 7 1
ource: Authors’ calculations.
hird of the spike in the FSI. Adding these episodes implies therere 60 episodes with “banking-related” financial stress in the sam-le, that is, episodes were banks were either the dominant or theecond largest factor, with a contribution of at least one-third ofhe rise in the spike.
In the context of the current turmoil, the FSI indicates that thenancial crisis that began in 2007 has a significant global dimen-ion, affecting virtually all countries in the sample (Figs. 3 and 4).arlier episodes of financial stress affecting the majority of coun-ries in the sample simultaneously include the 1987 stock marketrash, the high yield market collapse in the late-1980s, the Scan-inavian banking crisis, the ERM crisis and the collapse of LTCM,ut the current episode appears to be felt most widely. Overall, the
ndex appears to capture global financial episodes accurately.6
The FSI also accurately captures the fact that while the originsf the current episode were in the banking sector, by early-2008he crises had become much more broad based, affecting banking,ecurities and foreign exchange markets at the same time (Fig. 6).oreover, the evidence also indicates that past episodes of banking
tress appear to have had a significant securities market compo-ent.
Looking in detail at the country-specific FSI, for the set of coun-ries considered in this paper the peaks of the FSI – correspondingo periods of financial stress – generally overlap accurately withell-known financial stress episodes in these countries over theast three decades, including the most recent episode (see Fig. 3).
n fact, an important criterion that was used to gauge the robust-ess and reliability of the FSI was to ensure that periods of stressignaled by the FSI corresponded to episodes of financial stress inountry-specific narratives, which may not have been associatedith crises. As an example, we once again cite the 1987 stock mar-
et crash, which was clearly an episode of acute financial stress,ut not associated with a recession in the United States. Further-ore, we held the FSI to an even more rigorous standard in that weanted is to pick up financial crises highlighted in the literaturebased on papers which include Bordo and Jeanne (2002), Caprio
nd Klingebiel (2006), Demirguc-Kunt et al. (2006), Edison (2003),ichengreen and Bordo (2002), Kaminsky and Reinhart (1999), andeinhart and Rogoff (2003) – which cover banking, currency, andther crises, but also stock and house price boom and busts. More
6 Overall, of the 113 episodes of financial stress identified in the sample, 87pisodes simultaneously affected two or more countries. The working paper ver-ion contains narratives of some of the major episodes of financial stress spanninghe early-1980s to present (Appendix A).
aq
iaedccsao
9 4 2.429 5 2.85
oncretely, comparing the FSI-based episodes with the episodes ofnancial crisis identified in the literature suggests that the indexaptures over 90 percent of the banking crises and over 80 percentf the currency crises episodes, when the duration of the episodesdentified in the literature is interpreted narrowly.7
While the paper remains agnostic on the causes of spikes inhe FSI, given that spikes in the FSI appear to be associated withell-known events such as stock/bond market collapses or bank-
ng crises, is the index perhaps a mirror of other fundamentalshat can directly affect the economic cycle? Considering four suchhocks, namely to oil prices, labor productivity, monetary policy,nd fiscal policy, the evidence indicates that spikes in the FSI areot correlated with oil, productivity, or fiscal shocks (Fig. 5).8 Whilehere appears to be greater correlation with monetary policy, thiss expected given that monetary policy (as measured by the termpread) is a subcomponent of the index itself, included becausenancial stress appears to be associated with the stance of mone-ary policy as reflected in the term spread.
Overall, these results suggest that the FSI can be consideredcomprehensive indicator that successfully identifies the main
pisodes of financial stress for the sample of countries under con-ideration and can provide the basis for an examination of theacroeconomic consequences of such stress.
. Financial stress, economic slowdowns, and recessions
Having identified episodes of financial stress, a first questionf interest is: how many of these episodes were followed by an
round the quarter of financial stress identified by the FSI is expanded by a fewuarters.8 Mirroring the definition of financial stress episodes, oil price or labor productiv-
ty “shocks” are defined as cases where changes in the oil price or labor productivityre one standard deviation above trend; fiscal policy “shocks” are defined aspisodes where the government net lending/borrowing ratio to GDP is one stan-ard deviation above trend; and finally monetary policy “shocks” are defined asases where the inverse term spread is one standard deviation above trend. In allases, the deviations from trend are calculated using Hodrick–Prescott filters. Ithould be noted that “shocks” were used for a lack of a better term—these couldlso be interpreted as macroeconomic surprises and/or (unanticipated) importantutliers.

R. Cardarelli et al. / Journal of Financial Stability 7 (2011) 78–97 83
dex. S
totecob
n
•
•
od
thumb for dating recessions is two consecutive quarters of nega-tive growth. However, we utilize a more precise definition basedon the business cycle turning point dating methodology formalizedby Harding and Pagan (2002), who demonstrate that their algo-
Fig. 3. The financial stress in
hat were eventually followed by economic downturns, rather thann assessing whether financial stress “causes” economic down-urns, given the significant analytical and empirical challenges instablishing causality.9 Nevertheless, the analysis will attempt toontrol to some extent for other shocks – namely, monetary, fiscal,il price, and labor productivity shocks – that may affect the linketween financial stress and economic cycles.
To answer these questions the following two definitions of eco-omic downturns are used:
An episode of financial stress is followed by an economic slow-down if the level of real GDP falls below trend (identified usingthe Hodrick–Prescott filter) within six quarters of the onset of the
financial stress episode.An episode of financial stress is followed by a recession if therewas an acute contraction in activity within six quarters of theonset of the financial stress episode.9 For example, many shocks may affect both the financial system and the econ-my, and while the financial system may amplify the shock, it would be hard toisentangle the direct effect of the shock from the amplification effect. F
ource: Authors’ calculations.
Slowdowns are milder downturns than recessions. The rule of
ig. 4. Share of countries experiencing financial stress. Source: Authors’ calculations.

84 R. Cardarelli et al. / Journal of Financial Stability 7 (2011) 78–97
Fig. 5. Financial stress and other macroeconomic variables. Source: Authors’ calculations. Note: The shaded areas represent the episodes of financial stress discussed in thetext: the 1987 stock market crash, the Nikkei/junk bond collapse, the Scandinavian banking crises, the ERM crises, and the LTCM collapse. (/1) Oil prices are scaled by U.S.inflation (CPI) and represent deviations from Hodrick–Prescott (HP) trend. (/2) Monetary policy is measured using the inverse term spread’s deviations from HP trend. (/3)F d. (/4)t for Au
rNSN(ta
iawF
w2
a(u
aaont(
iscal policy is measured using government net lending’s deviations from HP trenotal employment and represents deviations from HP trend. Data are not available
ithm accurately captures the peaks and troughs identified by theational Bureau of Economic Research (NBER) itself in the Unitedtates. For the United States we took the dates provided by theBER, but for the other countries we used the Harding and Pagan
2002) algorithm to date the business cycle turning points.10 Theurning points we identified were in line with other studies as wells those generated by private sector experts.11
Based upon these definitions, of the 113 financial stress episodes
dentified in the previous section, 29 were followed by a slowdown,nd 29 by recessions. The remaining 55 financial stress episodesere not followed by an economic downturn (Table 2 and Fig. 1,ig. 6).
10 For example, in the United States, the most recent recession was in 2001hile the most recent slowdown was when GDP fell below trend during
007:Q4–2008:Q1.11 The turning point dates were compared with Morsink et al. (2002),s well as dates identified by the Economic Cycle Research Institutewww.businesscycle.com)—dates used in this paper are available from authorspon request.
ttsiocFcto
r
Labor productivity of the total economy is measured as the ratio of real GDP andstria, Belgium, Denmark, Spain, and Switzerland.
The median time lag between the onset of financial stressnd the slowdown/recession that follows was about two quarters,lthough this masks substantial variation in the sample—about halff the slowdown/recessions occurred within a quarter of the begin-ing of the financial stress, but for one in four episodes it took morehan a year for a downturn to materialize after the financial stressFig. 7).
Most importantly, median cumulative output losses (relative torend for slowdowns or until recovery for recessions) in downturnshat follow financial stresses were about 2.8 percent of GDP forlowdowns and about 4.4 percent of GDP for recessions, signif-cantly (at least at the 10 percent level) larger than in episodesf slowdowns and recessions that were not preceded by finan-ial stress (about 1.6 and 2.3 percent, respectively), as shown inig. 2 and Table 2. Therefore, the output loss for downturns pre-
eded by financial stress is almost twice as large when comparedo other downturns. This result mainly reflects the longer durationf slowdowns and recessions when preceded by financial stress.What is particularly striking is the difference between banking-elated and non-banking-related financial stress episodes. As

R. Cardarelli et al. / Journal of Financial Stability 7 (2011) 78–97 85
Table 2Descriptive statistics on financial stress, slowdowns, and recessions.
Number Duration (average; quarters) Output loss(average; percentof GDP)
Number of quarters after startof FS to slowdown or recession(average)
Financialstress (FS)
Slowdown orrecessiona
Cumulativeb Average
Financial stress 113 2.4Financial stress with slowdown 29 2.7 7.6 −7.6 −0.7 2.4
Banking relatedc 18 3.2 8.4 −9.3 −0.8 1.8Banking 8 2.9 10.9 −14.8 −1.1 1.0
Non-banking relatedc 11 1.9 6.4 −4.8 −0.5 3.5
Financial stress with recession 29 3.0 6.8 −13.8 −1.2 2.3Banking relatedd 17 4.0 7.6 −19.8 −1.5 2.0
Banking 8 3.0 6.8 −9.5 −1.0 1.8
Non-banking relatedd 12 2.8 5.6 −5.4 −0.8 2.7
Others 55 2
Slowdown not preceded by financial stresse 109 5.1* −4.1* −0.6Recession not preceded by financial stressf 31 3.1* −5.4* −0.9
Source: Authors’ calculations.a Slowdown: number of quarters where GDP is below trend; recession: number of quarters until GDP is at or exceeds peak level.b Slowdown: cumulative output loss below trend; recession: cumulative output loss until recovery.c For financial stress episodes associated with slowdowns, financial stress duration, cumulative output loss, and average output loss are statistically different when
banking-related and non-banking-related episodes are compared (at the 0.02, 0.09, and 0.06 significance levels, respectively).nd av
rficantcant a
slewt
n
Fs
d For financial stress episodes associated with recessions, cumulative output loss aelated episodes are compared (0.10 and 0.07 significance levels, respectively).
e Asterisks indicate difference from slowdowns preceded by financial stress signif Asterisks indicate difference from recessions preceded by financial stress signifi
hown in Table 2, there is a marked distinction between the cumu-
ative output losses between the two types of financial stresspisodes—especially for banking-related stress episodes associatedith recessions. It is also worth noting that the differences betweenhese cumulative output losses contrasting banking-related and
dl
a
ig. 6. Descriptive statistics for financial stress episodes. Contribution of banking, securitietress index in the given period). Source: Authors’ calculations.
erage output loss are statistically different when banking-related and non-banking-
at 10 percent.t 10 percent.
on-banking-related stress episodes associated with either slow-
owns or recessions is statistically significant at the 10 percentevel or better.Looking at the dynamics of selected macroeconomic variables
round the beginning of the downturn reveals that, in general, the
s, and foreign exchange (the sum of the components equals the level of the financial
86 R. Cardarelli et al. / Journal of Finan
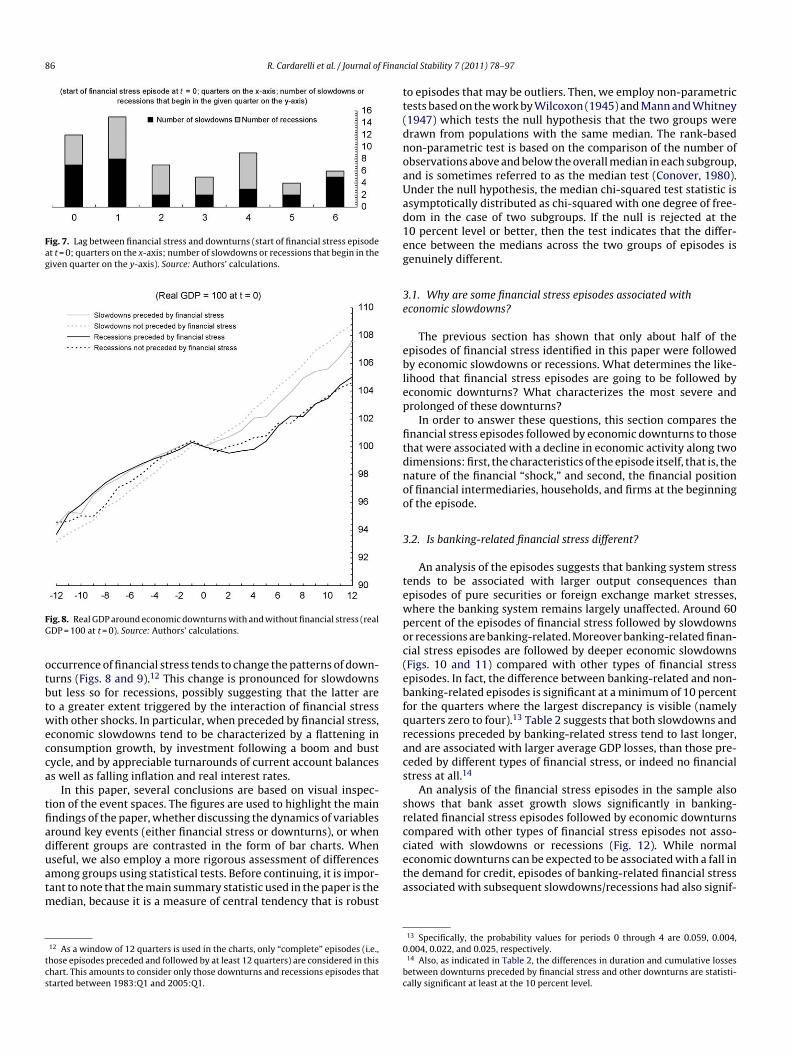
Fig. 7. Lag between financial stress and downturns (start of financial stress episodeat t = 0; quarters on the x-axis; number of slowdowns or recessions that begin in thegiven quarter on the y-axis). Source: Authors’ calculations.
FG
otbtwecca
tfiaduatm
tcs
tt(dnoaUad1eg
3e
eblep
fitdnoo
3
tewpoc(ebfqracs
srcompared with other types of financial stress episodes not asso-ciated with slowdowns or recessions (Fig. 12). While normal
ig. 8. Real GDP around economic downturns with and without financial stress (realDP = 100 at t = 0). Source: Authors’ calculations.
ccurrence of financial stress tends to change the patterns of down-urns (Figs. 8 and 9).12 This change is pronounced for slowdownsut less so for recessions, possibly suggesting that the latter areo a greater extent triggered by the interaction of financial stressith other shocks. In particular, when preceded by financial stress,
conomic slowdowns tend to be characterized by a flattening inonsumption growth, by investment following a boom and bustycle, and by appreciable turnarounds of current account balancess well as falling inflation and real interest rates.
In this paper, several conclusions are based on visual inspec-ion of the event spaces. The figures are used to highlight the mainndings of the paper, whether discussing the dynamics of variablesround key events (either financial stress or downturns), or whenifferent groups are contrasted in the form of bar charts. When
seful, we also employ a more rigorous assessment of differencesmong groups using statistical tests. Before continuing, it is impor-ant to note that the main summary statistic used in the paper is theedian, because it is a measure of central tendency that is robust
12 As a window of 12 quarters is used in the charts, only “complete” episodes (i.e.,hose episodes preceded and followed by at least 12 quarters) are considered in thishart. This amounts to consider only those downturns and recessions episodes thattarted between 1983:Q1 and 2005:Q1.
eta
0
bc
cial Stability 7 (2011) 78–97
o episodes that may be outliers. Then, we employ non-parametricests based on the work by Wilcoxon (1945) and Mann and Whitney1947) which tests the null hypothesis that the two groups wererawn from populations with the same median. The rank-basedon-parametric test is based on the comparison of the number ofbservations above and below the overall median in each subgroup,nd is sometimes referred to as the median test (Conover, 1980).nder the null hypothesis, the median chi-squared test statistic issymptotically distributed as chi-squared with one degree of free-om in the case of two subgroups. If the null is rejected at the0 percent level or better, then the test indicates that the differ-nce between the medians across the two groups of episodes isenuinely different.
.1. Why are some financial stress episodes associated withconomic slowdowns?
The previous section has shown that only about half of thepisodes of financial stress identified in this paper were followedy economic slowdowns or recessions. What determines the like-
ihood that financial stress episodes are going to be followed byconomic downturns? What characterizes the most severe androlonged of these downturns?
In order to answer these questions, this section compares thenancial stress episodes followed by economic downturns to thosehat were associated with a decline in economic activity along twoimensions: first, the characteristics of the episode itself, that is, theature of the financial “shock,” and second, the financial positionf financial intermediaries, households, and firms at the beginningf the episode.
.2. Is banking-related financial stress different?
An analysis of the episodes suggests that banking system stressends to be associated with larger output consequences thanpisodes of pure securities or foreign exchange market stresses,here the banking system remains largely unaffected. Around 60ercent of the episodes of financial stress followed by slowdownsr recessions are banking-related. Moreover banking-related finan-ial stress episodes are followed by deeper economic slowdownsFigs. 10 and 11) compared with other types of financial stresspisodes. In fact, the difference between banking-related and non-anking-related episodes is significant at a minimum of 10 percentor the quarters where the largest discrepancy is visible (namelyuarters zero to four).13 Table 2 suggests that both slowdowns andecessions preceded by banking-related stress tend to last longer,nd are associated with larger average GDP losses, than those pre-eded by different types of financial stress, or indeed no financialtress at all.14
An analysis of the financial stress episodes in the sample alsohows that bank asset growth slows significantly in banking-elated financial stress episodes followed by economic downturns
conomic downturns can be expected to be associated with a fall inhe demand for credit, episodes of banking-related financial stressssociated with subsequent slowdowns/recessions had also signif-
13 Specifically, the probability values for periods 0 through 4 are 0.059, 0.004,.004, 0.022, and 0.025, respectively.14 Also, as indicated in Table 2, the differences in duration and cumulative lossesetween downturns preceded by financial stress and other downturns are statisti-ally significant at least at the 10 percent level.

R. Cardarelli et al. / Journal of Financial Stability 7 (2011) 78–97 87
Fig. 9. Selected macrovariables around economic downturns with and without financial stress (median; start of economic contraction at t = 0; quarters on the x-axis). Source:Authors’ calculations.
Fig. 10. Banking-related financial stress and growth. Financial stress (real GDP per-cent change from 1 year ago, median). Source: Authors’ calculations.
Fig. 11. Banking-related financial stress, slowdowns, and recessions. Slowdownsand recessions (real GDP percent change from a year ago). Source: Authors’ calcula-tions.

88 R. Cardarelli et al. / Journal of Finan
Fig. 12. Cost of capital and bank asset growth around banking financial stressepisodes (average; change from 1 year before to 1 year after the start of the financialsfs
iigafi(Wccwce
ted
roacle1rds
3e
tlacfi
•
•
•
ahiep
a
tress). Source: Authors’ calculations. (/1) Banking-related financial stress episodesollowed by slowdowns or recessions. (/2) Financial stress episodes not followed bylowdowns or recessions.
cantly higher cost of capital after the episode began (Fig. 12).15 Its also important to point out that the differences between theseroups is statistically significant. In particular, the growth in bankssets and the cost of capital for the recessions contrasted with thenancial stress episodes that were not associated with downturns“Other”) is statistically significant at the 5 percent level of better.16
hile the issue of reverse causality between recessions and finan-ial stress is difficult to address empirically, suggesting appropriateaution in interpreting these results, these findings are consistent
ith the view that that a reduction in the supply of credit – a creditrunch – is a key factor associating banking-related financial stresspisodes to economic slowdowns and recessions.
15 The cost of capital is defined here as a weighted average of the real cost of equity,he real cost of debt, and real lending rates, using as weights the relative shares ofquity, bonds, and loans in non-financial corporate liabilities. See Appendix A foretails.16 “Other” refers to all financial stress episodes not followed by slowdowns orecessions. In addition, we also used an alternative definition of “Other” whereby wenly included non-banking-related stress episodes either followed by slowdownsnd recession. The results are qualitatively very similar, but statistical significancehanges. Regarding bank assets, when banking-related financial stress episodes fol-owed by slowdowns or recessions are compared to non-banking-related stresspisodes either followed by slowdowns or recessions, the statistical significance is5 and 13 percent, respectively. Turning to the cost of capital, the same comparisoneveals that differences between slowdowns is statistically insignificant, whereasifferences between banking- and non-banking-related recessions are statisticallyignificant at the 1 percent level.
scet
feaT
aolfiacar
cial Stability 7 (2011) 78–97
.3. Financial imbalances and firm and household financialxposure
After looking at the nature of the shocks, the focus now shiftso whether the likelihood of a downturn in economic activity fol-owing financial stress depends on initial conditions in terms ofsset prices and balance sheets. The evidence suggests that initialonditions are important in determining the economic impact of anancial shock:
Both house prices and the credit-to-GDP ratio tend to rise signif-icantly faster during the upswing of the financial cycle in thosestress episodes that eventually are followed by slowdowns orrecessions (Fig. 13). Statistical tests confirm that financial tur-moil is more likely to be followed by economic slowdown oroutright recession when it is preceded by a more rapid buildup inhouse prices and credit as shown in Fig. 14.17 For example, each ofthe variables measuring the initial conditions of financial stressepisodes are statistically different when followed by a recessionas compared to those that were not (“Other”) at the 5 percentlevel or better.Episodes of financial stress followed by economic slowdowns andrecessions tend to be characterized by firms being more heavilydependent on external sources of funding – that is, with highernet borrowing ratios – in the run up to the financial stress episode(see Figs. 13 and 14).18 Such a higher initial reliance on exter-nal funding makes firms more vulnerable to a downswing of thefinancial cycle, and sets the stage for a larger impact on the realeconomy as firms are forced to adjust their spending plans moredrastically in the aftermath of financial stress.At the same time, only financial stress followed by recessions (butnot slowdowns) seems to be characterized by a “more exposed”household sector in terms of reliance on external financing(Fig. 13). Indeed, the median household net borrowing ratio (indeviation from trend) at the outset of financial stress episodes issignificantly higher when these episodes are followed by reces-sions than when they are followed by economic slowdown or nodecline in economic activity (Fig. 14).
The results thus far suggest that when the financial cycle turns,s signaled by the onset of stress in financial markets, the likeli-ood that this will be followed by a downturn in economic activity
s higher the larger are the initial financial imbalances—the morexposed firms and households are to a decline in credit and assetrices.
To investigate the role of initial financial imbalances and firmsnd households’ reliance on external funding in explaining the
everity of the ensuing economic downturn more formally, theumulative loss of output in the aftermath of financial stresspisodes is regressed on the run up in credit and assets prices beforehe onset of the financial stress, firms and households’ net borrow-17 Asset prices, namely real house and stock prices, are measured as deviationsrom their respective Hodrick–Prescott trends in line with many studies in the lit-rature, especially those focusing on credit booms—see for example, Cardarelli etl. (2008, 2009) for a recent overview regarding house prices, and Mendoza anderrones (2008) regarding credit booms.18 Net lending (or borrowing, when in deficit) of a sector is a standard nationalccounts concept and can be measured either through incomes and expendituresr through financial transactions. Under the income and expenditure approach, netending is the difference between internally generated funds and outlays on non-nancial capital. A sector’s net lending equals its saving, plus its capital consumptionllowance and net capital transfers from non-residents, less its investment in fixedapital and inventories (the excess of net acquisitions of financial assets by trans-ctions over their net incurrences of liabilities). Net lending (or borrowing) is alsoeferred to as sector surplus (or deficit).

R. Cardarelli et al. / Journal of Financial Stability 7 (2011) 78–97 89
F finani he sa
io
strasT
•
pi
•
3
ig. 13. Selected macrovariables around financial stress episodes (median; start ofn real terms, except for household and non-financial corporate net lending ratios. T
ng ratios at the start of the episodes, and a proxy for the severityf the financial shock, namely, the duration of the stress episode.
It is important to emphasize that the regression analysis pre-ented below is not meant to make causal assertions, but insteado uncover statistical associations in a multivariate context. Theegressions are used to measure conditional correlations—that is, tossess whether some of the relationships discussed above are stilltatistically significant, after controlling for other relevant factors.he main results of the regressions are (Table 3):19
Firms’ net borrowing ratio at the onset of the financial stress
episode enters significantly in almost all specifications, confirm-ing the importance of the link between initial firms’ reliance onexternal credit and the severity of the decline in economic activ-ity.19 Slowdown severity is measured using the cumulative output loss during theeriod that output is below trend, see Table 1 for further details; recession severity
s measured by losses until recovery.
wcebfifids
cial stress episode at t = 0; x-axis as stated). Source: Authors’ calculations. Note: Allmple is constant for all quarters and years.
The household net borrowing ratio at the onset of the finan-cial stress episode is statistically significant when consideredalone, but loses significance when firms’ net borrowing positionis added. In this case, though it continues affecting the sever-ity of the output losses when interacted with the duration ofthe financial episode, suggesting that household position mat-ters especially when the economy is hit by a sustained financial“shock.”
.4. On the linkages between financial stress and downturns
Since this paper tries to address the factors that determinehether or not financial stress is followed by a downturn, a key
hallenge is to determine the origins of the shocks that hit theconomy and that subsequently set off the complex interactions
etween the real and financial sectors. In identifying periods ofnancial stress, which are interpreted as exogenous shocks to thenancial sector, it is useful to ask whether financial stress leads toeeper and more protracted downturns? As inferred from Fig. 11,lowdowns preceded by banking-related financial stress are indeed
90 R. Cardarelli et al. / Journal of Financial Stability 7 (2011) 78–97
F culati
mtt
acrftsfnlactwfi
uFra
tTtt(b
4c
fi
ig. 14. Initial conditions of financial stress episodes (average). Source: Authors’ cal
ore severe than episodes not preceded by financial stress, whilehe differences for recessions are smaller.20 Table 2 elaborates fur-her on these differences and also discusses statistical significance.
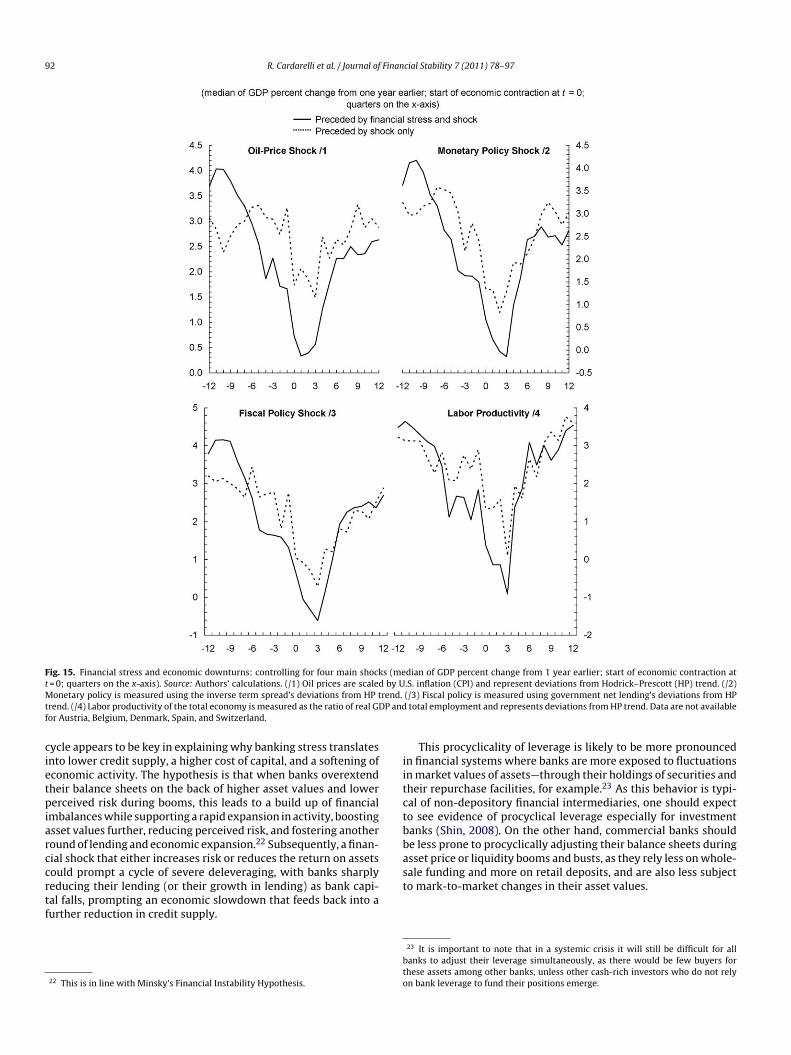
However, the observation that financial sector stress precedesn economic downturn still does not necessarily mean that finan-ial stress has been the key driving factor of subsequently observedeal sector developments: since financial market participants areorward looking, the financial stress may merely be a manifesta-ion of their anticipation of a fundamental deterioration in the realector environment. To address this problem, the paper considersour shocks that could be considered mainly fundamental, exoge-ous deteriorations in the real sector environment: oil price shocks,
abor productivity shocks, and two policy shocks, namely monetarynd fiscal policy. As shown in Fig. 15, any one of these four shocks
ombined with financial stress brings about a more severe down-urn in contrast to just the shock on its own. Reinforcing this point,e find that the largest differences between the series preceded bynancial stress and the shock versus the series only preceded by20 While we do not want to repeat this point too many times, it is important tonderscore that large discrepancies shown in the figures are statistically different.or example, in Fig. 11, the differences between slowdowns preceded by banking-elated financial stress and slowdowns not preceded by financial stress is significantt a minimum of 10 percent for t − 6 to t + 6.
qfif
bafohrc
ons. (/1) Financial stress episodes not followed by slowdowns or recessions.
he shock is statistically significant at the 10 percent level of better.his suggests that financial stress probably has a separately iden-ifiable impact, which could be attributed to, among other things,o financial accelerator mechanisms as discussed in Bernanke et al.1999), Iacoviello (2005), or Kiyotaki and Moore (1997), as well asank capital effects (see, for example, Van den Heuvel, 2002).
. Financial innovation, financial stress, and economicycles
The continued importance of banks in explaining why certainnancial stress episodes are associated with greater output conse-uences leads to the question of why banks remain crucial despitenancial innovation and the emergence of non-bank sources of
unding.Financial innovation could reduce the pivotal role of banks
y providing an alternative channel for firms and households to
ccess financing, one that depends less on the collateral constraintsaced by borrowers and the adverse impact of financial stressesn the cost of capital for banks. However, while the role of banksas evolved over time, their symbiotic relationship with marketsemains an essential feature of financial systems, especially thoseharacterized by a prevalence of arm’s-length financing (see Lall et
R. Cardarelli et al. / Journal of FinanTa
ble
3C
ross
-sec
tion
regr
essi
ons
(th
ero
leof
fin
anci
alst
ress
du
rati
on).
Dep
end
ent
vari
able
:cu
mu
lati
veou
tpu
tlo
ssa
[1]
[2]
[3]
[4]
[5]
[6]
[7]
[8]
[9]
Du
rati
onof
fin
anci
alst
ress
1.32
4(0
.100
)1.
591
(0.1
00)
0.64
1(0
.430
)1.
023
(0.3
30)
0.96
3(0
.300
)1.
377
(0.0
90)
1.03
4(0
.200
)0.
888
(0.0
70)
0.71
1(0
.300
)R
eali
nte
rest
rate
sb0.
890
(0.0
00)
0.80
8(0
.010
)0.
470
0.83
5(0
.010
)0.
877
(0.0
00)
0.87
0(0
.000
)0.
841
(0.0
10)
0.88
7(0
.000
)0.
869
(0.0
10)
Non
-fin
anci
alco
rpor
atio
nn
etbo
rrow
ing
rati
oc2.
000
(0.0
10)
1.75
3(0
.020
)0.
849
(0.3
50)
1.98
6(0
.000
)1.
439
(0.0
70)
Hou
seh
old
net
borr
owin
gra
tioc
1.05
0(0
.100
)0.
480
(0.4
40)
0.66
8(0
.330
)−1
.086
(0.2
20)
−0.8
90(0
.320
)
Rea
lhou
sep
rice
d14
.304
(0.0
10)
Rea
lsto
ckp
rice
d−0
.785
(0.7
20)
Cre
dit
rati
od−1
.090
(0.9
00)
Hou
seh
old
net
borr
owin
gra
tio
×d
ura
tion
0.59
3(0
.040
)0.
561
(0.0
40)
Non
-fin
anci
alco
rpor
atio
nn
etbo
rrow
ing
rati
o×
du
rati
on0.
229
(0.4
30)
0.13
6(0
.480
)
Con
stan
t−2
.014
(0.4
50)
−0.8
03(0
.790
)2.
076
(0.3
90)
0.80
9(0
.740
)0.
482
(0.8
60)
−1.8
77(0
.500
)−0
.727
(0.7
80)
−1.1
61(0
.640
)−0
.519
(0.8
50)
Obs
erva
tion
s42
4052
5252
4040
4040
Ad
just
edR
-squ
ared
0.41
80.
287
0.25
40.
128
0.12
60.
418
0.42
00.
493
0.48
5
Sour
ce:A
uth
ors’
calc
ula
tion
s.N
otes
:Rob
ust
p-va
lues
inp
aren
thes
es.
aD
epen
den
tva
riab
leis
cum
ula
tive
outp
ut
loss
inep
isod
esof
fin
anci
alst
ress
foll
owed
bysl
owd
own
sor
rece
ssio
ns.
bA
vera
geof
real
inte
rest
rate
sin
six
quar
ters
befo
reth
efi
nan
cial
stre
ss.
cN
etbo
rrow
ing
rati
oson
eye
arbe
fore
the
fin
anci
alst
ress
(dev
iati
onfr
omtr
end
).d
Cu
mu
lati
vep
erce
nt
dev
iati
onfr
omtr
end
over
six
quar
ters
befo
reth
efi
nan
cial
stre
ss.
as
4
avifobds
ptanatiahlptt
prThfit
tt(tfifibn
ctsr
4
ila
avcci
cial Stability 7 (2011) 78–97 91
l., 2006).21 As a result, banking distress is likely to affect non-bankources of financing as well.
.1. The arm’s-length index
Before continuing, it will be useful to discuss key differencesmong financial systems in advanced economies. While there arearious ways of classifying financial systems, the approach usedn this paper is based on previous work (Lall et al., 2006) thatocuses on the degree to which financial transactions are conductedn the basis of a direct (and generally longer-term) relationshipetween two entities, usually a bank and a customer, or are con-ucted at arm’s length—where entities typically do not have anypecial knowledge about each other that is not available publicly.
A more arm’s-length financial system is highly dependent onublicly available information and the enforcement of contractshrough formal and standard legal mechanisms and procedurespplicable to unrelated parties. There is a strong role for price sig-als and open competition among lenders. On the other hand, inmore relationship-based system, transactions between two par-
ies – such as a bank and a corporate borrower – primarily rely onnformation the lender has about the borrower that is not avail-ble publicly. Mechanisms for enforcement of contracts rely moreeavily on the lender’s direct influence on the borrower and/or the
ender’s monopolistic power in the market. In practice, no system isurely relationship-based or purely arm’s length, and even systemshat are more reliant on arm’s-length transactions do not precludehe use of relationships in certain types of transactions.
To quantify the differences between financial systems, thisaper uses the index developed by Lall et al. (2006), which summa-izes the extent of the arm’s-length content of a financial system.he index ranges between zero and one for each country, with aigher value representing a greater arm’s-length content in thenancial system. The overall index is derived from three subindiceshat seek to capture key elements of a financial system.
Briefly stated, these three subindices cover: (1) the degree ofraditional bank intermediation, which is the most obvious manifes-ation of a high degree of relationship-based financial transactions,2) the degree to which new financial intermediation has developedo provide an alternative non-bank channel for financing and/or toacilitate the transformation of traditional relationships betweenntermediaries and final customers, and (3) the role played bynancial markets, which have a symbiotic relationship with non-ank financial intermediation and the expansion of banks intoon-traditional activities described above.
While further details are relegated to Lall et al. (2006), one con-lusion their study finds is that the evolution of the index suggestshat despite an increase in the arm’s-length content of financialystems over time in advanced economies, important differencesemain across countries.
.2. Financial systems and leverage
To explain the continuing importance of banks, it is reveal-ng to look in more detail at the procyclical behavior of bankeverage around financial cycles. In particular, how banks man-ge their leverage during upturns and downturns in the financial
21 Banks increasingly depend on market-based funding sources to finance theirssets (such as through their off-balance sheet commercial paper programs). Con-ersely, investment and now increasingly commercial banks also remain at theenter of the originate-to-distribute model of securitized financing, and provideredit to hedge funds and other leveraged intermediaries through repurchase facil-ties to invest in securities markets.
92 R. Cardarelli et al. / Journal of Financial Stability 7 (2011) 78–97
Fig. 15. Financial stress and economic downturns: controlling for four main shocks (median of GDP percent change from 1 year earlier; start of economic contraction att by UM rend.t P andf
cietpiarccrtf
iitctbbasset price or liquidity booms and busts, as they rely less on whole-sale funding and more on retail deposits, and are also less subject
= 0; quarters on the x-axis). Source: Authors’ calculations. (/1) Oil prices are scaledonetary policy is measured using the inverse term spread’s deviations from HP t
rend. (/4) Labor productivity of the total economy is measured as the ratio of real GDor Austria, Belgium, Denmark, Spain, and Switzerland.
ycle appears to be key in explaining why banking stress translatesnto lower credit supply, a higher cost of capital, and a softening ofconomic activity. The hypothesis is that when banks overextendheir balance sheets on the back of higher asset values and lowererceived risk during booms, this leads to a build up of financial
mbalances while supporting a rapid expansion in activity, boostingsset values further, reducing perceived risk, and fostering anotheround of lending and economic expansion.22 Subsequently, a finan-ial shock that either increases risk or reduces the return on assetsould prompt a cycle of severe deleveraging, with banks sharply
educing their lending (or their growth in lending) as bank capi-al falls, prompting an economic slowdown that feeds back into aurther reduction in credit supply.22 This is in line with Minsky’s Financial Instability Hypothesis.
t
bto
.S. inflation (CPI) and represent deviations from Hodrick–Prescott (HP) trend. (/2)(/3) Fiscal policy is measured using government net lending’s deviations from HPtotal employment and represents deviations from HP trend. Data are not available
This procyclicality of leverage is likely to be more pronouncedn financial systems where banks are more exposed to fluctuationsn market values of assets—through their holdings of securities andheir repurchase facilities, for example.23 As this behavior is typi-al of non-depository financial intermediaries, one should expecto see evidence of procyclical leverage especially for investmentanks (Shin, 2008). On the other hand, commercial banks shoulde less prone to procyclically adjusting their balance sheets during
o mark-to-market changes in their asset values.
23 It is important to note that in a systemic crisis it will still be difficult for allanks to adjust their leverage simultaneously, as there would be few buyers forhese assets among other banks, unless other cash-rich investors who do not relyn bank leverage to fund their positions emerge.

R. Cardarelli et al. / Journal of Financial Stability 7 (2011) 78–97 93
F cent)( total a
aetmdiscittfibMc
tB
r(
lssyljOb
Moreover, in recessions preceded by financial stress, the lever-
ig. 16. The procyclicality of leverage in financial institutions (annual change, permedian) regressions, of asset growth over leverage growth. Leverage is defined as
Evidence from bank balance sheet data confirms that the lever-ge of investment banks tends to be procyclical, with banksxpending their leverage at the same time as they are expandingheir assets (Fig. 16).24 The evidence on procyclicality of com-
ercial banks – that is, banks that rely much more on retaileposits and whose main activities consist in making long-term,
lliquid loans – is less uniform (Fig. 16). However, the evidenceuggests commercial banks operating in more arm’s-length finan-ial systems, that is, those where a greater share of financialntermediation relies on financial markets rather than on tradi-ional relationship-based (and bank dominated) activities, alsoend to be more procyclical (Fig. 17). Thus, more arm’s-length
nancial systems are associated with overall more procyclicalank behavior, and may be more vulnerable to banking stress.oreover, as a proportion of all cases of banking-related finan-ial stress, the share of more arm’s-length financial systems has
24 Leverage is defined as total assets over capital and reserves (using end-yearotals) as indicated in the OECD’s Bank Profitability Statistics Income Statement andalance Sheet tables. See also Adrian and Shin (2007), Adrian et al. (2008).
asf
dea
. Source: Authors’ calculations. Note: ˇ and (pseudo-) R2 values are from quantilessets over capital and reserves (end-year totals).
emained about equal to that of more relationship-based systemsTable 1).
Indeed, although the duration of recessions is broadly simi-ar across both types of financial systems, recessions tend to beomewhat deeper in economies with more arm’s-length financialystems (Fig. 18). The difference between growth rates in the firstear after financial stress is statistically significant at the 10 percentevel. This implies that more arm’s-length systems may be sub-ect to sharper contractions in activity following financial stress.ne possible explanation could be that the leverage of a country’sanking system is more procyclical in arm’s-length systems.
ge of banks in more arm’s-length systems appears to fall moreharply than in other types of financial systems, albeit startingrom a lower base (Fig. 19).25 This casts doubt on the presump-
25 It may be useful to point out that according the OECD Bank Profitability Statisticsatabase, on average, over 1980–2007 German banks had a much higher assets-to-quity ratio than the United States (the difference is quite sizeable at a ratio of 26gainst that of 13).

94 R. Cardarelli et al. / Journal of Financial Stability 7 (2011) 78–97
Fc
tfiabnisle
fiaao
Fs
Fs
ri2twtraIrs
5
te
ig. 17. Procyclical leverage and arm’s-length financial systems. Source: Authors’alculations.
ion that these systems are more likely to soften the blow fromnancial stress driven downturns of the economy thanks to thevailability of the twin engines for financial intermediation (bothanks and markets). However, contrasting experiences with eco-omic cycles may also reflect divergences in other areas, notably
n the degree of flexibility in labor and product markets and theocial welfare systems, between economies characterized by arm’sength as opposed to relationship-based financial systems (see Lallt al., 2006).
It is important to emphasize that while more arm’s-length
nancial systems are associated with sharper contractions inctivity following banking stress, this does not imply that theyre inherently more prone to such stress (see Table 1). More-ver, arm’s-length financial systems offer several advantages overig. 18. Arm’s-length financial systems and GDP growth (median; start of financialtress episode at t = 0; years on the x-axis). Source: Authors’ calculations.
3e
pstletla(ilhIt
wpbwbics
ig. 19. Arm’s-length financial systems and bank leverage (median; start of financialtress episode at t = 0; years on the x-axis). Source: Authors’ calculations.
elationship-based systems in terms of the reallocation of resourcesn response to changing economic opportunities (see Lall et al.,006). However, as the current crisis underscores, the trendowards greater securitization in more arm’s-length systems –hich was thought to permit portfolio diversification to overcome
he cost of monitoring idiosyncratic risk inherent in traditionalelationship-based systems – does not eliminate the need for banksnd markets to independently assess the risk of their exposures.ndeed, lack of information about the value and risks of many secu-itized products and associated losses appears to have played aignificant role in amplifying the current crisis.
. Conclusions
Based on an index of financial stress, this paper has analyzedhe experience of episodes of stress in banking, securities and for-ign exchange markets, in 17 advanced economies over the past0 years. The focus is on assessing the factors that determine thextent to which financial stress has affected economic activity.
This paper finds that financial stress is often, but not always arecursor to an economic slowdown or recession. A rapid expan-ion of credit, a run-up in house prices, and large borrowings byhe corporate and household sectors all contribute to a higher like-ihood that stress in the financial system will lead to more severeconomic downturns. More specifically, when the financial cycleurns, as signaled by the onset of stress in financial markets, theikelihood that this will be followed by a downturn in economicctivity is higher the larger are the initial financial imbalancesthat is, the more exposed firms and households are to a declinen credit and asset prices). Banking stress in particular tends toead to greater effects on activity, despite financial innovation thatas increased the role of securities markets in many countries.
n fact, recessions associated with banking-related financial stressake about five quarters to recover.
Why are banking-related financial stress episodes associatedith the most severe downturns? This can be explained by therocyclicality of leverage, especially among investment banks,ut also commercial banks in many countries. Indeed, countries
hose financial systems are dominated by more arm’s-length-ased transactions, as opposed to traditional relationship-basedntermediation, tend to exhibit higher procyclical leverage, indi-ating that the amplifying role of financial systems in propagatinghocks is more pronounced. As a result, when shocks affect core

Finan
fiwseai
cstmvo
ttona
A
LrAvn((
A
A
mos
A
•
•
•
A
•
•
•
A
•
cid1acGw
stoepwsrcbt
A
arbooTa
•
•
•
P
wgC
R. Cardarelli et al. / Journal of
nancial institutions, the downturns that follow tend to be some-hat deeper in more arm’s-length financial systems. However, it
hould be emphasized that arm’s-length systems are not in gen-ral more prone to such shocks, and that such systems are betterble to reallocate resources across various sectors of the economyn response to changing economic opportunities.
Given the role of build up in balance sheet vulnerabilities asso-iated with rising asset prices and credit in explaining why sometress periods lead to downturns, policymakers need to be alert tohese factors during the run-up of the financial cycle. Prudential
easures as well as monetary policy should pay due regard to theulnerabilities that may build up and that eventually lead to greaterutput losses if the financial system is hit by a severe shock.
In the event of significant financial stress that affects the core ofhe banking system, the early recognition of losses and measureso support the speedy restoration of capital can help reduce theutput consequences of financial crises. At the same time, attentioneeds to be paid to the longer-term moral hazard implications ofny strategy to restore financial stability.
cknowledgements
We would like to thank Charles Collyns, Joerg Decressin, Timane, Hyun Song Shin, Iftekhar Hasan (editor), and an anonymouseferee for helpful comments and suggestions. We also thank Gavinsdorian and Angela Espiritu for excellent research assistance. Theiews expressed in this paper are those of the authors and do notecessarily represent those of the International Monetary FundIMF), IMF policy, or the Central Bank of the Republic of TurkeyCBT).
ppendix A. Data and methodology
.1. The financial stress index
This section of the appendix describes the components and theethodology used to construct the FSI, with a particular emphasis
n data sources. The FSI is an equal-variance-weighted average ofeven variables, grouped into three categories.
.2. Banking sector
Banking sector ˇ: covariance of the year-on-year percentagechange of a country’s banking-sector equity index and its overallstock market index, divided by the variance of the year-on-yearpercentage change of the overall stock market index. Source:DataStream, Haver Analytics, and the Organization for EconomicCooperation and Development (OECD).TED spread: 3-month LIBOR or commercial paper rate minus thegovernment short-term rate. Source: Haver Analytics.Inverted term spread: government short-term rate minusgovernment long-term rate. Source: DataStream and Haver Ana-lytics.
.3. Securities market
Corporate spread: corporate bond yield minus long-term govern-
ment bond yield. Source: DataStream and Haver Analytics.Stock decline: stock indext−1 minus stock indext, then divided bythe stock indext−1. Source: OECD.Time-varying stock volatility: GARCH(1,1) volatility of overallstock market index monthly return. Source: OECD.o
tlt
cial Stability 7 (2011) 78–97 95
.4. Foreign exchange
Time-varying real effective exchange rate volatility: GARCH(1,1)volatility of real effective exchange rate monthly percent change.Source: IMF.
All components are originally in monthly frequency. The index isonstructed by taking the average of the components after adjust-ng for the sample mean and standardizing by the sample standardeviation. Then, the index is rebased so that it ranges from 0 to00. Finally, it is converted into quarterly frequency by taking theverage of the monthly data. The FSI is available for 17 advancedountries from 1980. Data on long-term corporate bond yield forreece, Ireland, New Zealand, and Portugal were not available andere therefore excluded from the sample.
Episodes of financial stress are identified when the index is onetandard deviation above its trend. Episodes that are only two quar-ers apart are considered one episode. To classify if an episodef financial stress is either due to banking, securities, or foreignxchange stress, we look at the change in the FSI from the quarterrior to the start of the episode to the maximum value of the FSIithin the episode. If majority of the increase is due to the banking-
ector components, then the FSI is classified as banking. The sameule applies if the change is mostly due to the securities marketsomponents or the foreign exchange component. Additionally, ifanking contributes at least one-third of the change in the FSI, thenhe episode is also classified as “banking-related”.
.5. The cost of capital
The cost of capital used in the paper is defined as a weightedverage of the real cost of bank loans, the real cost of debt, andeal cost of equity, using as weights the relative shares of equity,onds, and loans in non-financial corporate liabilities. This is basedn the calculation of cost of capital as outlined in Box 4 on page 37f the March 2005 European Central Bank (ECB) Monthly Bulletin.he real cost of bank loans, real cost of debt, and real cost of equityre derived as follows:
Real cost of bank loans: bank lending rates minus 1-year-forwardConsensus inflation forecast. Sources: IFS, ECB, and ConsensusForecasts.Real cost of debt: corporate bond yield minus 1-year-forward Con-sensus inflation forecast. Sources: Thomson Datastream, HaverAnalytics, and Consensus Forecasts.Real cost of equity: the real cost of equity is on extension of astandard dividend discount model and derived using a modelspecified in Box 2 on page 76 of the November 2004 ECB MonthlyBulletin. Using available data for the other variables, the real costof equity, ht, can be calculated using the following equation:
t = Dt[(1 + g) + 8(gIBESt − g)]
ht − g
here Pt = real stock price, Dt = the current level of real dividends,IBES = I/B/E/S long-term earnings-per-share growth forecast minusonsensus long-term inflation forecast, g = long-term growth rate
f real corporate earnings, assumed constant at 2.5 percent.The overall cost of capital is calculated as a weighted average ofhese three components with the weights defined (respectively) asoans, debt, and equity as shares of non-financial corporate liabili-ies from the OECD national accounts data.

9 Finan
A
oo(etb&
A
•
•
wwss
A
•
•
•
A
wiiaatapt
(
R
A
A
A
B
B
B
B
B
B
C
C
C
C
C
D
D
E
E
E
F
F
F
G
G
G
H
H
H
I
I
K
K
6 R. Cardarelli et al. / Journal of
.6. Bankscope data
Two datasets were constructed using annual bank-level databtained from the Bankscope database.26 The first dataset includednly investment banks as classified by the Bankscope database“Investment Bank/Securities House”). The second dataset, refer-nced in the paper as commercial banks, included banks withhe following Bankscope classifications: commercial bank, savingsank, cooperative bank, real estate/mortgage bank, and medium-long-term credit bank.
.7. Sample of banks
Investment banks: the sample of banks contained banks that werein the top 50 investment banks globally by total assets in one ormore years from 1988 to 2007.Commercial banks: the sample of banks consisted of those banksthat were in the top 10 banks (top 30 banks for the United King-dom and Japan, top 50 banks for the United States) by total assetsfor each country in one or more years from 1988 to 2007. Alsoincluded were any banks that were acquired by or that mergedwith a top 10 bank. (See below for an explanation of accountingfor mergers and acquisition.)
The number of commercial banks per country used in the sampleas chosen to provide a representative sample of banking activityithin each country. The following table summarizes the average
hare of total bank assets (as reported by OECD) per year repre-ented by the banks in the sample:
.8. Consolidated versus unconsolidated balance sheets
Investment banks: data from consolidated statements were usedfor investment banks. If consolidated data were unavailable, datafrom unconsolidated statements were used.Commercial banks: in order to isolate as much as possible thedomestic activities of commercial banks, unconsolidated bankdata were used for commercial banks in the sample. If uncon-solidated statements were unavailable, data from consolidateddata were used.Data from multiple statements for the same bank were combinedto form a single set of bank-level data if the statement types (con-solidated or unconsolidated) were the same. In addition, the datawere cleaned (by country, in the case of commercial banks) byexcluding observations where the growth rate of total assets wasabove the 95th percentile or below the 5th percentile.
.9. Mergers and acquisitions
For consistency, banks that were acquired by or that mergedith banks included in the original sample set were also included
n the dataset. For years prior to a merger or acquisition, the banksnvolved were treated as separate banks; for years subsequent to
merger or acquisition, the bank resulting from the merger orcquisition was naturally a single bank in the database. In ordero calculate level changes or growth rates of a bank in the year of
merger or acquisition, a data point was constructed for the yearrior to the merger or acquisition by summing the data values ofhe banks involved in the merger or acquisition.26 BankScope database published by Bureau van Dijk Electronic PublishingBvDEP). www.bvdep.com.
K
K
K
L
cial Stability 7 (2011) 78–97
eferences
ckermann, J., 2008. The subprime crisis and its consequences. Journal of FinancialStability 4 (December (4)), 329–337.
drian, T., Shin, H.S., 2007. Liquidity and leverage. Federal Reserve Bank of New YorkStaff Reports, No. 328.
drian, T., Shin, H.S., 2008. Financial intermediary leverage and value at risk. Work-ing Paper, Federal Reserve Bank of New York and Princeton University.
ernanke, B., Lown, C., 1991. The credit crunch. Brookings Papers on EconomicActivity 22 (1991–2), 205–248.
ernanke, B., Gertler, M., 1995. Inside the black box: the credit channel of monetarypolicy transmission. Journal of Economic Perspectives 9 (Autumn), 27–48.
ernanke, B., Gertler, M., Gilchrist, S., 1999. The financial accelerator in a quantita-tive business cycle framework. Handbook of Macroeconomics, vol. 1C. Elsevier,Amsterdam, pp. 1341–1393.
ollerslev, T., Chou, R.Y., Kroner, K.F., 1992. ARCH modeling in finance: a review ofthe theory and empirical evidence. Journal of Econometrics 52 (1–2), 5–59.
ordo, M.D., Jeanne, O., 2002. Boom-busts in asset prices, economic instability, andmonetary policy. NBER Working Papers 8966, National Bureau of EconomicResearch, Cambridge, MA.
orio, C., 2007. Change and constancy in the financial system: implications for finan-cial distress and policy. BIS Working Papers, No. 237, October.
aprio, G., Klingebiel, D., 2006. Episodes of Systematic and Borderline FinancialCrises. World Bank, Washington.
ardarelli, R., Igan, D., Rebucci, A., 2008. World economic outlook, April 2008: thechanging housing cycle and the implications for monetary policy. In: WorldEconomic and Financial Surveys. International Monetary Fund, Washington.
ardarelli, R., Elekdag, S., Lall, S., 2009. Financial stress, downturns, and recoveries.IMF Working Paper 09/100, International Monetary Fund, Washington.
laessens, S., Kose, M.A., Terrones, M.E., 2009. What happens during recessions,crunches and busts? Economic Policy 60 (October), 655–700.
onover, W.J., 1980. Practical Nonparametric Statistics, 2nd ed. John Wiley and Sons,New York.
emirguc-Kunt, A., Detragiache, E., Gupta, P., 2006. Inside the crisis: an empiri-cal analysis of banking systems in distress. Journal of International Money andFinance 25, 702–718.
iamond, D.W., Rajan, R.G., 2000. A theory of bank capital. Journal of Finance 55(December (6)), 2431–2465.
dison, H., 2003. Do indicators of financial crises work? An evaluation of an earlywarning system. International Journal of Finance and Economics 8, 11–53.
dwards, S., 2007, On current account surpluses and the correction of global imbal-ances. NBER Working Paper No. 12904, National Bureau of Economic Research,Cambridge, MA.
ichengreen, B., Bordo, M.D., 2002. Crises now and then: what lessons from the lastera of financial globalization. NBER Working Paper No. 8716, National Bureauof Economic Research, Cambridge, MA.
ama, E.F., Fisher, L., Jensen, M.C., Roll, R., 1969. The adjustment of stock prices tonew information. International Economic Review 10 (February (1)), 1–21.
rankel, J., Rose, A., 1996. Currency crashes in emerging markets: an empirical treat-ment. Journal of International Economics 41 (3–4), 351–366.
reund, C., 2005. Current account adjustment in industrial countries. Journal ofInternational Money and Finance 24 (December (8)), 1278–1298.
ambacorta, L., Altunbas, Y., Marques-Ibanez, D., 2007. Securitization and the banklending channel. Working Paper Series, No. 838, European Central Bank, Frank-furt.
ibbons, M.R., 1987. The interrelations of finance and economics: empirical per-spectives. American Economic Review Papers and Proceedings 77 (2), 35–41.
oodhart, C., 1996. An incentive structure for financial regulation. LSE FinancialMarkets Group Special Paper Series, London School of Economics and PoliticalScience, United Kingdom, No. 88, pp. 1–22 (July).
akkio, C.S., Keeton, W.R., 2009. Financial stress: what is it, how can it be measured,and why does it matter? Economic Review, Federal Reserve Bank of Kansas City(Second Quarter), 5–50.
arding, D., Pagan, A., 2002. Dissecting the cycle: a methodological investigation.Journal of Monetary Economics 49 (March (2)), 365–381.
ildebrand, P.M., 2008. The sub-prime crisis: a central banker’s perspective. Journalof Financial Stability 4 (December (4)), 313–320.
acoviello, M., 2005. House prices, borrowing constraints, and monetary policy inthe business cycle. American Economic Review 95 (June), 739–764.
lling, M., Liu, Y., 2006. Measuring financial stress in a developed country: an appli-cation to Canada. Journal of Financial Stability 2 (October (3)), 243–265.
aminsky, G., Reinhart, C., 1999. The twin crises: the causes of banking and balance-of-payments problems. American Economic Review 89 (June (3)), 473–500.
ashyap, A., Stein, J., 1995. The impact of monetary policy on bank balance sheets.Carnegie-Rochester Conference Series on Public Policy 42 (June), 151–195.
ashyap, A., Rajan, R., Stein, J., 2008. Rethinking capital regulation. In: Paper Pre-pared for the Federal Reserve Bank of Kansas City Symposium at Jackson Hole.
indleberger, C., Aliber, R., Solow, R., 2005. Manias, Panics, and Crashes: A History
of Financial Crises. Wiley Investment Classics.iyotaki, N., Moore, J., 1997. Credit cycles. Journal of Political Economy 105 (April),211–248.
all, S., Cardarelli, R., Tytell, I., 2006. World Economic Outlook, September 2006: HowDo Financial Systems Affect Economic Cycles? World Economic and FinancialSurveys. International Monetary Fund, Washington.

Finan
L
M
M
M
M
R
R
S
S
VEconomic Policy Review 8 (May (1)), 259–265.
R. Cardarelli et al. / Journal of
all, S., Cardarelli, R., Elekdag, S., 2008. World Economic Outlook, October 2008:Financial Stress and Economic Downturns. World Economic and Financial Sur-veys. International Monetary Fund, Washington.
ann, H.B., Whitney, D.R., 1947. On a test of whether one of two random variables isstochastically larger than the other. Annals of Mathematical Statistics 18, 50–60.
endoza, E., Terrones, M., 2008. An anatomy of credit booms: evidence from macroaggregates and micro data. NBER Working Paper No. 14049, National Bureau ofEconomic Research, Cambridge, MA.
insky, H., 1992. The financial instability hypothesis. The Jerome Levy Economics
Institute Working Paper, No. 74 (May).orsink, J., Helbling, T., Tokarick, S., 2002. World Economic Outlook, April 2002:Recessions and Recoveries, World Economic and Financial Surveys. Interna-tional Monetary Fund, Washington.
ajan, R., Zingales, L., 2003. Banks and markets: the changing character of Europeanfinance. CEPR Discussion Papers, No. 3865.
W
W
cial Stability 7 (2011) 78–97 97
einhart, C., Rogoff, K., 2008. This time is different: a panoramic view of eightcenturies of financial crises. NBER Working Papers 13882, National Bureau ofEconomic Research, Inc.
hiller, R.J., 1999. Measuring bubble expectations and investor confidence. NBERWorking Papers 7008, National Bureau of Economic Research, Inc.
hin, H.S., 2008. Reflections on modern bank runs: a case study of northern rock.Working Paper, Princeton University.
an den Heuvel, S., 2002. Does bank capital matter for monetary transmission?
hite, W.R., 2008. Past financial crises, the current financial turmoil, and the needfor a new macrofinancial stability framework. Journal of Financial Stability 4(December (4)), 307–312.
ilcoxon, F., 1945. Individual comparisons by ranking methods. Biometrics Bulletin1, 80–83.